Article

Ammonia Optical Sensing by Microring Resonators

by
Vittorio M. N. Passaro
1,*,
Francesco Dell’Olio
1 and
Francesco De Leonardis
2
1
Photonics Research Group, Dipartimento di Elettrotecnica ed Elettronica, Politecnico di Bari, via Edoardo Orabona n. 4, 70125 Bari, Italy
2
Photonics Research Group, Dipartimento di Ingegneria dell’Ambiente e per lo Sviluppo Sostenibile, Politecnico di Bari, viale del Turismo n. 8, 74100 Taranto, Italy
*
Author to whom correspondence should be addressed.
Sensors 2007, 7(11), 2741-2749; https://doi.org/10.3390/s7112741
Submission received: 22 October 2007 / Accepted: 14 November 2007 / Published: 15 November 2007

Abstract

:
A very compact (device area around 40 μm2) optical ammonia sensor based on a microring resonator is presented in this work. Silicon-on-insulator technology is used in sensor design and a dye doped polymer is adopted as sensing material. The sensor exhibits a very good linearity and a minimum detectable refractive index shift of sensing material as low as 8×10⁻⁵, with a detection limit around 4 ‰.

1. Introduction

Ammonia (NH3) concentration measurement has a great importance in many scientific and technological areas. In environmental monitoring, automotive and chemical industry, electronic and optical ammonia sensors are widely used [1]. Recently the possibility to diagnose by ammonia sensing certain diseases, as ulcer or kidney disorder, has been proved. For example, NH3 concentration level measurement in exhaled air is a fast and non-invasive method to detect the presence of Helicobacter pylori bacterial stomach infection [2].
The most frequently used technique in commercial ammonia detectors is based on SnO2[3] and MoO3[4] semiconductor thin films. These sensors are mainly used in combustion gas detectors or gas alarm systems, but they show some limitations in reproducibility, stability, sensitivity and selectivity. Other approaches to NH3 sensing are based on potentiometer electrodes [5], infrared gas analyzers [6] and conducting polymers [7].
Different kinds of optical ammonia concentration sensors, based on monitoring the absorption or fluorescence characteristics of sensing films deposited onto an optical fiber, have been reported [8-9]. An integrated optical ammonia sensor based on a Y-junction has been reported in [10]. This sensor employs a deposited sensing film whose absorbance (dependent on ammonia concentration in the surrounding ambient) is continuously measured and exhibits a detection limit around 1ppm. Ammonia concentration estimation by this sensor implies an optical power differential measure at the output of the two Y-junction arms.
In recent years, integrated optical sensors have attracted considerable attention because of their immunity to electromagnetic interference, high sensitivity, good compactness and robustness and high compatibility with fiber networks [11]. A great variety of guided-wave optical sensors has been proposed, such as those based on directional couplers [12], Mach–Zehnder interferometers [13], grating-assisted couplers [14], and optical microcavities [15].
In particular, optical microring resonators, widely used in add–drop filters, optical switches, ring lasers and WDM multiplexers, are showing very attractive features for sensing applications, permitting to realize highly sensitive immunochemical optical biosensors [16-18]. In this paper we design, optimize and 3D simulate an integrated optical microring resonator-based ammonia sensor. Device sensitivity dependence on waveguide optical and geometrical parameters is investigated. Sensor detection limit is also analyzed.

2. Sensing Principle

The architecture of a very compact microring resonator-based sensor in Silicon on Insulator (SOI) technology is sketched in Figure 1(a). A ridge structure has been adopted as waveguide (this kind of sub-micrometer guiding structure is also indicated as silicon photonic wire), as in Figure 1(b), and Polymethylmethacrylate (PMMA) doped with Bromocresol Purple (BCP) has been used as cladding layer.
Optical absorption changes of PMMA-BCP system, due to interaction with ammonia, has been proved [19] either when PMMA-BCP is exposed to dry ammonia (in this case PMMA-BCP sample is put in a chamber filled by ammonia diluted with pure nitrogen to a molar concentration of 5%) or when PMMA-BCP is exposed to a vapor of conventional medical ammonia spirit (65% alcohol). This optical absorption change produces a shift in polymer refractive index at wavelengths outside the material absorption band, according with the Kramers-Krönig relationship:
Δ n PMMA BCP ( λ ) = c π p 0 Δ α PMMA BCP ( Λ ) λ 2 Λ 2 d Λ
where Δn is the PMMA-BCP refractive index change, λ is the wavelength at which Δn is calculated, c is the light speed in vacuum, p stands for the principal value of the integral, and Δα is the PMMA-BCP absorption coefficient change.
Since PMMA-BCP absorption band extends from 350 nm to 450 nm, then polymer interaction with NH3 causes a refractive index shift at wavelengths around 1550 nm, given by [19]:
Δ n PMMA BCP ( λ , C ) = F ( λ , λ 0 ) ε ( λ 0 ) v t S b p C
where λ0 is the absorption band central wavelength, F(λ, λ0) is the proportionality factor between absorption and index changes, vt is the total number of BCP molecules per PMMA unit of volume, Sb is the reagent-analyte binding constant, p is the polymer permeability factor and C is the ammonia ambient concentration.
Thus, a PMMA-BCP refractive index change determinates an effective index N change of mode propagating around the ring resonator. Microring resonant wavelength λR is related to effective index by the following relation:
λ R = N L m
where m is the resonant mode order (m is an integer number) and L is the ring resonator length.
Effective index change implies a microring resonant wavelength shift (as schematically reported in Figure 2). Measuring the resonance wavelength shift around 1550 nm, it is possible to estimate the ammonia concentration in gaseous medium surrounding the sensor. The adoption of wavelengths around 1550 nm for optical sensing allows the additional advantage to use standard telecom equipments as lasers, photodetectors and so on.

3. Device Sensitivity

The device sensitivity is one of the most important and critical aspect in sensor design and its theoretical estimation depends on a number of device geometrical and physical parameters. Sensitivity of the designed sensor can be expressed as:
Δ λ R Δ n c = Δ λ R Δ N Δ N Δ n c
where λR is around 1550 nm and whose shift is measured to estimate the ammonia concentration, N is the ring mode effective index and nc is the cladding layer refractive index.
Variation rate of N (as ΔN/Δnc) has been numerically estimated by a commercial mode solver [20] for bent waveguides based on Alternating Direction Implicit (ADI) method, by varying nc in a narrow range and observing the corresponding shift of N. The resonance wavelength incremental change (as a ratio between ΔλR and ΔN) has been analytically estimated using the approach proposed in [21], obtaining the following formula:
Δ λ R Δ N = [ N ( n c 0 , λ R ) λ R N λ | λ = λ R ] 1
where nc0 is the PMMA-BMC refractive index before any interaction with ammonia. In equation (5), N(nc0, λr) and its derivative with respect to λ have been numerically estimated by ADI method. By eq. (5), it is possible to obtain the relationship:
Δ λ R Δ n c = Δ N Δ n c [ N ( n c 0 , λ R ) λ R N λ | λ = λ R ] 1
useful to make accurate estimations of the proposed sensor sensitivity. Thus, we have investigated the device sensitivity dependence on ridge height (h) and width (w), for different values of microring resonator radius (R) (see Figure 3 and 4). It can be observed the sensitivity as nearly independent from R, whereas it exhibits a quadratic dependence on w and h. Moreover, it depends more strongly on ridge height than on its width.
To find optical and geometrical parameters affecting the device sensitivity, we have investigated how all quantities in formula (6) are influenced by waveguide electromagnetic properties. According with variational theorem for dielectric waveguides, we can write:
Δ N Δ n c = 2 n c 0 η 0 P cladding | E | 2 dxdy
N λ | λ = λ R = 1 λ R P [ n 2 ( x , y ) η 0 1 | E | 2 + η 0 | H | 2 dxdy ]
where P is the integral of time-averaged Poynting vector component along the propagation direction z,, n(x,y) is the waveguide refractive index profile, and η0 is the free space impedance.
By using (6), (7) and (8), the device sensitivity can be written as:
Δ λ R Δ n c 2 n c 0 λ R cladding | E | 2 dxdy η 0 P N ( n c 0 , λ R ) + n core 2 core | E | 2 dxdy
where ncore is the core layer refractive index and some additive contributions at denominator can be neglected. Relationship (9) shows how sensitivity strongly depends on the index contrast between cladding and core layers. By decreasing this contrast, it is possible to improve the sensitivity, but this strategy implies an increase of microring radius to avoid too large bend radiation losses.

4. Sensor Design and Simulation

In our design we have chosen a 300 nm high and 250 nm width ridge waveguide and a microring radius of 3 μm. The optical sensor has been 3D simulated using Finite-Difference Time-Domain (FDTD) technique [22]. Waveguide modal behavior has been investigated and a single-mode condition has been satisfied (see profile of quasi-TM single mode in Figure 5).
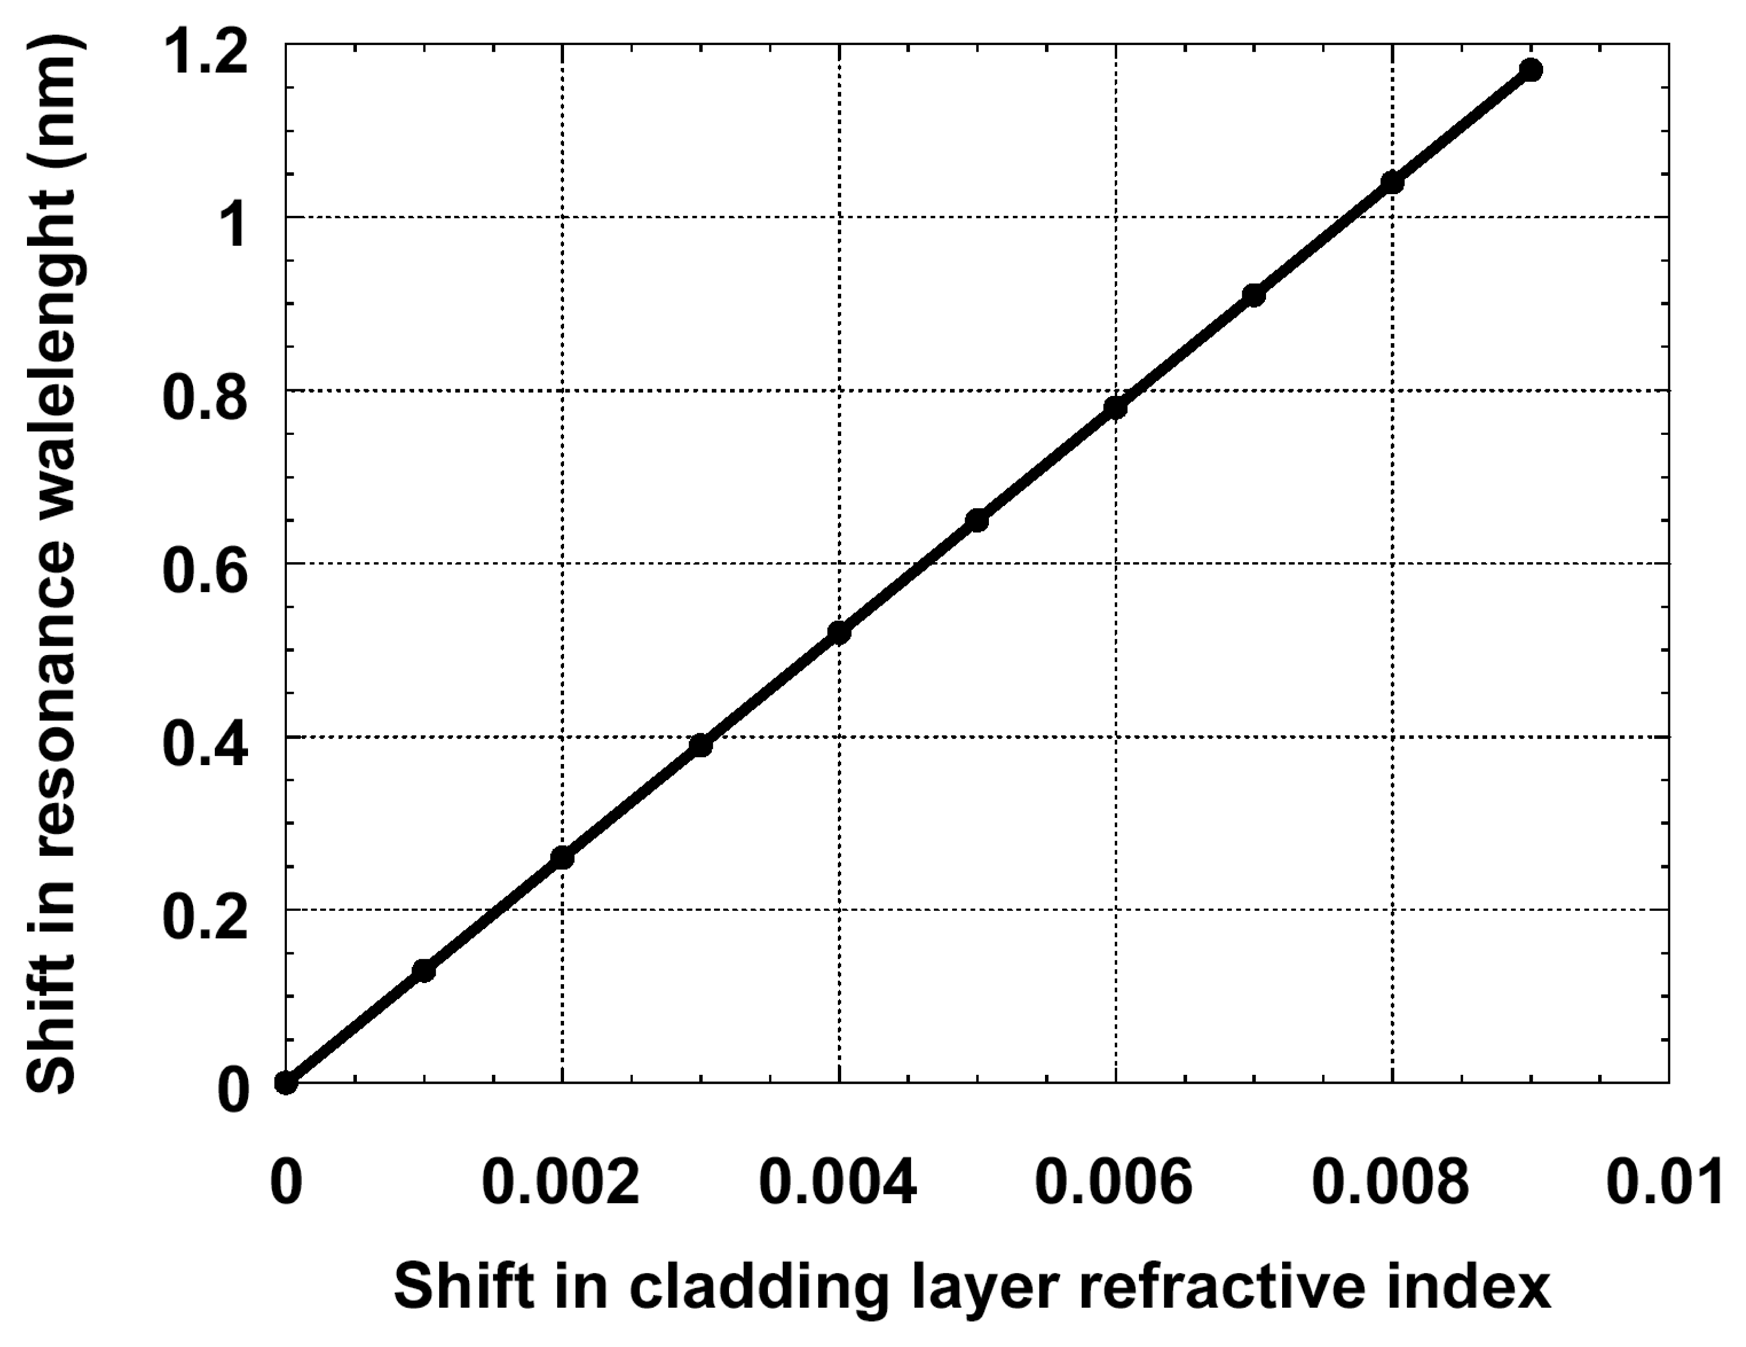
In absence of any change of cladding refractive index, optical propagation in the microring has been simulated as in Figure 6, and Discrete Fourier Transform (DFT) of electric field y component has been calculated at the output cross section (see Figure 7). When no cladding interaction with ammonia occurs, the ring exhibits a resonance wavelength at 1545.33 nm. Then, shift from this resonance wavelength due to PMMA-BCP refractive index change has been calculated. Since ammonia diluted with pure nitrogen to a molar concentration of 5% should induce a PMMA-BCP refractive index change around 10-3 [19], the resonance wavelength shift produced by cladding refractive index shift varying from 1×10⁻³ to 9×10⁻³ has been sketched, as in Figure 8. A very good linearity can be observed.
Proposed sensor sensitivity, as ΔλR/Δnc, has been calculated by 3D FDTD simulations, obtaining a value of 132 nm. This value exhibits a good agreement with that estimated by formula (6).
Since microring resonance wavelengths are more than 20 nm spaced whereas maximum resonance wavelength shift over the sensor operating range is below 2 nm, the minimal detectable cladding refractive index shift also depends on accuracy in estimating the resonance wavelength shift. If a tunable laser (operating around 1550 nm) and a photodetector are used to this aim, a minimum detectable wavelength shift of 10 pm should be obtainable. Therefore, a minimum detectable cladding refractive index shift below 8×10⁻⁵ should be achievable by our approach. Minimum detectable ammonia concentration change is then estimated as around 4 ‰. This detection limit value is significantly less accurate than that reported for other guided-wave optical ammonia sensors (see, for example, that reported in [10]). However, our SOI integrated sensor approach is significantly more compact (device area around 40 μm2). Moreover, since our sensor readout technique is based on the estimation of a wavelength shift (wavelength interrogation), it is intrinsically more immune to optical noise than any other integrated sensing device where the readout technique is based on amplitude estimation or a comparison of optical powers (amplitude interrogation). Finally, adoption of SOI technology permits the full integration of the optical/electronic readout circuit on the same sensor chip to be realized.
Finally, device sensitivity to ammonia concentration change is limited by the temperature influence on cladding refractive index. It has been already demonstrated [23] that each degree of temperature shift produces a change in PMMA refractive index of about 1×10⁻⁵. Therefore, it is necessary to keep constant the gas temperature with high accuracy in order to detect an ammonia concentration change that produces a cladding refractive index shift lower than 8×10⁻⁵.

5. Conclusions

We have designed, simulated and optimized a very compact (about 40 μm2) integrated optical ammonia sensor. Polymethylmethacrylate doped with Bromocresol Purple has been adopted as sensing material because its refractive index around 1550 nm changes after appropriate interaction with NH3. Proposed device exhibits a very good linearity over a wide range, a sensitivity of 132 nm and it is able to reveal a sensing layer refractive index change as low as 8×10⁻⁵ and an ammonia concentration change around 4 ‰.

Acknowledgments

This work has been partially supported by Italian Ministry for University and Research under project Interlink n. II04C01CDM.

References

  1. Timmer, B.; Olthuis, W.; van den Berg, A. Ammonia sensors and their applications–a review. Sens. Actuators B, Chem. 1994, 107, 666–677. [Google Scholar]
  2. Kearney, D.J.; Hubbard, T.; Putnam, D. Breath ammonia measurement in Helicobacter pylori infection. Digest. Dis. Sci. 2002, 47, 2523–2530. [Google Scholar]
  3. Seiyama, T.; Kato, A.; Fujiishi, K.; Nagatani, M. A new detector for gaseous components using semiconductive thin films. Anal. Chem. 1962, 34, 1502–1503. [Google Scholar]
  4. Prasad, A.K.; Gouma, P.I.; Kubinski, D.J.; Visser, J.H.; Soltis, R.E.; Schmitz, P.J. Reactively sputtered MoO3 films for ammonia sensing. Thin Solid Films 2003, 436, 46–51. [Google Scholar]
  5. Meyerhoff, M.E. Polymer membrane electrode-based potentiometric ammonia gas sensor. Anal. Chem. 1980, 52, 1532–1534. [Google Scholar]
  6. Kumar, P.S.; Scaria, A.V.; Vallabhan, C.P.G.; Nampoori, V.P.N.; Radhakrishnan, P. Long-period grating in multimode fiber for ammonia gas detection. Proc. SPIE 2004, 5279, 331–335. [Google Scholar]
  7. Cai, Q.Y.; Jain, M.K.; Grimes, C.A. A wireless, remote query ammonia sensor. Sens. Actuators B, Chem. 2001, 77, 614–619. [Google Scholar]
  8. Scorsone, E.; Christie, S.; Persaud, K.C.; Simon, P.; Kvasnik, F. Fiber optic evanescent sensing of gaseous ammonia with two forms of a new near-infrared dye in comparison to phenol red. Sens. Actuators B, Chem. 2003, 90, 37–45. [Google Scholar]
  9. Cao, W.; Duan, Y. Optical fiber-based evanescent ammonia sensor. Sens. Actuators B, Chem. 2005, 110, 252–259. [Google Scholar]
  10. Brandenburg, A.; Edelhaeuser, R.; Werner, T.; He, H.; Wolfbeis, O.S. Ammonia Detection via Integrated Optical Evanescent Wave Sensors. Microchim. Acta 1995, 121, 95–105. [Google Scholar]
  11. Passaro, V.M.N.; Dell'Olio, F.; Casamassima, B.; De Leonardis, F. Guided-wave Optical Biosensors. Sensors 2007, 7, 508–538. [Google Scholar]
  12. Luff, B.J.; Harris, R.D.; Wilkinson, J.S.; Wilson, R.; Schiffrin, D.J. Integrated-optical directional coupler biosensor. Opt. Lett. 1996, 21, 618–620. [Google Scholar]
  13. Prieto, F.; Sepulveda, B.; Calle, A.; Llobera, A.; Domynguez, C.; Abad, A.; Montoya, A.; Lechuga, L.M. An integrated optical interferometric nanodevice based on silicon technology for biosensor applications. Nanotechnology 2003, 14, 907–912. [Google Scholar]
  14. Clerc, D.; Lukosz, W. Integrated optical output grating coupler as bio chemical sensor. Sens. Actuators B, Chem. 1994, 19, 581–586. [Google Scholar]
  15. Krioukov, E.; Greve, J.; Otto, C. Performance of integrated optical microcavities for refractive index and fluorescence sensing. Sens. Actuators B, Chem. 2003, 90, 58–67. [Google Scholar]
  16. Chao, C.-Y.; Fung, W.; Guo, L.J. Polymer Microring Resonators for Biochemical Sensing Applications. IEEE J. Sel. Topics in Quantum Electron. 2006, 12, 134–142. [Google Scholar]
  17. Yalçyn, A.; Popat, K.C.; Aldridge, J.C.; Desai, T.A.; Hryniewicz, J.; Chbouki, N.; Little, B.E.; King, O.; Van, V.; Chu, S.; Gill, D.; Anthes-Washburn, M.; Unlu, M.S.; Goldberg, B.B. Optical Sensing of Biomolecules Using Microring Resonators. IEEE J. Sel. Topics in Quantum Electron. 2006, 12, 148–155. [Google Scholar]
  18. De Vos, K.; Bartolozzi, I.; Schacht, E.; Bienstman, P.; Baets, R. Silicon-on-Insulator microring resonator for sensitive and label-free biosensing. Optics Express 2007, 15, 7610–7615. [Google Scholar]
  19. Sarkisov, S.S.; Diggs, D.E.; Adamovsky, G.; Curley, M.J. Single-arm double-mode double-order planar waveguide interferometric sensor. Appl. Opt. 2001, 40, 349–359. [Google Scholar]
  20. 3D Mode Solver by Optiwave Corp. ©, single license; 2005.
  21. Dell'Olio, F.; Passaro, V.M.N.; De Leonardis, F. Surface Sensitivity Optimization of a Microring Resonator for Biochemical Sensing. Int. Conf. on Tran. Opt. Net. (ICTON) Proc, Nottingham, 18-22 June, 2006; 4, pp. 128–131.
  22. OptiFDTD by Optiwave Corp. ©, ver. 7.0, single license; 2005.
  23. Sarkisov, S.S.; Wilkosz, A.; Venkateswarlu, P. Nonlinear optical waveguides based on polymeric films doped with phthalocyanines. Proc. SPIE 1996, 2693, 523–531. [Google Scholar]
Figure 1. (a) Ammonia sensor architecture. (b) Ridge guiding structure adopted in sensor design.
Sensors 07 02741f1
Figure 2. Proposed ammonia sensor operating principle.
Sensors 07 02741f2
Figure 3. Device sensitivity versus ridge height, numerically estimated by formula (6) (quasi-TM mode).
Sensors 07 02741f3
Figure 4. Device sensitivity versus ridge width, numerically estimated by formula (6) (quasi-TM mode).
Sensors 07 02741f4
Figure 5. Quasi-TM mode propagating in proposed sensor waveguide.
Sensors 07 02741f5
Figure 6. Optical propagation in microring sensor in absence of any change of cladding refractive index.
Sensors 07 02741f6
Figure 7. Field component Ey DFT at output cross section.
Sensors 07 02741f7
Figure 8. Shift in resonance wavelength versus shift in cladding layer refractive index.
Sensors 07 02741f8