Use of a Dynamic Enclosure Approach to Test the Accuracy of the NDIR Sensor: Evaluation Based on the CO2 Equilibration Pattern

Abstract
:1. Introduction
2. Materials and methods
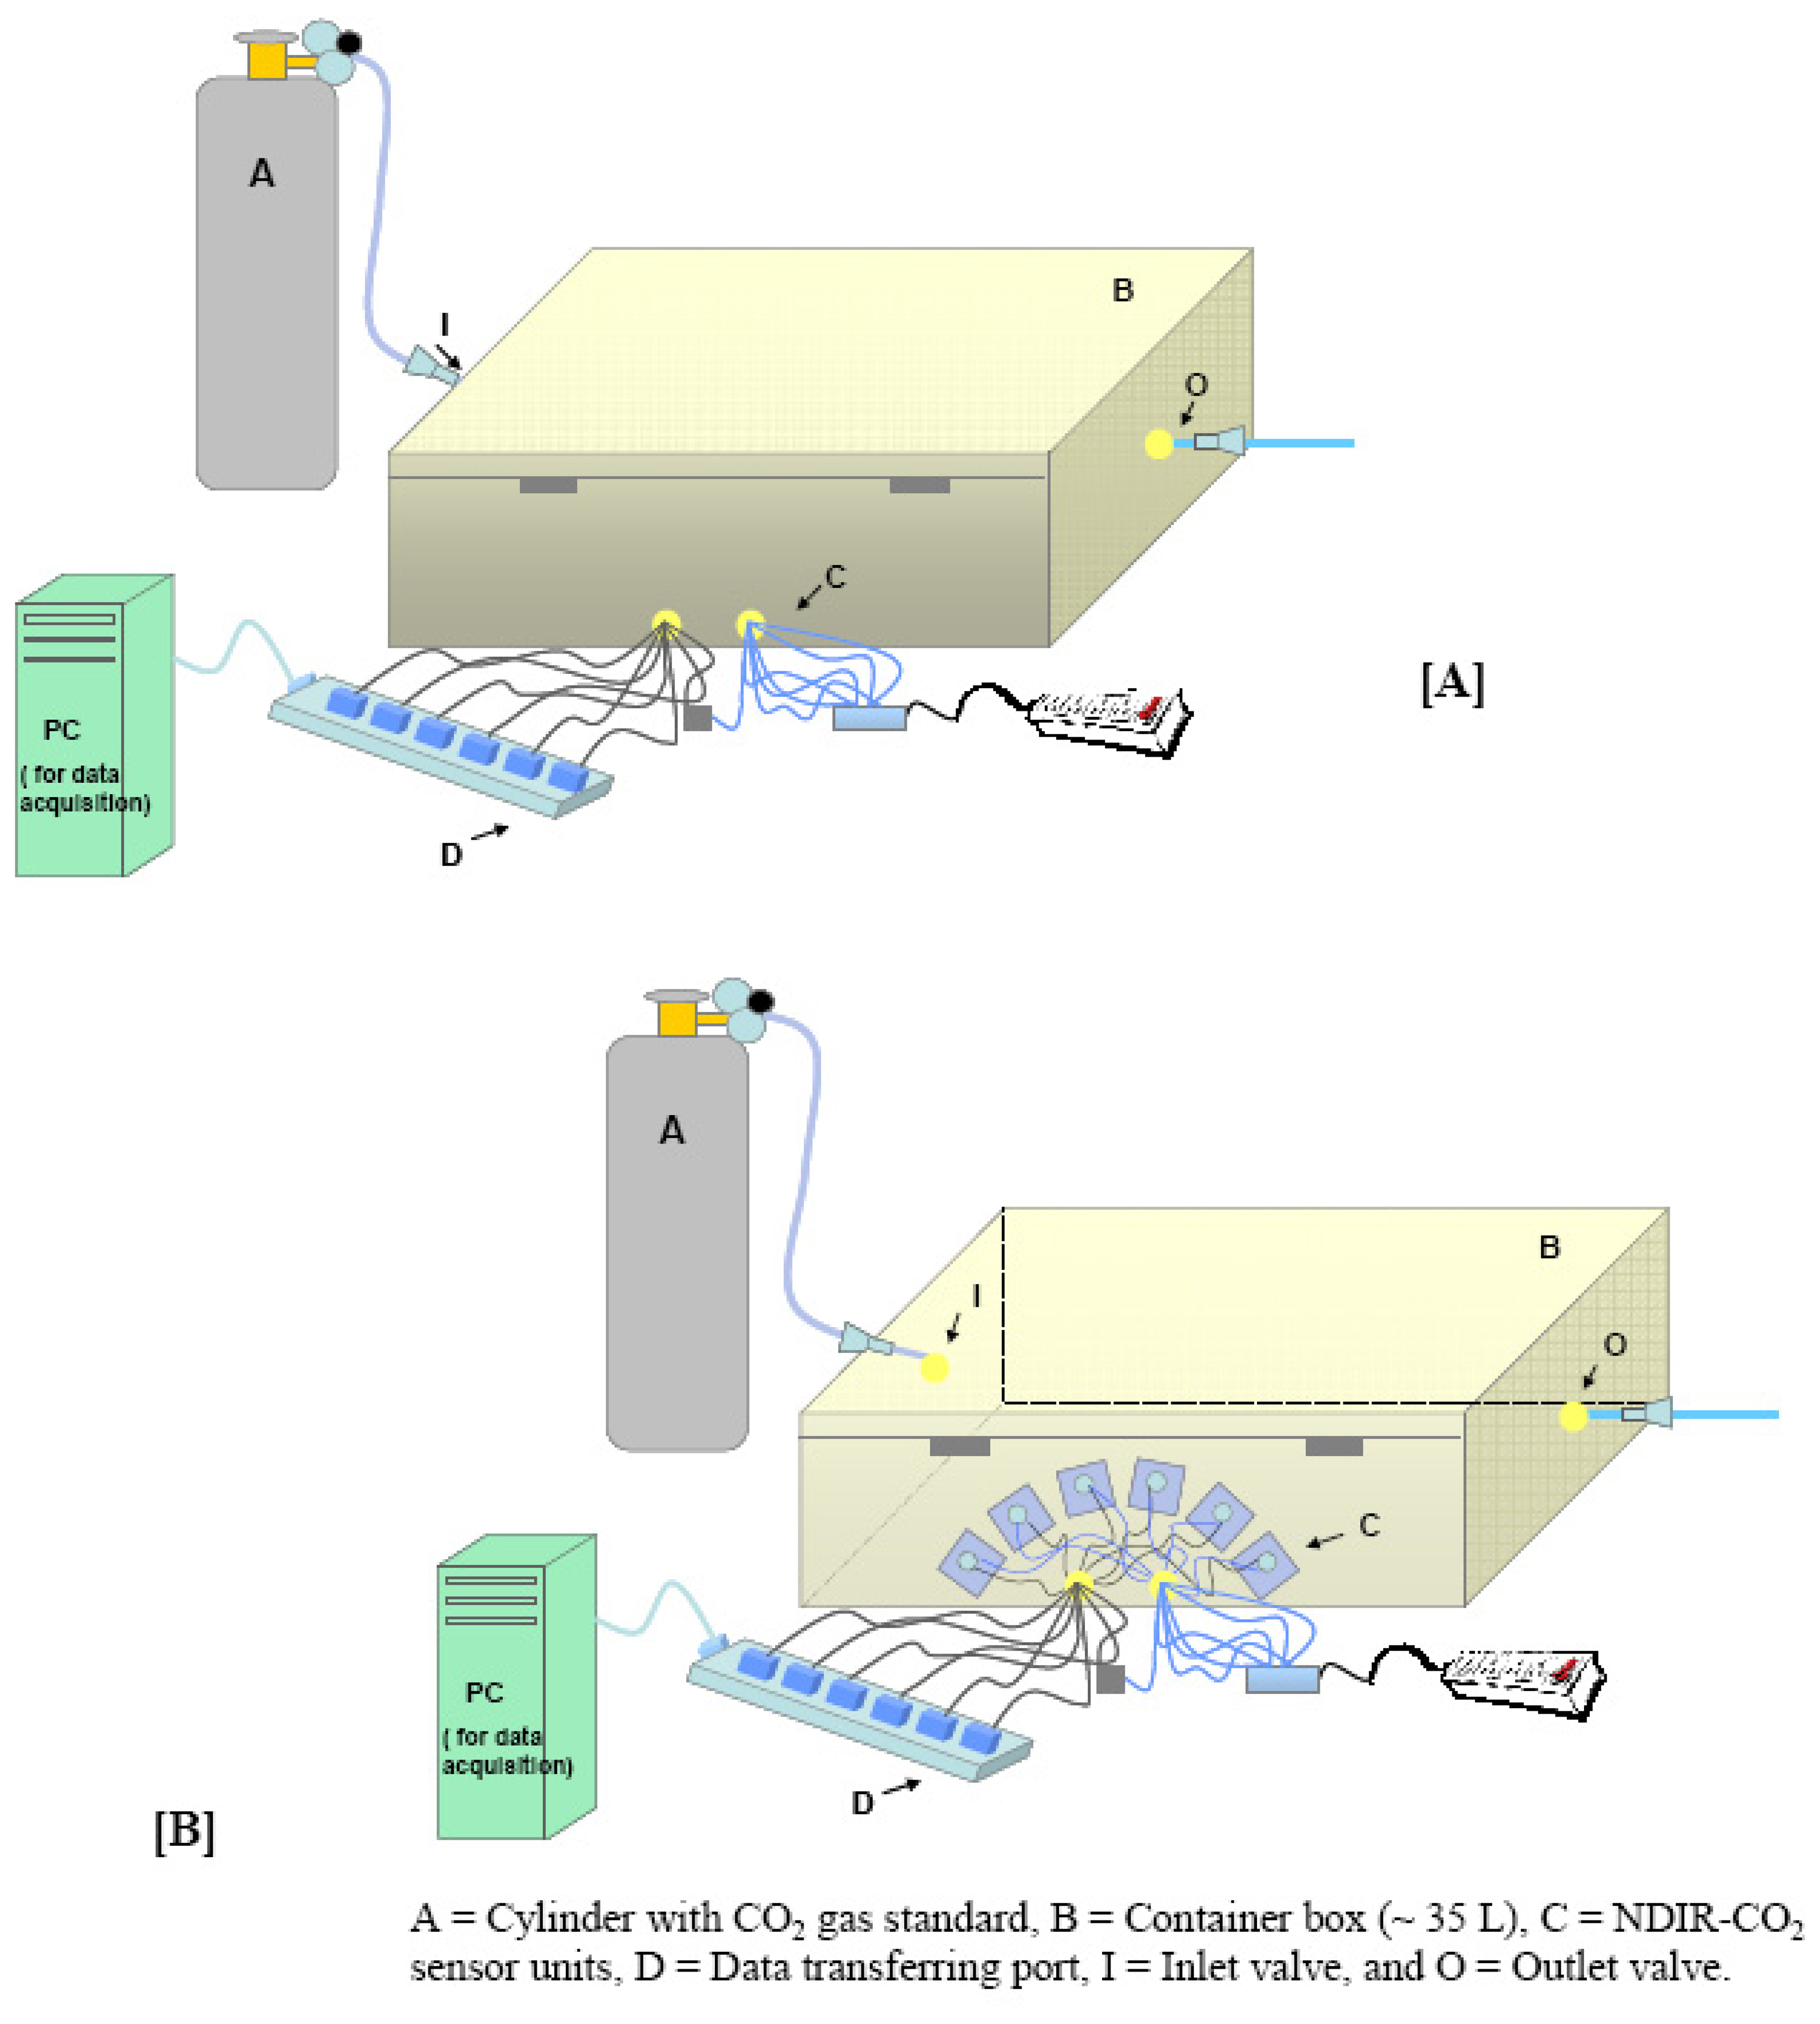
2.1. Schematic of the analytical setup
2.2. Experimental scheme
3. Results and discussions
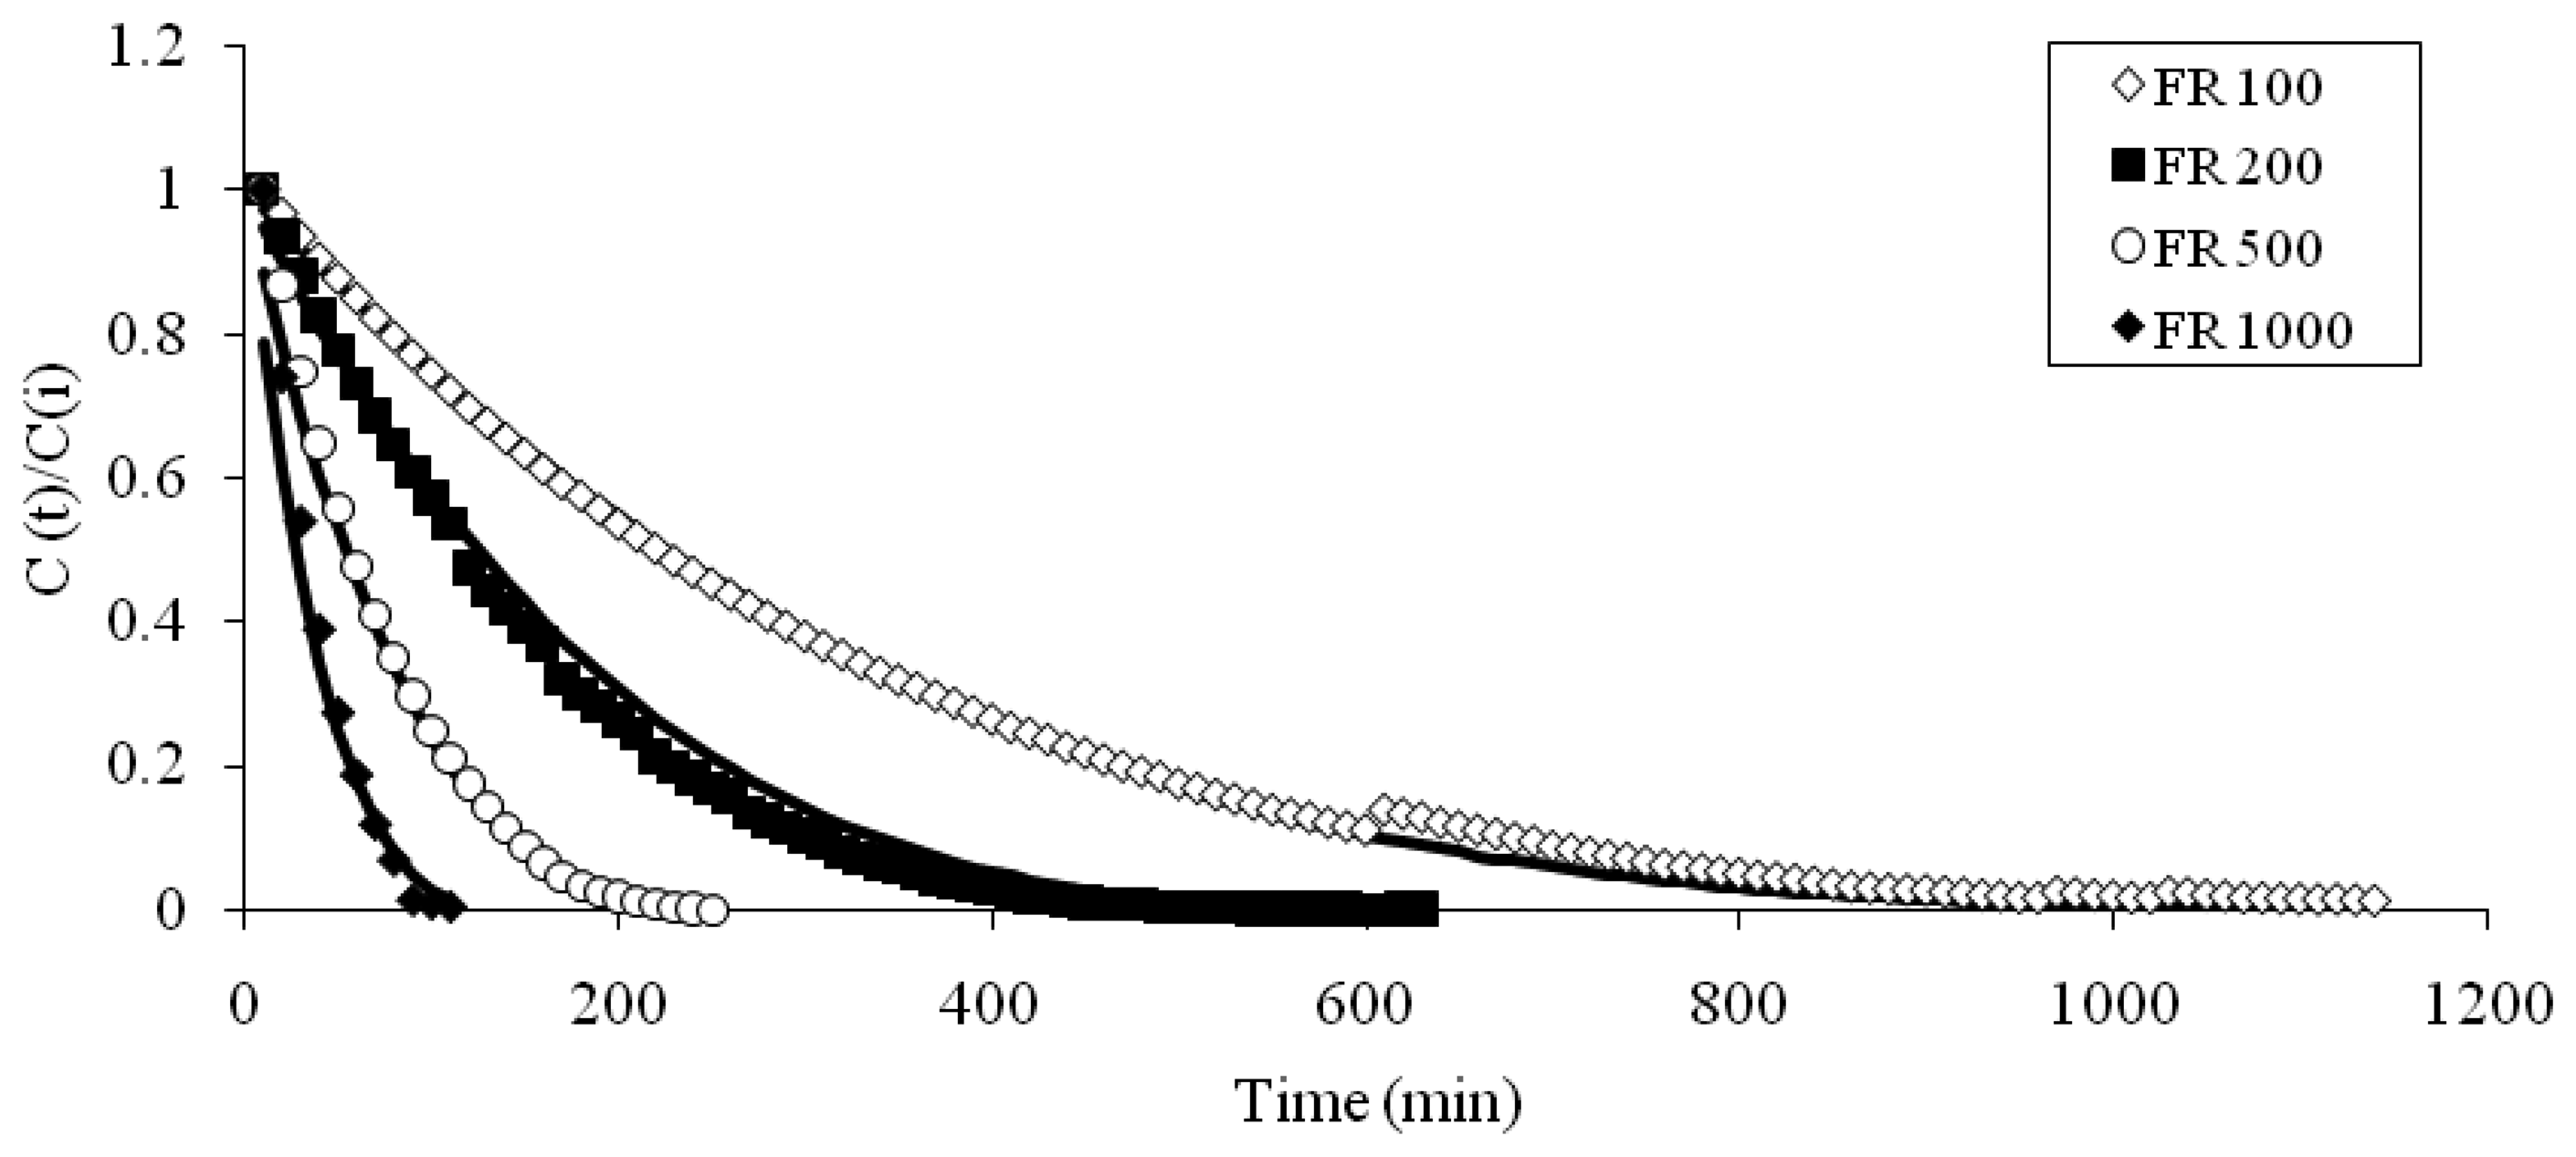
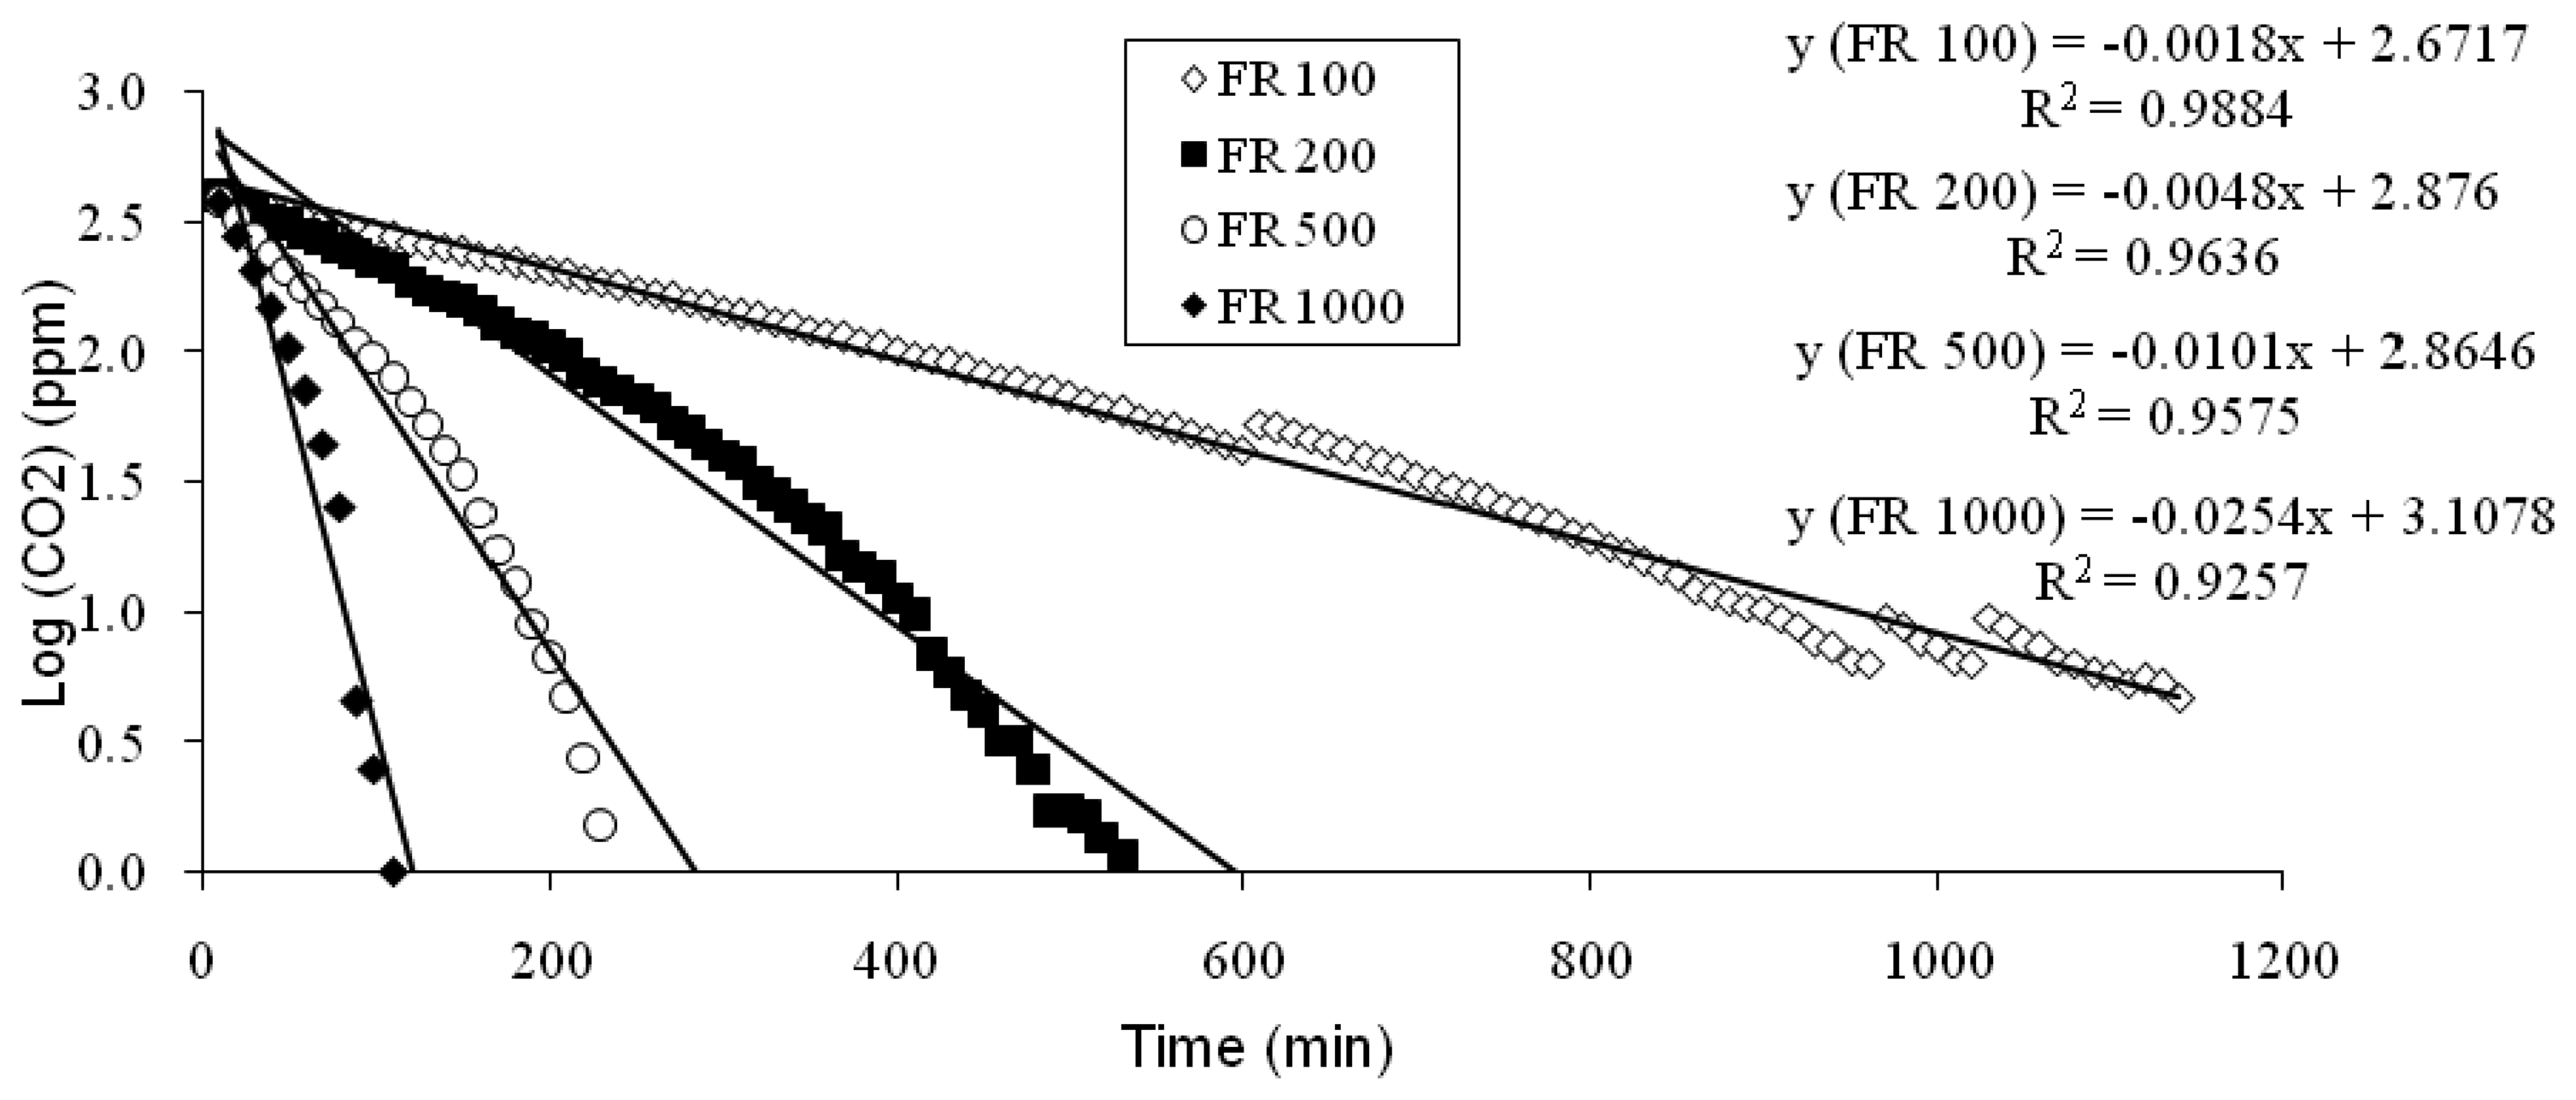
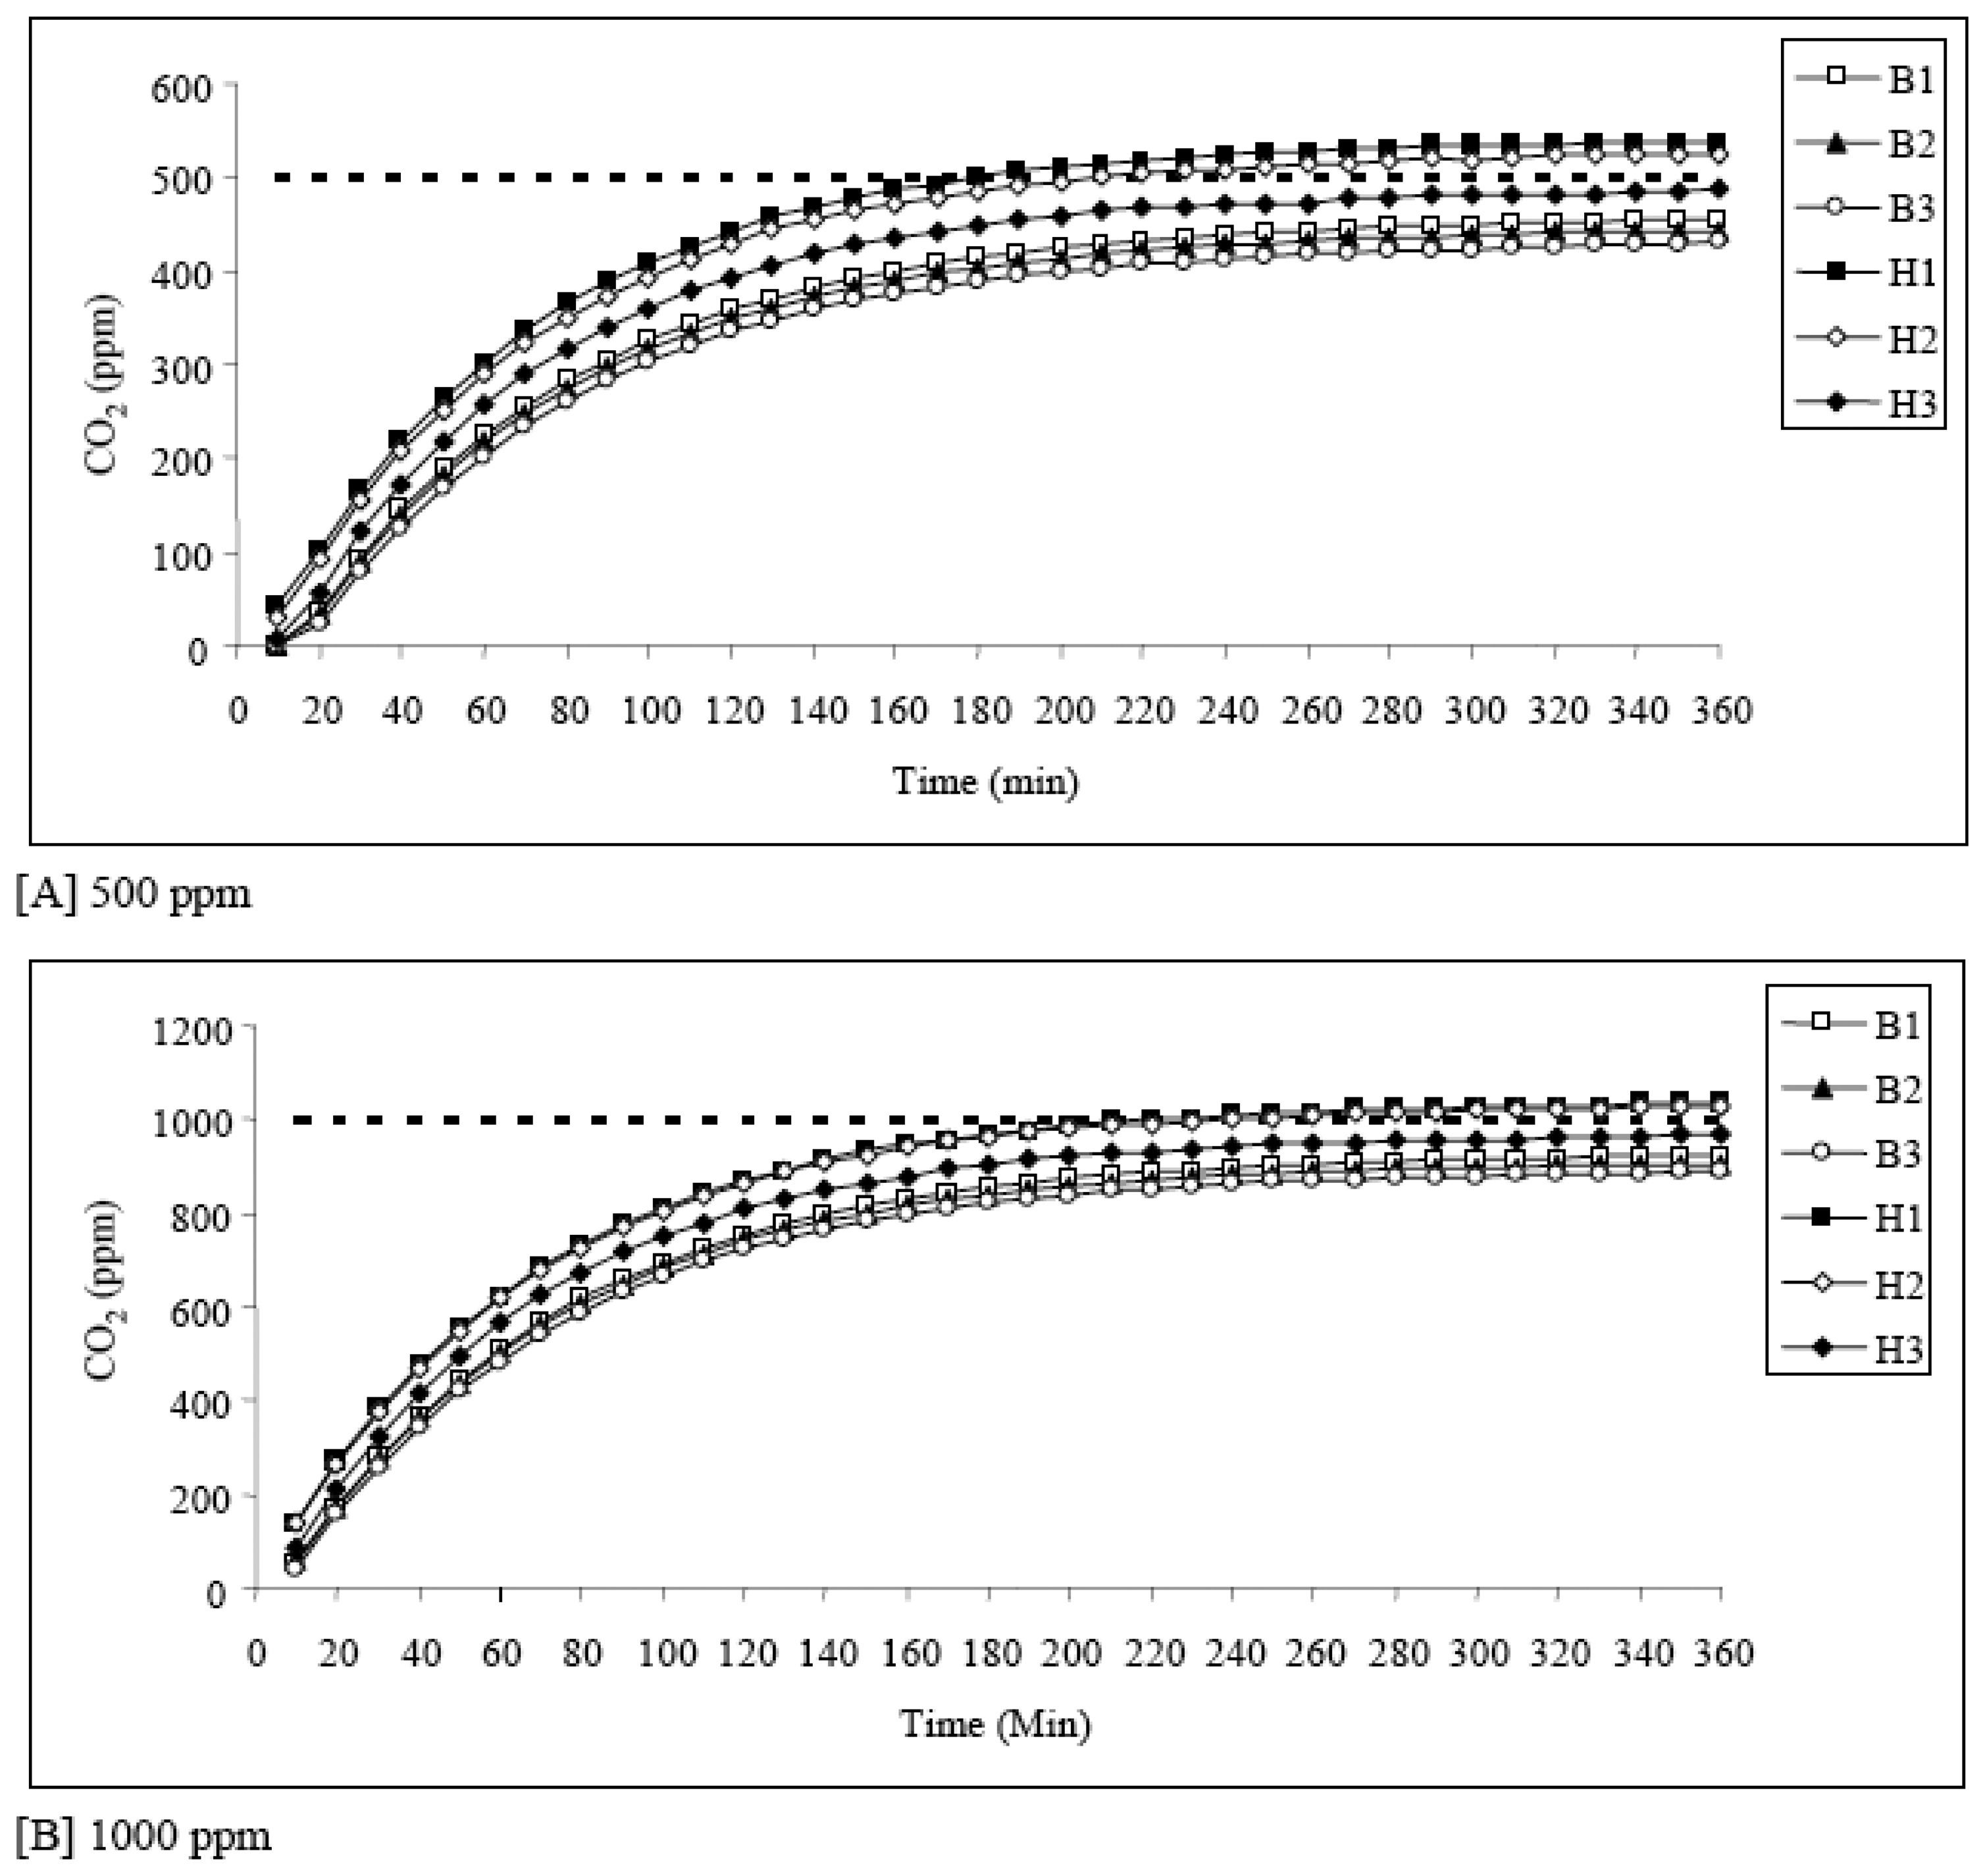
3.1. The general pattern of CO2 circulation in the container
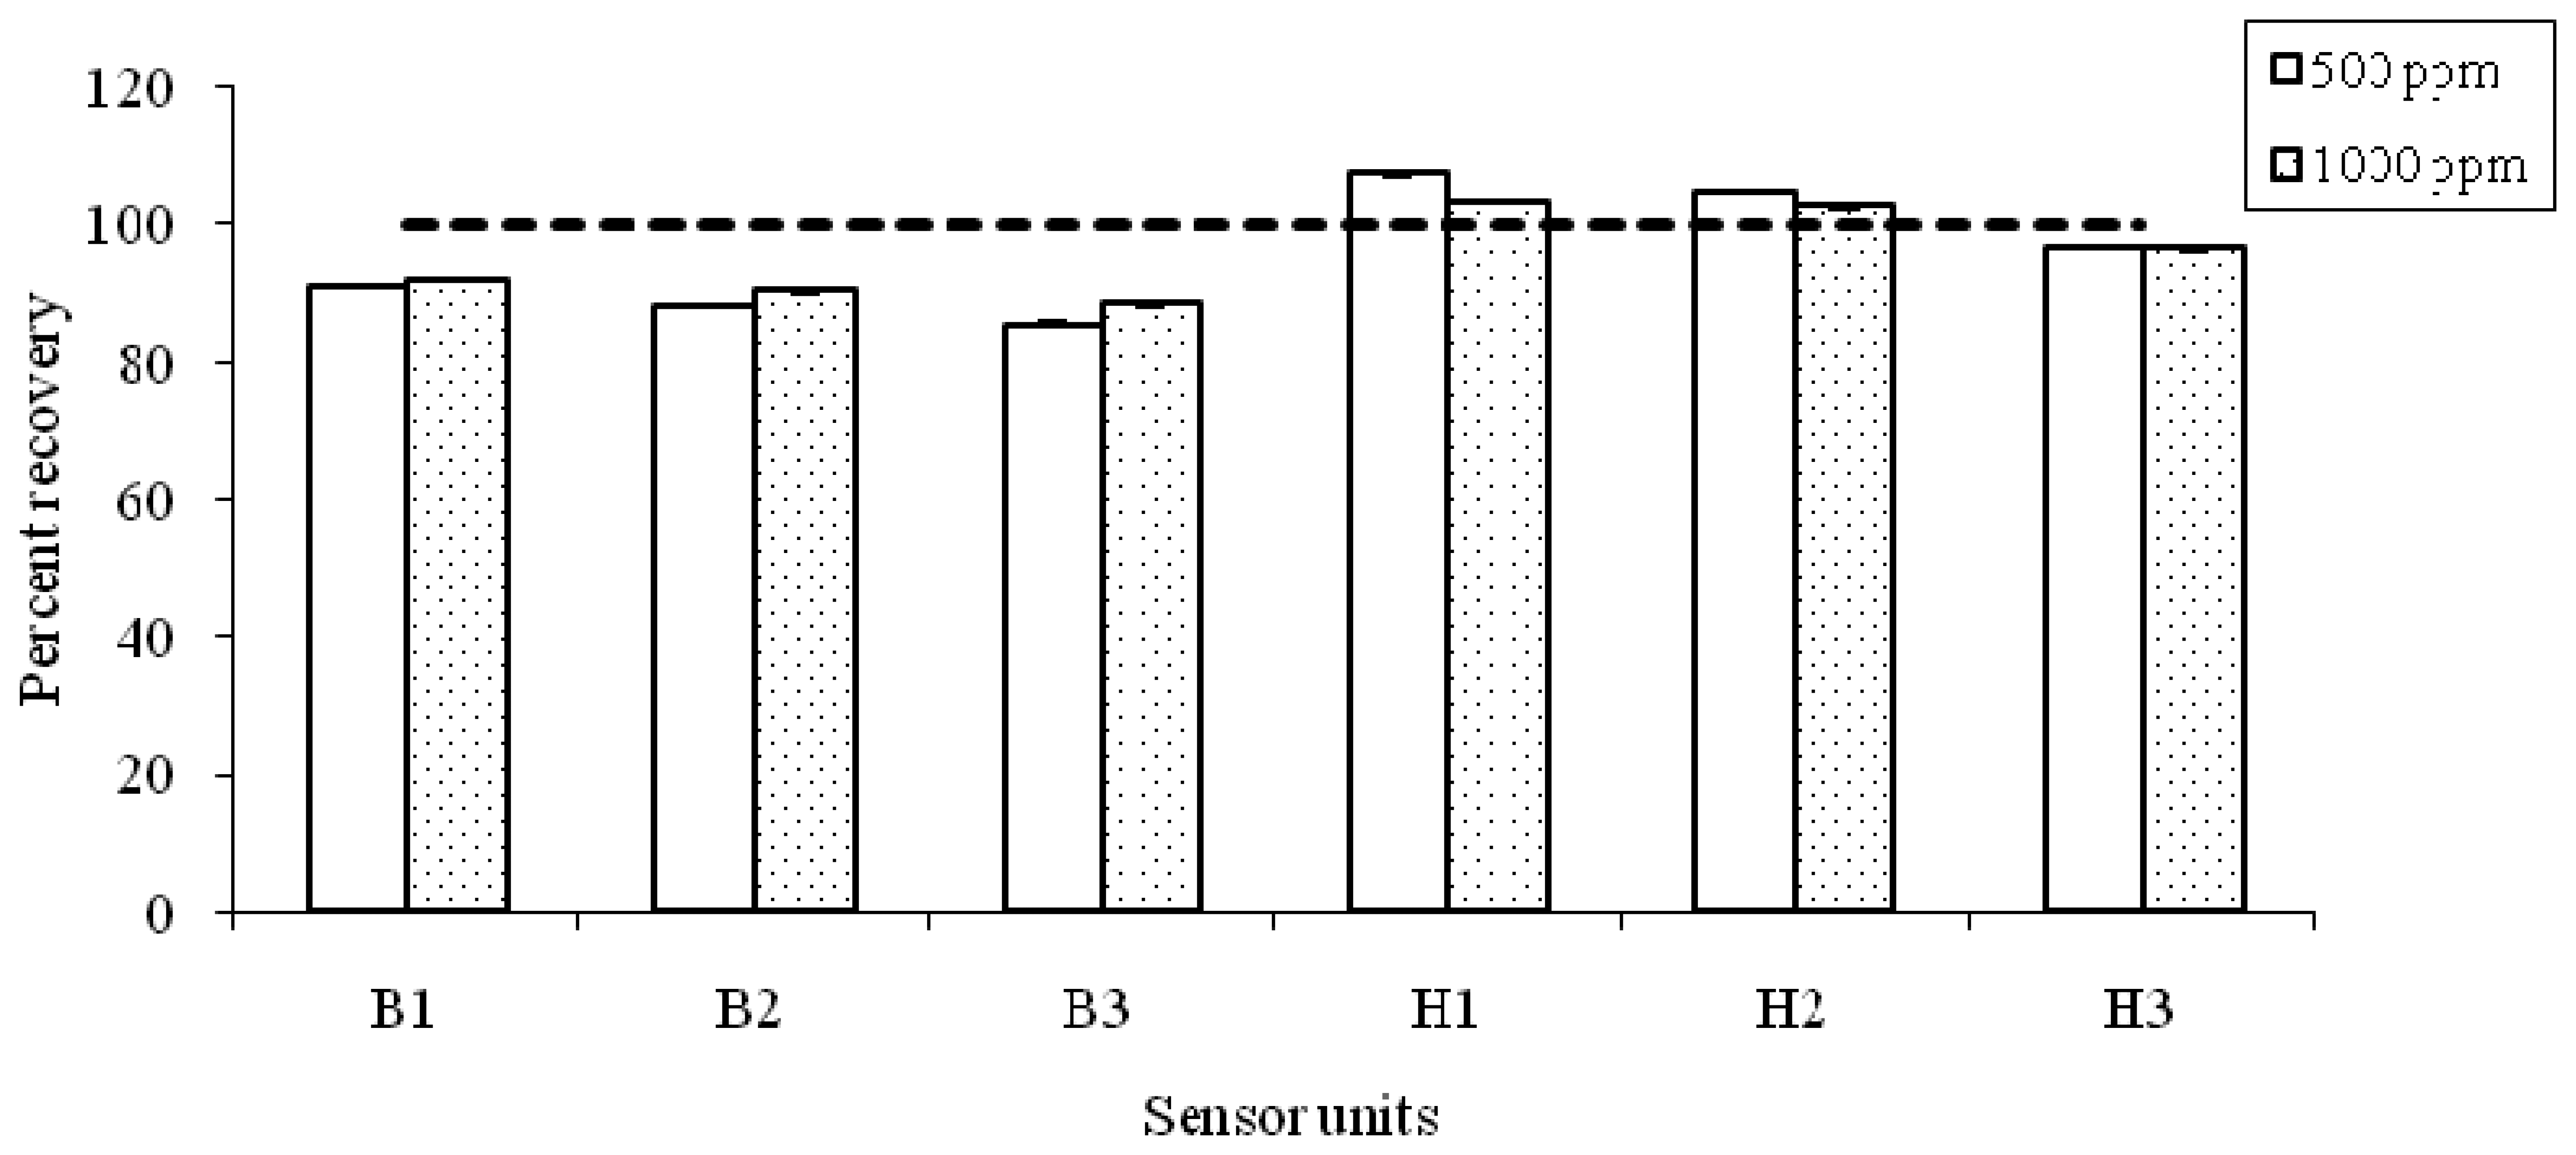
3.2. The accuracy of NDIR-CO2 analysis
3.3 Comparison between different detection techniques
4. Conclusions
Acknowledgments
References and Notes
- Forster, P.; Ramaswamy, V.; Artaxo, P.; Berntsen, T.; Betts, R.; Fahey, D.W.; Haywood, J.; Lean, J.; Lowe, D.C.; Myhre, G.; Nganga, J.; Prinn, R.; Raga, G.; Schulz, M.; Van Dorland, R. 2007; Changes in Atmospheric Constituents and in Radiative Forcing; In: Climate Change: The Physical Science Basis. Contribution of Working Group I to the Fourth Assessment Report of the Intergovernmental Panel on Climate Change; Solomon, S., Qin, D., Manning, M., Chen, Z., Marquis, M., Averyt, K.B., Tignor, M., Miller, H.L., Eds.; Cambridge University Press: Cambridge, United Kingdom and New York, NY, USA, 2007.
- WMO. The 13th WMO/IAEA Meeting of Experts on Carbon Dioxide Concentration and Related Tracers Measurement Techniques, TD No. 1359. 2006. Boulder, Colorado, USA, 19-22 September 2005.
- Raupach, M.R.; Marland, G.; Ciais, P.; Le Que´ re´, C.; Canadell, J.G.; Klepperand, G.; Field, C.B. Global and regional drivers of accelerating CO2emissions. PNAS 2007. 10.1073.pnas.0700609104. [Google Scholar]
- Nemitz, E.; Hargreaves, K. J.; McDonald, A. G.; Dorsey, J. R.; Fowler, D. Micrometeorological measurements of the urban heat budget and CO2 emissions on a city scale. Environmental Science and Technology 2002, 36, 3139–3146. [Google Scholar]
- Kovesi, T.; Gilbert., N.L.; Stocco, C.; Fugler, D.; Dales, R.E.; Guay, M.; Miller, D.J. Indoor air quality and the risk of lower respiratory tract infections in young Canadian Inuit children. Canadian Medical Association or its Licensors 2007, 177, 155–60. [Google Scholar]
- Wong, J. Y. NDIR Gas Sensor. US Patent No. 5,444,249, 22 1995. Aug 1995.
- Yi, S.H.; Park, Y.W.; Han, S.O.; Min, N.; Kim, E.S.; Ahn, T.W. Novel NDIR CO2 sensor for indoor Air quality monitoring. The 13th International Conference on Solid-State Sensors, Actuators and Microsystems, Seoul, Korea, June 5-9, 2005; 2005. [Google Scholar]
- Pandey, S.K.; Kim, K.H. The Relative Performance of NDIR-based Sensors in the Near Real-time Analysis of CO2 in Air. Sensors 2007, 7, 1683–1696. [Google Scholar]
- Ekeberg, D.; Ogner, G.; Fongen, M.; Jonerc, E.J.; Wickstrømc, T. Determination of CH4, CO2 and N2O in air samples and soil atmosphere by gas chromatography mass spectrometry, GC-MS. Journal of Environmental Monitoring. 2004, 6, 621–623. [Google Scholar]
- NIOSH manual of analytical methods (NMAM), fourth edition; Carbon dioxide: Method 6603; Issue 2, 1994.
- Satienperakul, S.; Cardwell, T.J.; Cattrall, R.W.; McKelvie, I.D.; Taylor, D.M.; Kolev, S.D. Determination of carbon dioxide in gaseous samples by gas diffusion-flow injection. Talanta 2004, 62, 631–636. [Google Scholar]
- Schauer, A.J.; Lott, M.J.; Cook, C.G.; Ehleringer, J.R. An automated system for stable isotope and concentration analyses of CO2 from small atmospheric samples. Rapid. Commun. Mass. Spectrom. 2005, 19, 359–362. [Google Scholar]
- Norback, D.; Ancker, K.; Johanson, G. Field Evaluation of CO2 Detector Tubes for Measuring Outdoor Air Supply Rate in the Indoor Environment. Indoor Air 1992, 2, 58–64. [Google Scholar]
- Calegario, F.F.; Cosso, R.G.; Almeida, F.V.; Vercesi, A.E.; Jardim, W.F. Determination of the respiration rate of tomato fruit using flow analysis. Postharvest Biology and Technology 2001, 22, 249–256. [Google Scholar]


| [A] Initial test to evaluate the equilibrium pattern of he enclosure system using CO2-fee air | |||||
|---|---|---|---|---|---|
| Experiment | CO2 concentration (ppm) | Flow rate (mL min-1) | Exp date | Total duration (min) | Predicted duration for equilibration (min)1] |
| 1 | 0 | 1000 | 07. Sep 07 | 120 | 1283 |
| 2 | 0 | 500 | 07. Sep 07 | 300 | 1283 |
| 3 | 0 | 200 | 08. Sep 07 | 650 | 303 |
| 4 | 0 | 100 | 09. Sep 07 | 1140 | 155 |
| [B] Comparison with the calibrated CO2 standards at two concent: | |||||
| 5 | 500 | 500 | 13. Sep 07 | 360 | 303 |
| 6 | 1000 | 500 | 14. Sep 07 | 360 | 303 |
| [A] CO2 concentration data acquired after the equilibration time (300-360 min duration) 1] | ||||||||
|---|---|---|---|---|---|---|---|---|
| Concentration level | Sensor units | Grand mean | ||||||
| B12] | B2 | B2 | H13] | H2 | H3 | |||
| [A] 500 ppm | Mean ± SD (Median) | 453 ± 1.11 (453) | 441 ± 1.41 (441) | 427 ± 1.90 (427) | 536 ± 1.23 (536) | 524 ± 1.00 (524) | 483 ± 2.16 (483) | 477 ± 44.9 (468) |
| (N=6) | Range | 451-454 | 439-443 | 424-430 | 534-537 | 522-525 | 481-486 | 427-536 |
| [B] 1000 ppm | Mean ± SD (Median) | 919 ± 2.42 (920) | 903 ± 2.59 (903) | 885 ± 2.87 (885) | 1031 ± 2.07 (1031) | 1025 ± 3.22 (1025) | 963 ± 3.98 (964) | 954 ± 62.7 (941) |
| (N=6) | Range | 915-921 | 900-906 | 880-888 | 1028-1034 | 1020-1029 | 958-969 | 885-1031 |
| [B] PD values derived after the equilibration time (300-360 min duration) 1] | ||||||||
| Concentration level | Sensor units | Grand mean4] | ||||||
| B12] | B2 | B3 | H13] | H2 | H3 | |||
| [A] 500 ppm | Mean ± SD (Median) | -9.39 ± 0.22 (-9.33) | -11.7 ± 0.28 (-11.7) | -14.6 ± 0.38 (-14.6) | 7.30 ± 0.10 (7.33) | 4.83 ± 0.08 (4.85) | -3.30 ± 0.18 (-3.38) | 8.52 ± 4.25 (8.34) |
| (N=6) | Range | -9.78 ∼ -9.17 | -12.2 ∼ -11.4 | -15.1 ∼ -13.9 | 6.93-7.55 | 4.50-5.06 | -3.69 ∼ -2.66 | 3.30-14.6 |
| [B] 1000 ppm | Mean ± SD (Median) | -8.03 ± 0.24 (-7.91) | -9.65 ± 0.26 (-9.65) | -11.5 ± 0.29 (-11.5) | 3.15 ± 0.21 (3.15) | 2.53 ± 0.32 (2.59) | -3.62 ± 0.40 (-3.58) | 6.41 ± 3.81 (5.83) |
| (N=6) | Range | -8.46 ∼ -7.85 | -10.0 ∼ -9.35 | -11.9 ∼ -11.2 | 2.88-3.46 | 2.03-2.89 | -4.15 ∼ -3.05 | 2.53-11.5 |
| [A] Results of CO2- free air (CO2 = 0 ppm) | |||||||
|---|---|---|---|---|---|---|---|
| B1 | B2 | B3 | H1 | H2 | H3 | ||
| B1 | 1.000 | ||||||
| B2 | 1.000 | 1.000 | |||||
| B3 | 1.000 | 1.000 | 1.000 | ||||
| H1 | 0.997 | 0.998 | 0.998 | 1.000 | |||
| H2 | 0.997 | 0.998 | 0.998 | 1.000 | 1.000 | ||
| H3 | 0.995 | 0.996 | 0.997 | 1.000 | 1.000 | 1.000 | |
| [B] Results of the intermediate range (CO2 = 500 ppm) | |||||||
|---|---|---|---|---|---|---|---|
| B1 | B2 | B3 | H1 | H2 | H3 | ||
| B1 | 1.000 | ||||||
| B2 | 1.000 | 1.000 | |||||
| B3 | 1.000 | 1.000 | 1.000 | ||||
| H1 | 0.999 | 0.999 | 0.999 | 1.000 | |||
| H2 | 0.999 | 0.999 | 0.999 | 1.000 | 1.000 | ||
| H3 | 0.999 | 0.999 | 0.999 | 1.000 | 1.000 | 1.000 | |
| [C] Results of the highest range (CO2 = 1000 ppm) | |||||||
|---|---|---|---|---|---|---|---|
| B1 | B2 | B3 | H1 | H2 | H3 | ||
| B1 | 1.000 | ||||||
| B2 | 1.000 | 1.000 | |||||
| B3 | 1.000 | 1.000 | 1.000 | ||||
| H1 | 1.000 | 1.000 | 1.000 | 1.000 | |||
| H2 | 1.000 | 1.000 | 1.000 | 1.000 | 1.000 | ||
| H3 | 1.000 | 1.000 | 1.000 | 1.000 | 1.000 | 1.000 | |
| Method | Measurement condition | Mean (ppm) | SD | N | Accuracy | Precision RSE (%) | Reference |
|---|---|---|---|---|---|---|---|
| NDIR-sensor | Enclosure system | 954 | 62.7 | 6 | 4.60 | 2.68 | This study |
| NDIR-sensor | Enclosure system | 477 | 44.9 | 6 | 4.60 | 3.84 | This stduy |
| NDIR-sensor | Laboratory | 429 | 33 | 6 | NA | 2.33 | Pandey and Kim [8] |
| GC-MS | Certified CO2 standard | 1016 | 74 | 10 | 3.99 | 2.30 | Ekeberg et al.[9] |
| CF-GC/IRMS | Test cylinders | 328-603 | 0.33-0.61 | 10 | 0.18-0.38 | 0.33-0.61 | Schauer et al.[12] |
| GC-TCD | CO2 gas sampling bags | 2270-10,000 | NA | NA | 5.3 | 0.014 | NIOSH [10] |
| GD-FIA | In open air (Laboratory) | 338 | 35 | 3 | NA | 5.98 | Satierperakul [11] |
| GC-TCD | In open air (Laboratory) | 335 | 36 | 3 | NA | 6.2 | Satierperakul [11] |
| GD-FIA | Undercover car parking | 565 | 9 | 3 | NA | 0.92 | Satierperakul [11] |
| GC-TCD | Undercover car parking | 554 | 15 | 3 | NA | 1.56 | Satierperakul [11] |
| Detector tube anlysis | Indoor air | 800-1000 | NA | NA | NA | 5-7 | Norback [13] |
© 2007 by MDPI ( http://www.mdpi.org). Reproduction is permitted for noncommercial purposes.
Share and Cite
Pandey, S.K.; Kim, K.-H.; Lee, S.-H. Use of a Dynamic Enclosure Approach to Test the Accuracy of the NDIR Sensor: Evaluation Based on the CO2 Equilibration Pattern. Sensors 2007, 7, 3459-3471. https://doi.org/10.3390/s7123459
Pandey SK, Kim K-H, Lee S-H. Use of a Dynamic Enclosure Approach to Test the Accuracy of the NDIR Sensor: Evaluation Based on the CO2 Equilibration Pattern. Sensors. 2007; 7(12):3459-3471. https://doi.org/10.3390/s7123459
Chicago/Turabian StylePandey, Sudhir Kumar, Ki-Hyun Kim, and Sun-Ho Lee. 2007. "Use of a Dynamic Enclosure Approach to Test the Accuracy of the NDIR Sensor: Evaluation Based on the CO2 Equilibration Pattern" Sensors 7, no. 12: 3459-3471. https://doi.org/10.3390/s7123459
APA StylePandey, S. K., Kim, K. -H., & Lee, S. -H. (2007). Use of a Dynamic Enclosure Approach to Test the Accuracy of the NDIR Sensor: Evaluation Based on the CO2 Equilibration Pattern. Sensors, 7(12), 3459-3471. https://doi.org/10.3390/s7123459