1. Introduction
In the development of the vehicles, the Durability test known as life cycle test is essentially performed to evaluate a reliability of vehicles. The test offers important data to determine life cycle of vehicles through the analysis of cost vs. effect, and the test data is used for evaluating and predicting defects of main parts of vehicle during life cycle.
One of the important test factors in endurance test is vibration environments while vehicles are operated. The environment affects the reliability of vehicles owing to fatigue. Therefore, the measurement of road profile and evaluation of profile characteristic are important points to get reliable endurance test results [
1-
3].
An endeavor, measuring profile and analyzing the severity and then applying the results, has been studied for a long time in the endurance test field. Early, managers of test road have used their experience and subjective measuring method. They have developed the various measuring methods to get more objective results.
In 1970s, the APG of the Department of Defense of USA developed a measurement equipment of tow arm type, but it could only measure at 20-2m/cycle frequency band and had no effect on measurement of high frequency.
Thereafter, they made a trailer type equipment with gyro and ultrasonic sensor and have been using it till now. It can measure the frequency band of 20-0.3m/cycle [
4].
In Japan, the Technical Research and Development Institute of the Defense Agency made a profilometer with gyro in 1992 and it has been used to evaluate a suspension system and get a profile data and obtain an input data of a shaker for vibration test [
5].
The profilometer made in Japan can measure the profile of 20-0.5m/cycle frequency band, but it takes long time to measure and has very narrow width that is only 0.3m. This paper presents a configuration and an operating program for the profilometer improved on the defects of other equipments. A program to analyze profile data is conformable to ISO 8608 standard.
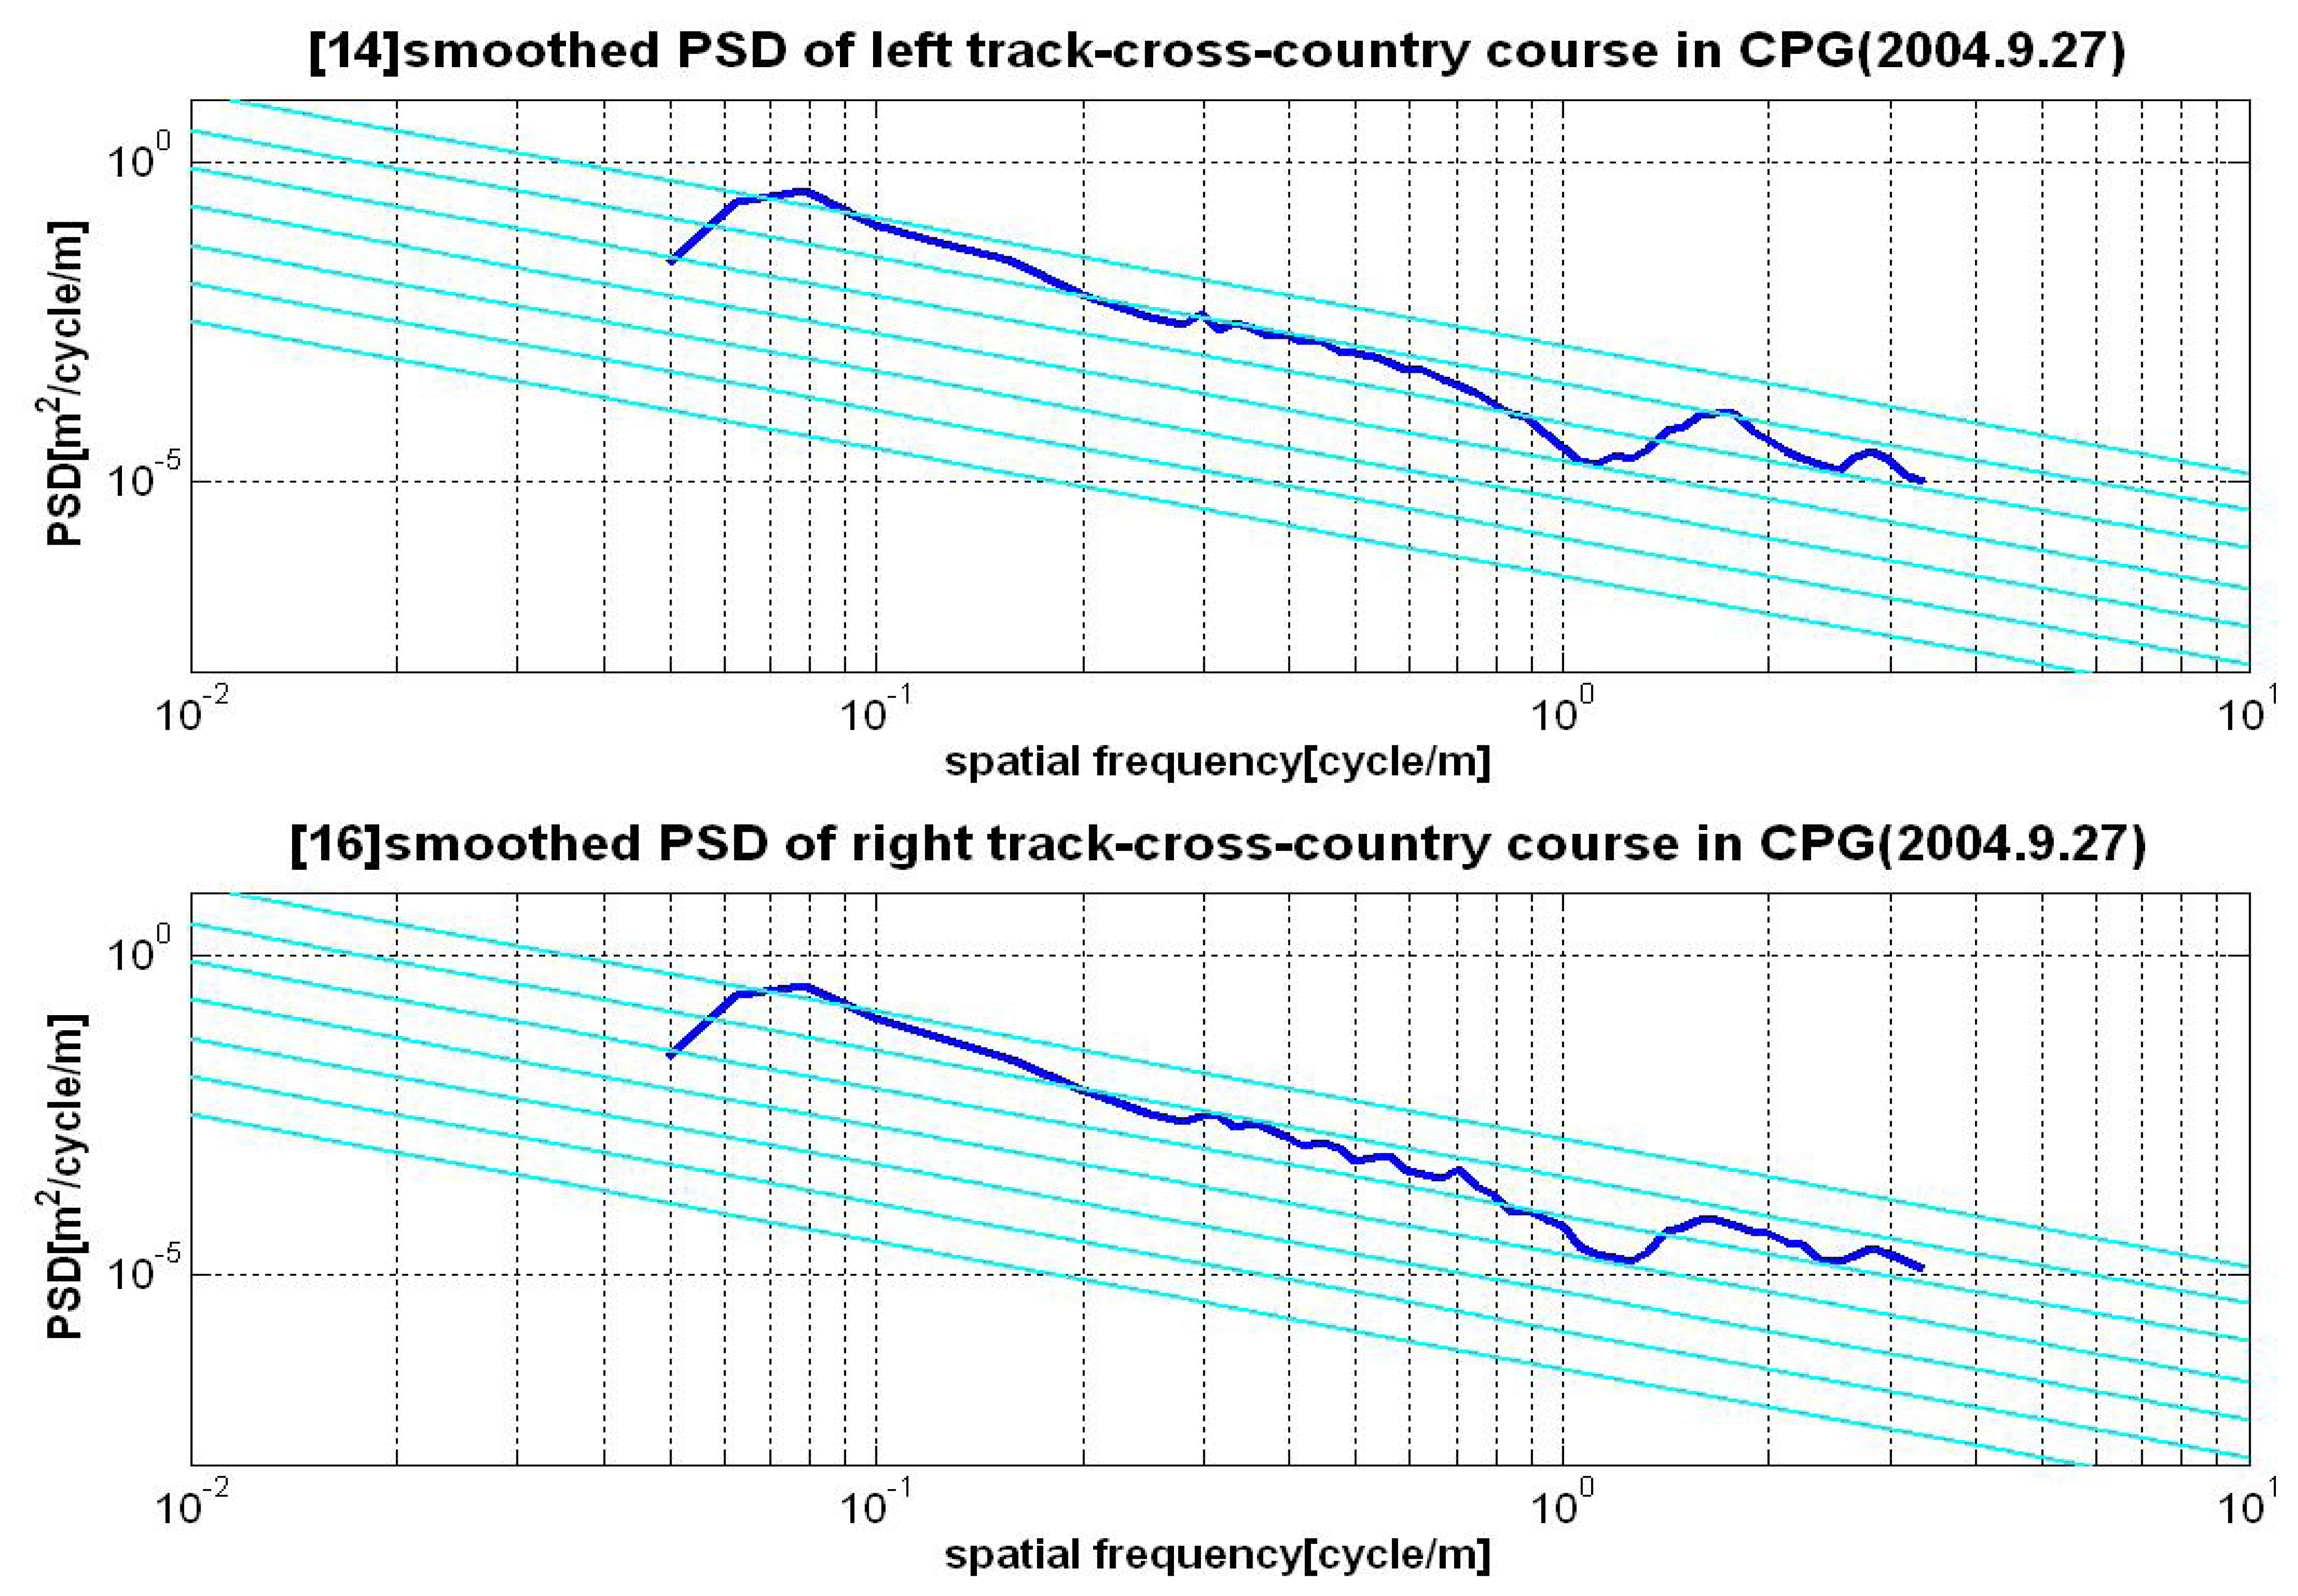
This study compares the severity of unpaved road at the Chang-won Proving Ground (CPG) of the Agency for Defense Development (ADD) with the severity of other unpaved roads in Korea and classifies the road grade according to ISO 8608 standard.
We have acquired the profile data of the endurance test course at the CPG and other operating areas for 3 years. Comparing the profile severity between cross-country test course in the CPG and the task roads in the Army Operating Areas, we acquired the validity of the test courses at the CPG in terms of the profile severity and could evaluate the similarity with other unpaved roads.
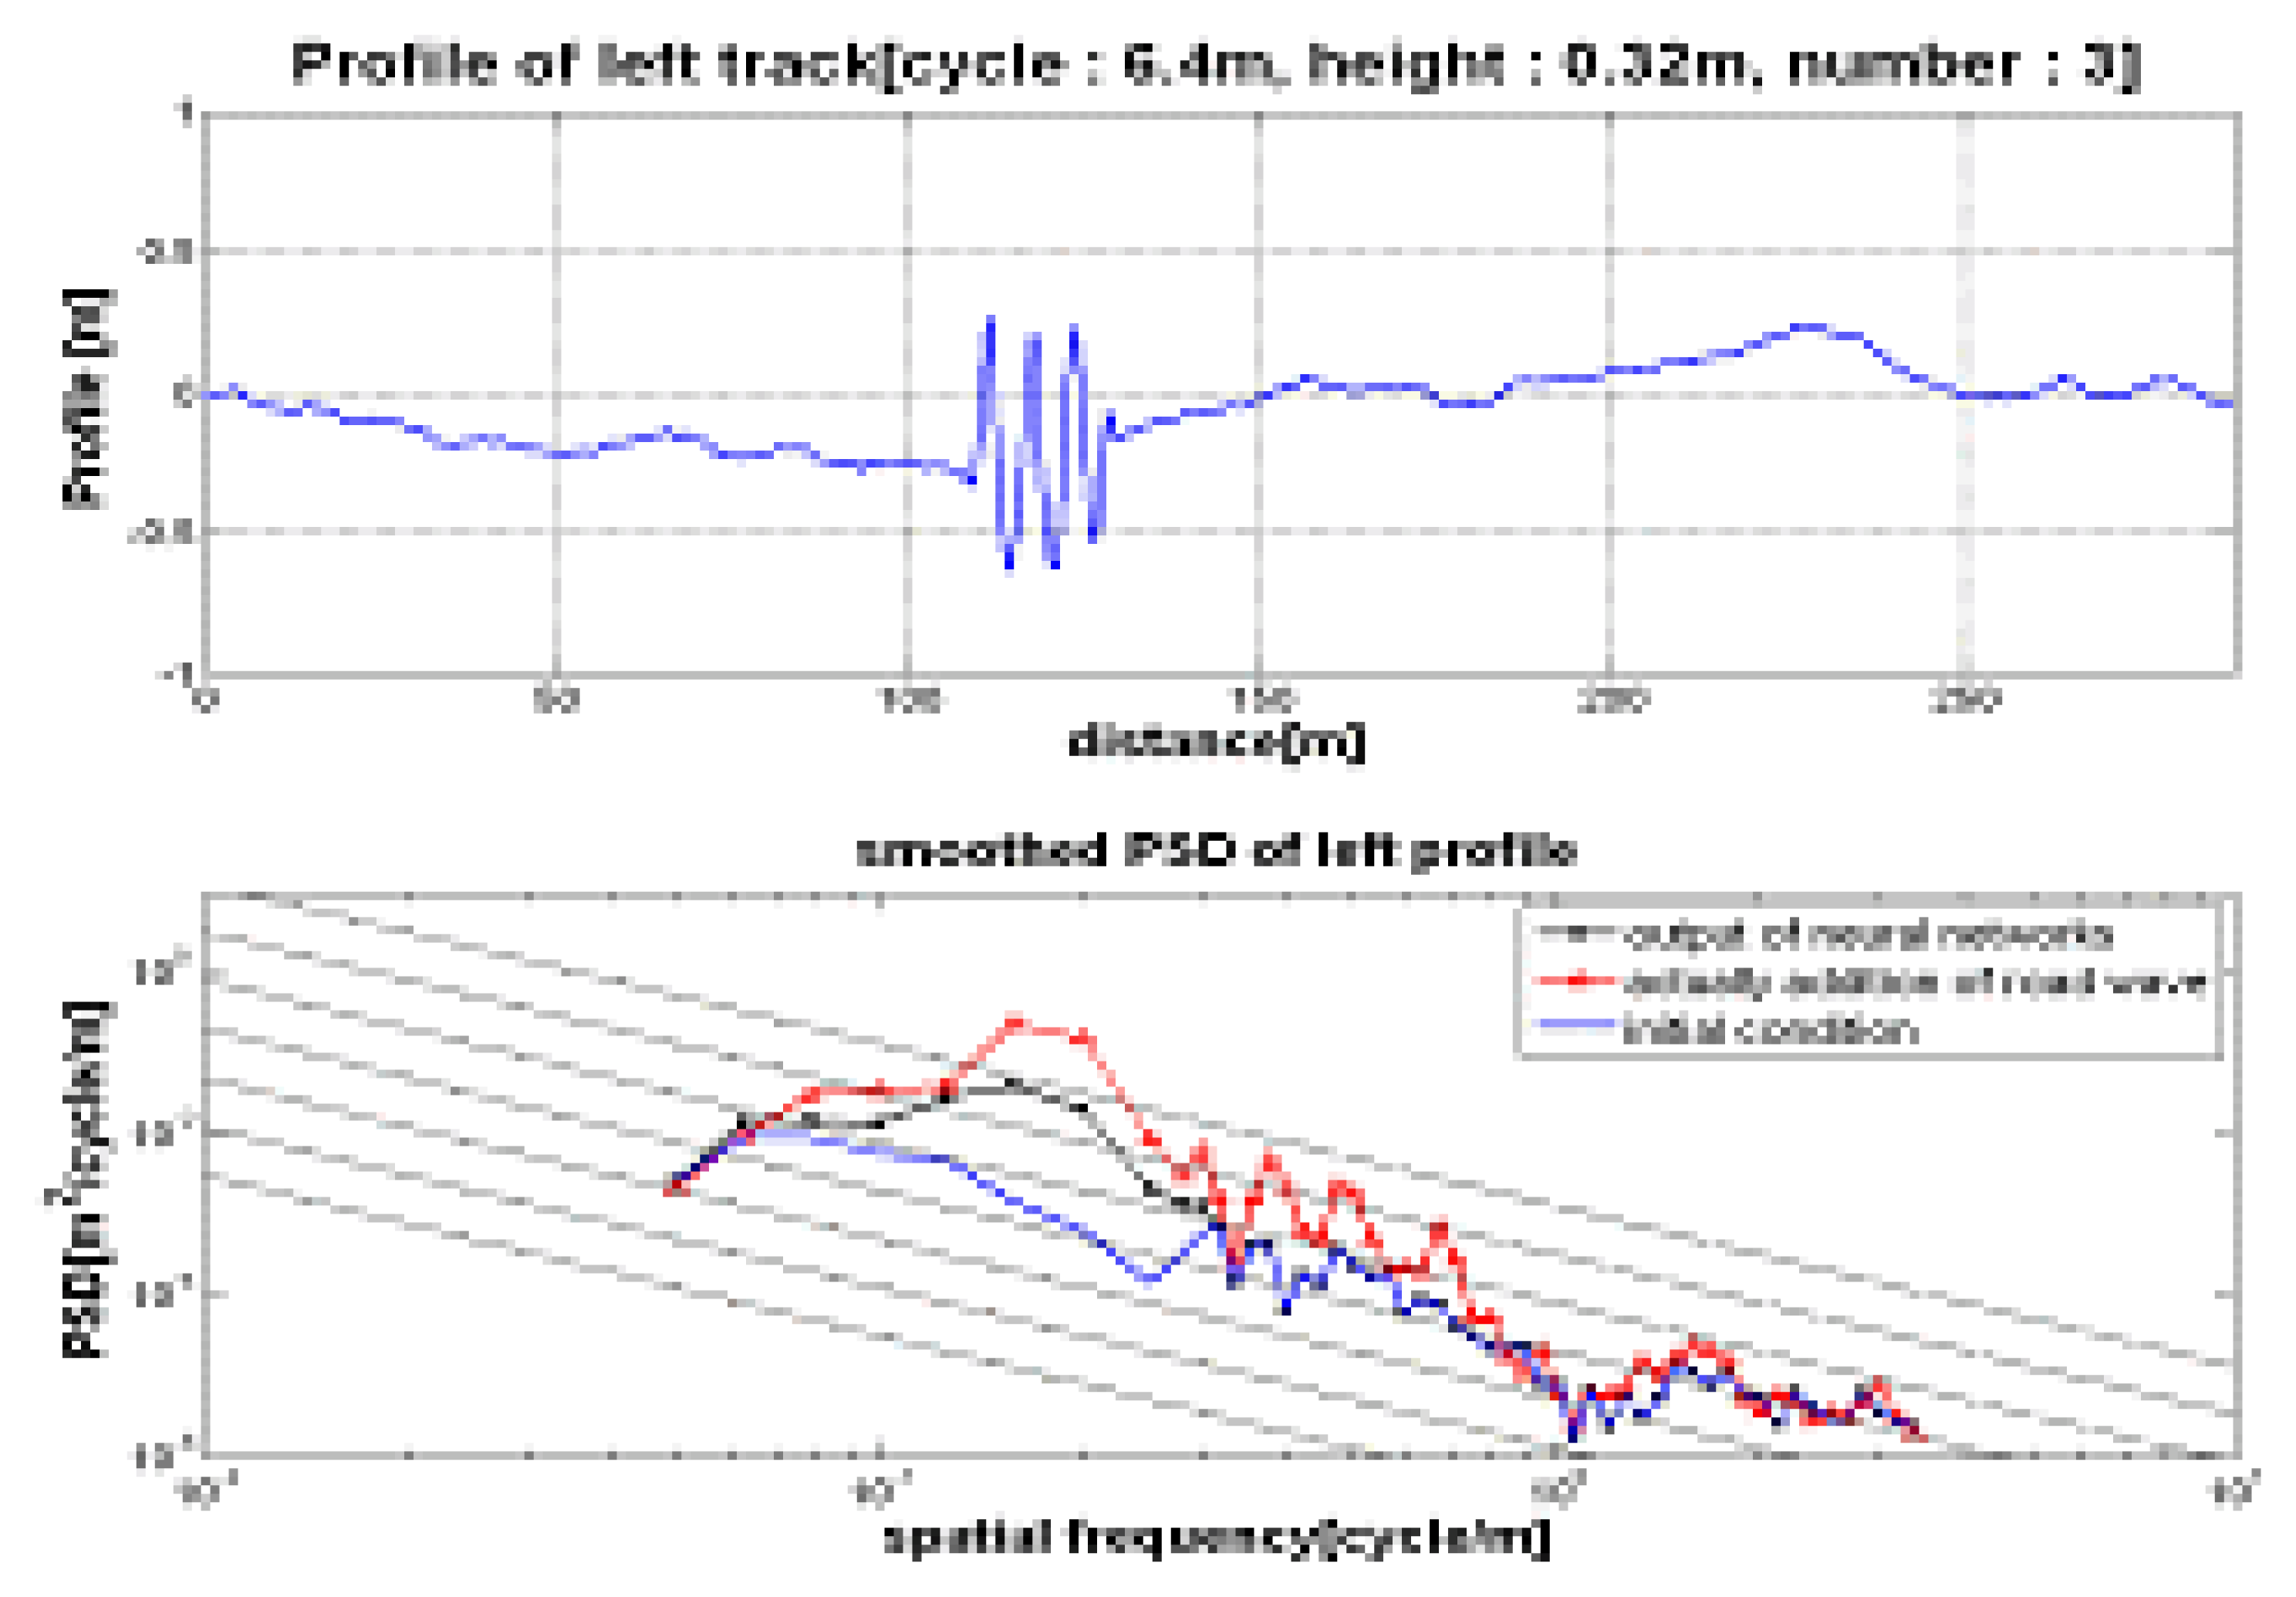
We set up a management section to maintain a severity level to each spatial frequency, which accomplish the standardization of severity for endurance test course. And we make the program for the management of profile severity to maintain consistently the profile of the test course based on the neural network which is applied to the pattern recognition, system identification, control and interpolation, etc. due to the robustness of the learning ability and associative memory.
2. Development of the Profilometer
In general, they are classified to the conceptual measurement methods to measure the profile and analyze the severity as follows. First, there is the vehicle response measurement method. That acquires the profile data from the strain gauge or accelerometer installed on the suspension system.6 Second, there is the direct profile measurement method from the road surface. That requires us to materialize the geometry shape of road profile from the equipment with gyro and displacement sensor. By analyzing the data, road profile severity can be collected from the data. 4,5,7
The above-mentioned methods have merits and demerits individually, and the first method can differently evaluate the severity according to vehicle type, so it has a defect that cannot consistently apply the severity data inflicted on the wheeled and tracked vehicle. On the other hand, the second method can consistently apply the severity data to any vehicle type because it measures the profile of the geometric shapes and evaluates the severity.
Therefore, in the view of maintaining consistently the severity of road profile, it can be judged that the latter is the more effective method on account of measuring directly the geometric form of profile,.
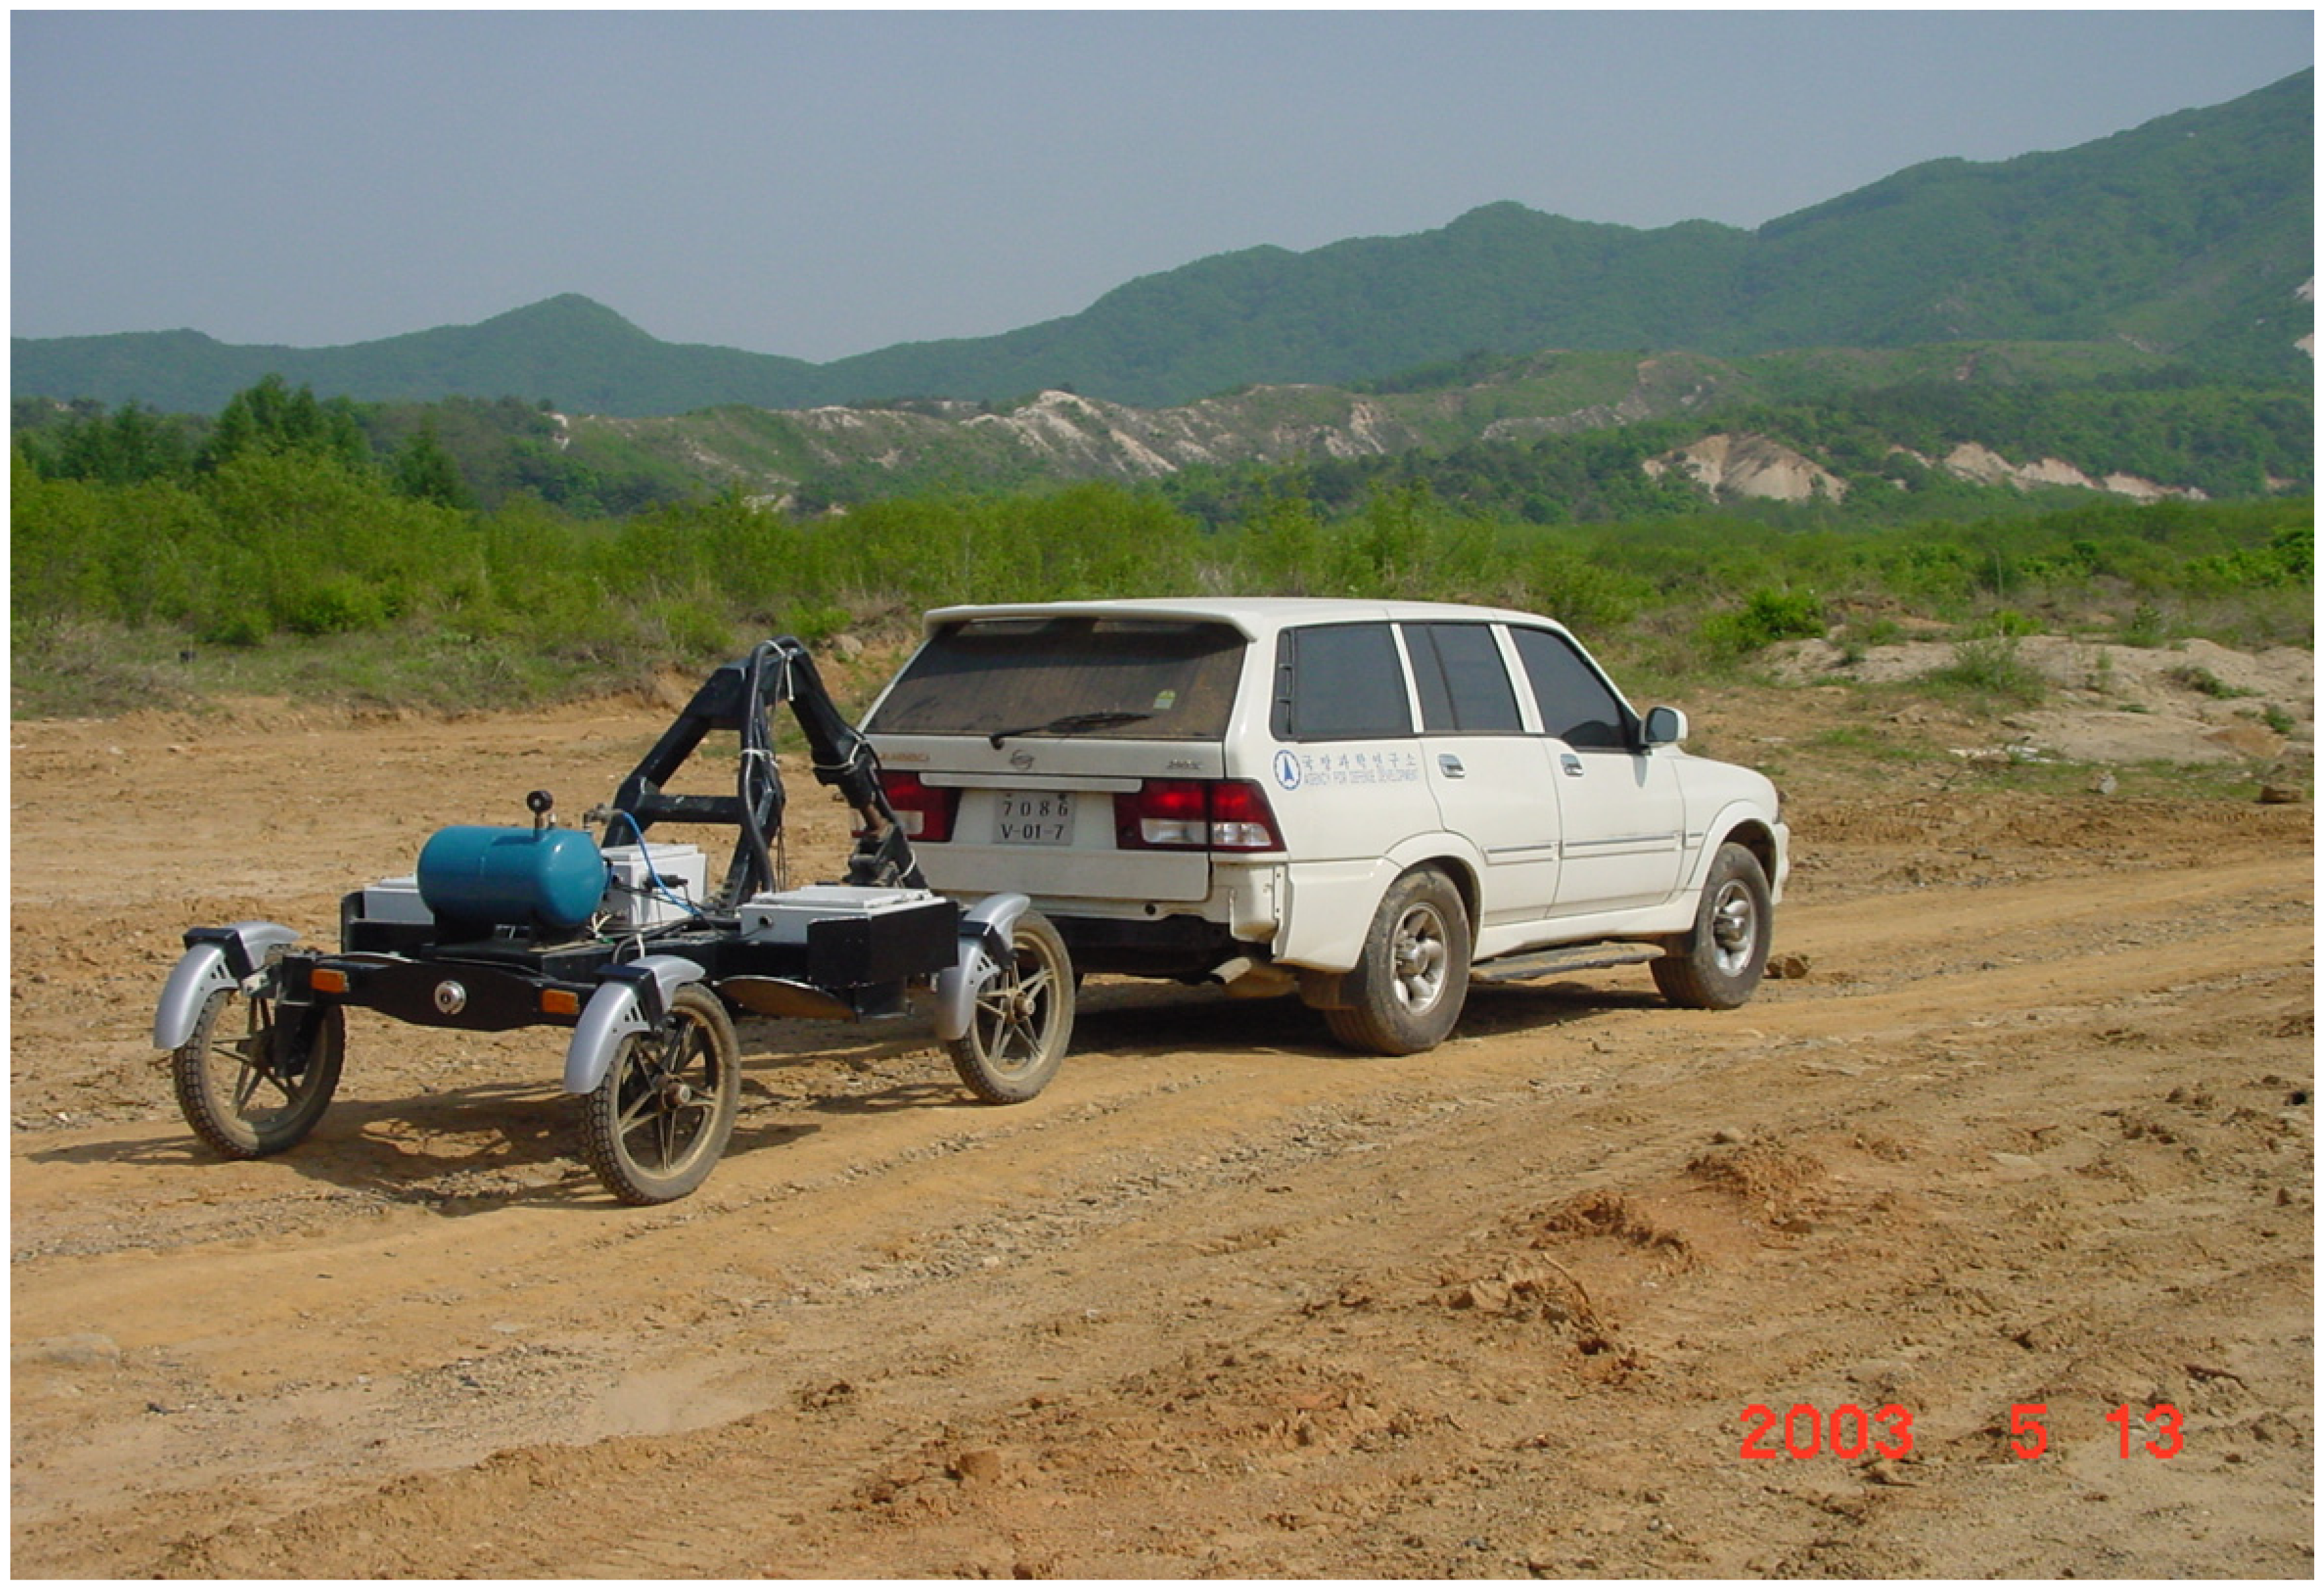
In this study, we developed the profilometer with vertical gyro and laser displacement sensors using the latter method. That is composed of the trailer with sensors and the tow vehicle, as shown in
Figure 1.
2.1. Composition of Hardware
2.1.1 Trailer
The principal dimensions of the trailer were designed through the theoretical modeling analysis to measure the 20∼0.3m/cycle frequency range [
8,
9]. An overall length, wheel base, track and tire radius of the trailer are 3.1m, 1.2m, 1.8m and 0.287m, respectively. The trailer is composed of 4 wheels with two axles, and there are no compliant suspension components between the axles and the frame. The motion of the frame is described by two degree of freedom, yaw for the front axle and roll for the rear axle. A linkage between tractor and trailer is designed that the motion of tractor does not affect the trailer. While measuring, the air cylinder presses the trailer constantly to prevent from bouncing.
The vertical gyroscope is mounted on the trailer's midpoint to measure pitch and roll angle. The laser sensor is mounted on the left and right side of trailer respectively to measure vertical displacement. The wheel encoder on the rear right wheel measures moving distance. It has 3:1 gear ratio and resolving power of 6mm/pulse, so its sampling rate is 9.6cm.
2.1.2. Tractor
A Musso vehicle is modified as the tractor. Air compressor, data acquisition system (DAQ), amplifier and power supply unit are mounted on the vehicle. Air compressor is used to maintain continuous contact between the trailer and the ground and the pressure is set up to approximately 7kg/cm2 through trial and error procedure at speed 5km/h.
The data acquisition system is a PC-based measuring system which is an industrial PC built in DAQ boards considering the environment of measurement
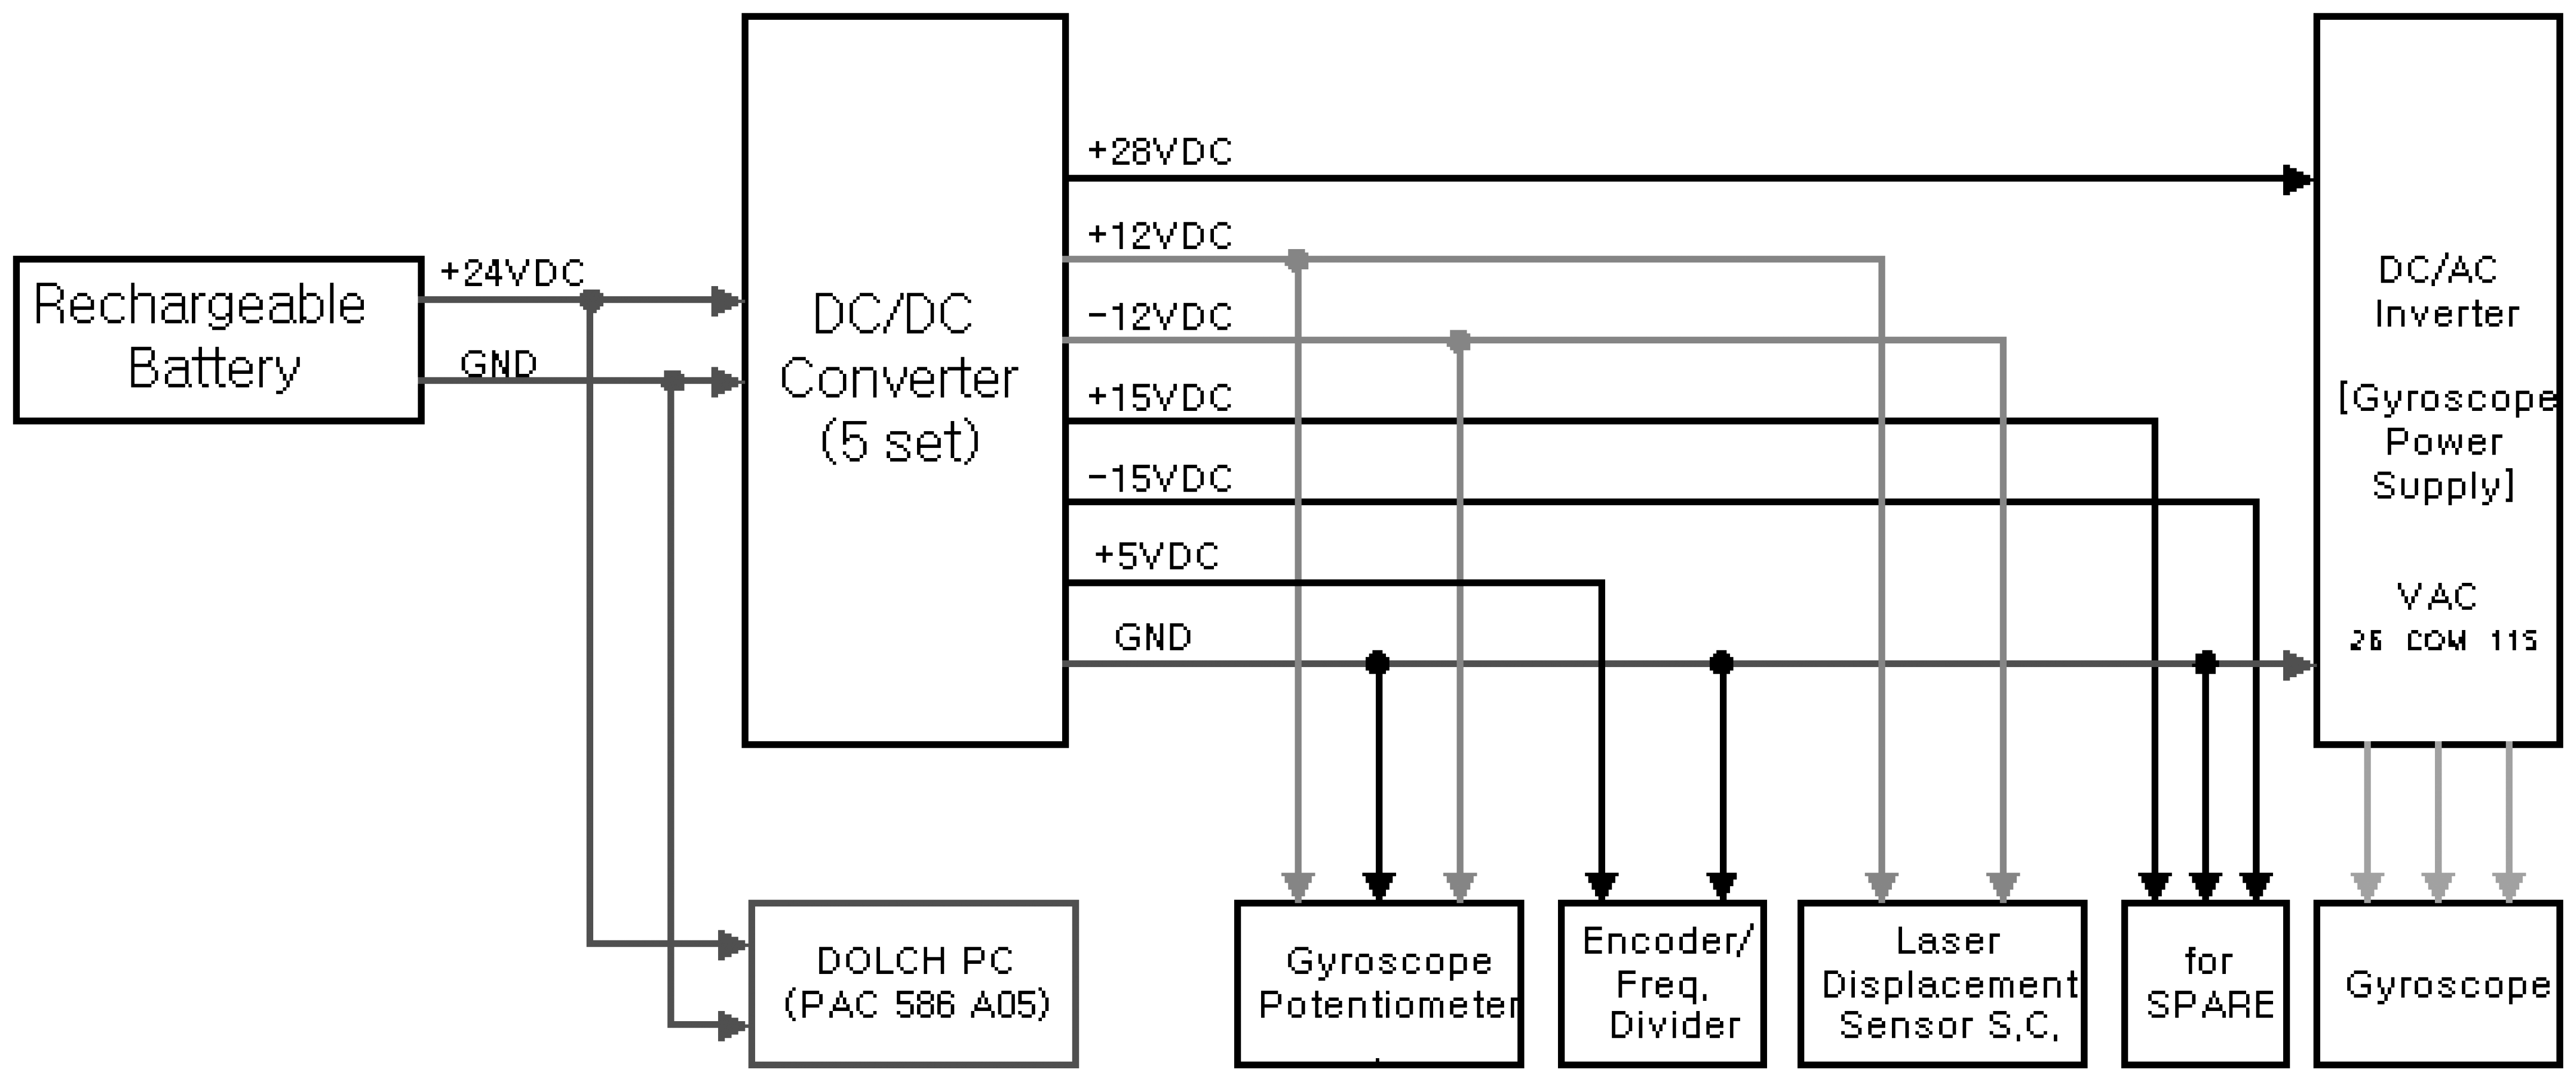
The power supply unit provides 24 VDC to the sensors on the trailer and the data acquisition system and amplifier on the tractor.
Figure 2 shows the configuration of power system for instrumentation system.
2.2. Components of Software
2.2.1. Generating Algorithm for profile
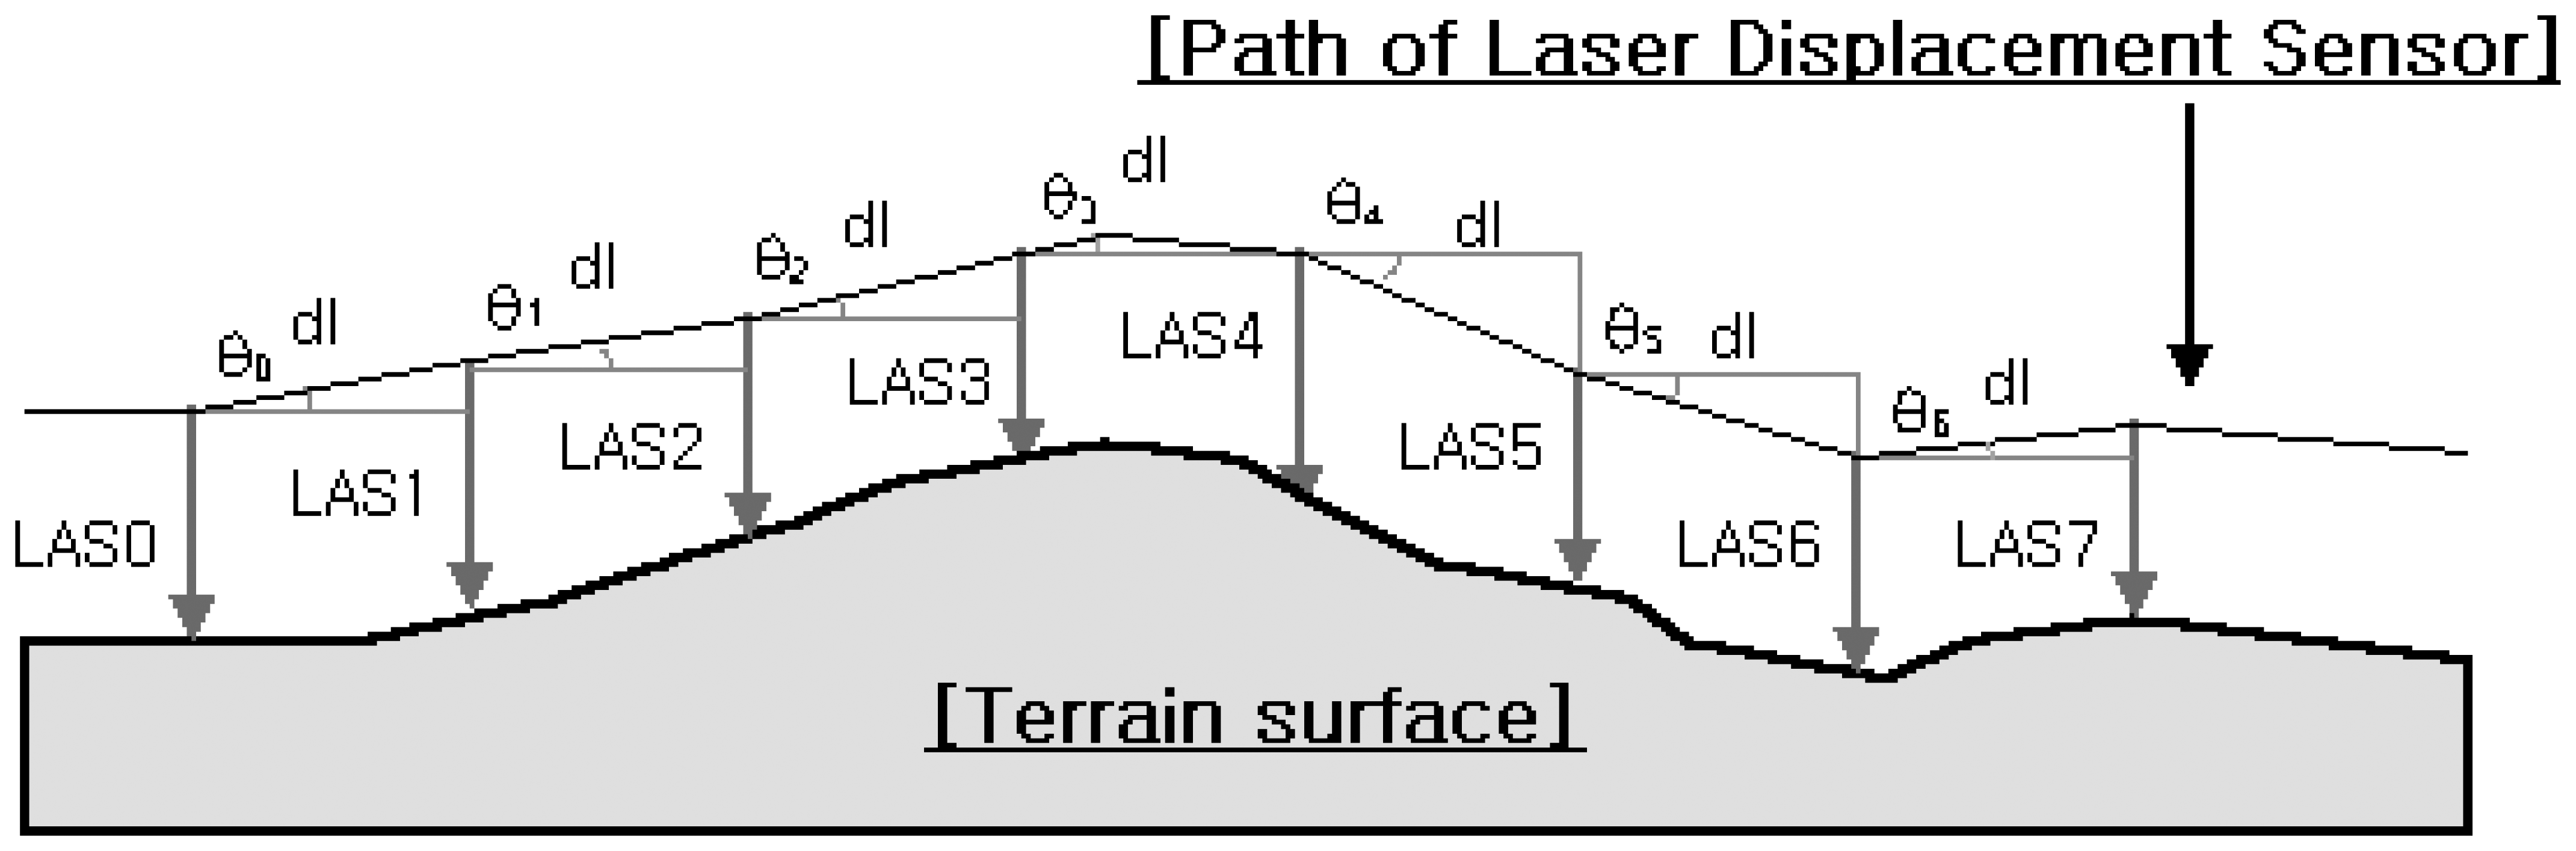
The Generating Algorithm reproduces a real profile using the pitch angle (θ), roll angle (ϕ) and vertical distance acquired from sensors on the trailer.
Eq.(1) is used to decide a moving trace of the trailer midpoint and
Eq.(2) is used to get position coordinates of right and left laser sensors from the rolling motion of frame.
Here, xmp is forward trace of the trailer midpoint and ymp is vertical distance of the trailer.
yr and yl are right and left vertical position of laser sensors. The distance between laser sensor and trailer midpoint is
.
Here,
LASl and
LASr are vertical displacements at the both sides of the trailer.
yr and
yl are the right and left terrain profiles, respectively. The trace of laser displacement sensor is shown in
Figure 3.
Above equations are assumed that the laser sensor is vertical direction to the terrain surface, and it is necessary to correct the laser displacement sensor owing to the pitch and roll motion of the trailer. So the amended right and left profile are shown in
Eq.(4).
The profiles for terrain surface can be acquired from the
Eq.(4) but the sampling interval to the horizontal distance is not normalized. So it is necessary to normalize the data to correspond to sampling in equal increments of horizontal distance using the linear interpolation method such as
Eq.(5).
ylm and yrm represent the linear interpolated final profile and xr(i) is the normalized i-th sampling interval to the horizontal direction.
There are some errors owing to the approximate values in the
Eq.5, but those are decreased when the sampling interval is smaller. The sampling rate applied this system, dl = 9.6cm, can be ignored considering the characteristics of terrain profile.
2.2.2. Analyzing Algorithms for profile severity
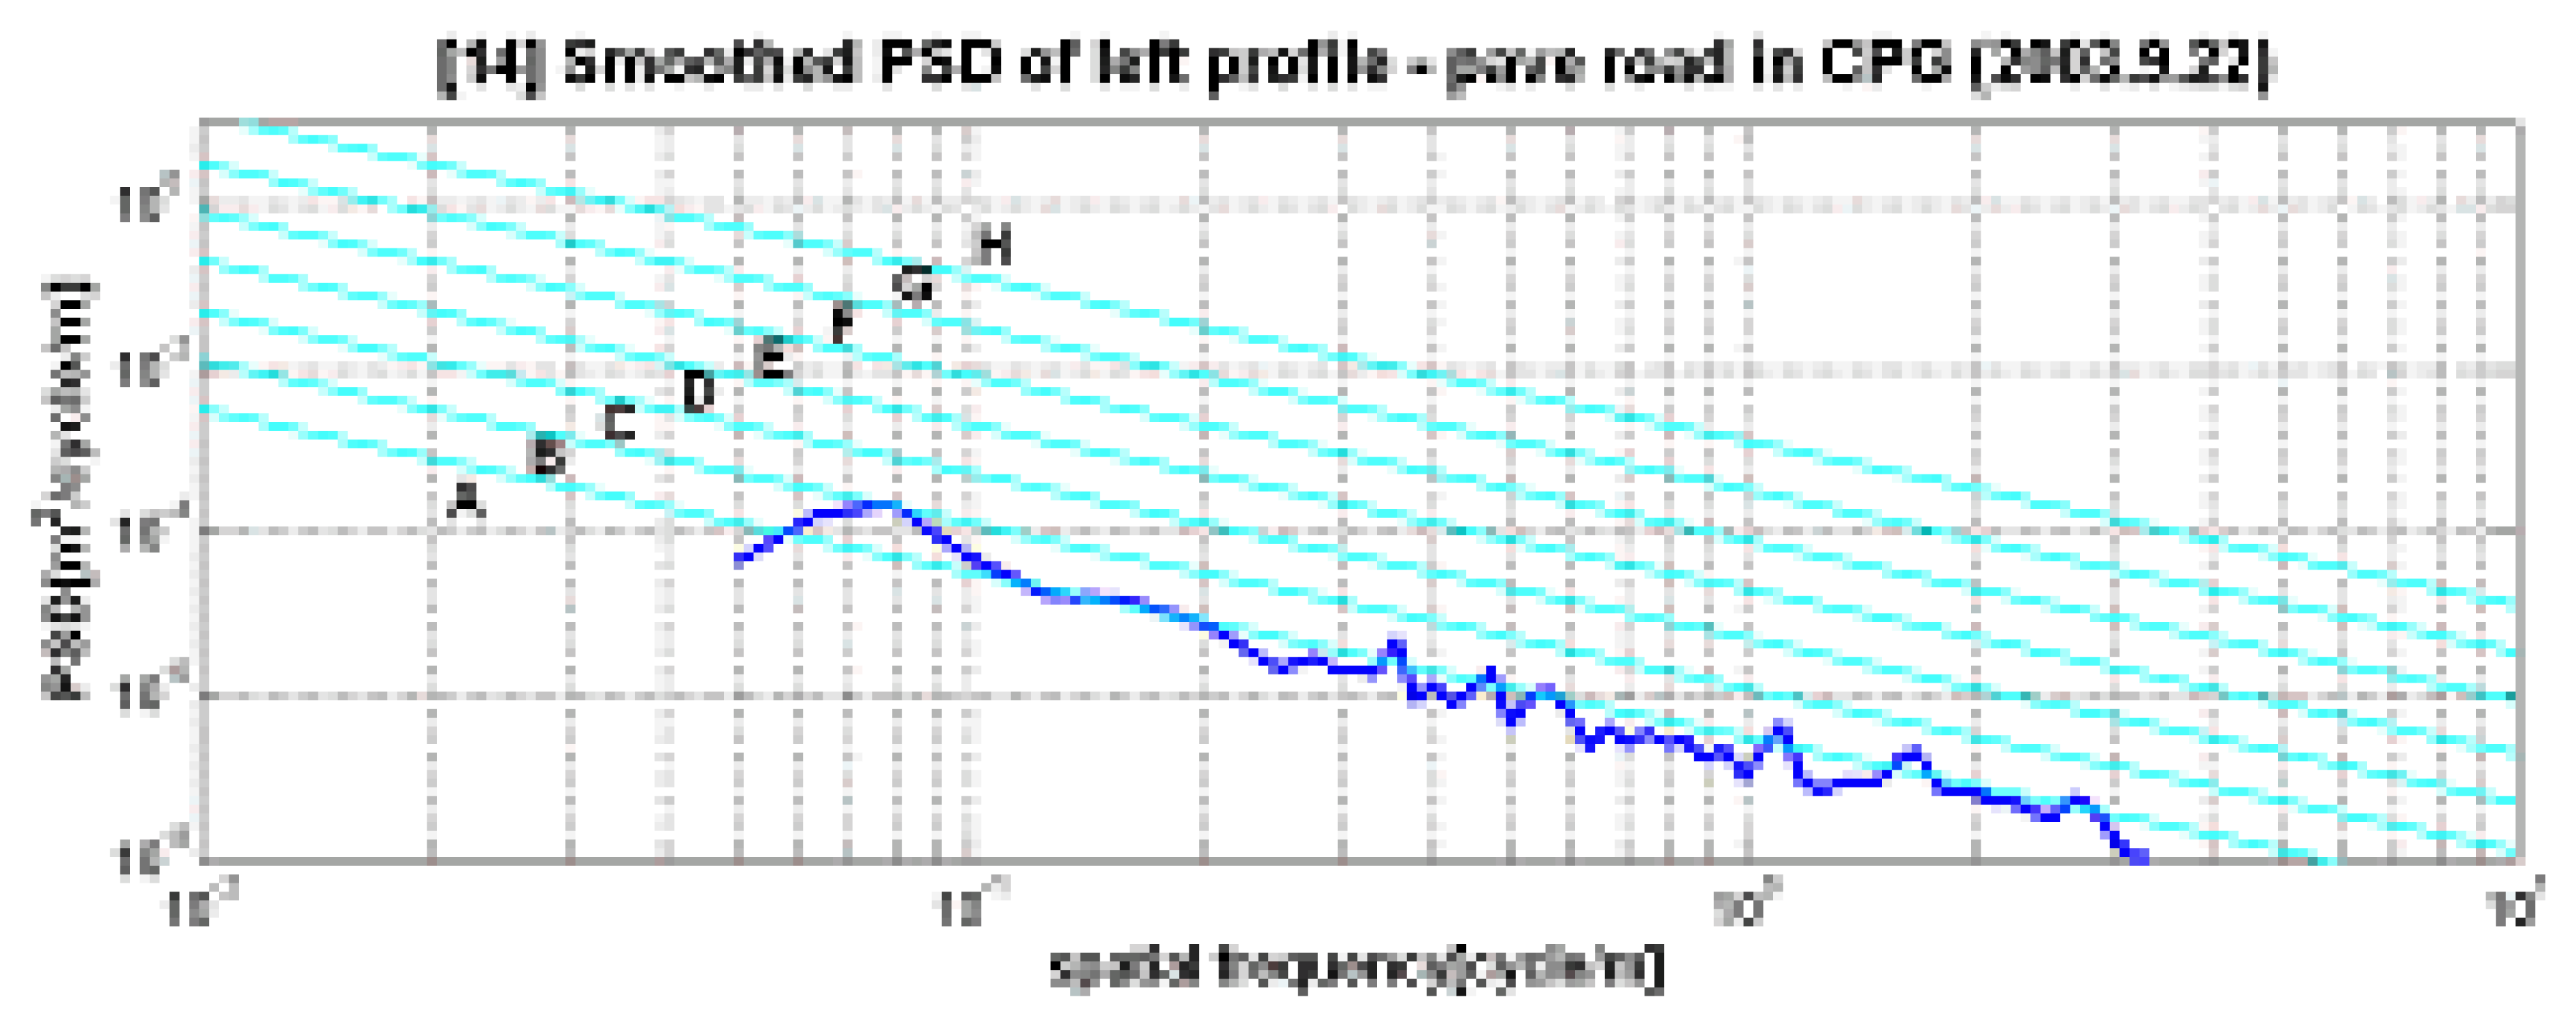
It is important that the profile acquired by the generating algorithm is managed to severity type. The algorithms to evaluate the severity comply with road grade classification according to ISO 8608 standard [
7]. The road profile collected from the
Eq.(5) goes through process of band pass filtering to get the frequency components of interesting band affecting suspension and frame of a vehicle.
ISO 8608 standard requires approximately one third sampling rate as the cutoff frequency to get over the aliasing and recommends 0.05cycle/m for detrending. Considering the sampling rate (9.6 cm) of the profilometer, that is about 0.05-3.46 cycle/m from the viewpoint of spatial frequency. It means that the interesting frequency band to the profilometer is 0.3-20 m/cycle.
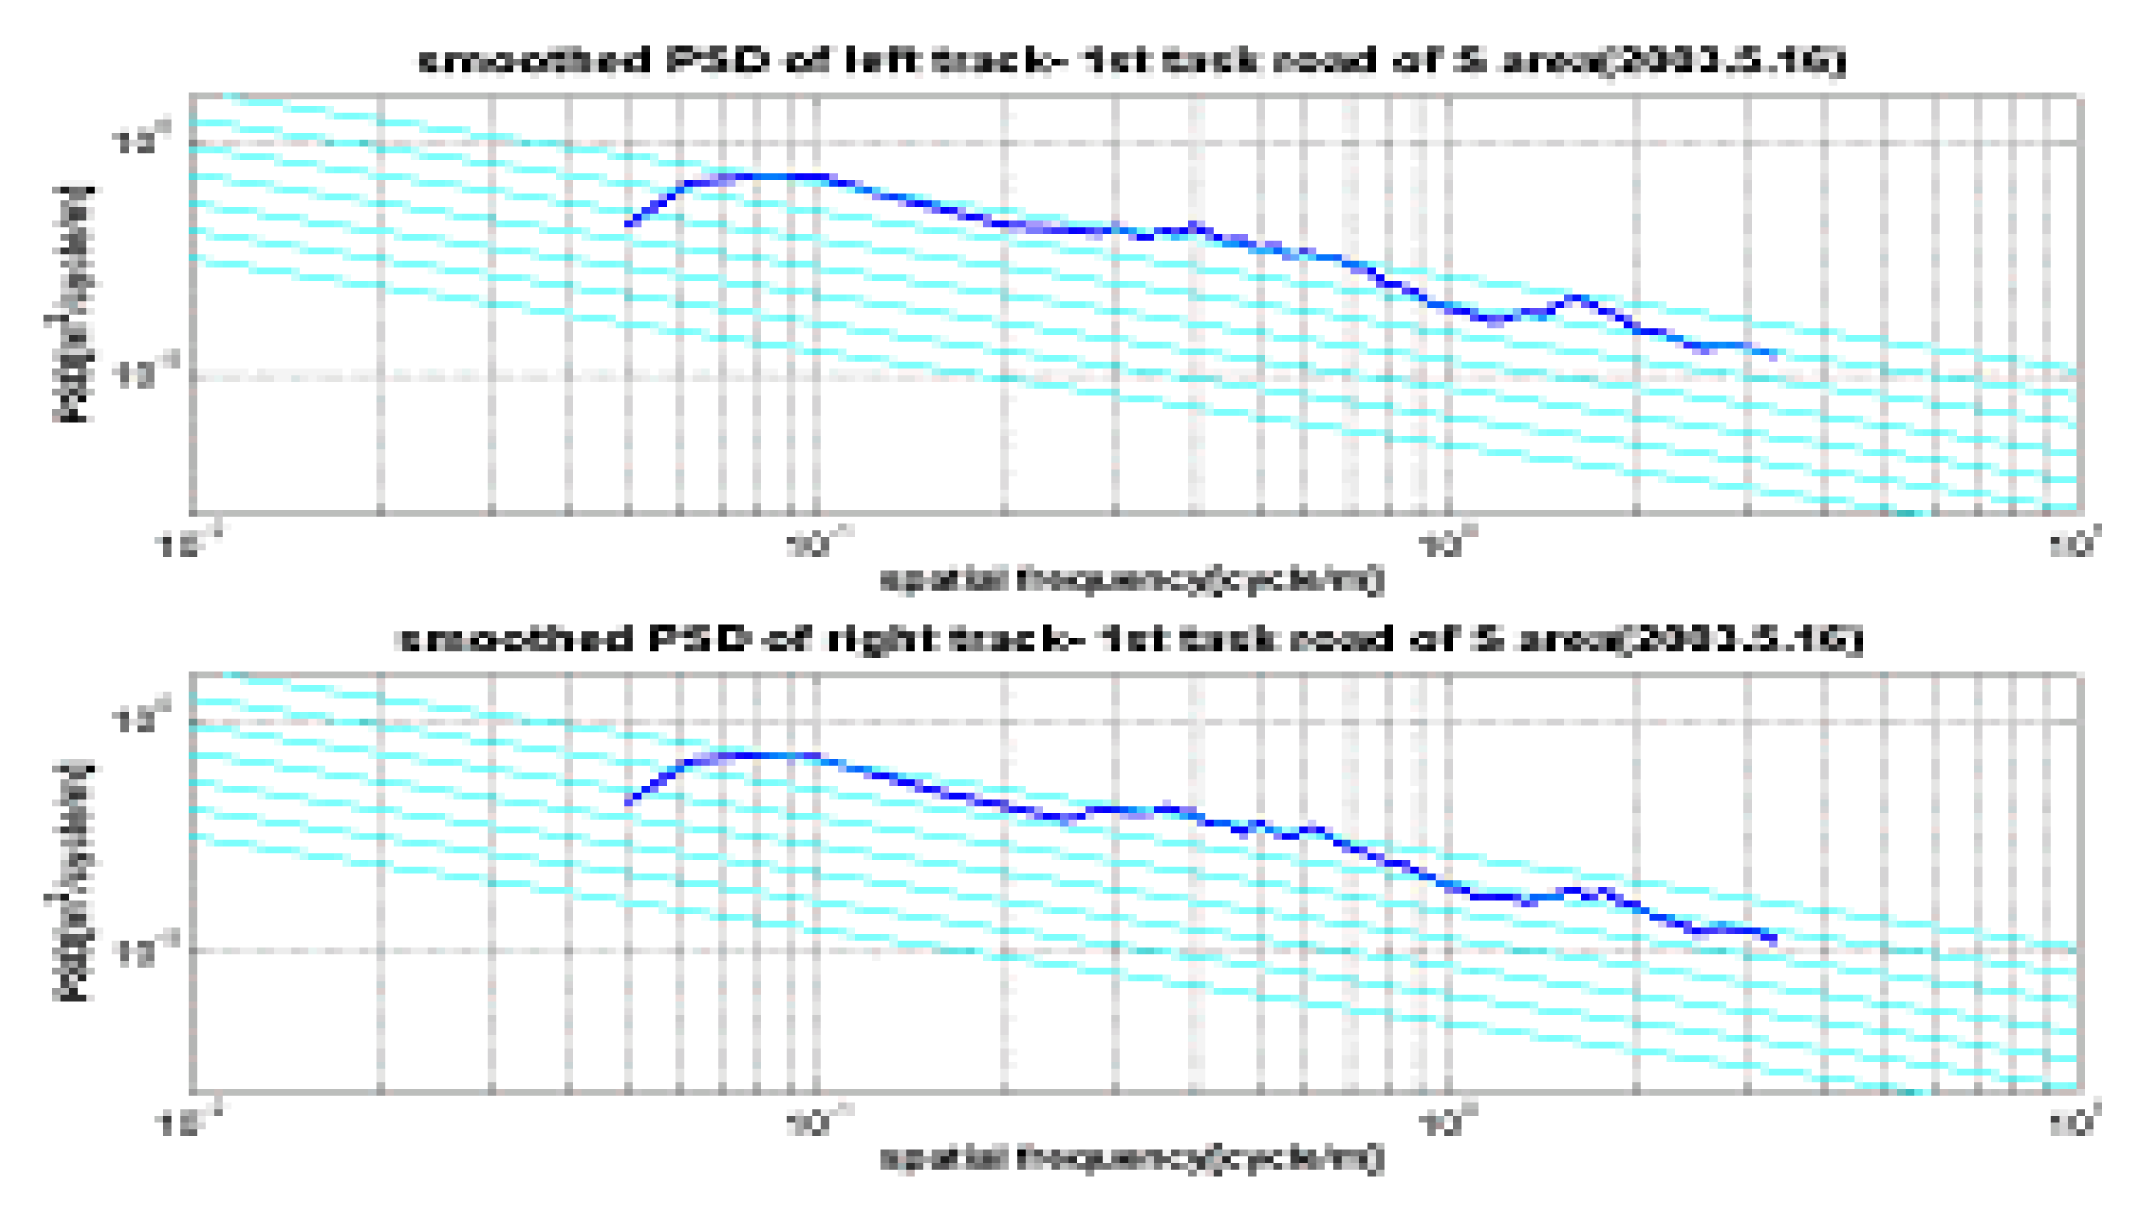
Power Spectral Density (PSD) is used to evaluate the severity of road profile. The algorithms use the 5-th Butterworth filter, hanning window and PSD smoothing method [
7,
10] for signal processing. FFT block size is 1024 points.
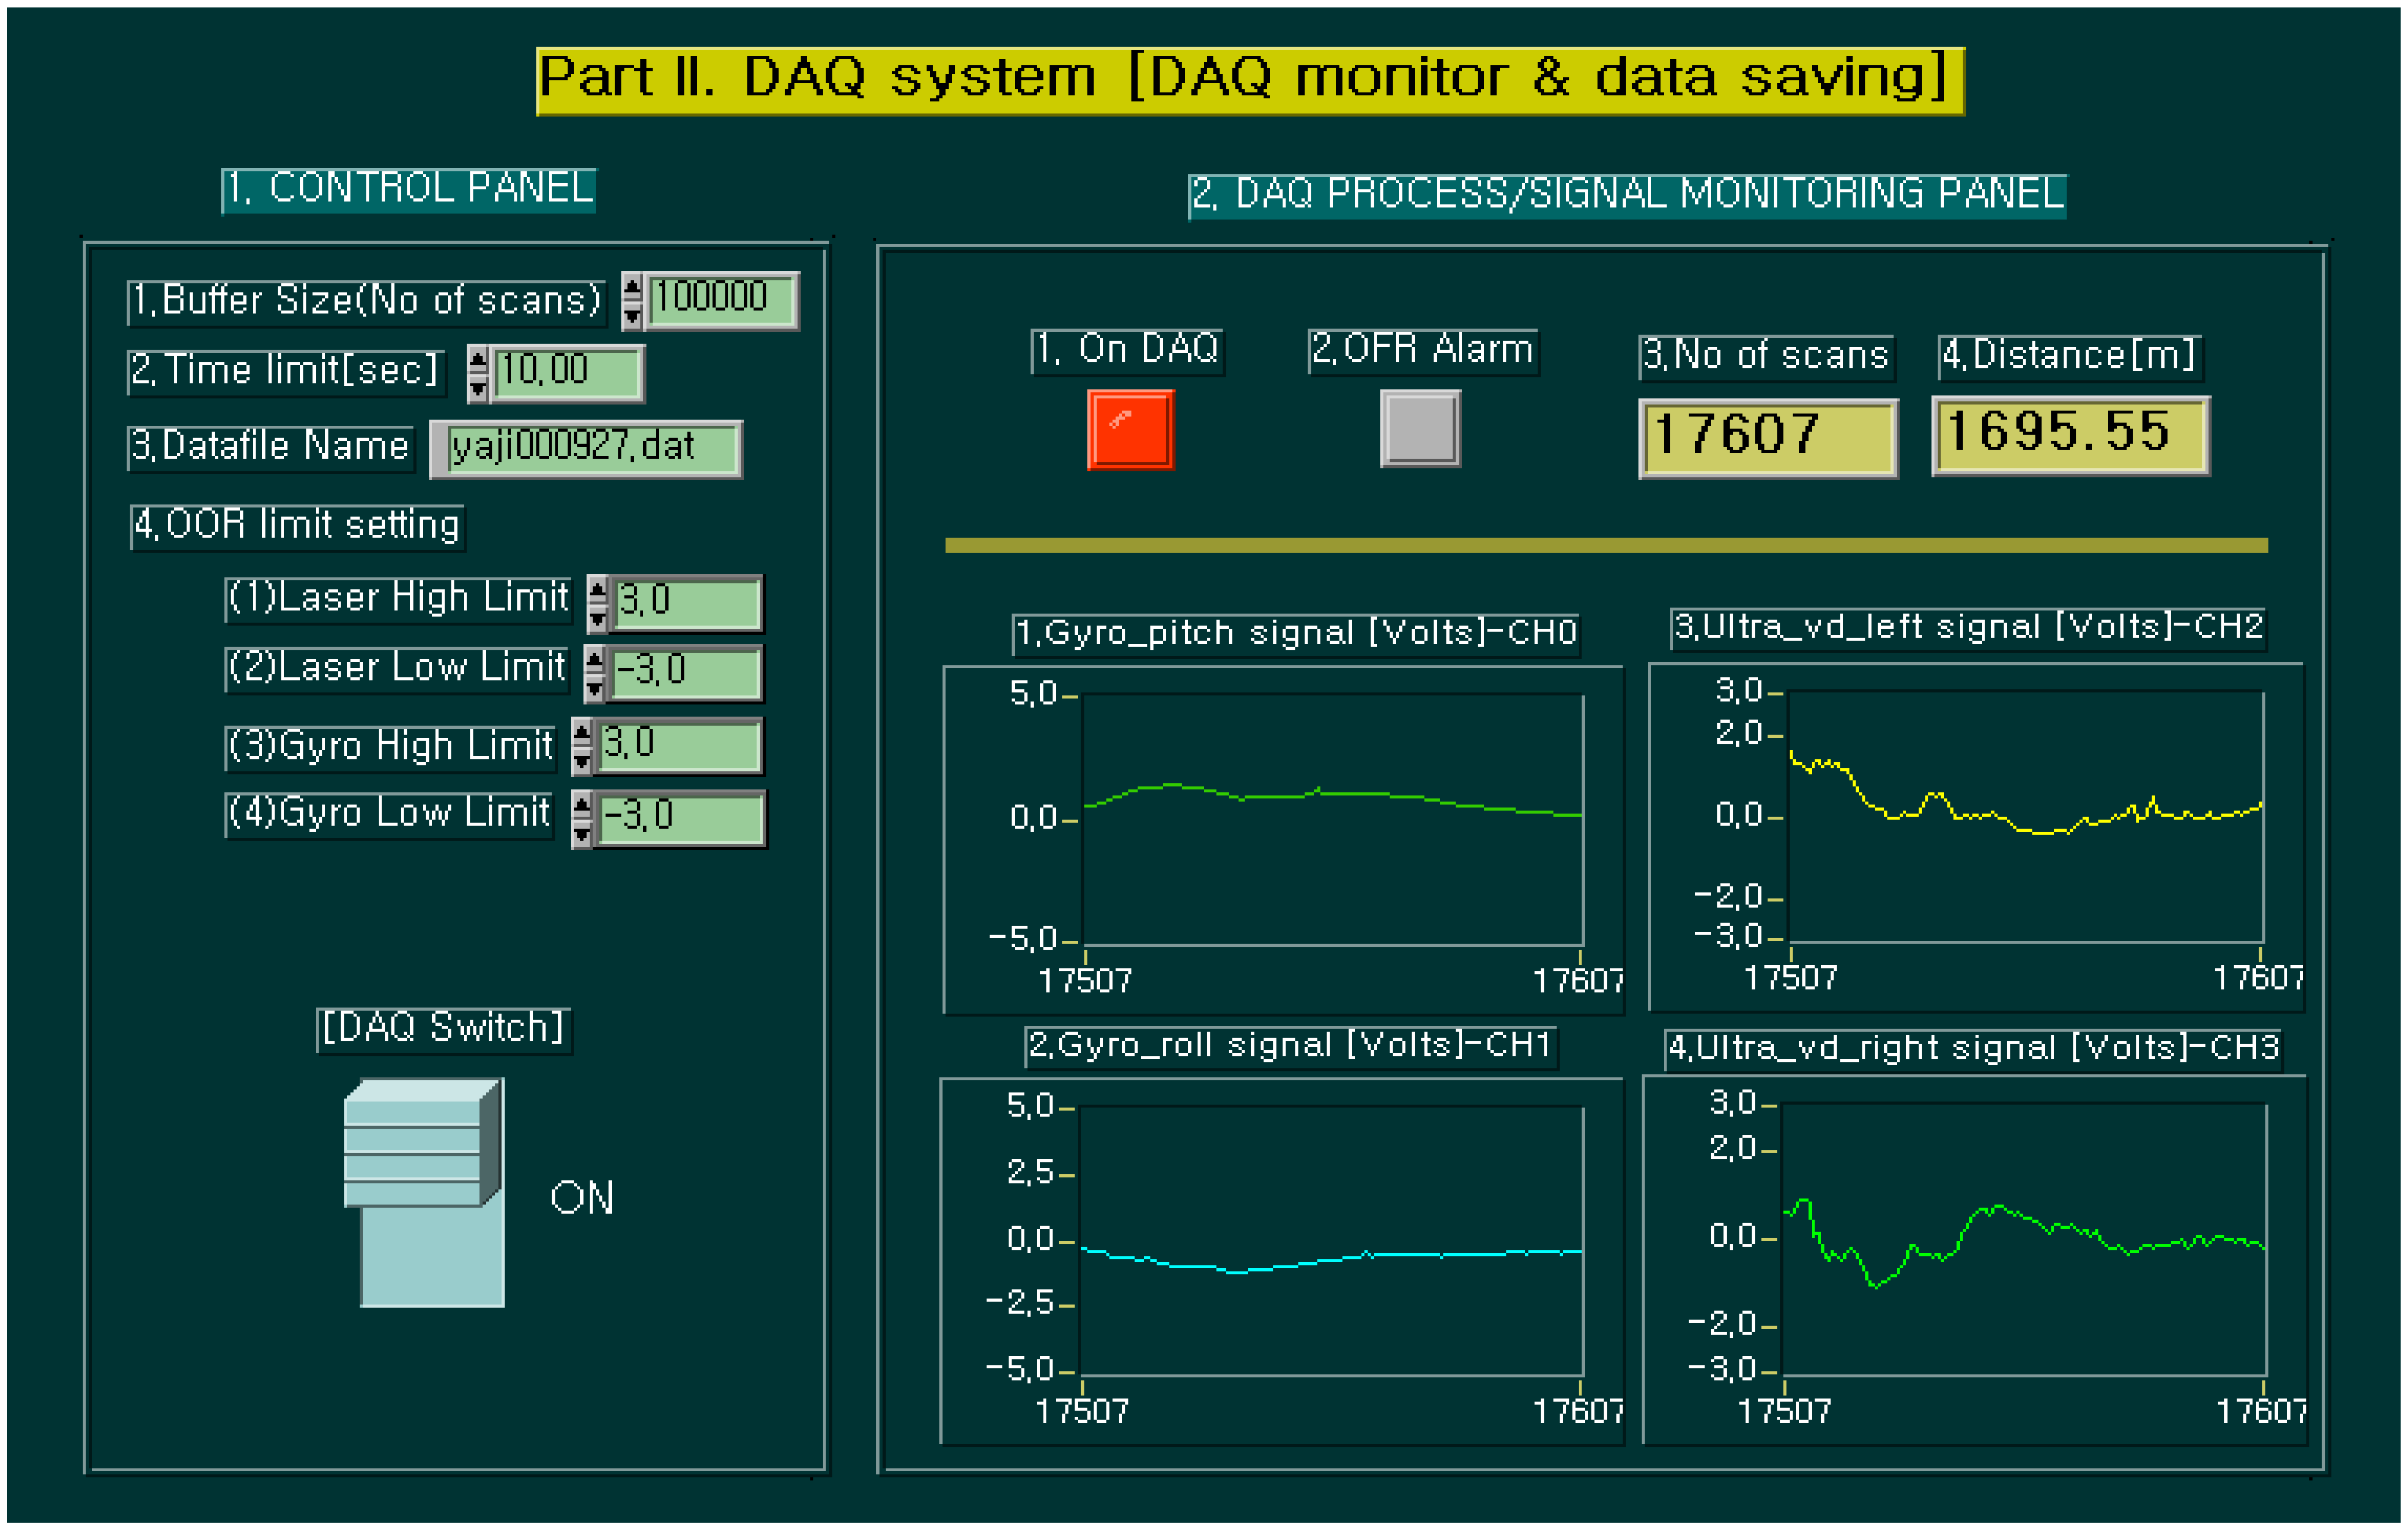
2.2.3. Operating Program
The operating program to get the road profile is developed using the LabView(ver.5.0). The program consists of measuring information part, data acquisition part and data confirmation part. In the measuring information part, measuring information, such as measuring date, road type, running direction, etc., is recorded and saved.
In the data acquisition part, measuring data is monitored and saved. The data confirmation part checks the normality of acquired data.
Figure 4 shows the data acquisition part. In this part, a tester can monitor the acquired data in real time and check the bad operation of sensors by lighting the OFR(out of range) warning lamp.
2.3. Proof of profilometer
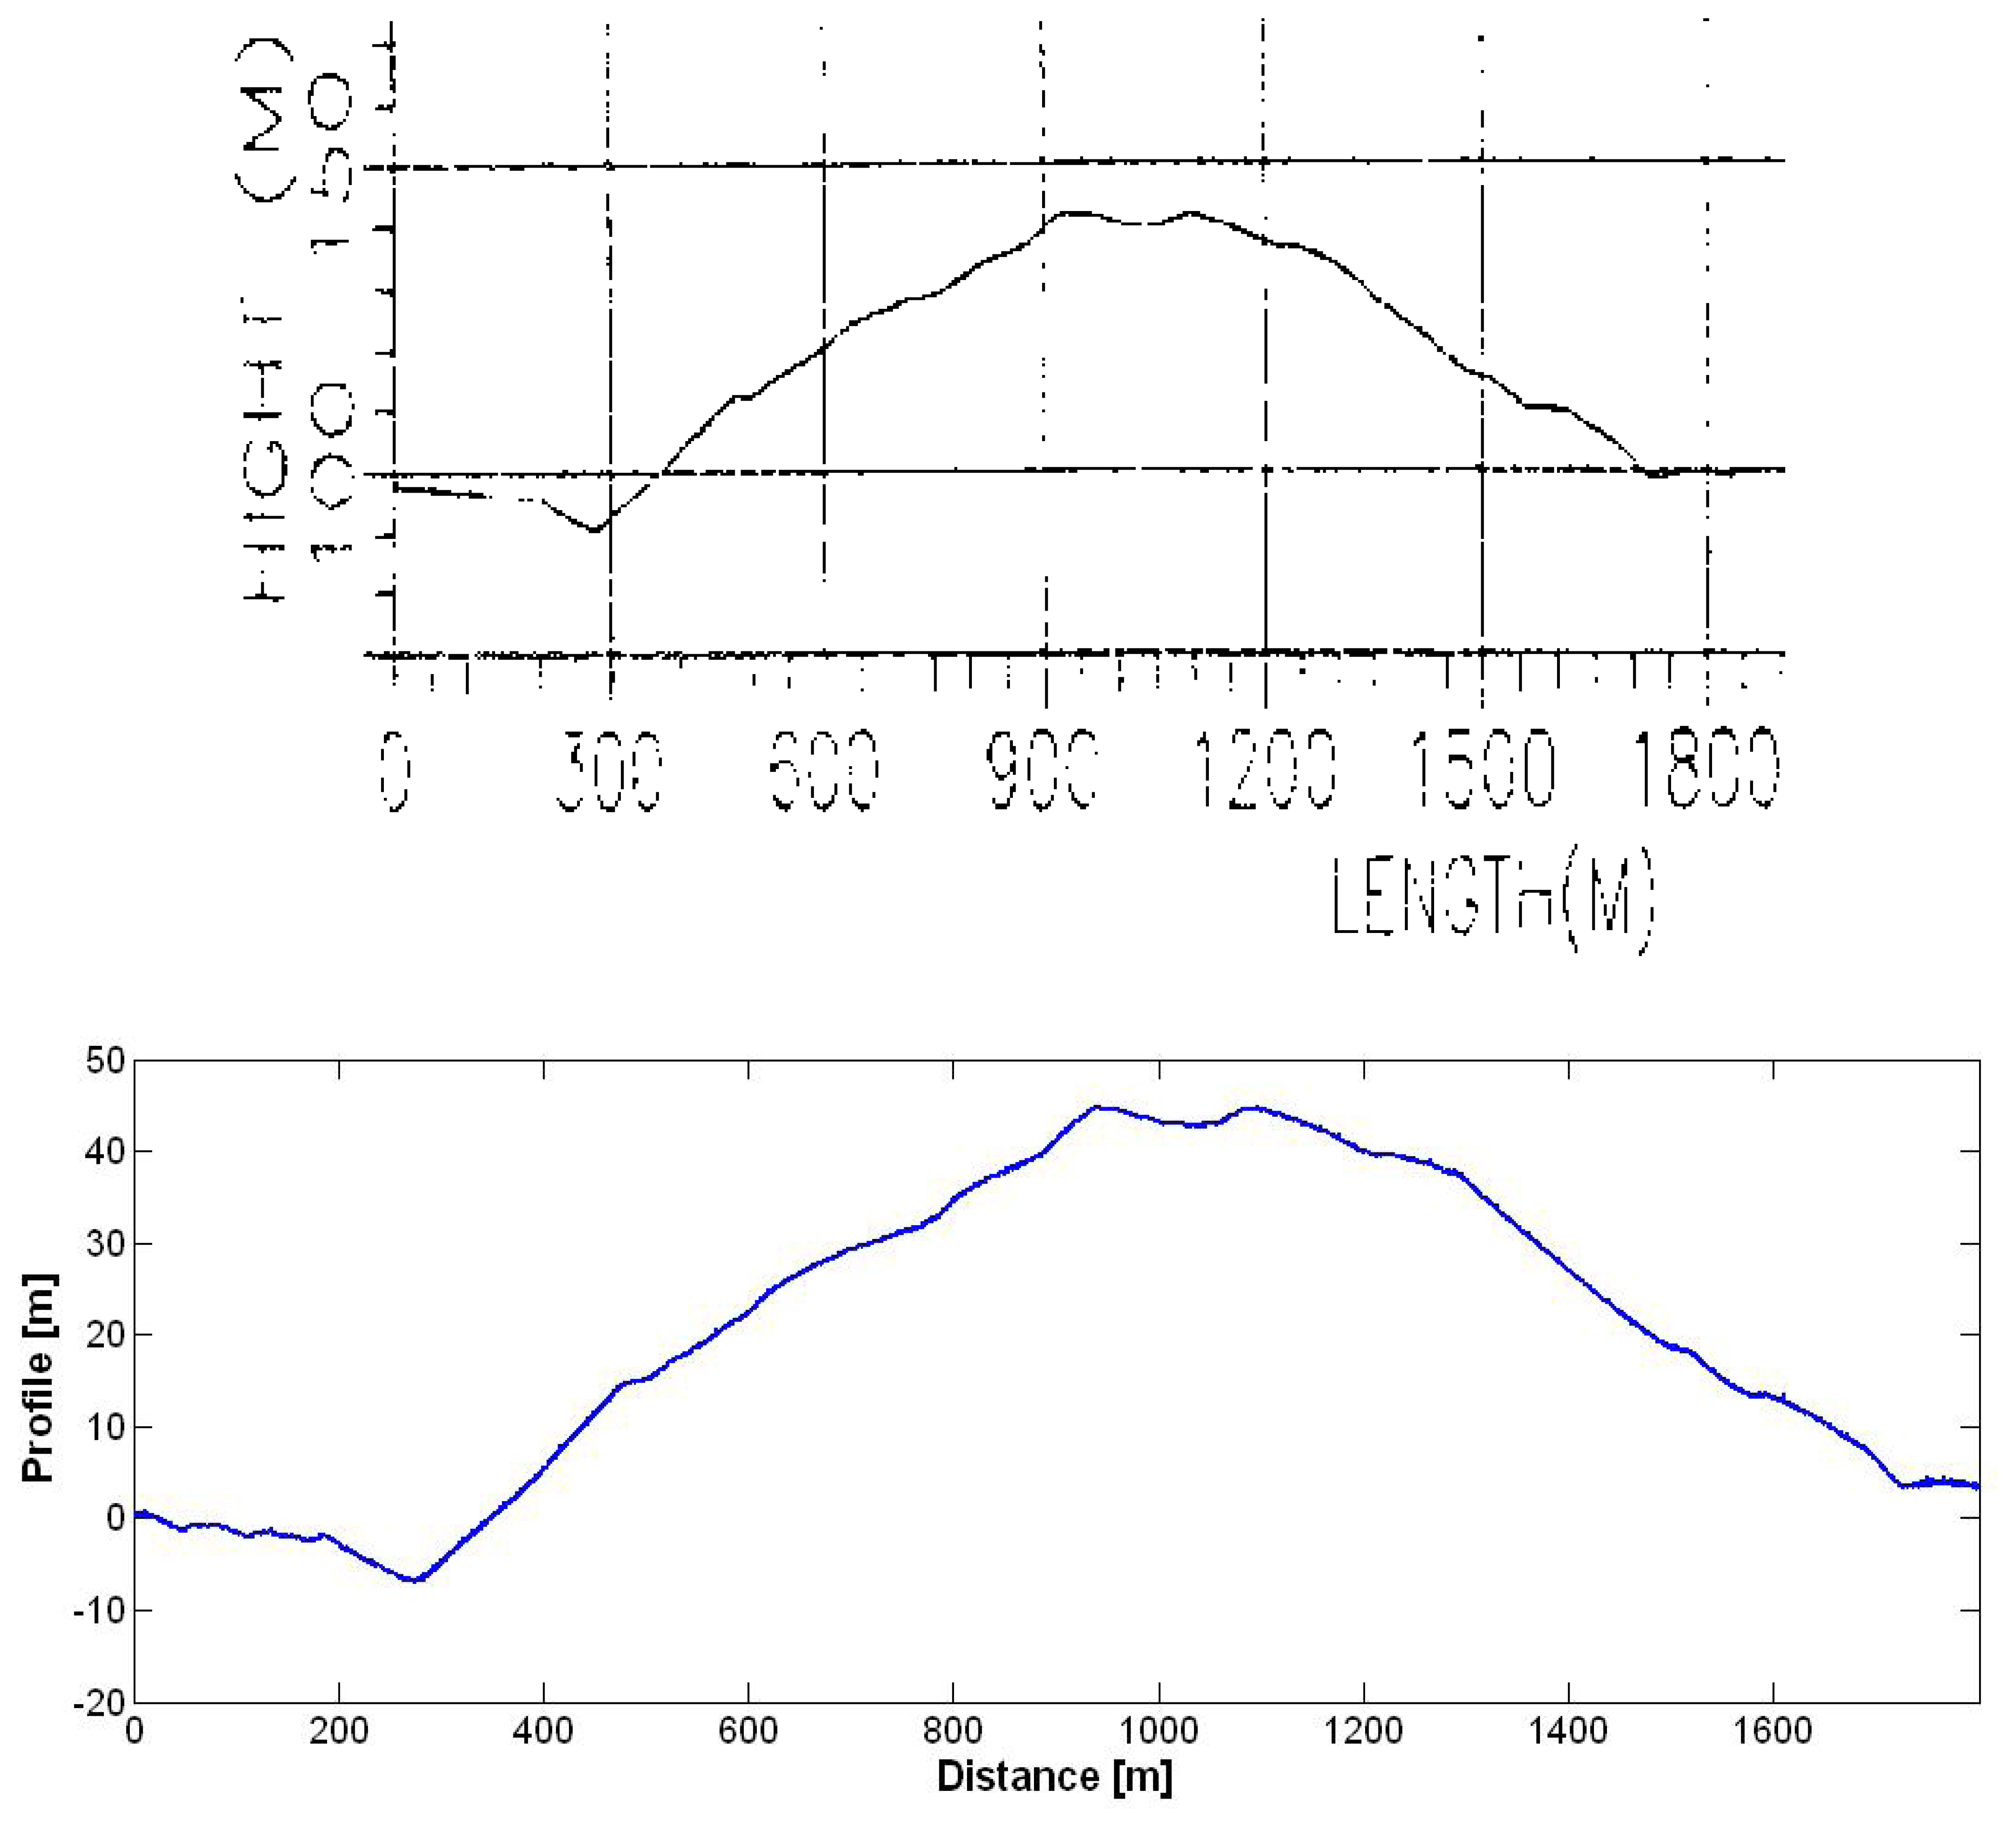
To confirm the performance of profilometer, it is carried out to measure on the known road profiles that are gravel test course as shown
Figure 5 and
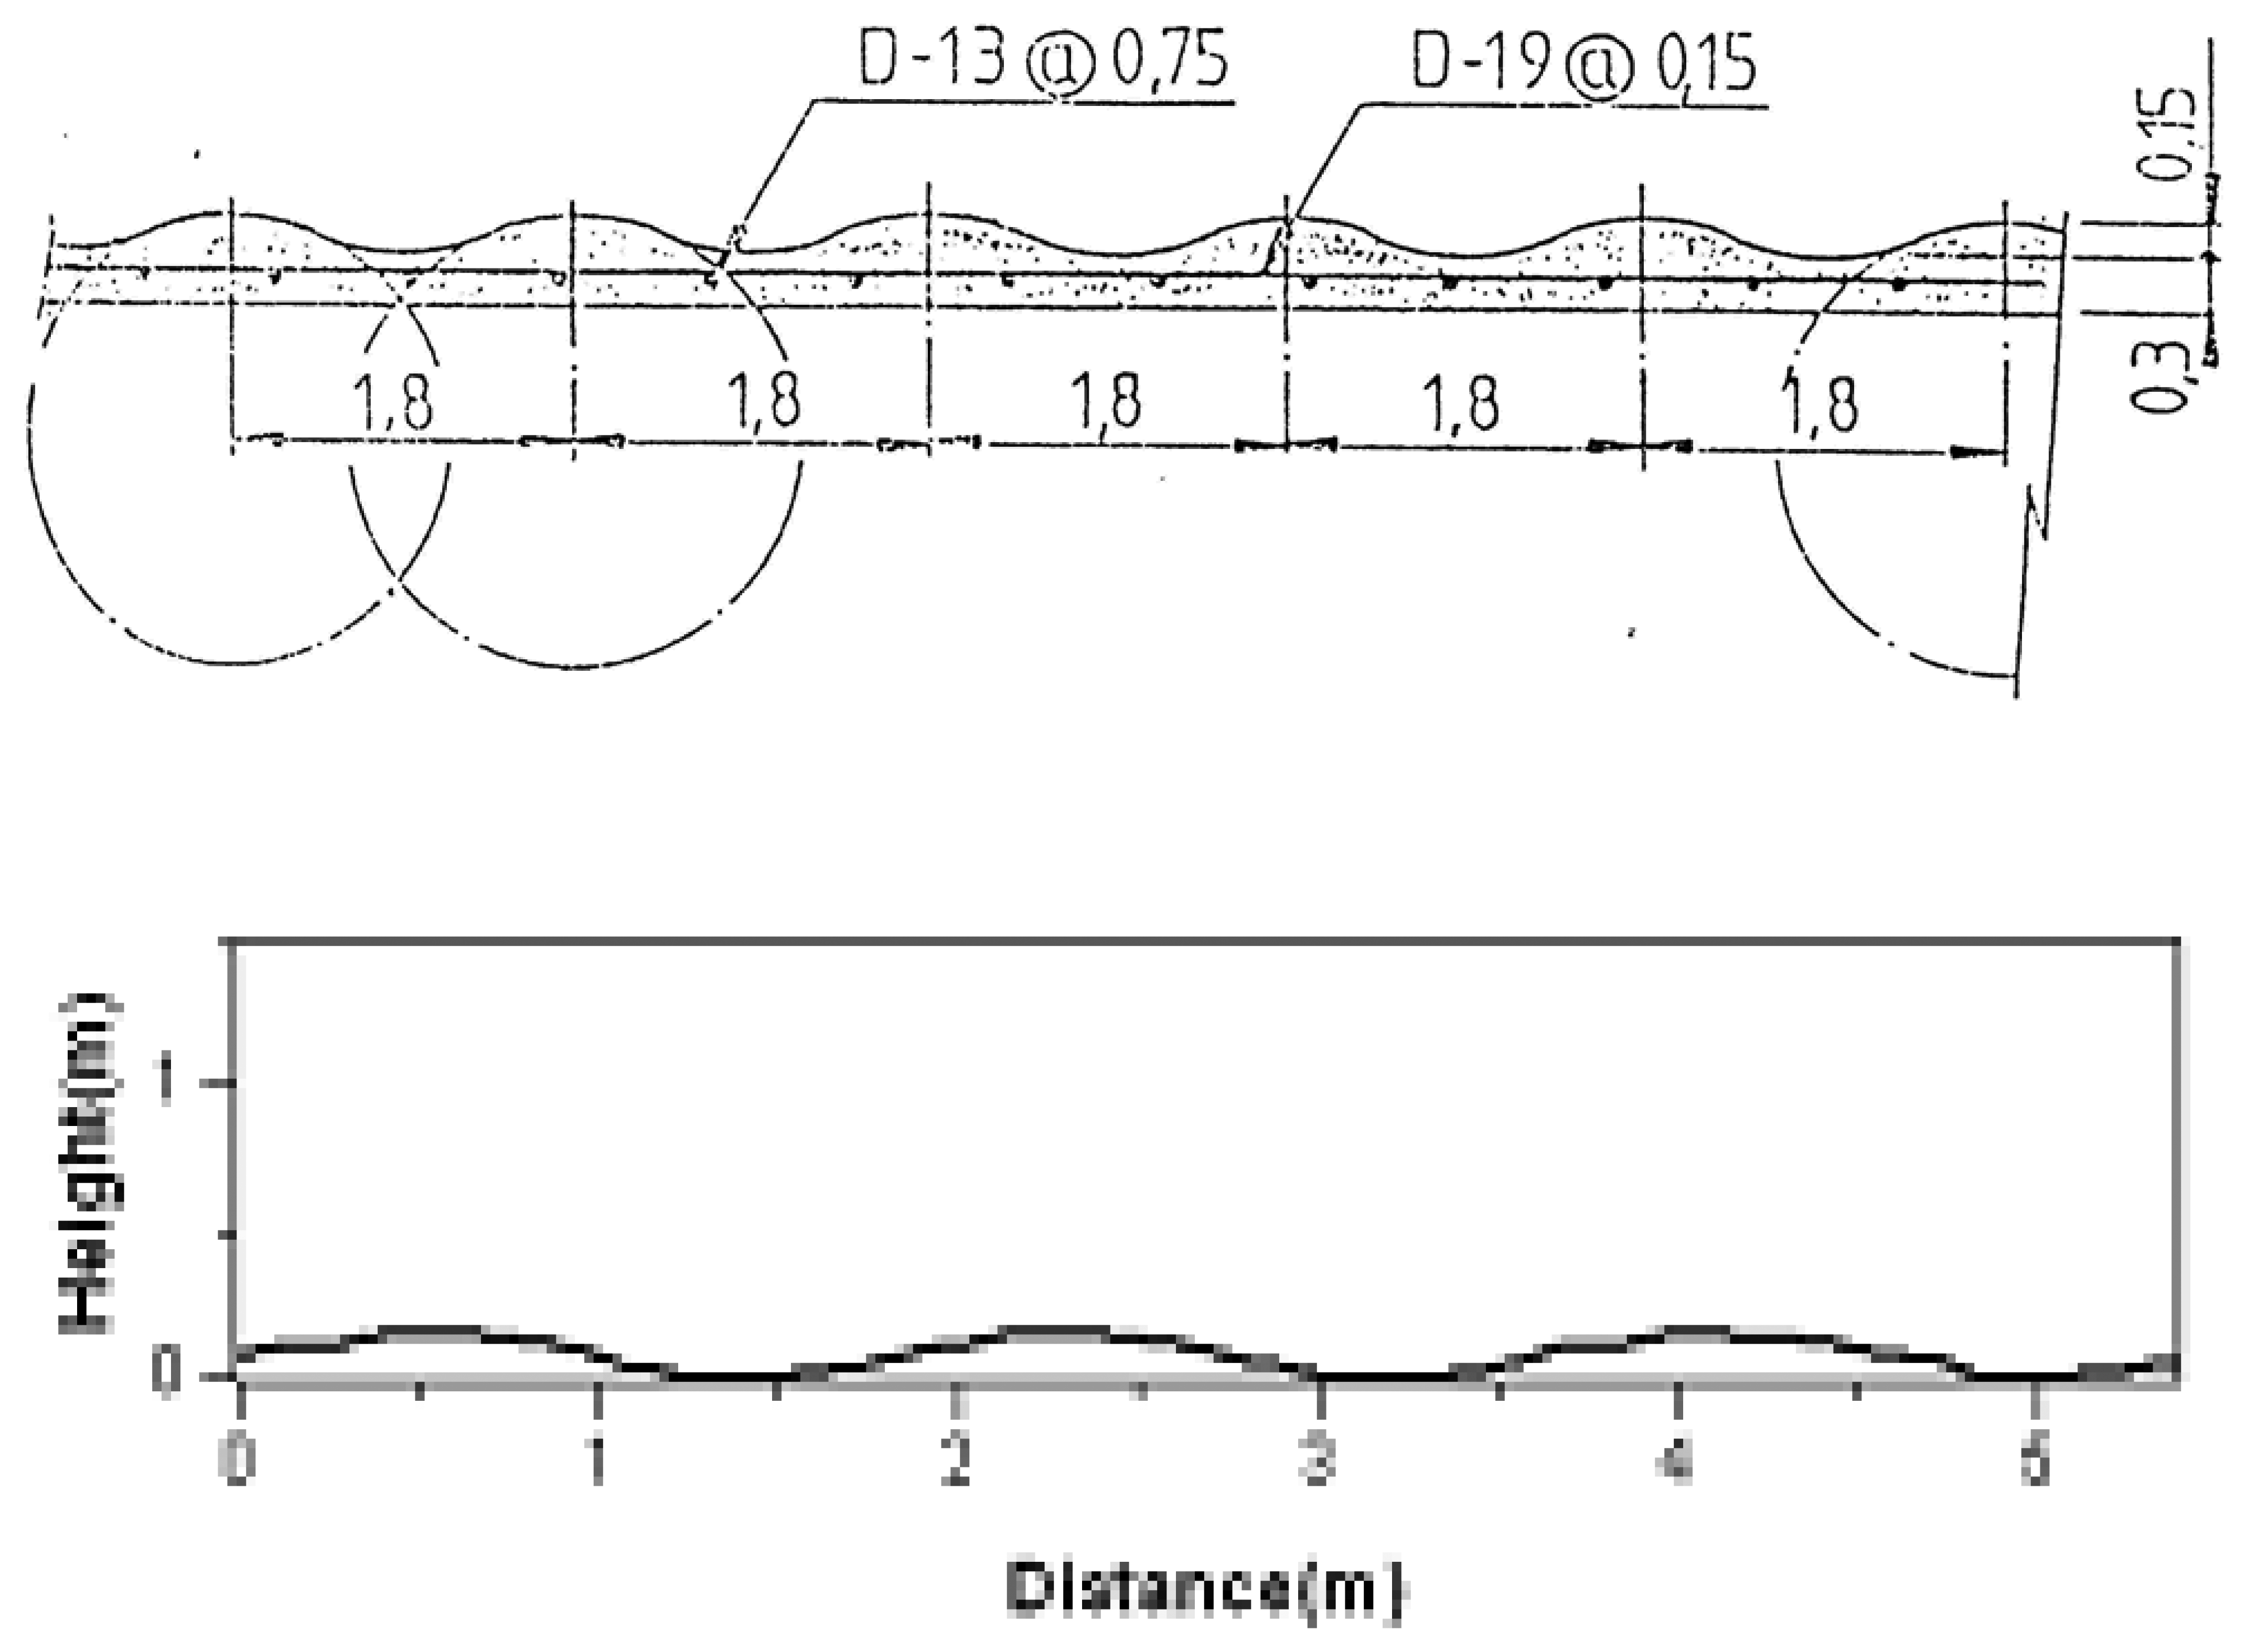
6 inch washboard course as shown
Figure 6.
Figure 5 shows the overall profile shape to the gravel test course at the CPG. The top plot is the shape acquired by the Road and Level Survey method and the bottom plot is the result acquired by the profilometer.
At a comparison between the two, the profile shapes are substantially the same.
Figure 6 shows the 6 inch washboard. To confirm the measuring ability for high frequency characteristics of the profilometer, the top plot is the drawing of 6 inch washboard and the bottom plot is the result acquired by the profilometer. Comparing between the two, it can be seen that the latter corresponds well to the former


