Spatio-Temporal Analysis of Forest Fire Risk and Danger Using LANDSAT Imagery

Abstract
:1. Introduction
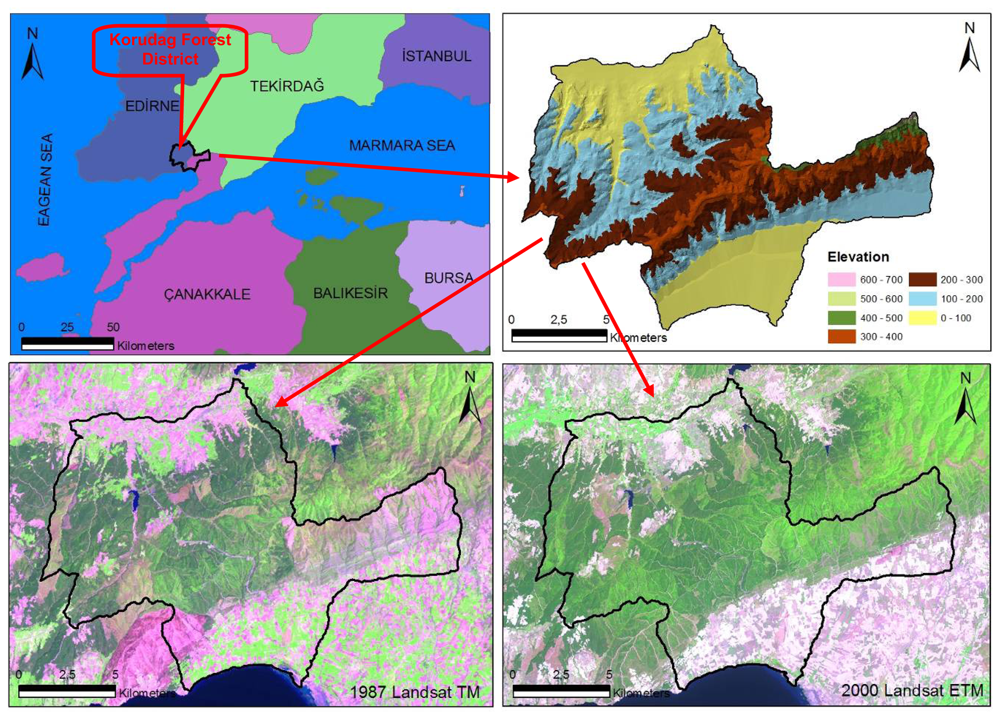
2. Study Area
3. Materials and Methods
3.1. Geometric Correction of Landsat Images and Digitizing Stand Type Maps
3.2. Image Classification of the 1987 Landsat TM and 2001 Landsat ETM Images
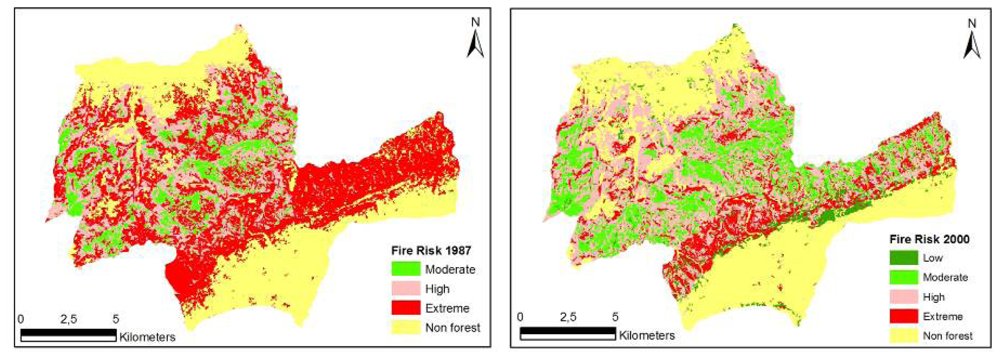
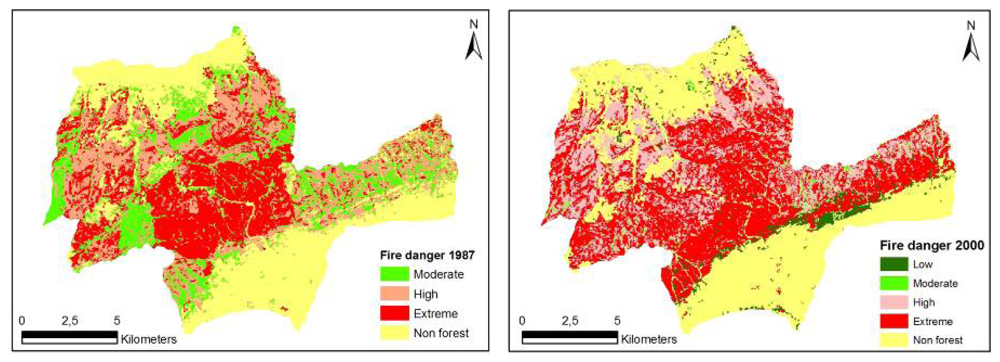
3.3. Determination of fire risk and danger potential indices
- FRI = 10SCi + 2ALj + 2SAk + 3Sl + 2ISm
4. Results
5. Discussion
Acknowledgments
References
- OGM. Orman Alasi; Orman Genel Mudurlugu: Ankara, 2007; p. 88. [Google Scholar]
- Jia, G.J.; Burke, I.C.; Goetz, A.F.H.; Kaufmann, M.R.; Kindel, B. C. Assessing spatial patterns of forest fuel using AVIRIS data. Remote Sens. Environ. 2006, 102, 318–327. [Google Scholar]
- Preisler, H.K.; Brilllinger, D. R.; Burgan, R. E.; Benoit, J. W. Probability based models for estimation of wildfire risk. Int. J. Wild. Fire 2004, 13, 133–142. [Google Scholar]
- Pennanen, J. Forest age distribution under mixed-severity fire regimes- a simulation-based analysis for middle boreal Fennoscandia. Silva Fenn. 2002, 36, 213–231. [Google Scholar]
- Dwire, K.A.; Kauffman, J. B. Fire and riparian ecosystems in landscapes of the western USA. Forest Ecol. Manag. 2003, 178, 61–74. [Google Scholar]
- Laughlin, D. C.; Bakker, J. D.; Stoddard, M. T.; Daniels, M. L.; Springer, J. D.; Gildar, C. N.; et al. Toward reference conditions: Wildfire effects on flora in an old-growth ponderosa pine forest. Forest Ecol. Manag. 2004, 199, 137–152. [Google Scholar]
- Başkent, E.Z.; Kadıoğulları, A.İ. Spatial and temporal Dynamics of land use pattern in Turkey: A case study in İnegöl. Landscape Urban Plan. 2007, 81, 316–327. [Google Scholar]
- Kadıoğulları, A.İ.; Başkent, E.Z. Spatial and temporal Dynamics of land use pattern in Turkey: A case study in Gümüşhane. Environ. Monit. Assess. 2008, 138, 289–303. [Google Scholar]
- Keeley, J.E.; Fotheringham, C. J.; Morais, M. Reexamining fire suppression impacts on brushland fire regimes. Science 1999, 284, 1829–1832. [Google Scholar]
- Chuvieco, E.; Congalton, R.G. Application of remote sensing and geographic information systems to forest fire hazard mapping. Rem. Sens. Environ. 1989, 29, 147–159. [Google Scholar]
- Bilgili, E.; Saglam, B. Fire Behavior in Maquis in Turkey. Forest Ecol. Manag. 2003, 184, 201–207. [Google Scholar]
- Scott, J. H.; Reinhardt, E.D. Assessing crown fire potential by linking models of surface and crown fire behavior. USDA Forest Service Rocky Mountain Research Station, Research Paper 2001, RP-29, 59. [Google Scholar]
- Ryan, K.C. Dynamic interactions between forest structure and fire behavior in boreal ecosystems. Silva Fenn. 2002, 36, 13–39. [Google Scholar]
- Miller, C.; Urban, D.L. Connectivity of forest fuels and surface fire regimes. Landscape Ecol. 2000, 15, 145–154. [Google Scholar]
- Dinç Durmaz, B.; Bilgili, E.; Kadiogullari, A.I.; Saglam, B.; Kuçuk, O.; Baskent, E.Z. Spatial fire potential analysis and mapping using Landsat satellite imagery and GIS. Proc. International Conference on Forest Fire Research, Figueira da Foz, Portugal, 27- 30 November, 2006-a.
- He, H. S.; Shang, B. Z.; Crow, T. R.; Gustafson, E. J.; Shifley, S. R. Simulating forest fuel and fire risk dynamics across landscapes—LANDIS fuel module design. Ecol. Model. 2004, 180, 135–151. [Google Scholar]
- Lasaponara, R.; Lanorte, A. Remotly sensed characterization of forest fuel types by using satellite ASTER data. Int. J Appl. Earth Obs. 2007, 9, 225–234. [Google Scholar]
- Lasaponara, R.; Lanorte, A.; Pignatti, S. Multiscale fuel type mapping in fragmented ecosystems: preliminary results from Hyperspectral MIVIS and Multispectral Landsat TM data. Int. J. Remote Sens. 2006, 27, 587–593. [Google Scholar]
- Hyyppa, J.; Hyyppa, H.; Inkinen, M.; Engdahl, M.; Linko, S.; Zhu, Y.H. Accuracy comparison of various remote sensing data sources in the retrieval of forest stand attributes. Forest Ecol. Manag. 2000, 128, 109–120. [Google Scholar]
- Prosper-Laget, V.; Dougue'droit, A.; Guinot, J.P. Mapping the risk of forest fire occurrence using NOAA satellite information. EARSeL Adv. Remote Sens. 1995, 4, 30–38. [Google Scholar]
- Dennison, P.E.; Roberts, D.A.; Thorgusen, S.R.; Regelbrugge, J.C.; Weise, D.; Lee, C. Modeling seasonal changes in live fuel moisture and equivalent water thickness using a cumulative water balance index. Remote Sens. Environ. 2003, 88, 442–452. [Google Scholar]
- Kucuk, Ö.; Bilgili, E.; Saglam, B. Estimating crown fuel loading for calabrian pine and Anatolian black pine. Int. J. Wild. Fire 2008, 17, 147–154. [Google Scholar]
- Kucuk, Ö.; Bilgili, E. Crown Fuel Characteristics and Fuel Load Estimates In Young Calabrian Pine (Pinus BrutiaTen.) Stands In Northwestern Turkey. Fresen. Environ. Bull. 2008, (in press). [Google Scholar]
- Sağlam, B.; Küçük, Ö.; Bilgili, E.; Dinç Durmaz, B.; Baysal, İ. Estimating fuel biomass of some shrubs species (Maquis) in Turkey. Turk. J. Agric. For. 2008, 32. (in press). [Google Scholar]
- Burgan, R.E.; Klaver, R.W.; Klaver, J.M. Fuel models and fire potential from satellite and surface observations. Int. J. Wild. Fire 1998, 8, 159–170. [Google Scholar]
- Dinc Durmaz, B.; Kadiogullari, A.I.; Bilgili, E.; Baskent, E.Z.; Saglam, B. Mapping Fire Development potential Using Landsat satellite imagery. Workshop on 3D Remote Sensing in Forestry, Vienna, 14-15 February, 2006-b.
- Skowronski, N.; Clark, K.; Nelson, R.; Hom, J.; Patterson, M.; Andersen, H.E.; McGaughey, R.J.; Reutebuch, S.E. Estimating forest canopy fuel parameters using LIDAR data. Remote Sens. Environ. 2005, 94, 441–449. [Google Scholar]
- Anderson, E.S.; Thompson, J.A.; Austin, R.E. LIDAR density and linear interpolator effects on elevation estimates. Int. J. Remote Sens. 2005, 26, 3889–3900. [Google Scholar]
- Lefsky, M.A.; Cohen, W.B.; Harding, D.J.; Parker, G.G.; Acker, S.A.; Gower, S.T. Lidar remote sensing of aboveground biomass in three biomes. Global Ecol. Biogeogr. 2002, 393–400. [Google Scholar]
- Roff, A.; Goodwin, N.; Merton, R. Assessing fuel loads using remote sensing; School of biological earth & environmental science technical report summary; NSW 2052 Australia; The University of New South Wales Sydney, 2005; pp. 11–17. [Google Scholar]
- Andersen, E.H.; McGaughey, J.R.; Reutebuch, E.S. Estimating forest canopy fuel parameters using lidar data. Remote Sens. Environ. 2005, 94, 441–449. [Google Scholar]
- Naesset, E.; Okland, T. Estimating tree height and tree crown properties using airborne scanning laser in a boreal nature reserve. Remote Sens. Environ. 2002, 79, 105–115. [Google Scholar]
- Nelson, R.; Valenti, M.A.; Short, A.; Kelley, C. A multiple resource inventory of Delaware using airborne laser data. Bioscience 2003, 53, 981–992. [Google Scholar]
- Popescu, S.C.; Wynne, R.H.; Nelson, R.F. Measuring individual tree crown diameter with lidar and assessing its influence on estimating forest volume and biomass. Can. J. Remote Sens. 2003, 29, 564–577. [Google Scholar]
- Popescu, S.C.; Wynne, R.H.; Scrivani, J.A. Fusion of small-footprint lidar and multispectral data to estimate plot-level volume and biomass in deciduous and pine forests in Virginia, USA. Forest Sci. 2004, 50, 551–565. [Google Scholar]
- Riano, D.; Meier, E.; Allgower, B.; Chuvieco, E.; Ustin, S.L. Modeling airborne laser scanning data for the spatial generation of critical forest parameters in fire behavior modeling. Remote Sens. Environ. 2003, 86, 177–186. [Google Scholar]
- Mutlu, M.; Popescu, C.S.; Stripling, C.; Spencer, T. Mapping surface fuel models using lidar and multispectral data fusion for fire behavior. Remote Sens. Environ. 2008, 112, 274–285. [Google Scholar]
- Erdas Field Guide. Erdas Imagine 8.6 User Guide; 2002. [Google Scholar]
- Hardy, C.C. Wildland fire hazard and risk: Problems, definitions, and context. Forest Ecol. Manag. 2005, 211, 73–82. [Google Scholar]
- Anonymous. National Wildfire Coordinating Group (NWCG). Glossary of Wildland Fire Terminology. 2003. available on the web: http://www.nwcg.gov/teams/pmo/products/wfglos-sary/content.htm.
- Anonymous. Society of American Foresters. In Glossary of Wildland Fire Management Terms Used in the United States; University of Arizona Press: Tuscon, Arizona, 1990; p. 138. [Google Scholar]
- Anonymous. Society of American Foresters. In The Dictionary of Forestry Society of American Foresters; Bethesda, MD, 1998; p. 210. [Google Scholar]
- Anonymous. Food and Agriculture Organization (FAO). In Wildland fire management terminology; FAO Forestry Paper 70; Food and Agriculture Organization of the United Nations, 1986; p. 257. [Google Scholar]
- Anonymous. National Research Council Canada. In Glossary of Forest Fire Management Terms; Canadian Committee on Forest Fire Management: Ottawa, 1987; p. 91. [Google Scholar]
- Anonymous. National Wildfire Coordinating Group. Glossary of Wildland Fire Terminology. Incident Operations Standards Working Team. October 2006, pp. 1–183. available on web site at http://www.nwcg.gov.
- Jaiswal, R.K.; Mukherjee, S.; Raju, K.D.; Saxena, R. Forest fire risk zone mapping from satellite imagery and GIS. Int. J Appl. Earth Obs. 2002, 4, 1–10. [Google Scholar]
- Boychuk, D.; Perera, A. H.; Ter-Mikaelin, M.T.; Martell, D.L.; Li, C. Modeling the Effect of Spatial Scale and Correlated Fire Disturbances on Forest Age Distribution. Ecol. Model. 1997, 95, 145–164. [Google Scholar]
- Bilgili, E. Stand Development and Fire Behavior. Forest Ecol. Manag. 2003, 179, 333–339. [Google Scholar]
- Cruz, M.G.; Alexander, M.E.; Wakimoto, R.H. Assessing canopy fuel stratum characteristics in crown fire prone fuel types of western North America. Int. J. Wild. Fire 2003, 12, 39–50. [Google Scholar]
- Hall, S.A.; Burke, I.C. Considerations for characterizing fuels as inputs for fire behavior models. Forest Ecol. Manag. 2006, 227, 102–114. [Google Scholar]
- McGarigal, K.; Marks, B.J. FRAGSTATS: spatial pattern analysis program for quantifying landscape structure. U.S. forest Service General, Technical Report, PNW 351. Science 1995, 260, 1905–1910. [Google Scholar]
- Kallander, H.; Weaver, H.; Gains, E.M. Additional information on prescribed burning in virgin ponderosa pine in Arizona. J. For. 1955, 53, 662–667. [Google Scholar]
- Helms, J.A. Positive effect of prescribed burning on wildfire intensities. Fire Manage. Notes 1979, 403, 10–13. [Google Scholar]
- Pollet, J.; Omi, P.N. Effect of thinning and prescribed burning on crown fire severity in ponderosapine forests. Int. J. Wild. Fire 2002, 11, 1–10. [Google Scholar]
- Finney, M.A. The Challenge of quantitative risk analysis for wildland fire. Forest Ecol. Manag. 2005, 211, 97–108. [Google Scholar]
- Davis, L.S.; Cooper, R.W. How prescribed burning affects wildfire occurrence. J. For. 1965, 61, 915–917. [Google Scholar]
- Wood, D.B. Fuel management's potential for reducing frequency of large fires in Northern Rockies. J. For. 1982, 105–107. [Google Scholar]
- Finney, M.A. Fire growth using minimum travel time methods. Can J. For. Res. 2002, 32, 1420–1424. [Google Scholar]
- Finney, M.A. Calculating fire spread rates across random landscapes. Int. J. Wild. Fire 2003, 12, 167–174. [Google Scholar]
- Kalabokidis, K.D.; Gatzojannis, S.; Galatsidas, S. Introducing wildfire into forest management planning: towards a conceptual approach. Ecol. Manag. 2002, 158, 41–50. [Google Scholar]


| Classes* | Fuel Type (FT) | Reference Totals | Classified Totals | Number Correct | Accuracy (%) | Kappa | |
|---|---|---|---|---|---|---|---|
| Producers | Users | ||||||
| Open Areas | FT8 | 39 | 30 | 27 | 69.23 | 90.00 | 0.883 |
| Water/lake | FT10 | 30 | 30 | 30 | 100.00 | 100.00 | 1.000 |
| Çza0-a1 | FT1-1 | 27 | 30 | 25 | 92.59 | 83.33 | 0.815 |
| Çzab3 | FT2 | 30 | 30 | 28 | 93.33 | 93.33 | 0.925 |
| Çzb3-bc3 | FT4-1 | 37 | 30 | 26 | 70.27 | 86.67 | 0.846 |
| Çzc3-cd3-d3 | FT5 | 27 | 30 | 25 | 92.59 | 83.33 | 0.815 |
| Çkbc3 | FT4-2 | 26 | 30 | 19 | 73.08 | 63.33 | 0.594 |
| Çkc2-c3 | FT6 | 29 | 30 | 22 | 75.86 | 73.33 | 0.701 |
| Settlement | FT9 | 24 | 30 | 23 | 95.83 assification Acc | 76.67 | 0.744 |
| Overall Kappa Statistics = 0.813 | Overall Classification Accuracy = 83.33% | ||||||
| Classes* | Fuel Type (FT) | Reference Totals | Classified Totals | Number Correct | Accuracy (%) | Kappa | |
|---|---|---|---|---|---|---|---|
| Producers | Users | ||||||
| Open Areas | FT8 | 42 | 30 | 29 | 69.05 | 96.67 | 0.962 |
| Water/Lake | FT10 | 30 | 30 | 30 | 100.00 | 100.00 | 1.000 |
| Çzcd3, c3 | FT5 | 36 | 30 | 27 | 75.00 | 90.00 | 0.888 |
| Çzab3 | FT2 | 29 | 30 | 24 | 82.76 | 80.00 | 0.781 |
| Çza1 | FT1-2 | 25 | 30 | 24 | 96.00 | 80.00 | 0.784 |
| Çkcd3, c3 | FT6 | 28 | 30 | 26 | 92.86 | 86.67 | 0.854 |
| Çzbc3 | FT4-1 | 28 | 30 | 26 | 92.86 | 86.67 | 0.854 |
| ÇzMab3, ab2 | FT3 | 35 | 30 | 27 | 77.14 | 90.00 | 0.888 |
| Çza0 | FT1-1 | 27 | 30 | 24 | 88.89 | 80.00 | 0.782 |
| BDy | FT7 | 28 | 30 | 27 | 96.43 | 90.00 | 0.891 |
| Settlement | FT9 | 22 | 30 | 22 | 100.00 | 73.33 | 0.714 |
| Overall Kappa Statistics = 0.853 | Overall Classification Accuracy = 86.67% | ||||||
| Variables | Classes | Value Assigned | Fire Risk | |
|---|---|---|---|---|
| Species composition (weight = 10) | (1) Calabrian pine | 5 | Extreme | |
| (2) Calabrian pine + black pine | 5 | Extreme | ||
| (3) Shrub | 4 | High | ||
| (4) Degraded areas | 2 | Moderate | ||
| (5) Oak + Coppice | 1 | Low | ||
| Slope (weight = 3) | (6) 0 – 5 % | 1 | Low | |
| (7) 5 – 15 % | 2 | Moderate | ||
| (8) 15 – 35 % | 3 | High | ||
| (9) > 35 % | 5 | Extreme | ||
Insolation (weight =2) | (10) 0- 23 | N | 1 | Low |
| (11) 23- 68 | NE | 2 | Moderate | |
| (12) 68 -113 | E | 2 | Moderate | |
| (13) 113 – 158 | SE | 3 | High | |
| (14) 158 – 203 | S | 5 | Extreme | |
| (15) 203 – 248 | SW | 5 | Extreme | |
| (16) 248 – 293 | W | 2 | Moderate | |
| (17) 293 – 338 | NW | 2 | Moderate | |
| (18) 338 – 360 | N | 1 | Low | |
| Proximity of Agricultural Lands to Forest (m) (weight = 2) | (19) 0-100 | 5 | Extreme | |
| (20) 100-200 | 3 | High | ||
| (21) 200-300 | 2 | Moderate | ||
| (22) 400 < | 1 | Low | ||
| Proximity to Settlement Areas (m) (weight = 2) | (23) 0-100 | 5 | Extreme | |
| (24) 100-200 | 3 | High | ||
| (25) 200-300 | 2 | Moderate | ||
| (26)400 < | 1 | Low | ||
| Species Composition (SC) | Proximity of Agricultural Lands To Forest (AL) | Distance From Settlement Areas (SA) | Slope (%) (S) | Insolation (°) (IS) | Fire Risk Class | Fire Risk Index (FRI) |
|---|---|---|---|---|---|---|
| ESC | ES | EIS | EAL | ESA | Extreme | 95 |
| ESC | HS | HIS | HAL | HSA | Extreme | 77 |
| ESC | HS | HIS | MAL | MSA | Extreme | 73 |
| ESC | HS | HIS | MAL | LSA | High | 71 |
| HSC | HS | HIS | MAL | MSA | High | 63 |
| HSC | HS | HIS | MAL | LSA | Moderate | 61 |
| MSC | MS | MIS | MAL | MSA | Moderate | 48 |
| MSC | MS | MIS | MAL | LSA | Low | 46 |
| LSC | LS | LIS | LAL | LSA | Low | 19 |
| Variables | Clases | Value Assigned | Fire Danger | |
|---|---|---|---|---|
| Species composition | (1) Calabrian pine | 5 | Extreme | |
| (2) Calabrian pine + black pine | 5 | Extreme | ||
| (3) Shrub | 4 | High | ||
| (4) Degraded areas | 3 | Moderate | ||
| (5) Oak + Coppice | 1 | Low | ||
| Stand crown closure (%) | (6) Bare Land | 1 | Low | |
| (7) <11% | 1 | Low | ||
| (8) 11-40% | 2 | Moderate | ||
| (9) 41-70% | 3 | High | ||
| (10) 71%> | 5 | Extreme | ||
| The stage of stand development | (11) (a) newly planted -average dbh: < 8 cm | 2 | Low | |
| (12) (a) regenerated and (b) young - average dbh: < 0 – 8 and 8 – 19.9 cm | 5 | Extreme | ||
| (13) (b) young - average dbh: 8 – 19.9 cm | 5 | Extreme | ||
| (14) (b) young and (c) mature – average dbh: 8 – 19.9 cm and 20 – 35.9 cm | 4 | Moderate | ||
| (15) (c) mature - average dbh: 20 – 35.9 cm | 3 | Moderate | ||
| (16) (c) mature and (d) overmature - 20 – 35.9 cm >36 cm | 2 | Low | ||
| (17) (d) overmature - average dbh: >36 cm | 1 | Low | ||
| Slope | (18) 0 – 5 % | 1 | Low | |
| (19) 5 – 15 % | 2 | Moderate | ||
| (20) 15 – 35 % | 3 | High | ||
| (21) > 35 % | 5 | Extreme | ||
Insolation | (22) 0- 23 | N | 1 | Low |
| (23) 23- 68 | NE | 2 | Moderate | |
| (24) 68 -113 | E | 2 | Moderate | |
| (25) 113 – 158 | SE | 3 | High | |
| (26) 158 – 203 | S | 5 | Extreme | |
| (27) 203 – 248 | SW | 5 | Extreme | |
| (28) 248 – 293 | W | 2 | Moderate | |
| (29) 293 – 338 | NW | 2 | Moderate | |
| (30) 338 – 360 | N | 1 | Low | |
| Species Composition (SC) | Stand Crown Closure (%) (CC) | Stages of Stand Development (SD) | Slope (%) (S) | Insolation (°) (IS) | Fire Danger Class | Fire Danger Index (FDI) |
|---|---|---|---|---|---|---|
| ESC | ECC | ESD | ES | EIS | Extreme | 500 |
| ESC | HCC | HSD | ES | EIS | Extreme | 425 |
| HSC | ECC | ESD | ES | EIS | Extreme | 320 |
| ESC | HCC | HSD | HS | HIS | Extreme | 300 |
| ESC | HCC | ESD | LS | LIS | Extreme | 275 |
| HSC | HCC | HSD | ES | EIS | High | 272 |
| HSC | HCC | HSD | HS | HIS | High | 208 |
| HSC | HCC | MSD | HS | HIS | High | 192 |
| MSC | ECC | ESD | ES | EIS | Moderate | 180 |
| HSC | MCC | MSD | MS | MIS | Moderate | 144 |
| HSC | MCC | LSD | MS | MIS | Moderate | 128 |
| MSC | ECC | ESD | MS | MIS | Moderate | 126 |
| ESC | LCC | LSD | LS | LIS | Low | 125 |
| LSC | LCC | LSD | LS | LIS | Low | 4 |
| Fuel types (FT) | Species composition | Structural state | Crown closure |
|---|---|---|---|
| Fuel type 1a | Calabrian pine | Newly planted | No crown closure |
| Fuel type 1b | Calabrian pine | Regeneration | New crown closure (1-11%) |
| Fuel type 2 | Calabrian pine | Regeneration-young | High (>70%) |
| Fuel type 3 | Calabrian pine-shrubs | Regeneration-young | High (>70%) |
| Fuel type 4a | Calabrian pine | Young | High (>70%) |
| Fuel type 4b | Anatolian black pine | Young- mature | High (>70%) |
| Fuel type 5 | Calabrian pine | Old-mature | High (>70%) |
| Fuel type 6 | Anatolian black pine | Mature state | Moderate and High (40-100%) |
| Fuel type 7 | Degraded deciduous | All states | Low (0-10%) |
| Fuel type 8 | Open area | Roads, bare soils | No vegetation cover |
| Fuel type 9 | Settlement | Settlement areas | Houses, buildings, farmings |
| Fuel type 10 | Water | Lakes, natural waters |
| 1987-2000 | FT1a | FT1b | FT2 | FT3 | FT4a | FT5 | FT6 | FT7 | FT8 | FT9 | FT10 | Totals (1987) |
|---|---|---|---|---|---|---|---|---|---|---|---|---|
| FT1a | 690.51 | 743.8 | 367.14 | 896.08 | 1059.6 | 140.19 | 168.73 | 368.31 | 1056.46 | 10.54 | 5.59 | 5506.95 |
| FT2 | 5.5 | 35.76 | 191.55 | 32.26 | 117.62 | 23.27 | 78.53 | 2.13 | 4.94 | 491.56 | ||
| FT4a | 146.27 | 239.21 | 370.12 | 122.31 | 983.14 | 456.93 | 357.45 | 58.36 | 164.74 | 0.04 | 0.15 | 2898.72 |
| FT4b | 10.84 | 34.15 | 59.56 | 9.24 | 52.23 | 78.51 | 85.42 | 0.1 | 11.06 | 341.11 | ||
| FT5 | 244.66 | 254.06 | 70.85 | 33.63 | 256.44 | 1134.17 | 241.44 | 13.22 | 158.05 | 0.62 | 2407.14 | |
| FT6 | 35.84 | 122 | 90.25 | 50.11 | 152.94 | 200.98 | 199.68 | 3.42 | 24.79 | 880.01 | ||
| FT8 | 139.36 | 133.13 | 7.47 | 150.8 | 120.14 | 24.36 | 6.81 | 149.06 | 4993.85 | 96.67 | 5.64 | 5827.29 |
| FT9 | 0.42 | 0.12 | 2.38 | 83.45 | 46.21 | 0.07 | 132.65 | |||||
| FT10 | 0.06 | 0.2 | 5.07 | 15.28 | 20.61 | |||||||
| Totals (2000) | 1273.46 | 1562.23 | 1156.94 | 1294.43 | 2742.31 | 2058.41 | 1138.06 | 596.98 | 6502.41 | 153.46 | 27.35 | 18506.04 |
| Fire Danger | ||||||
|---|---|---|---|---|---|---|
| Low | Moderate | High | Extreme | Non Forest | Landscape | |
| Class Area (ha) | 597.0 | 3068.7 | 4728.5 | 4728.2 | 5980.5 | 18506.0 |
| 208.7 | 4448.3 | 6568.7 | 6683.3 | 18506.0 | ||
| Number of Patches | 838 | 3142 | 4599 | 2799 | 1111 | 11651 |
| 1195 | 4367 | 2708 | 645 | 9753 | ||
| Mean Patch Size (ha) | 0.71 | 0.98 | 1.03 | 1.69 | 5.38 | 1.59 |
| 0.17 | 1.02 | 2.43 | 10.36 | 1.90 | ||
| Percent of Landscape (%) | 3.23 | 16.58 | 25.55 | 25.55 | 32.32 | 100.00 |
| 1.13 | 24.04 | 35.49 | 36.11 | 100.00 | ||
| Largest Patch Index (%) | 0.29 | 1.60 | 1.54 | 7.37 | 16.95 | 16.95 |
| 0.02 | 2.22 | 18.62 | 18.96 | 18.96 | ||
| Patch density (number of patches per 100 ha) | 4.53 | 16.98 | 24.85 | 15.12 | 6.00 | 62.96 |
| 6.46 | 23.60 | 14.63 | 3.49 | 52.70 | ||
| Patch size coefficient of variation (%) | 404.32 | 829.73 | 847.36 | 2088.91 | 2051.11 | 2446.33 |
| 182.85 | 921.54 | 2788.64 | 1588.49 | 2936.67 | ||
| Area-weighted Mean Shape Index | 2.26 | 4.02 | 4.79 | 8.05 | 7.83 | 6.48 |
| 1.47 | 5.71 | 19.81 | 7.30 | 11.13 | ||
| Fire Danger | ||||||
|---|---|---|---|---|---|---|
| Low | Moderate | High | Extreme | Non Forest | Landscape | |
| Class Area (ha) | 709.6 | 1604.7 | 4064.8 | 6855.9 | 5980.5 | 18506.0 |
| 2960.0 | 5844.2 | 2309.0 | 6683.2 | 18506.0 | ||
| Number of Patches | 1526 | 1755 | 3980 | 2055 | 1112 | 8902 |
| 3218 | 4579 | 3017 | 644 | 12984 | ||
| Mean Patch Size (ha) | 0.46 | 0.91 | 1.02 | 3.34 | 5.38 | 2.08 |
| 0.92 | 1.28 | 0.77 | 10.38 | 1.43 | ||
| Percent of Landscape (%) | 8.67 | 21.96 | 37.05 | 32.32 | 100.00 | |
| 3.83 | 16.00 | 31.58 | 12.48 | 36.11 | 100.00 | |
| Largest Patch Index (%) | 0.29 | 0.51 | 1.86 | 20.27 | 16.95 | 20.27 |
| 1.06 | 7.94 | 1.85 | 18.96 | 18.96 | ||
| Patch density (number of patches per 100 ha) | 8.25 | 9.48 | 21.51 | 11.10 | 6.01 | 48.10 |
| 17.39 | 24.74 | 16.30 | 3.48 | 70.16 | ||
| Patch size coefficient of variation (%) | 465.21 | 566.41 | 831.70 | 2496.15 | 2052.03 | 2704.35 |
| 815.00 | 1867.97 | 928.94 | 1587.27 | 2784.17 | ||
| Area-weighted Mean Shape Index | 2.16 | 3.35 | 5.20 | 15.49 | 7.83 | 9.70 |
| 4.64 | 11.50 | 5.01 | 7.30 | 7.72 | ||
© 2008 by the authors; licensee Molecular Diversity Preservation International, Basel, Switzerland. This article is an open-access article distributed under the terms and conditions of the Creative Commons Attribution license ( http://creativecommons.org/licenses/by/3.0/).
Share and Cite
Saglam, B.; Bilgili, E.; Dincdurmaz, B.; Kadiogulari, A.I.; Kücük, Ö. Spatio-Temporal Analysis of Forest Fire Risk and Danger Using LANDSAT Imagery. Sensors 2008, 8, 3970-3987. https://doi.org/10.3390/s8063970
Saglam B, Bilgili E, Dincdurmaz B, Kadiogulari AI, Kücük Ö. Spatio-Temporal Analysis of Forest Fire Risk and Danger Using LANDSAT Imagery. Sensors. 2008; 8(6):3970-3987. https://doi.org/10.3390/s8063970
Chicago/Turabian StyleSaglam, Bülent, Ertugrul Bilgili, Bahar Dincdurmaz, Ali Ihsan Kadiogulari, and Ömer Kücük. 2008. "Spatio-Temporal Analysis of Forest Fire Risk and Danger Using LANDSAT Imagery" Sensors 8, no. 6: 3970-3987. https://doi.org/10.3390/s8063970
APA StyleSaglam, B., Bilgili, E., Dincdurmaz, B., Kadiogulari, A. I., & Kücük, Ö. (2008). Spatio-Temporal Analysis of Forest Fire Risk and Danger Using LANDSAT Imagery. Sensors, 8(6), 3970-3987. https://doi.org/10.3390/s8063970