1 Introduction
The stress-induced curvature of thin substrates offers an appealing way to deduce stress at surfaces and in thin films directly. Cantilever substrates, i.e. thin substrates, which are clamped along the width to a sample manipulator, where the substrate remains free to bend along its length, have been employed successfully in numerous stress studies. Highly sensitive and accurate quantitative data on stress in films and at surfaces have been obtained. Several reviews and articles present results on adsorbate-induced surface stress, film stress, and magnetoelastic stress [
1-
19].
In addition to these stress measurements, also the mechanical torque between an external magnetic field and the total magnetic moment of a sample has been exploited successfully in cantilever experiments to perform quantitative torque magnetometry on films as thin as a few atomic layers [
20-
23]. The aspect of torque magnetometry is treated in another contribution to this cantilever issue of
Sensors.
We start with a discussion of experimental aspects regarding cantilever-based stress measurements, where we address cantilever clamping and elastic anisotropy. Both aspects need to be considered to ensure a proper quantitative analysis of the stress-curvature relations, which are the basis of cantilever measurements. Then, we present examples of cantilever experiments which we performed to study the role of stress at surfaces and in ultrathin epitaxial films for surface reconstruction, surface alloying, structural transitions and the magnetoelastic coupling in strained ferromagnetic layers.
2 Experimental Section
In contrast to the seemingly simple experimental scheme of a cantilever stress measurements, there are two subtle caveats, which need to be considered to ensure a proper data analysis. Firstly, we comment on how the clamping of the cantilever needs to be considered to ensure a straightforward data analysis. Secondly, we illustrate how the anisotropy of the elastic properties enters the data evaluation. Before we discuss how both aspect are treated in the curvature analysis, we briefly introduce the venerable Stoney equation, which gives the relation between substrate curvature and stress.
Some 100 years ago Stoney has exploited the stress-induced curvature of a thin ruler, which served as a substrate to investigate the stress of an electroplated Ni film [
24]. He gave the relation between film stress
τ, film thickness
t and curvature 1/
R as
, where
Y: Young modulus of the substrate, and
ts: thickness of the substrate.
Ever since a relation between stress
τ and curvature
1/
R has been described as
Stoney equation. This is cumbersome, as the original
Stoney equation given above is not valid in general, as it describes a one-dimensional stress-curvature scenario. This is not fulfilled in most applications. Rather, the film is under a biaxial stress. It has been indicated before [
8] that under biaxial stress, the substrate stiffness should enter in the form
Y/(
1 −
ν), with
ν : Poisson ratio, and not in the form
Y, as given above. This leads to a sizeable correction for the calculation of stress due to the magnitude of
ν ≈ 0.4. Values of the Young modulus and the Poisson ratio are given in
Table 1 below for some elements.
2.1 The role of cantilever clamping and elastic anisotropy for quantitative analyses
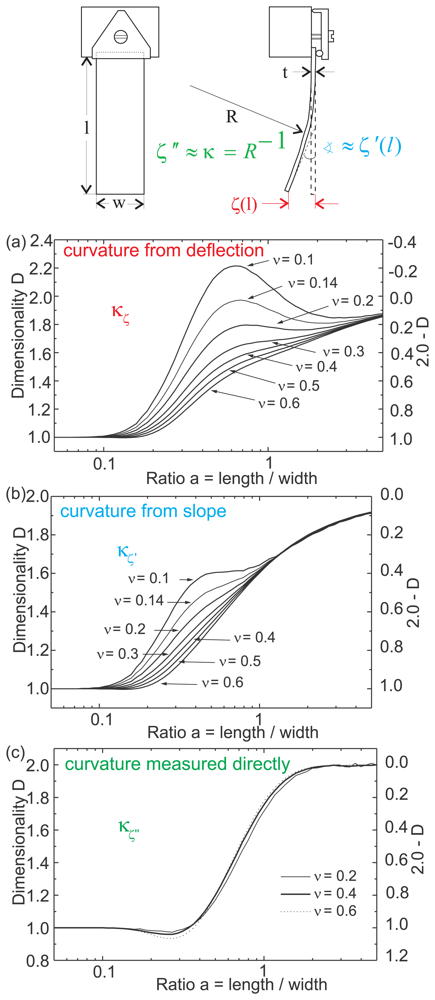
An important aspect for the proper quantitative analysis of cantilever measurements is the influence of cantilever clamping onto the biaxial stress-induced curvature. In most cases the cantilever is clamped along its width at its upper end, as schematically shown in
Fig. 1. This clamping has an important influence on the stress-induced curvature of the cantilever, as it hinders a free two-dimensional curvature. The curvature along the width of the cantilever is suppressed near the clamping. Further away from the clamping, a cantilever curvature along the width is possible. Thus, one expects a transition from 1-dimensional to 2-dimensional curvature with increasing length-to-width ratio of the cantilever.
Thorough finite element analyses [
25] corroborate this assertion. Careful studies provide a quantitative description of the relation between the dimensionality of the curvature and the length-to-width ratio and the Poisson ratio of the cantilever substrate. The results of the finite element analysis are summarized in
Fig. 1.
These calculations clearly reveal that the corrections in the data analysis depend on whether a measurement of the cantilever deflection, slope or curvature is performed. The calculations indicate that a direct curvature measurement is preferable as it suffers the least form the adverse effect of clamping. Here, a 2-dimensional curvature resembles a very good approximation already for a length-to-width ratio larger than two, whereas sizeable correction are compulsory for the quantitative analysis based on deflection and slope measurements [
25].
An optical two-beam deflection technique offers a venue towards direct curvature measurements, and it will be described below. The
generalized Stoney equation, see
eq. 1, has been introduced to address the issue of dimensionality
D of curvature properly as
where the limiting cases of 1-dimensional and 2-dimensional curvature are obtained for
D = 1 and
D = 2, respectively. These equations are valid for elastically isotropic substrates under the influence of isotropic stress, and therefore the tensor character of
τ could be safely disregarded.
Note, however, that only for an isotropic stress
τ =
τx =
τy, a measurement of a single curvature 1/
R suffices to give the stress
τ. In the more general case of anisotropic stress, two radii of curvature 1/
Rx, 1/
Ry need to be measured to obtain the stress components
τx and
τy, where
x,
y indicate two orthogonal direction in the cantilever plane [
8]:
In cases where the two radii of curvature cannot be extracted from one measurement, one needs to perform measurements on two differently cut cantilevers, where the lengths are either along the
x- or the
y-direction. Such measurements have been performed e.g. to extract the anisotropic film stress for Fe and Ni monolayers on W(110) [
8,
14,
26], and the anisotropic surface stress change upon oxygen adsorption on W(110), which induces an anticlastic curvature of the W substrate [
26].
2.2 The role of elastic anisotropy for quantitative analyses
The use of crystalline substrates requires to consider the directional dependence of the elastic properties, as they are anisotropic in general. This elastic anisotropy can be sizeable.
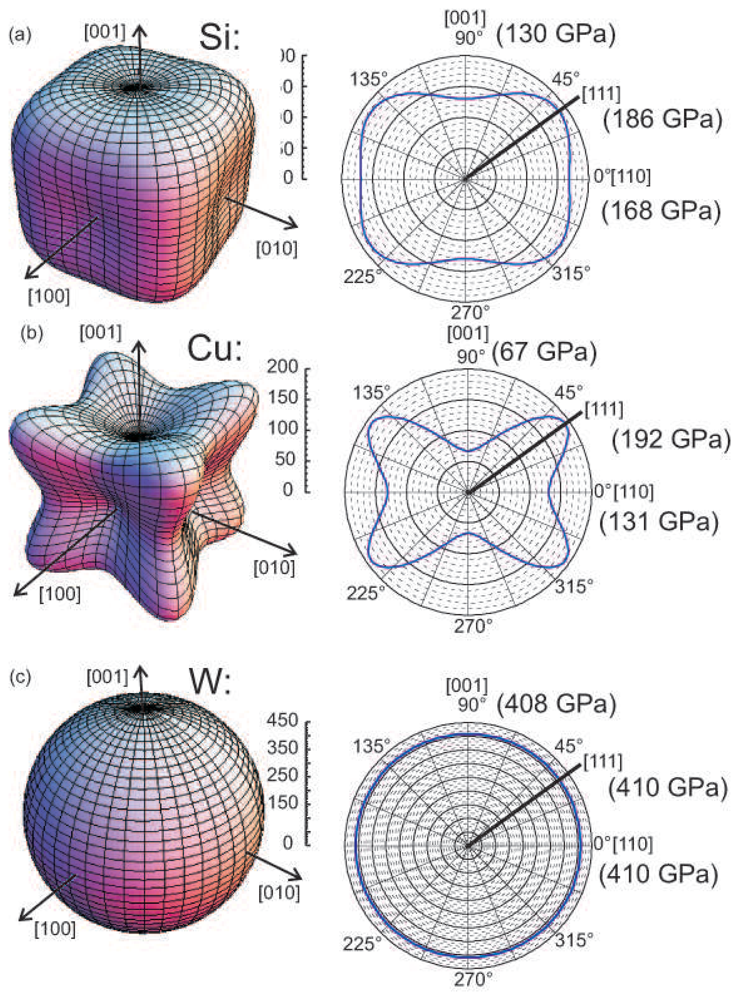
To illustrate the directional dependence of the elastic properties, we show in
Fig. 2 polar plots of the Young modulus
Y, where both polar 3d-plots and an azimuthal scan within the (111) plane are shown. The corresponding tensor transformation have been applied for the elastic compliances
s11,
s12, and
s44, which are connected to the Young modulus
Y and the Poisson ratio
ν for direction along the cubic axes as
Y = 1/
s11 and
ν = −
s12/
s11, as given in detail in references [
8,
27].
A pronounced anisotropy is obvious for Si and Cu. Here,
Y is large along [111], small along [100], and intermediate along [110], as indicated by the values given in parentheses in
Fig. 2(b). The magnitude and the direction of the extrema of
Y depend on the specific element under consideration [
8]. The Young modulus of W turns out to be almost isotropic, with a minute relative variation of (Δ
Y/
Y < 0.005). This negligible anisotropy was exploited in the first 2-dimensional stress analysis cited above [
8,
14,
26]. A constant value of the elastic properties of the substrate resembles a valid approximation for W.
For crystalline cantilevers, the elastic properties
Y and
ν need to be calculated for the chosen crystalline orientation. The required tensor transformations are described in detail in reference [
8,
31].
The symmetry of the directional dependence of
Y and
ν leads to isotropic values for
Y/(1 −
ν) for directions within the (001) planes, whereas
Y and
ν are both isotropic within (111)-planes of cubic materials, and also within the basal plane (0001) of hexagonal materials [
8,
31].
The following expressions give the expression for Y, ν, and the biaxial modulus Y/(1 − ν) for two common orientations in terms of the tabulated elastic compliances sij, which are to be used in the Stoney equations 1 given above.
The magnitude of the expression
reflects the elastic anisotropy; s can be positive or negative, depending on the element. A value close to zero indicates negligible anisotropy, which is observed in very good approximation for W (W: s = 0.02 TPa−1).
For the cubic (110) orientation less simplification is possible. Here, two radii of curvature
R1 and
R2 need to be measured, and the proper tensor transformations need to be applied for
sij[
7,
8]. However, provided that the substrate shows isotropic elastic behavior, the relations cited above in
eq. 4 give the proper relation between curvature and stress for the (110) orientation.
2.3 Optical curvature measurement under ultrahigh vacuum conditions and in magnetic fields
The discussion of the curvature-stress relation above and the plots of
Fig. 1 clearly suggests that a direct measurement of the stress-induced curvature change of a thin substrate is advisable. This assertion is based on the understanding that a curvature measurement is affected the least, as compared to deflection and slope measurements, from the adverse effect of sample clamping on substrate curvature [
25].
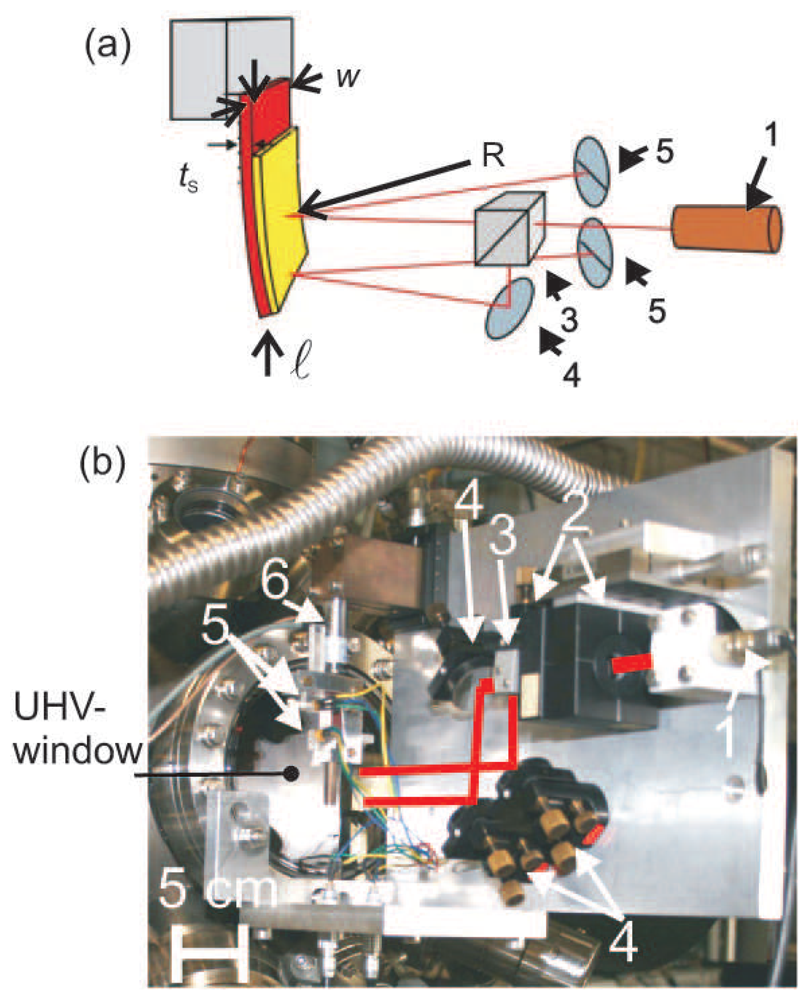
A simple, yet very powerful technique to measure a stress-induced curvature is the analysis of the deflection of laser beams upon reflection from a curved substrate surface. A schematic and the realization of the optical curvature measurement are shown in
Fig. 3.
One main advantage of the optical deflection technique is that only a thin cantilever substrate with optical access to the sample surface for incoming and reflected beams is needed. Commercial multiple optical beam deflection measurements are available [
32].
All results presented here were obtained with our home-built set up, shown in
Fig. 3, which has been used successfully to measure minute surface stress changes during adsorption of sub-monolayer quantities [
33]. Even the two–three orders of magnitude smaller magnetoelastic stress, which is the film analogon to magnetostriction of a bulk sample, has been measured successfully for films as thin as few atomic layers [
8,
34].
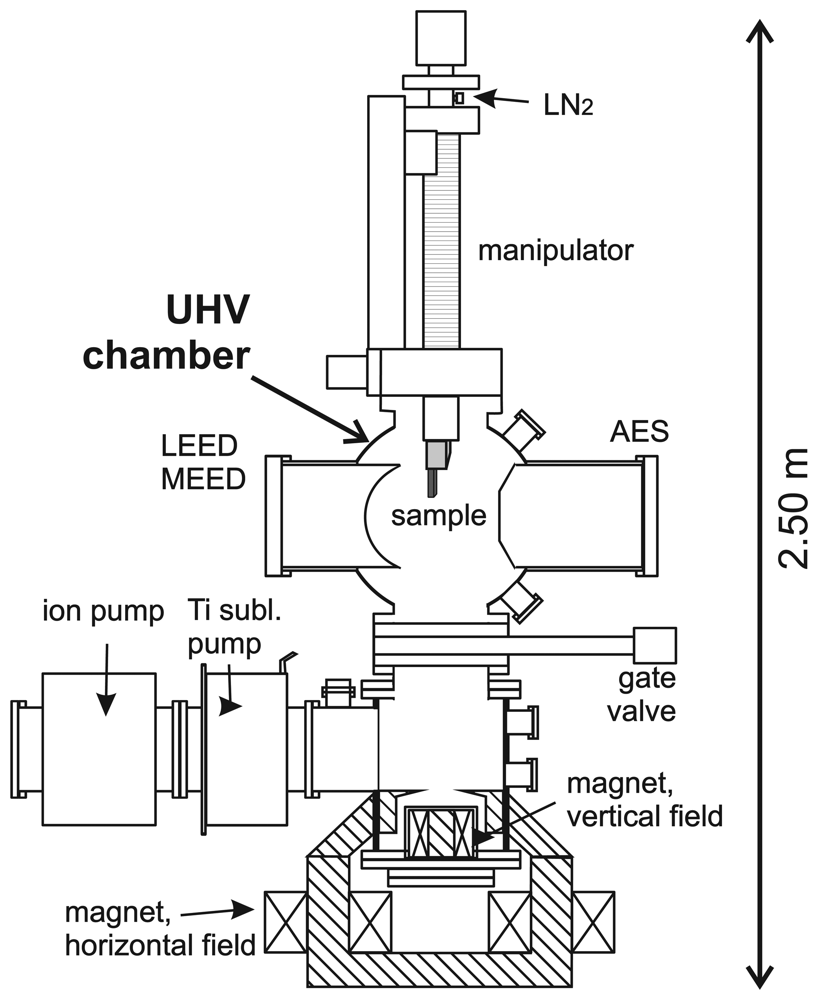
The study of stress at surfaces and in ferromagnetic layers requires the use of an ultrahigh vacuum (UHV) chamber with the corresponding preparation tools and analyzing techniques, such as sample manipulator for cooling and heating, ion gun for sample cleaning, evaporators and leak valves to adsorb various gases onto the substrate surface, Auger electron spectroscopy (AES) to check the elemental composition of the surface layer, low energy electron diffraction (LEED), and medium energy electron diffraction (MEED) for monitoring the sample structure. A key asset of the UHV chamber is the magnet system, which provides horizontal (0.4 T) and vertical (0.1 T) fields to perform magneto-optical Kerr-effect (MOKE) and magnetoelastic stress measurements in situ.
Figure 4 shows a simplified sketch of the UHV chamber that we designed in Halle to perform combined stress and magnetic measurements on surfaces and atomic layers. The incorporation of a magnet is mandatory to study magnetic properties of atomic layers in situ. An example for magnetization-induced stress measurements is given in the section on magnetoelastic stress, where the application of the cantilever curvature technique is described to measure magnetoelastic coupling coefficients of ferromagnetic layers.
3 Surface reconstruction and surface stress
The reduced coordination of surface atoms due to the lack of bonding partners above the surface leads to a peculiar redistribution of electronic charge near the surface region. This change of the electronic structure near the surface as compared to the bulk region can give rise to a change of the structure of a solid near its surface. Familiar phenomena are the change of the layer spacing at layers close to the surface as compared to the layer spacing in the bulk of the sample. This so-called layer relaxation has been found experimentally for numerous metallic surfaces, and it has been demonstrated that the magnitude of the layer relaxation depends on the adsorbate coverage of the surface [
35].
In addition to the change of the layer spacing, also the forces between atoms within the surface layer change, as compared to bulk. Whereas in bulk the stability criterion of the equilibrium structure of the atomic positions is the requirement of a vanishing force acting between atoms, intra-atomic forces do act in the surface layer. Experimental and theoretical studies suggest that in general a tensile surface stress acts in a clean metal surface [
7,
36,
37]. This surface stress can be viewed as an attractive interaction between neighboring atoms within the surface layer.
Thus, any adsorption onto a surface is expected to change the surface stress, as new bonds are formed between surface atoms and adsorbates, which in turn will change also the forces acting in the surface layer. Indeed, adsorbate-induced surface stress changes have been measured for numerous examples with the cantilever bending technique [
7,
12,
33].
A most interesting question in this respect is, whether the adsorbate-induced change of surface stress can even drive a surface reconstruction [
7,
38]. First experiments on the C-induced clock reconstruction of Ni(001) suggest that this might be so [
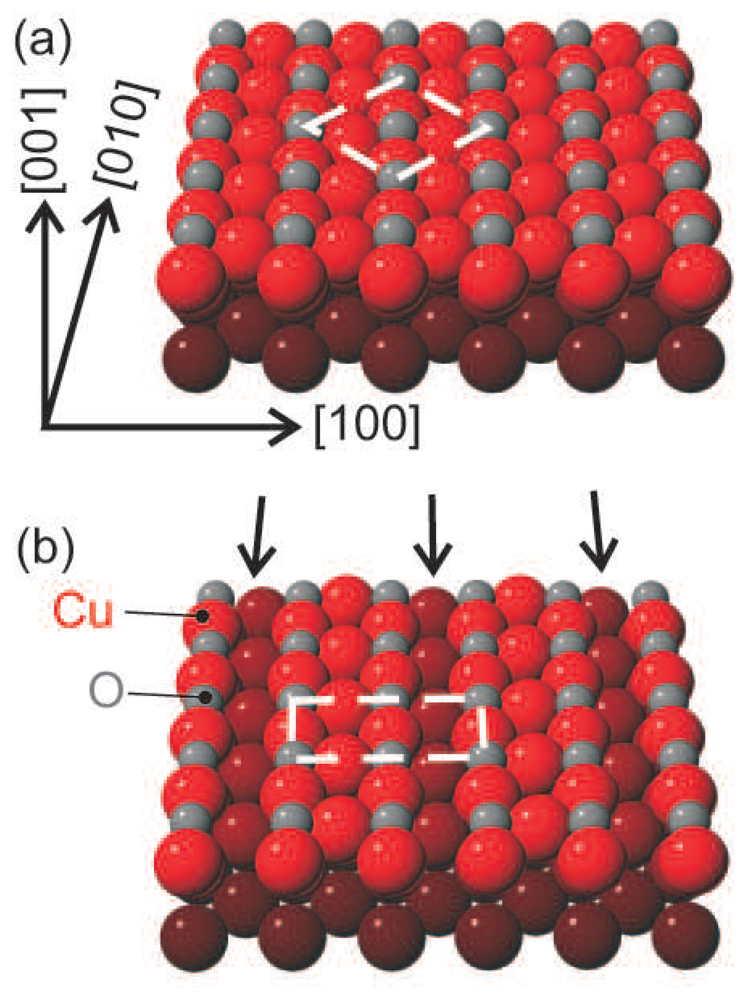
39]. Here we present another example where we studied the link between oxygen-induced surface stress change and surface reconstruction of Cu(001) [
37].
The exposure of clean Cu(001) to an O
2 partial pressure of the order 10
−6 mbar at 300 K leads to the formation of an ordered c(2 × 2)-O adsorbate structure. If however, the exposure to O
2 is performed at an higher temperature of 500 K, a surface reconstruction is observed, where every fourth atomic row of Cu is expelled from the surface, and this leads to the missing row
reconstructed surface structure, which is experimentally well established [
37,
38,
40].
Figure 5 illustrates the two different surface structures which result from the adsorption of oxygen at 300 K, panel (a), and at 500 K, panel (b).
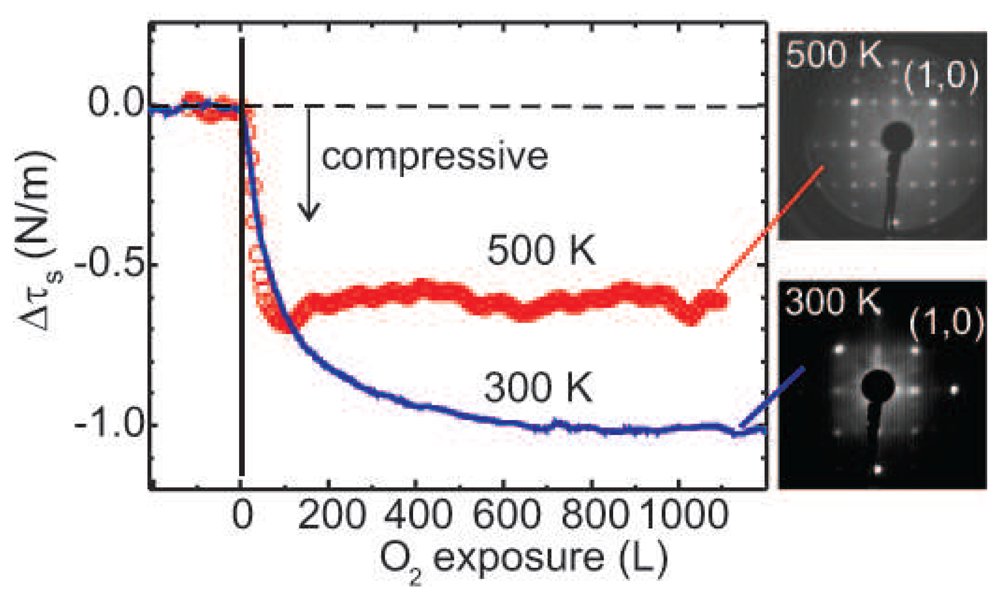
We have performed measurements of the oxygen-induced change of surface stress of Cu(001) for a Cu substrate temperature of 300 K and 500 K, and the result is shown in
Fig. 6 [
37]. The low energy electron diffraction (LEED) images of
Fig. 6 indicate the formation of the c(2 × 2) and missing row
structure at 300 K and 500 K, respectively. The plots indicate that exposure to oxygen leads to a compressive stress change in both cases. The surface stress change saturates around -1 N/m for exposure at 300 K, and around -0.6 N/m at 500 K. The main conclusion of this measurement is that the stress change associated with the missing row reconstruction is smaller than the stress change due to the formation of the c(2 × 2) structure.
We need to appreciate this change of surface stress with respect to the absolute surface stress of this system. Absolute surface stress values are not accessible experimentally, only surface stress changes upon adsorption have been reliably determined. Therefore, density functional theory (DFT) slab calculations have been performed [
37]. They give a tensile surface stress of + 1.89 N/m for Cu(001), −1.18 N/m for the c(2 × 2) phase, and −0.67 N/m along the missing row, and +0.4 N/m perpendicular to the missing row of the missing row reconstructed phase [
37]. These calculations indicate that the average surface stress of the missing row reconstructed phase of −0.14 N/m is lower in magnitude than that of the c(2 × 2) phase (−1.18 N/m). This result supports the view that the reduction of surface stress drives the missing row reconstruction.
However, the experimentally determined surface stress change deviates noticeably from the calculated surface stress changes. We ascribe this to the important contribution of structural domains and stress relaxation at domain boundaries for both surface structures, which will lead to smaller experimental surface stress changes as compared to the calculated values.
This example illustrates that a proper assessment of the surface stress changes benefits largely from additional insight from ab initio based calculations. The following example of the surface stress change induced by surface alloying indicates that a decent agreement between experimental and calculated stress changes can be obtained for structurally more simple systems.
4 Surface stress and surface alloying
Numerous studies have shown that the adsorption of metal atoms on a metal surface may lead to a substitutional bonding site of the adsorbate [
41]. The adsorbate atom may replace a surface atom of the substrate. If this intermixing is confined to the surface layer, which is the case for many systems, one obtains a surface alloy. These surface alloys may form for systems, which are inmiscible in the bulk phase.
The study of surface alloys and the understanding of the driving forces behind surface alloy formation are of high interest, as the electronic, magnetic, and structural properties of a few atomic layer thin film are heavily influenced by the interface to the substrate [
42–
45].
Calculations suggest that the size mismatch between adsorbate atom and substrate atom is an important factor which drives a surface alloy formation. As pointed out by Tersoff, it is a remarkable observation that the same effect, atomic size mismatch, favors surface alloy formation, but suppresses alloy formation in bulk phases [
42].
Surface stress measurements offer additional insight into the mechanisms which drive surface alloy formation. We have investigated the formation of a prototype surface alloy, the c(2 × 2)-Mn/Cu(001) system [
45], by combined surface stress and surface x-ray diffraction (SXRD) experiments. The combined experiments provide a comprehensive description of both stress and structure of the surface alloy layer [
45].
The stress curve of
Fig. 7 identifies two stress regimes. A compressive change of surface stress in proportion to the increasing Mn coverage up to the deposition of 0.5 ML Mn is observed in regime I. At this point a compressive stress change of −1.2 N/m is observed, and the LEED image identifies a pronounced c(2 × 2) structure. Further deposition of Mn leads to an almost negligible stress change in regime II, which levels off at −1.4 N/m after deposition of 2 ML Mn stress. The LEED images show an increased background intensity with increasing coverage.
Our stress data in connection with the detailed SXRD structural analysis indicate that the formation of the MnCu surface alloy is completed after deposition of 0.5 ML at 300 K. At this point, every second surface atom of Cu(001) is replaced with an Mn atom, and a c(2 × 2) surface structure results [
45].
The magnitude of the measured stress change (−1.2 N/m) is a factor of two larger than what is expected based on the epitaxial misfit between MnCu and Cu(001). This result immediately points at the reduction of tensile surface stress of Cu(001) upon surface alloy formation, which contributes to the stress measurement as a compressive stress.
This assertion is corroborated by recent DFT calculations [
46], which find a surface stress change upon MnCu surface alloy formation of −1.52 N/m, in fair agreement with our experimental value of −1.2 N/m. The magnitude of the stress change renders the Cu surface almost free of surface stress. Thus, our stress measurements in conjunction with theory [
46] indicate that the reduction of surface stress of Cu might play a crucial role for this surface alloy formation.
One important implication of this finding is that surface stress measurements offer quantitative data, which may serve as a comparison for theory. This combination between experiment and theory offers deeper insight into the underlying physics by considering also forces between atoms, an aspect which has not been studied in detail before.
5 Film stress and film structure
Cantilever stress measurements have a long tradition for the measurement of film stress. Very different topics including stress in amorphous films, stress in epitaxial films, stress relaxation due to misfit formation, structural- and morphology-induced stress change have been investigated. Several reviews and data compilations [
1–
12] and publications [
13–
19] provide further insight.
A strength of stress measurements is that quantitative values for film stress are obtained directly from the analysis of the substrate curvature. This allows to compare the measured stress with the calculated stress, where the calculation is based on model assumptions regarding the film structure. Very often pseudomorphically strained epitaxial films are studied. In this case, the epitaxial misfit gives rise to a film strain, which induces the film stress. Our measurements on few monolayer thin films do indeed confirm, that bulk reference states are appropriate to derive film stress from strain for films thicker than 1–2 monolayers [
43,
47–
49].
For thinner films, surface stress effects might dominate the stress behavior, rendering the concept of film strain irrelevant for the resulting stress. Examples include the sub-monolayer stress of Fe and Ni on W(110), where even a stress of opposite sign as compared to the expected stress due to film strain is measured for a film coverage below 0.5 layers [
14,
26].
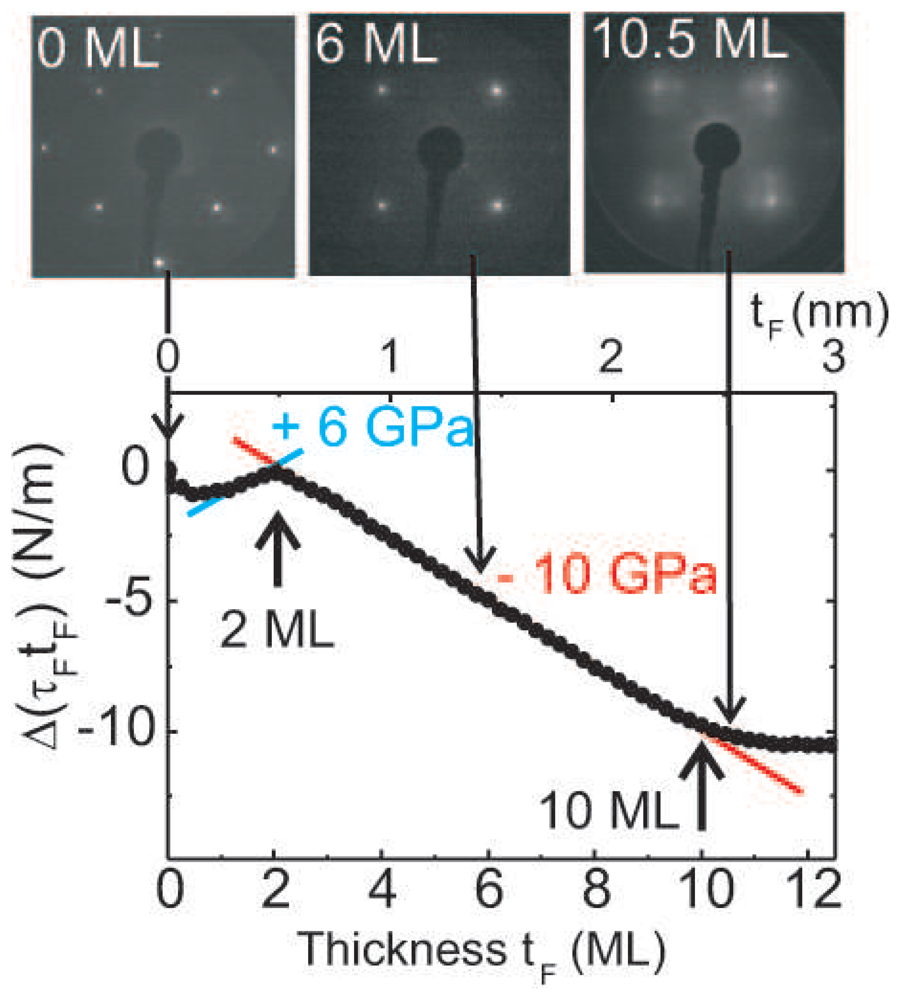
Here, we present in
Fig. 8 stress measurements during the growth of epitaxial Fe films on Ir(001), where scanning tunneling microscopy (STM) and a quantitative structural analysis by LEED indicate almost perfect layer-by-layer growth with a constant in-plane film strain from 0 to 10 ML Fe coverage [
50]. In contrast to the constant in-plane strain from 0–10 ML, the stress curve shows a variation of its slope around 2 ML. The positive slope of the curve indicates a tensile film stress of +6 GPa from 1–2 ML, and it shows a negative slope corresponding to a compressive film stress of −10 GPa from 2–10 ML.
The initial negative slope of the stress curve up to 0.5 ML is ascribed to Fe-induced reduction of surface stress of Ir. The deviation of the stress curve from its constant slope above 10 ML indicates stress relaxation due to the formation of misfit dislocations, which begin to form around 10 ML, and they also give rise to a characteristic change of the diffraction pattern in LEED.
The top panel of
Fig. 8 shows LEED images which were taken at the indicated film thickness. Already a qualitative inspection reveals the end of pseudomorphic growth at 10.5 ML. An area of enhanced diffuse intensity with weak extra spots develops towards the center of the LEED screen around the spots indicative of the 1 × 1 structure [
50], and this ascribed to the onset of misfit dislocation formation at 10.5 ML.
Note the amazingly high magnitude of the film stress of −10 GPa from 2–10 ML. This strikingly demonstrates that film stress in a magnitude well beyond the yield stress of high strength bulk materials is accessible in ultrathin films, and this renders the investigation of the correlation between stress, structure and magnetism of strained films so interesting [
8]. The magnitude of stress is quantitatively ascribed to the compressive epitaxial misfit of −5.6 % between bcc-Fe and Ir(001) [
50].
The initial tensile film stress cannot be ascribed to the misfit between bcc-Fe and Ir. Rather our stress measurements, in connection with a detailed structural analaysis by LEED, where also the vertical layer spacings of the Fe film are analyzed, suggests that the first two layers of Fe grow as a fct-precursor. A tensile epitaxial misfit is expected for fcc-Fe growth on Ir(001), and this explains qualitatively the tensile film stress. Subsequent Fe depositions leads to the growth of bct-Fe on top of this precursor. A detailed discussion of this scenario is given in reference [
50].
This example demonstrates that stress measurements are a powerful tool to observe subtle structural transitions in atomic layers, even in cases where no change of the in-plane strain is observed. The combination of stress measurements with structural investigation offers a comprehensive understanding of structural transitions.
6 Magnetoelastic stress of ferromagnetic layers
The magnetic anisotropy of ferromagnetic layers determines the orientation of the easy and hard magnetization directions, and it can also have an important impact on the magnitude of the coercive field [
51,
52]. A lot of experimental and theoretical work has been devoted to the understanding of the principles which govern the magnetic anisotropy [
8,
34,
53–
55]. These studies suggest lattice strain as an important factor, which often determines the magnetic anisotropy of atomic layers.
The coupling between lattice strain and magnetic anisotropy is given by the magnetoelastic coupling, which gives rise to magnetostriction, i.e. the change of length of a bulk sample upon magnetization [
51,
57]. Ferromagnetic films are usually bonded to a substrate, and the films are not free to strain upon magnetization. Here, the lattice strain, as given e.g. by the epitaxial misfit between film and substrate, induces a magnetic anisotropy, which determines in many cases the easy magnetization direction of the film. Thus, a detailed understanding of the magnetoelastic coupling in films is mandatory to understand and tailor their magnetic properties.
In contrast to bulk samples, where the magnetization leads to a magnetostrictive strain, the magnetization of a film-substrate composite leads to a magnetoelastic stress. This stress is typically 2-3 orders of magnitude smaller than the epitaxial misfit stress discussed above, which is of the order of GPa per one percent misfit. In spite of this minute magnetoelastic stress, stress measurements by the cantilever curvature technique provide quantitative and accurate measurements of the underlying magnetoelastic coupling coefficients
Bi[
8,
20,
58].
Magnetoelastic stress measurements are performed by monitoring the change of a curvature of the film-substrate composite upon a reorientation of the film magnetization along two orthogonal directions. Depending on the crystalline orientation, different magnetoelastic coupling coefficients are determined [
59,
60].
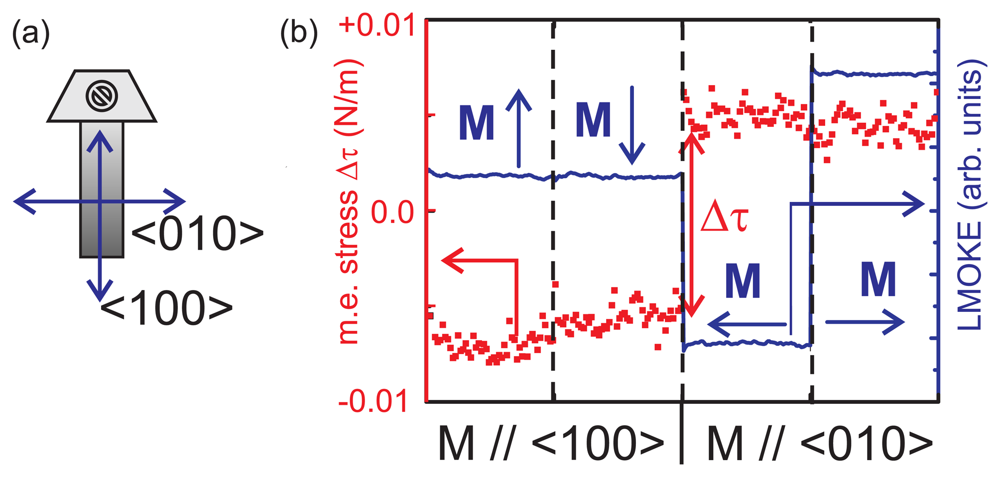
Figure 9 illustrates the magnetization directions along a cantilever sample, and it shows the magnetoelastic stress curve of 8 ML Fe on Ir(001) [
56]. Switching the magnetization direction along these directions gives access to
B1 =
τ100 −
τ010 = Δ
τ. The plot of
Fig. 9 reveals that the magnetoelastic stress (red curve) changes upon a reorientation of the magnetization direction from along the sample length to along the sample width. Simultaneously taken magneto-optical Kerr-effect (MOKE) [
61] measurements (blue curve) verify that the magnetization direction switched in the described manner. A magnetoelastic stress Δ
τ = 0.01 N/m is measured. Note that this is roughly 3 orders of magnitude smaller than the film stress measured for 10 ML Fe on Ir(001), shown in
Fig. 8.
The magnetoelastic stress change of 001 N/m corresponds to
B1= −10 MJ/m
−3[
56]. This value is a factor of almost 3 larger than the respective bulk value of −3.4 MJ/m
−3. Numerous detailed studies of the magnetoelastic coupling of strained epitaxial films reveal, that a deviation between the
Bi of a film and that of the respective bulk material is the rule. This result has important implications. It indicates, that bulk values of
Bi do not give an appropriate description of magnetoelastic coupling in films [
8].
Rather, the results from combined film stress and magnetoelastic stress measurements suggest that film strain is a decisive factor which drives the deviation of
Bi from its bulk value [
8,
56,
62]. This impact of film strain on the magnetoelastic coupling has been also identified in state of the art calculations of magnetoelastic coupling in elements [
63–
66] and alloys [
67]. However, the agreement between theory and experiment for the magnetoelastic coupling of elements is qualitative at best presently. This calls for more experiments and theoretical efforts in this field to gain a deeper understanding of the electronic origin of the influence of strain on the magnetic anisotropy.
7 Conclusion
We have demonstrated that highly accurate and sensitive data on stress and magnetoelastic coupling are accessible in cantilever experiments. These measurements elucidate the correlation between stress and surface alloying, reconstruction, structural transitions, and magnetic properties of surfaces and in atomic layers.
Thus, stress measurements contribute to an improved understanding of fundamental aspects of surface science by providing accurate quantitative values for forces acting within a surface. The consideration of forces at surfaces has been neglected a bit in experiments and theory so far. Related work has attracted much less attention as compared to e.g. investigations of structural and electronic aspects. Ongoing efforts from experiment and theory are therefore called for to advance in the understanding of the correlation between stress, structure and magnetic anisotropy at surfaces and in atomic layers at a fundamental level. Cantilever measurements are an appropriate tool to contribute to this effort.


