Automatic Exudate Detection from Non-dilated Diabetic Retinopathy Retinal Images Using Fuzzy C-means Clustering

Abstract
:
1. Introduction
2. Materials and Methods
2.1. Exudate detection
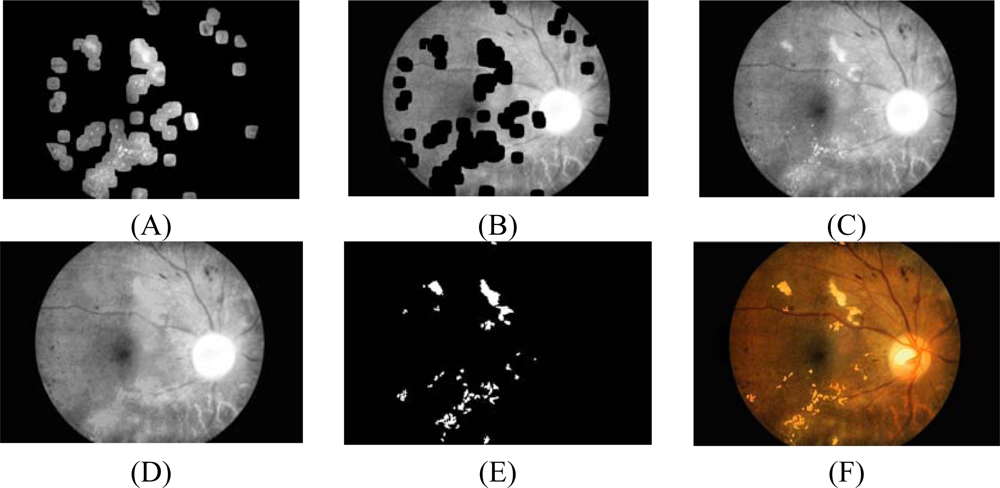
2.2 Coarse Segmentation using Fuzzy C-Means Clustering
- Step 1: Initialize the fuzzy partition matrix U = [uij] (U(0)) by generating random numbers in the range 0 to 1 subject to Equation 5:
- Step 3: Update the fuzzy partition matrix U(K), U(K+1) by the new computed uij according to Equation 2.
- Step 4: Compute the objective function according to Equation 1. If the difference between adjacent values of the objective function is less than termination criterion (ε) then stop the iteration; otherwise return to step 2.
2.3 Feature selection
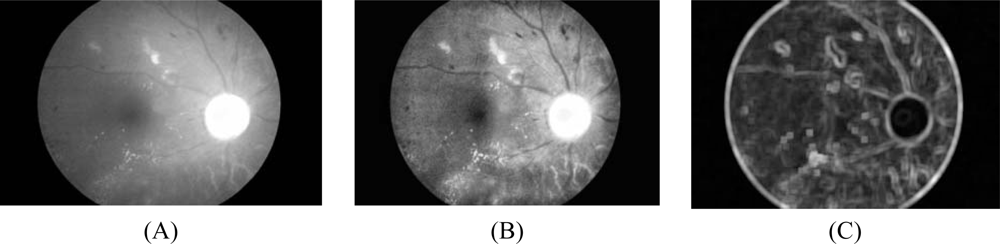
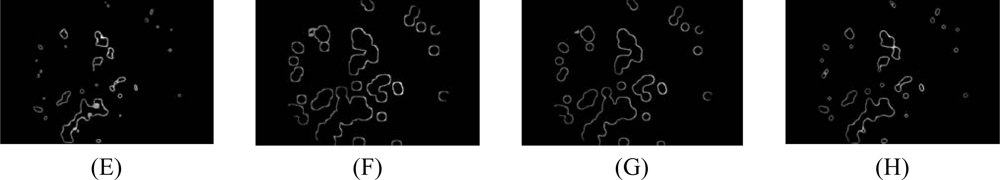
- Intensity image after pre-processing (ICLAHE) is selected as one of the classification features because exudate pixels can usually be distinguished from normal pixels by their intensity. Firstly, the Red, Green and Blue (RGB) space in the original image is transformed to Hue, Saturation and Intensity (HSI) space. A median filtering operation is then applied on the I (intensity) band to reduce noise before a Contrast-Limited Adaptive Histogram Equalization (CLAHE) is applied for contrast enhancement [23]. The original intensity band image and intensity band after preprocessing are shown in Figures 1A and 1B, respectively.
- Standard deviation of ICLAHE is also chosen as an input parameter because distribution measurement of the pixel values would differentiate exudate area from the others since standard deviation shows the main characterization of the closely distributed cluster of exudates. The standard deviation of the intensity bands after preprocessing is shown in Fig. 1C. Standard deviation is defined in Equation 6:where x is a set of all pixels in a sub-window W(x), N is a number of pixels in W(x), μICLAHE (x) is mean value of ICLAHE(i) and i∈W(x). A window size of 15 × 15 pixels was used in this step.
- Hue, also extracted from HSI space, is the third feature selected for input to FCM clustering because hue components make up chrominance or color information. From visual inspection, exudates appear differently in a yellowish or white color.
- Normally exudates gather together in small clusters so they tend to have many edge pixels around the area. A number of edge pixels is also selected as our last feature to FCM clustering. However, during this feature extraction, we remove some irrelevant edge pixels, as described:
- 4.1 For fast edge detection, a Sobel edge operator with a mask size of 3×3 pixels is used to compute the gradient magnitude.
- 4.2 The result from the previous step is then thresholded by a fixed and low value in order to get most of the edge pixels.
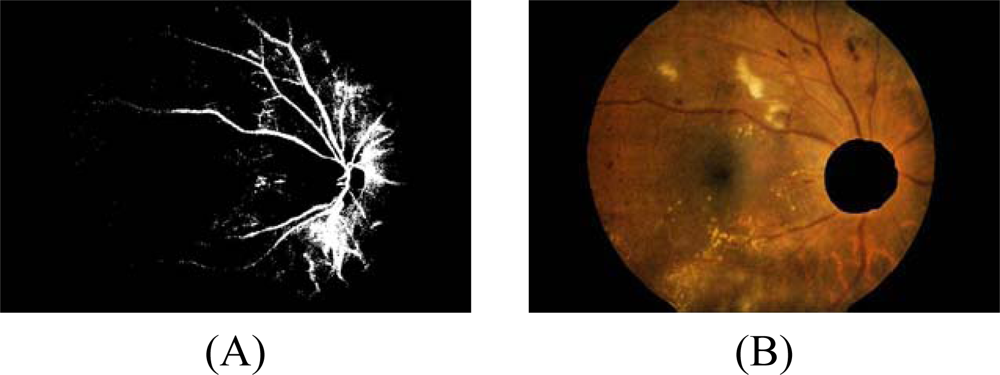
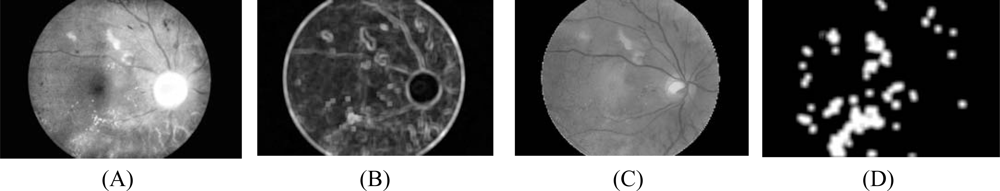
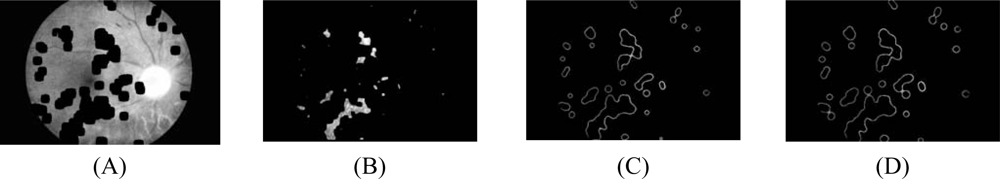
- 4.3 However, some of the resulting edge pixels from the previous step do not represent the edge of the exudates. Some of them are part of vessel’s edge and these vessel edge pixels need to be removed before proceeding to the next step. Quick and approximate blood vessel detection is achieved by using a decorrelation stretch on the Red band. The decorrelation stretching is a process used to enhance or stretch the color differences found in a color image. Contrast exaggeration is used to expand the range of intensities of highly correlated images [24, 25]. Blood vessels can be detected by thresholding this result and the detection result are shown in Fig. 2A.
- 4.4 Some exudates are soft exudates which cannot be detected by a strong edge. High-value red pixels selected from the decorrelation stretch image are chosen and added to the result from the previous step because the soft exudates normally appear red. However, red pixels which belong to the optic disc, which also appear red, have to be removed first.
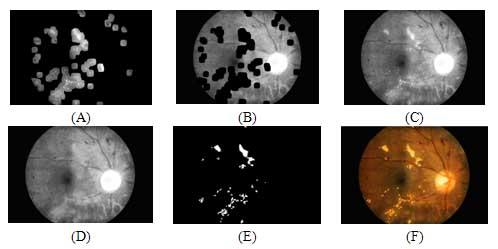
- The optic disc is quickly detected by using an entropy feature on ICLAHE. The entropy is a statistic measurement of randomness that can be used to characterize the texture of the input image. The optic disc which is normally smooth appears in relatively low intensity in Entropy space. The resulting image is thresholded at an automatically selected grey level, using the Otsu algorithm [26]. Normally, the optic disc can be easily identified as the largest area. However, in some cases, such as the appearance of huge exudates in the image, there might be some areas in the image which are larger than the optic disc. Because the shape of optic disc is round, therefore the optic disc region selection process needs to be made specific to the largest one among the regions whose shapes have compactness, as calculate by Equation 7, close to one. To ensure that all the neighbouring pixels of the thresholded result are also included in the candidate region, a binary dilation operator is also applied. For this step, a flat disc-shaped structuring element with a fixed radius of 11 is used. An example result of an image with all the optic disc area masked out is shown in Figure 2B.
- 4.5 A number of neighboring white pixels of the resulting image from the process 4.1 – 4.4 is counted using a window size of 17 × 17 to form our final feature, namely an image of the number of edge pixels as shown in Figure 3D:where area is the number of pixels in the region and perimeter is the total number of pixels around the boundary of each region.
2.4 Fine Segmentation using Morphological Reconstruction
2.5 Performance measurement
3. Results
4. Discussion and Conclusions
Acknowledgments
References
- Olson, J.A.; Strachana, F.M.; Hipwell, J.H. A comparative evaluation of digital imaging, retinal photography and optometrist examination in screening for diabetic retinopathy. Diabet. Med 2003, 20, 528–534. [Google Scholar]
- Hsu, W.; Pallawala, P.M.D.S.; Lee, Mong Li; Eong, Kah-Guan Au. The Role of Domain Knowledge in the Detection of Retinal Hard Exudates. Internat. Conf. on Computer Vision and Pattern Recognition, 2001; pp. II-246–II-251.
- Osareh, A.; Mirmehdi, M.; Thomas, B.; Markham, R. Automated Identification of Diabetic Retinal Exudates in Digital Colour Images. Br. J. Ophthalmol 2003, 87, 1220–1223. [Google Scholar]
- Paisan, R.; Nattapon, W.; Pattanaporn, S.; Ekchai, P.; Montip, T. Screning for Diabetic Retinopathy in Rural Area Using Single-Field, Digital Fundus Images. J. Med. Assoc. Thailand 2005, 88, 176–180. [Google Scholar]
- Sanchez, C.I.; Hornero, R.; Lopez, M.I.; Poza, J. Retinal Image Analysis to Detect and Quantify Lesions Associated with Diabetic Retinopathy. Internat. Conf. on Engineering in Medicine and Biology Society (EMBC), 2004; pp. 1624–1627.
- Sinthanayothin, C.; Boyce, J.F.; Cook, H.L.; Williamson, T.H. Automated Localization of the Optic Disc, Fovea, and Retinal Blood Vessels from Digital Colour Fundus Images. Br. J. Ophthalmol 1999, 83, 231–238. [Google Scholar]
- Bjorvis, S.; Johansen, M.A.; Fossen, K. An economic analysis of screening for diabetic retinophathy. J. Telemed. Telecare 2002, 8, 32–35. [Google Scholar]
- Feman, S.S.; Leonard-Martin, T.C.; Andrews, J.S. A quantitative system to evaluate diabetic retinopathy from fundus photographs. Invest. Ophthalmol. Vis. Sci 1995, 36, 174–181. [Google Scholar]
- Gardner, G.G.; Keating, D; Williamson, T.H.; Elliot, A.T. Automatic Detection of Diabetic Retinopathy using an Artificial Neural Network: a Screening Tool. Br. J. Ophthalmol 1996, 80, 940–944. [Google Scholar]
- Sinthanayothin, C.; Boyce, J.F.; Williamson, T.H.; Cook, H.L. Automated Detection of Diabetic Retinopathy on Digital Fundus Image. Diabet. Med 2002, 19, 105–112. [Google Scholar]
- Wang; Hsu, H.; Goh, W.; Lee, K.G. An Effective Approach to Detect Lesions in Color Retinal Images. Proceedings of IEEE Conf. on Computer Vision and Pattern Recognition, 2000; pp. 181–186.
- Phillips, R.P.; Forrester, J.; Sharp, P. Automated detection and quantification of retinal exudates. Graefe Arch Clin. Exp. Ophthalmol 1993, 231, 90–94. [Google Scholar]
- Huiqi, L.; Chutatape, O. A model-based approach for automated feature extraction in fundus images. Internat. Conf. on Computer Vision (ICCV) 2003, 394–399. [Google Scholar]
- Usher, D.; Dumskyj, M.; Himaga, M.; Williamson, T.H.; Nussey, S.; Boyce, J. Automated detection of diabetic retinopathy in digital retinal images: a tool for diabetic retinopathy screening. Diabet. Med 2004, 21, 84–90. [Google Scholar]
- Goh, K.G.; Hsu, W.; Lee, Li; Wang, H. ADRIS: an Automatic Diabetic Retinal Image Screening system. In Medical data mining and knowledge discovery; Krzysztof, J.C., Ed.; Physica-Verlag: Heidelberg, Germany, 2001; pp. 181–210. [Google Scholar]
- Ege, B.M.; Hejlese, O.K.; Larsen, O.V.; Moller, K.; Jennings, B.; Kerr, D.; Cavan, D.A. Screening for diabetic retinopathy using computer based image analysis and statistical classification. Comput. Meth. Programs Biomed 2000, 62, 165–175. [Google Scholar]
- Walter, T.; Klein, J.C.; Massin, P.; Erginay, A. A Contribution of Image Processing to the Diagnosis of Diabetic Retinopathy-Detection of Exudates in Colour Fundus Images of the Human Retina. IEEE Transactions on Medical Imaging 2002, 21, 1236–1243. [Google Scholar]
- Niemeijer, M.; Ginneken, B.V.; Russell, S.R.; Suttorp-Schulten, M.S.A.; Abramoff, M.D. Automated detection and differentiation of drusen, exudates, and cotton-wool spots in digital color fundus photographs for diabetic retinopathy diagnosis. Invest. Ophthalmol. Vis. Sci 2007, 48, 2260–2267. [Google Scholar]
- Dunn, J.C. A Fuzzy Relative of the ISODATA Process and Its Use in Detecting Compact Well-Seperated Clusters. J. Cyber 1973, 3, 32–57. [Google Scholar]
- Bezdek, J.C. Pattern Recognition with Fuzzy Objective Function Algorithms. Plenum: New York, NY, USA, 1981. [Google Scholar]
- Osareh, A.; Mirmehdi, M.; Thomas, B.; Markham, R. Automatic recognition of exudative maculopathy using fuzzy c-means clustering and neural networks. In Medical Image Understanding Analysis; Claridge, E., Bamber, J., Eds.; BMVA Press: UK, 2001; pp. 49–52. [Google Scholar]
- Osareh, A.; Mirmehdi, M.; Thomas, B.; Markham, R. Classification and Localisation of Diabetic-Related Eye Disease. Internat. European Conf. on Computer Vision 2002, 502–516. [Google Scholar]
- Osareh, A.; Mirmehdi, M.; Thomas, B.; Markham, R. Comparative Exudate Classification using Support Vector Machines and Neural Networks. Internat. Conf. on Medical Image Computing and Computer-Assisted Intervention 2002, 413–420. [Google Scholar]
- Zhang, Xiaohui; Chutatape, O. Top-down and bottom-up strategies in lesion detection of background diabetic retinopathy. IEEE Computer Society Conf. on Computer Vision and Pattern Recognition (CVPR), 2005; pp. 422–428.
- Gonzalez, R.C.; Woods, R.E. Digital image processing, 2nd ed; Addison-Wesley Publishing Co: Upper Saddle River, NJ, USA, 2002; pp. 65–107. [Google Scholar]
- Gillespie, A.R.; Kahle, A.B.; Walker, R.E. Color Enhancement of Highly Correlated Images. I. Decorrelation and HIS Contrast Stretch. Remote Sens. Environ 1986, 20, 209–235. [Google Scholar]
- Phung, Son Lam; Abdesselam, Bouzerdoum; Douglas, Chai. Skin Segmentation Using Color Pixel Classification: Analysis and Comparison. IEEE Transactions on Pattern Analysis and Machine Intelligence 2005, 27, 148–154. [Google Scholar]
- Otsu, N. A threshold selection method from gray-level histograms. IEEE Trans. on Syst. Man. and Cybern 1979, SMC-9, 62–66. [Google Scholar]
- Musa, H.; Musa, Alci. Reliability analysis of microarray data using fuzzy c-means and normal mixture modeling based classification methods. Bioinformatics 2005, 21, 644–649. [Google Scholar]
- Wang, X.Y.; Garibaldi, J.; Ozen, T. Application of The Fuzzy C-Means clustering Method on the Analysis of non Pre-processed FTIR Data for Cancer Diagnosis. Internat. Conf. on Australian and New Zealand Intelligent Information Systems (ANZIIS), 2003; pp. 233–238.
- Attia, John. Moving beyond sensitivity and specificity: using likelihood ratios to help interpret diagnostic tests. Austral. Prescrib 2003, 26, 111–113. [Google Scholar]
- Kallergi, Maria. Evaluation Strategies for Medical-Image Analysis and Processing Methodologies. In Medical image analysis methods: the electrical engineering and applied signal processing series; Costaridou, L., Ed.; CRC Press: Boca Raton, FL, USA, 2005; pp. 433–471. [Google Scholar]


| 24-bit images | TP | FP | FN | TN | Sensitivity (%) | Specificity (%) | PPV (%) | PLR | Accuracy (%) |
|---|---|---|---|---|---|---|---|---|---|
| Image1 | 4898 | 1677 | 741 | 368684 | 86.86 | 99.55 | 74.49 | 191.83 | 99.36 |
| Image2 | 1019 | 350 | 61 | 374570 | 94.35 | 99.91 | 74.43 | 1010.70 | 99.89 |
| Image3 | 81 | 3548 | 27 | 372344 | 75.00 | 99.06 | 2.23 | 79.46 | 99.05 |
| Image4 | 838 | 2294 | 227 | 372641 | 78.69 | 99.39 | 26.76 | 128.60 | 99.33 |
| Image5 | 1247 | 4978 | 67 | 369708 | 94.90 | 98.67 | 20.03 | 71.43 | 98.66 |
| Image6 | 1479 | 2905 | 204 | 371412 | 87.88 | 99.22 | 33.74 | 113.23 | 99.17 |
| Image7 | 126 | 2445 | 23 | 373406 | 84.56 | 99.35 | 4.90 | 129.99 | 99.34 |
| Image8 | 1234 | 2734 | 525 | 371507 | 70.15 | 99.27 | 31.10 | 96.03 | 99.13 |
| Image9 | 381 | 322 | 38 | 375259 | 90.93 | 99.91 | 54.20 | 1060.62 | 99.90 |
| Image10 | 424 | 1729 | 76 | 373771 | 84.80 | 99.54 | 19.69 | 184.17 | 99.52 |
| Method | Sensitivity (%) | Specificity (%) | PPV (%) | PLR | Accuracy (%) |
|---|---|---|---|---|---|
| FCM clustering | 97.2 | 85.4 | 5.9 | 7.9 | 85.6 |
| FCM clustering and morphological | 87.2 | 99.2 | 42.7 | 224.2 | 99.1 |
| Nearest neighbor | 90.4 | 96.6 | 28.6 | 6.2 | 96.5 |
© 2009 by the authors; licensee MDPI, Basel, Switzerland This article is an open-access article distributed under the terms and conditions of the Creative Commons Attribution license (http://creativecommons.org/licenses/by/3.0/).
Share and Cite
Sopharak, A.; Uyyanonvara, B.; Barman, S. Automatic Exudate Detection from Non-dilated Diabetic Retinopathy Retinal Images Using Fuzzy C-means Clustering. Sensors 2009, 9, 2148-2161. https://doi.org/10.3390/s90302148
Sopharak A, Uyyanonvara B, Barman S. Automatic Exudate Detection from Non-dilated Diabetic Retinopathy Retinal Images Using Fuzzy C-means Clustering. Sensors. 2009; 9(3):2148-2161. https://doi.org/10.3390/s90302148
Chicago/Turabian StyleSopharak, Akara, Bunyarit Uyyanonvara, and Sarah Barman. 2009. "Automatic Exudate Detection from Non-dilated Diabetic Retinopathy Retinal Images Using Fuzzy C-means Clustering" Sensors 9, no. 3: 2148-2161. https://doi.org/10.3390/s90302148
APA StyleSopharak, A., Uyyanonvara, B., & Barman, S. (2009). Automatic Exudate Detection from Non-dilated Diabetic Retinopathy Retinal Images Using Fuzzy C-means Clustering. Sensors, 9(3), 2148-2161. https://doi.org/10.3390/s90302148