Article

Petrography and Geochemistry of the Intrusive Rocks at the Diorite-Hosted Regnault Au Mineralization

1
Centre d’Études sur les Ressources Minérales (CERM), Département des Sciences Appliquées, Université du Québec à Chicoutimi (UQAC), 555 Blvd. de l’Université, Chicoutimi, QC G7H 2B1, Canada
2
Kenorland Minerals Ltd., 310-119 W Pender Street, Vancouver, BC V6B 1S5, Canada
*
Author to whom correspondence should be addressed.
Minerals 2022, 12(2), 128; https://doi.org/10.3390/min12020128
Submission received: 23 December 2021 / Revised: 17 January 2022 / Accepted: 20 January 2022 / Published: 23 January 2022
(This article belongs to the Special Issue Magmatic-Hydrothermal Systems through Time)

Abstract

:
Archean greenstone belts are renowned for their Au endowment. Gold can be associated with orogenic Au style of mineralization and with diorite-hosted Au-Cu disseminated sulfides interpreted as a porphyry style of mineralization. The Regnault Au project, located in the Frotet–Evans greenstone belt (Superior craton), is a structurally-controlled and diorite-hosted mineralization with an unclear metallogenic model. The aim of this study is to evaluate the fertility of the Regnault granodiorite-diorite-gabbro intrusive. Using whole-rock chemistry and petrological observations, it is concluded that the intrusive suite derives from a differentiated and water-bearing magma extracted from the metasomatized mantle. Amphibole chemistry indicates that the magma was moderately oxidized and that it emplaced at a shallow depth. It is concluded that the Regnault intrusive suite displays several characteristics favorable to the exsolution of magmatic fluids in the upper crust and that the Regnault Au mineralization potentially corresponds to, at least in part, a magmatic-hydrothermal system.

1. Introduction

The Baie James area, located in the southern part of the Superior craton, Québec, Canada, is the focus of exploration efforts for Au and base metals mineralization. Exploration focuses on orogenic gold systems, such as the Roberto deposit [1,2], and on magmatic-hydrothermal mineralization, such as the Cheechoo Au project [3] and the Troilus Au-Cu porphyry [4]. Orogenic gold systems are defined as Au-only mesothermal hydrothermal systems dominated by metamorphic fluids [5]. In contrast, porphyry Au-Cu deposits are magmatic-hydrothermal systems related to fluids generally exsolved by diorite-bearing magmatic systems [6].
In the southern part of the Superior craton, most diorite-associated porphyry deposits are located in the Abitibi greenstone belt. These include the ca. 2.74 Ga Côté-Gold Au ± Cu mine [7,8] and the ca. 2.72 Ga Cu-Au deposits of Central Camp, Chibougamau [9,10,11]. Other deposits associated to diorite intrusions are located in the Frotet–Evans greenstone belt (Opatica sub-province) and correspond to the 2.79 Ga Au-Cu Troilus porphyry [12,13] and to the poorly documented Regnault Au mineralization [14].
The Regnault Au project is a diorite-hosted mineralization dominated by quartz veins and disseminated sulfide [14]. It is also structurally controlled and spatially associated with major structures such as E-W fault zones and fold axes [14]. The mineralizing process at Regnault is unclear and may have involved: (1) magmatic-hydrothermal processes; (2) hydrothermal processes during a major metamorphic and deformation event, or; (3) a multi-stage process implicating both magmatic and metamorphic fluids.
This study focuses on the least-altered part of the granodiorite-diorite-gabbro intrusive complex of Regnault and aims at determining its petrogenesis and depth of emplacement. Results are used to discuss the opportunity, for the studied magmatic system, to exsolve a significant volume of magmatic fluids with a mineralizing potential. This study does not provide a definitive metallogenic model for the Regnault Au project, as such a model requires a detailed study of mineralized rocks, which is beyond the scope of this study. This study, however, evaluates the fertility of the intrusive complex that hosts the mineralization.

2. Geological Setting

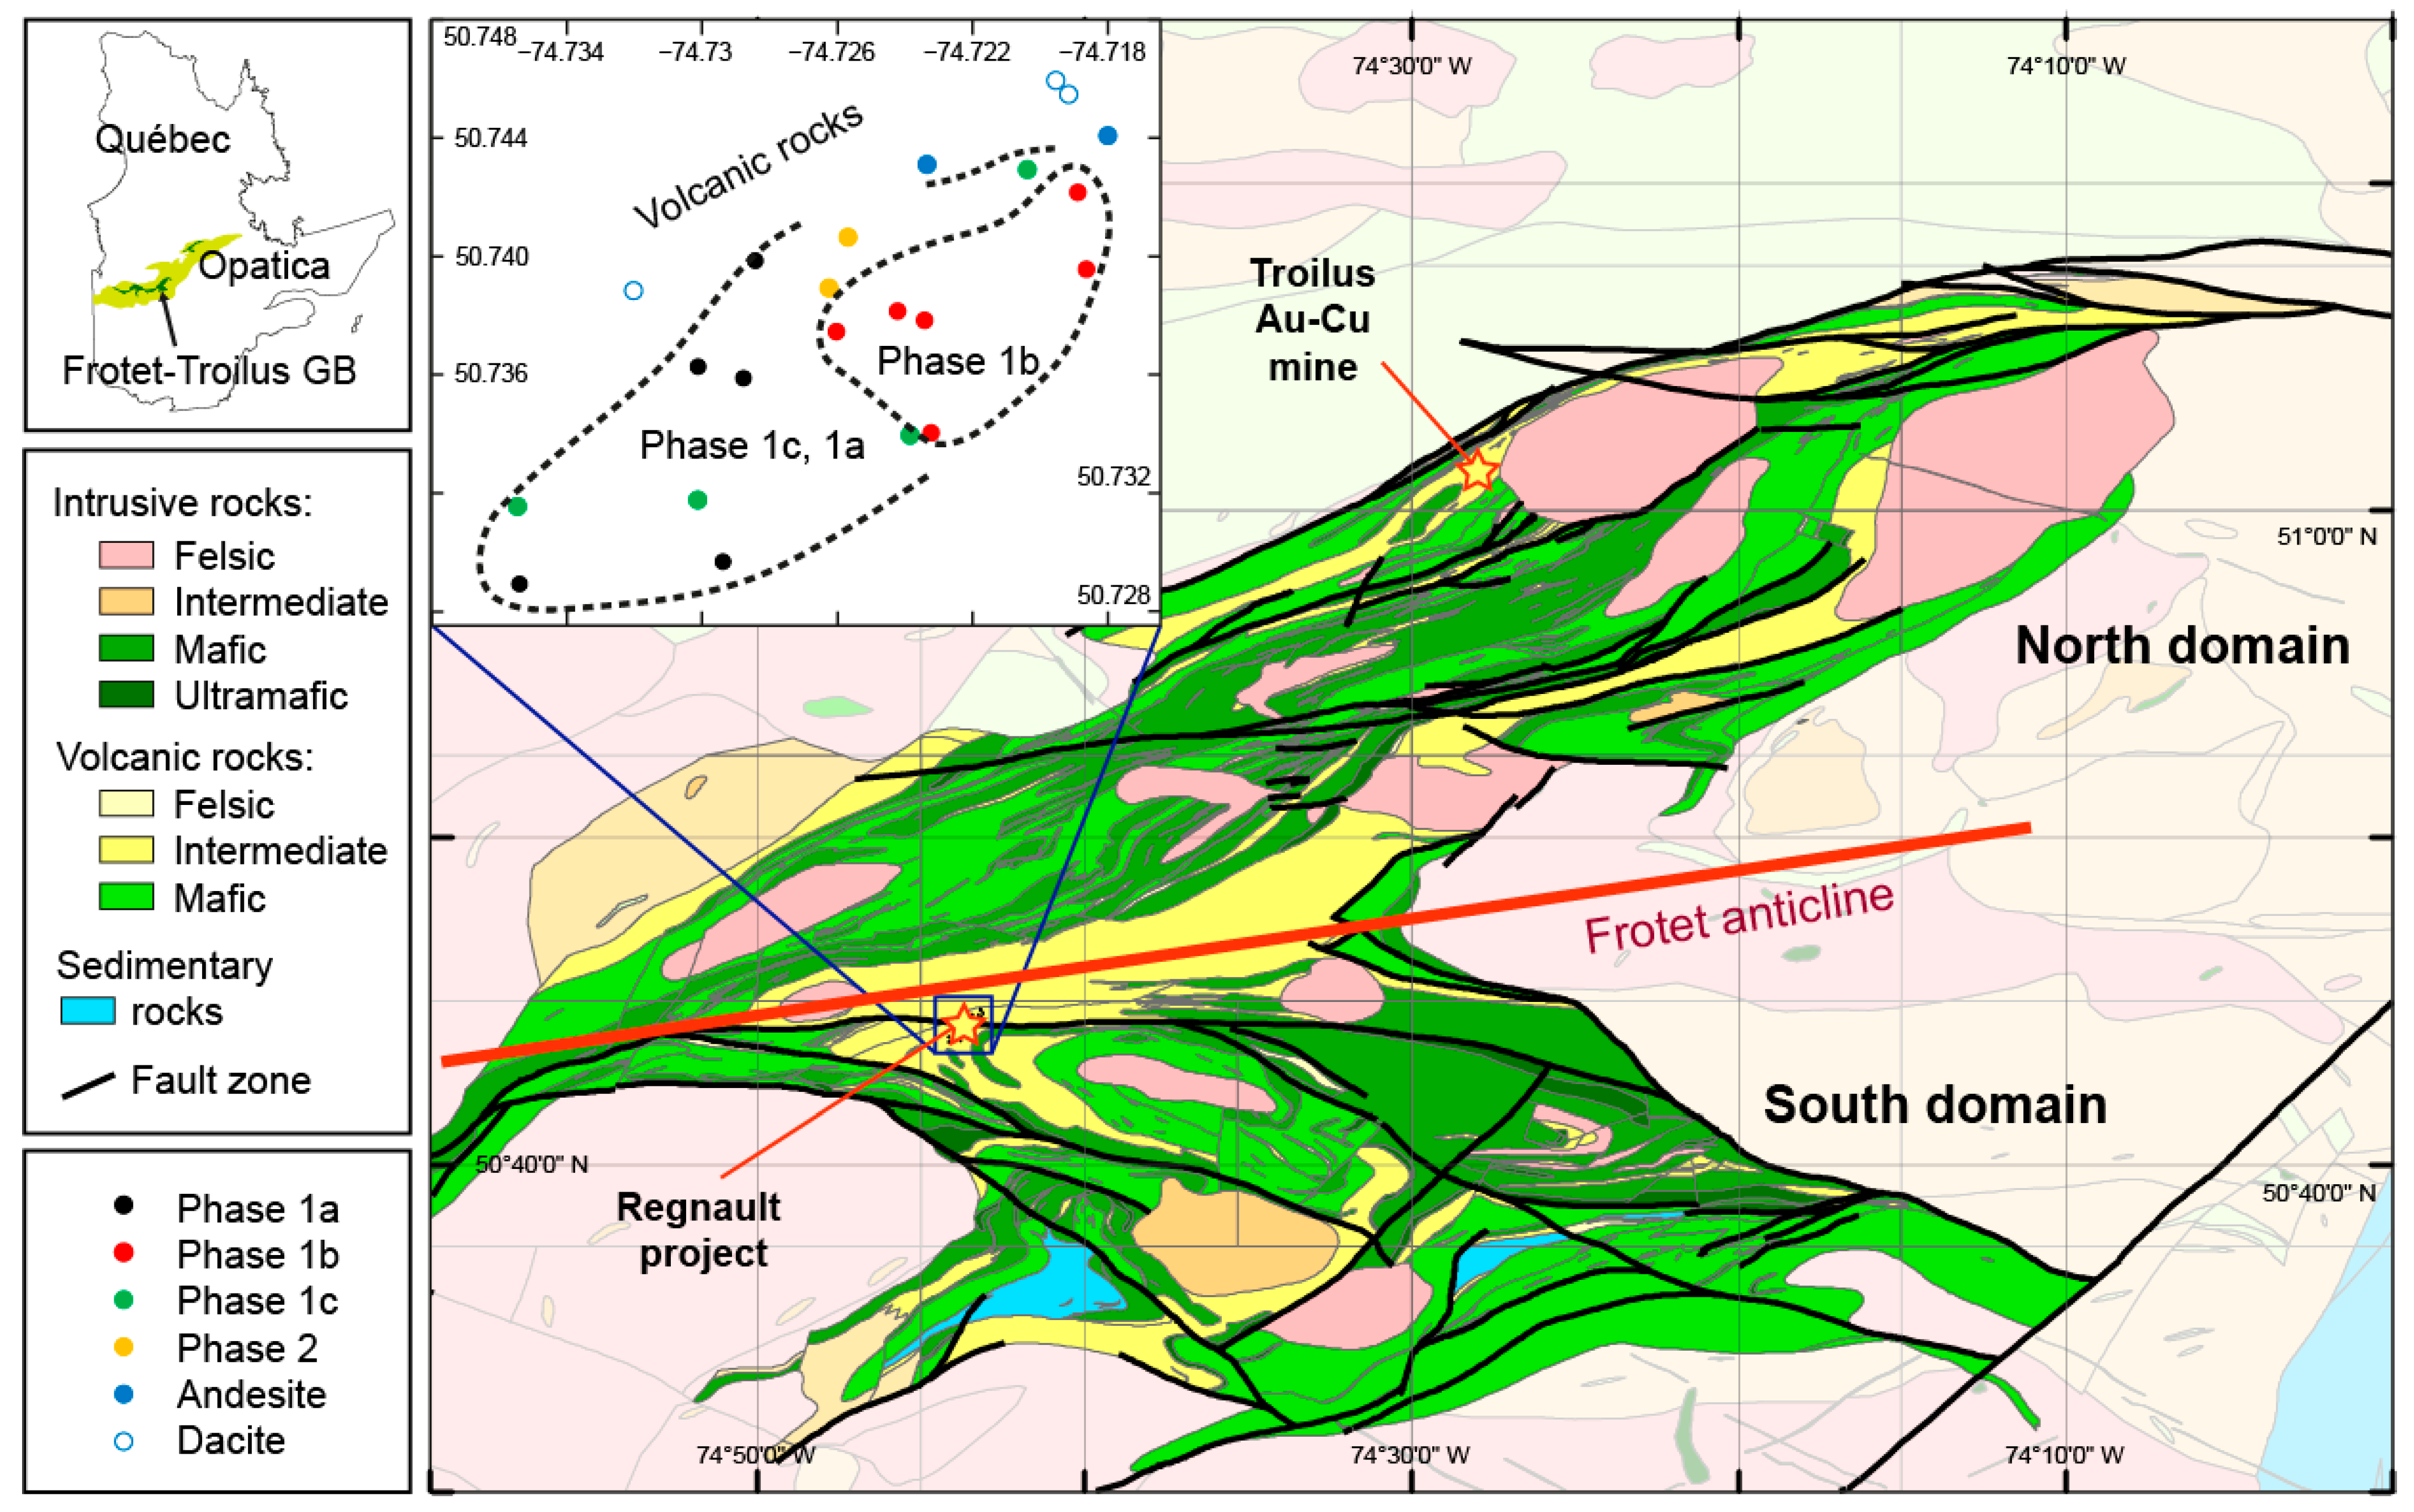
2.1. Regional Geology

The study area is located in the Opatica sub-province, in the southern part of the Superior craton, Canada (Figure 1). This sub-province is dominated by tonalite gneiss of medium- to high-metamorphic grade (migmatite are locally observed) and by the supracrustal rocks of the Frotet–Evans greenstone belt. This greenstone belt is dominated by mafic to felsic volcanic rocks that have been metamorphosed to the conditions of the greenschist facies and to higher grade (lower-amphibolite facies) near the plutons [15]. The prefix “meta”, however, is omitted hereafter.
In Archean cratons, the main magmatic phase is referred to as the synvolcanic period, during which voluminous tonalite-dominated intrusive complexes (e.g., tonalite-trondhjemite-granodiorite—TTG—suites) and tholeiitic lava flows are produced. Tonalite and tonalite gneiss of the Opatica sub-province assembled and crystallized between ca. 2820 Ma to 2702 Ma [16,17], and these rocks constrain the age of the synvolcanic period. Additionally, during this period, the volcanic rocks of the Frotet–Evans greenstone belt were emplaced at ca. 2793–2755 Ma according to known ages [18].
The synvolcanic period is followed by the syntectonic period, which leads to the stabilization of the craton (cratonization) and during which deformation, sedimentation, and K-rich magmatism prevail, as is the case for greenstone belts around the world [19]. For the Opatica sub-province, the syntectonic stage is characterized by the following deformation events [16]: (1) deformation event 1 (D1) that corresponds to early thrusting initiating at ca. 2702 Ma; (2) main deformation event, D2, which corresponds to N-S shortening at ca. 2693–2696 Ma or later; and (3) late deformation event, D3, which mostly corresponds to strike-slip movements along major shear zones such as the Nottaway River and Lucky Strike faults with a maximum age of 2686 ± 4 Ma recorded by a fault-hosted deformed granite [16,20,21].
The Frotet–Evans greenstone belt is divided in four segments, and this study focuses on the Frotet–Troilus segment located in the easternmost part of the belt (Figure 1). This segment consists of four volcanic cycles, each made of komatiite, basalt, and intermediate-felsic volcanic rocks, as well as coeval intrusions [15,22]. The North and South domains, within the Frotet–Troilus segment, are separated by the Frotet anticline (Figure 1). The Troilus Au-Cu mine (porphyry deposit) is located in the North domain and the Regnault Au project, on which this study focuses (Figure 1), is located immediately south of the fold axis. Other mineralization, in the belt, includes VMS (Zn-Cu-Ag-Au) and orogenic gold [12,23,24,25]. The mineralization, at Regnault, is spatially associated with the Frotet Formation, located in an intermediate position in the stratigraphy of the Frotet–Troilus segment [4,26]. The Frotet Formation is dominated by calc-alkaline pyroclastic deposits and also comprises tholeiitic to transitional basalt lava flows [26]. The Frotet Formation contains subalkaline synvolcanic intrusions, including gabbro and diorite, as well as some granodiorite and granite [26].

2.2. Regnault Project

The study area is part of the Frotet exploration project (Kenorland Minerals Ltd., Vancouver, BC, Canada) and was developed following a 2018–2019 till survey that led to the discovery of gold anomalies. High-grade gold zones were then intersected in the Regnault area by drilling in 2020 [26]. Drill hole 20RDD007 has returned the most significant mineralization to date, i.e., 29.08 m @8.47 ppm Au and 12.23 ppm Ag, including 11.13 m @18.43 ppm Au and 25.93 ppm Ag, and this mineralization consists of diorite-hosted quartz ± calcite stockwork veining and disseminated pyrite [26]. The following relies entirely on drill core samples and geophysical surveys, as outcrops are lacking at Regnault [26].
The mineralization is mostly hosted by locally-brecciated gabbro and diorite intrusive phases, as well as volcanoclastic units. The granodiorite-diorite-gabbro intrusive complex of Regnault shares chemical similarities with the intrusions observed in the area of the past producing Troilus mine [26]. At Regnault, sulfide-free quartz veins are generally barren and mineralization, including visible gold, is associated with quartz veining and disseminated pyrite, i.e., commonly 1–5%, up to 5–10% pyrite [26]. The best gold grades are also associated with a minor amount of chalcopyrite and/or galena. Gold is positively correlated with Te, Bi, Pb, and Ag (correlation coefficient > 0.9) [26]. Biotitization is restricted to the selvages of gold-bearing quartz veins [26]. Folded veins are abundantly observed at Regnault, and other evidence suggests that the mineralization may, at least in part, be pre-deformation [26].

3. Methodology

Sampling of 22 least-altered and un-mineralized core sections from the Regnault project was performed on-site in December 2019 and January 2020. Sampling aimed at documenting the main lithologies encountered by the drilling program, i.e., mostly diorite (n = 15 samples), as well as gabbro (n = 2), dacite (n = 3), and andesite (n = 2). Sample location is reported by Table S1A.

3.1. Whole-Rock Chemsitry

Whole-rock chemical analyses were performed by ALS Chemex Ltd. (Vancouver, BC, Canada) on the 22 half-core samples collected in the field in 2019–2020 (inset, Figure 1). Major elements were analyzed by inductively coupled plasma (ICP) atomic emission spectroscopy (AES) following acid digestion, applying a detection limit of 0.01 wt.%. Most trace elements were analyzed by ICP mass spectrometry (MS) following lithium borate fusion, with detection limits ranging from 0.01 to 5 ppm. Analytical results are reported by Table S1B.
The Kenorland dataset, which contains 14,312 entries, was also considered. Samples from this unpublished dataset are distributed over the area displayed by Figure 1’s inset and correspond to the whole suite of occurring rocks, including mineralized and altered samples. These analyses were performed by Bureau Veritas Ltd. (Chicoutimi, Canada), following four-acids digestion on half-core samples measuring ~0.5 to 1.5 m long. Major elements were analyzed by ICP emission spectroscopy (ES) following acid digestion, applying a detection limit of 0.01–0.001 wt.%. Trace elements were analyzed by ICP-MS, with detection limits ranging from 0.5 to 5 ppm.

3.2. Petrography and Mineral Chemistry

Thick (50 μm) polished sections were obtained from 22 core samples (Table 1). Petrographic observations were performed using an Olympus BX53M petrographic microscope equipped with a motorized stage and an SC50 camera. Further characterization was performed using a petrographic microscope (Olympus Instruments) equipped with cathodoluminescence (CL8200 Mk5-1 Optical) at UQAC. In addition, back-scattered electron (BSE) images were obtained for 13 samples, using a Tescan Vega 3 scanning electron microscope (SEM) at the Mineral Exploration Research Centre, Laurentian University (Sudbury, ON, Canada). Chemical data were also obtained using the SEM instrument and using an energy-dispersive detector (EDS) (Table S2A–E).
Quantitative laser ablation ICP-MS (LA-ICP-MS) analyses of amphibole were carried out at the LabMaTer laboratory (UQAC) on 17 samples. These in situ analyses were run using a RESOlution ArF-193nm excimer laser ablation system (Australian Scientific Instrument) equipped with a double-volume cell S-155 (Laurin Technics) coupled to an Agilent 7900 ICP-MS. The parameters used for these analyses were a beam size of 75 µm, a laser frequency of 15 Hz, a dwell time of 5 to 20 ms for each element, and an energy density of 5 J/cm2. Amphibole and reference materials were analyzed using lines (stage speed = 10 µm/s) after measuring the gas blank for 30 s.
For most elements, calibration was performed using the NIST610 reference material, which is a glass doped with ~500 ppm of each trace element [28]. Data quality was monitored using the NIST612, NIST614, BC28 (magnetite), GP6, and GSD reference materials [29,30,31]. The results are in good agreement with working values, except for P (all the standards), as well as K and Fe (NIST standards; Table S3A–G).
Trace elements determined using laser ablation (LA-ICP-MS) methods at UQAC were reduced using the LADR 1.1.60 software (Kingston, Australia) and the internal standard 29Si. For amphibole, a single integration box is used to characterize the average chemistry of the grain. Exceptions include grains displaying 2 to 3 domains with distinct chemistries, for which 2 to 3 integration boxes per grain are used, and a total of 121 integrations were used. Amphibole grains are heterogeneous at a scale smaller than the beam size (75 µm) and are enriched in micro-inclusions (see Section 4.3)—as a consequence, the value for the internal standard could not be obtained from EDS spot analyses (note that acquiring data using a microprobe instrument would have failed for the same reason). Instead, amphibole chemistry was exported using a generic value for 29Si (i.e., 10 wt% Si) and the analyses (major elements only) were re-calculated to 100% to approximate the average silica content of individual amphibole grains. These calculated silica values are reported in Table S3H and range from 44.4 to 68.2 wt% SiO2, with one outlier at 20 wt% SiO2. These calculated values were then reported in the LADR software and used as internal standards.

4. Results

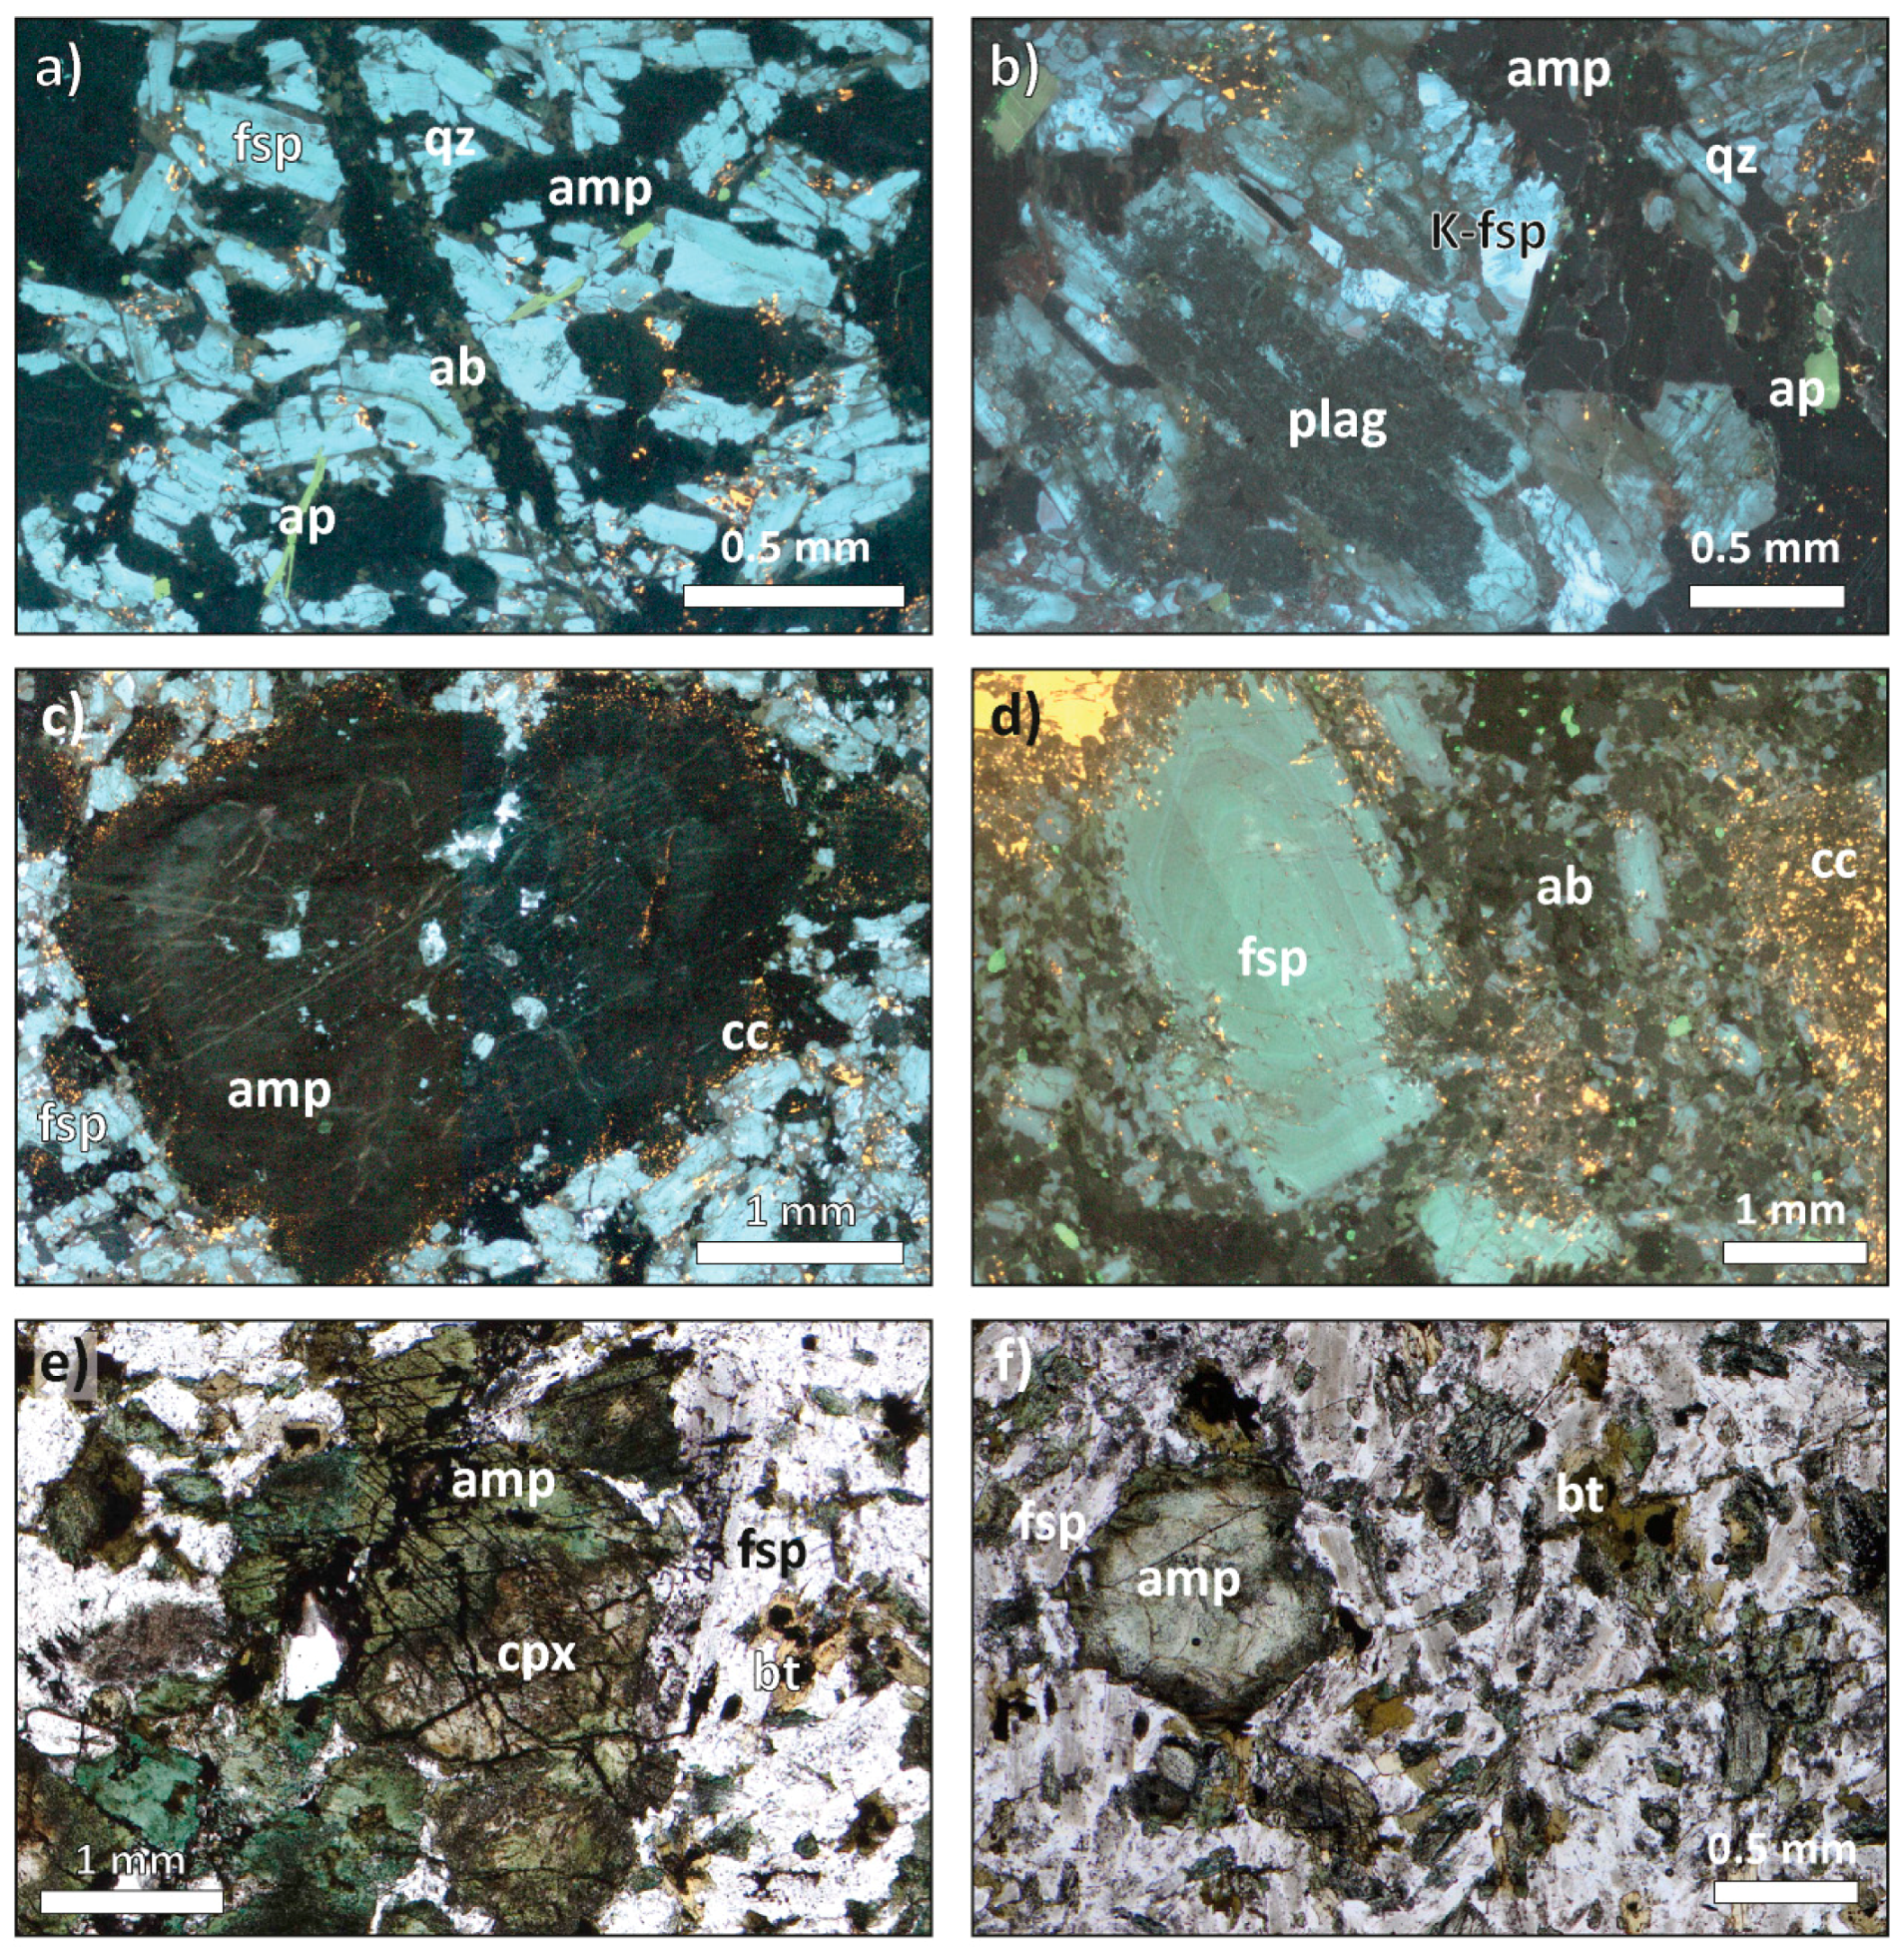
4.1. Petrography and Texture of the Main Lithologies

In the core section, the most frequently observed rock is a medium- to coarse-grained intrusive rock reported as diorite in the drill logs. This rock is dominated by euhedral plagioclase and amphibole grains. Petrographic observation indicates that this intrusive phase can be sub-divided into Phase 1a and Phase 1b on the basis of the occurrence and lack (or low abundance), respectively, of K-feldspar. Phase 1a (samples TR06, TR10, TR41, TR43, and TR44) is made of plagioclase (45–65 vol%), amphibole (12–25 vol%), quartz (2–25 vol%), K-feldspar (5–15 vol%), biotite (5–10 vol%), and accessory phases (see below). Phase 1b (samples TR03, TR05, TR07, TR13, TR15, and TR40) is made of plagioclase (50–75 vol%), amphibole (20–30 vol%), quartz (5–10 vol%), biotite (5–10 vol%), and accessory phases (Table 1).
The other intrusive phase observed in the core section is a fine-grained rock dominated by plagioclase and quartz, that contains more biotite than amphibole. This rock is designated Phase 1c (samples TR11, TR16, TR21, and TR29). Samples TR11 and TR21 are equigranular, and the other samples are plagioclase-phyric. Phase 1c is made of plagioclase (50–55 vol%, up to 70 vol%), quartz (15–30 vol%), biotite (10–20 vol%), amphibole (2–7 vol%), trace amount of K-feldspar, and accessory phases (Table 1). In sample TR29, the intrusive phase contains 13 vol% biotite and it encloses two types of enclaves: (1) biotite-enriched (~40 vol% biotite + amphibole) enclaves that otherwise contain the same minerals as the main phase; and (2) mafic enclaves dominated by extensively altered mafic minerals (now actinolite) and plagioclase (now epidote ± quartz).
The rocks designated gabbro in the field (samples TR04 and TR23) will be referred to as Phase 2 in the rest of the text. These samples are more amphibole-rich than Phase 1 samples. The texture of sample TR04 is similar to the coarse-grained diorite (Phases 1a and 1b), and sample TR23 is medium-grained. Phase 2 rocks contain amphibole (45–50 vol%), plagioclase (40 vol%), quartz (5 vol%), trace biotite (chloritized), and accessory phases (Table 1).
Andesite samples (TR28 and TR31) are dominated by plagioclase (60–70 vol%), amphibole (18–30 vol%), and quartz (0–5 vol%). Dacite samples (TR26, TR32, and TR35) are dominated by plagioclase (40–60 vol%), amphibole (13–20 vol%), quartz (20–30 vol%), and biotite (5 vol%). Apart from sample TR28, which is the least-altered and displays a trachytic texture, the other samples are fine-grained, and magmatic textures have been obliterated by alteration and deformation.
In the bulk of rocks, the main secondary minerals are sericite and epidote (hydrolysis of feldspar), chlorite (replaces biotite), actinolite (replaces hornblende), and carbonate (Table 1). For this reason, hydrothermal alteration is generally poorly expressed in the studied rocks and consists of carbonate veinlets and disseminated sulfide. Other alteration styles are described below.

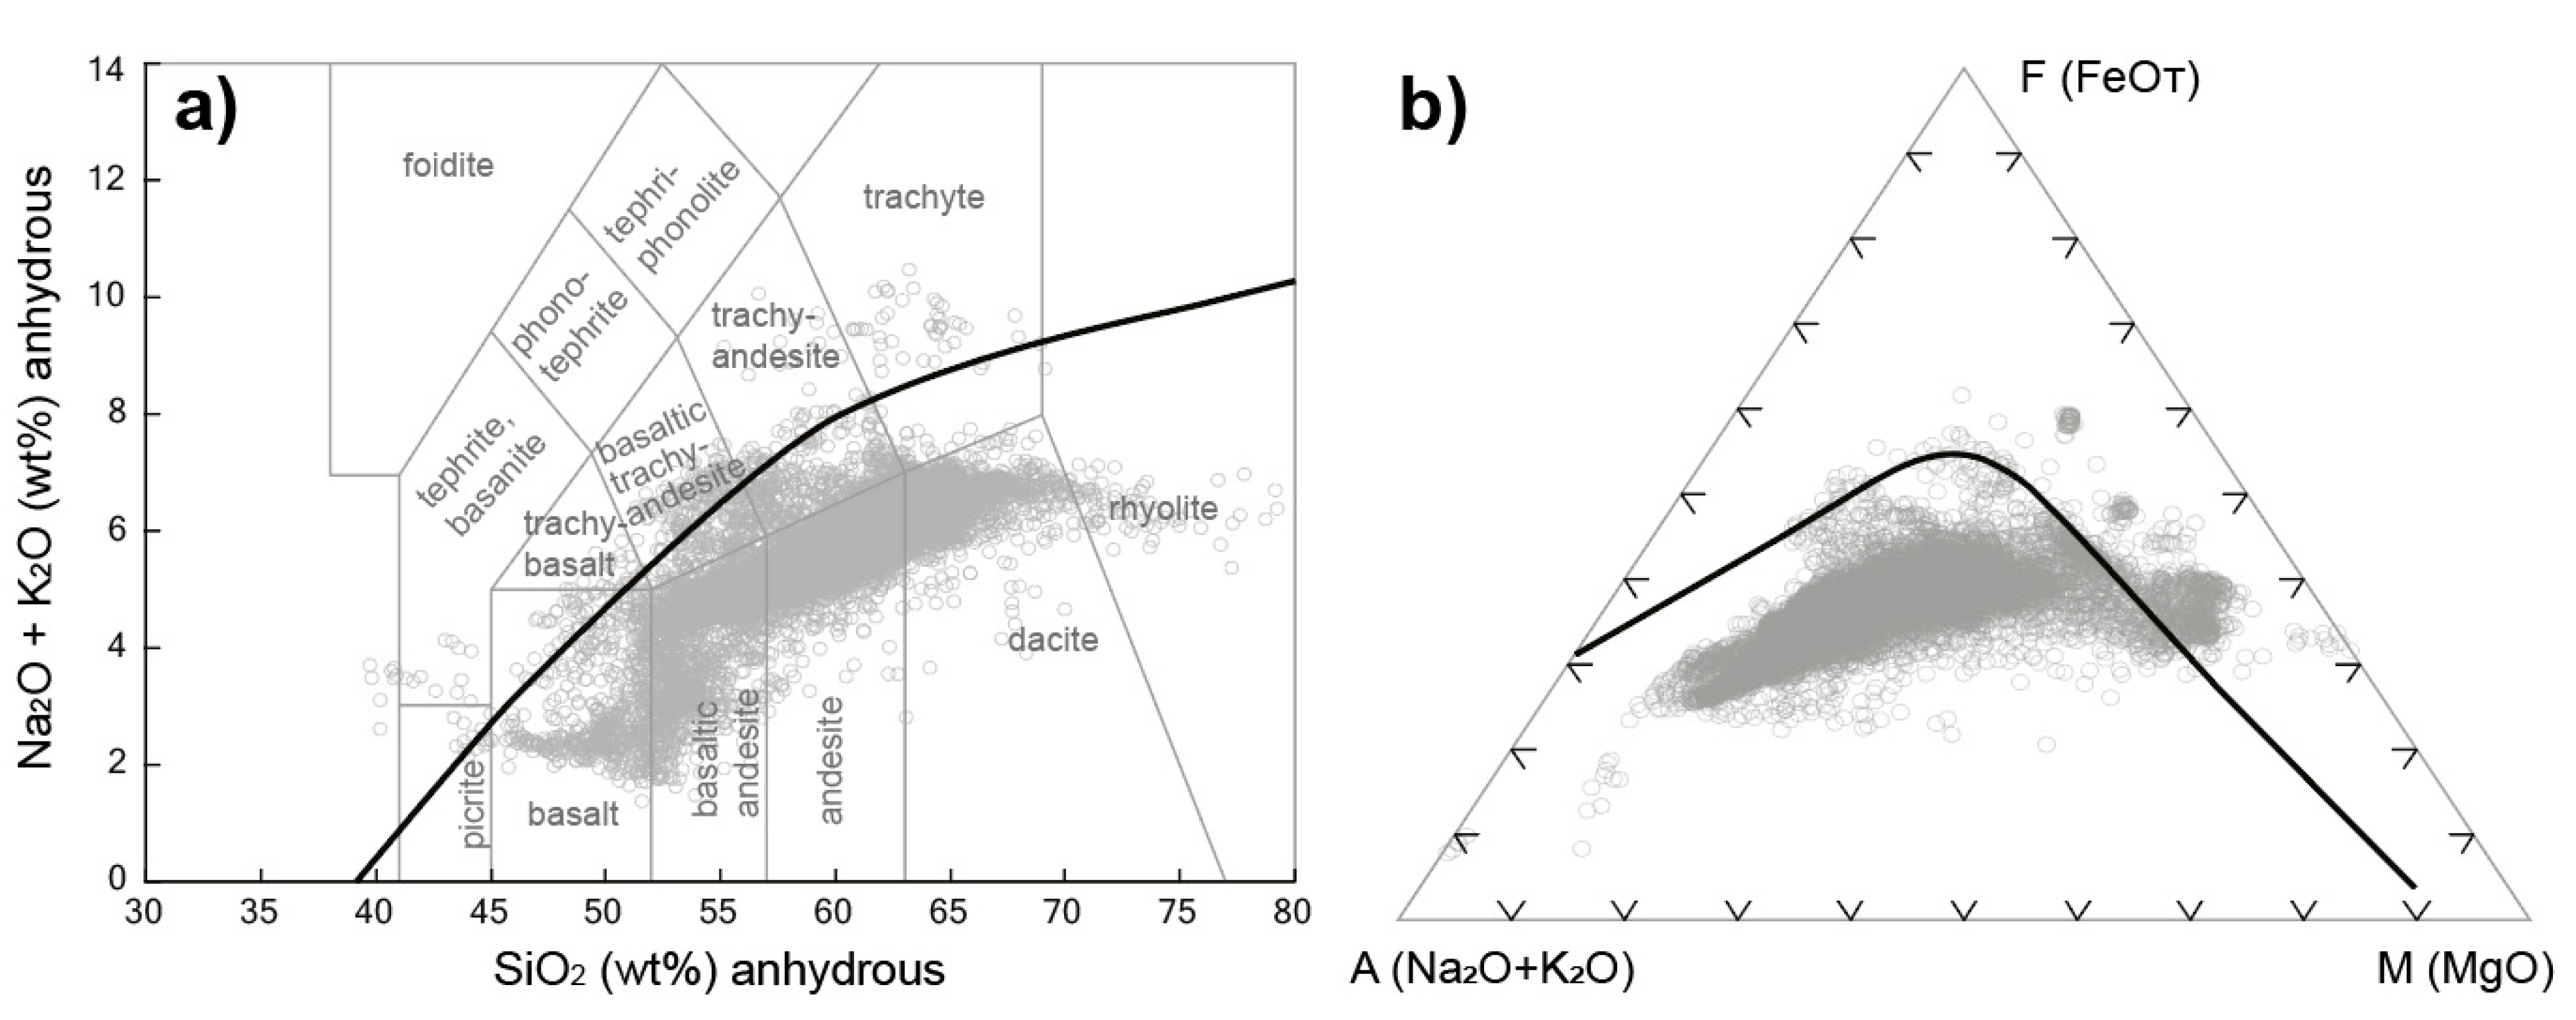
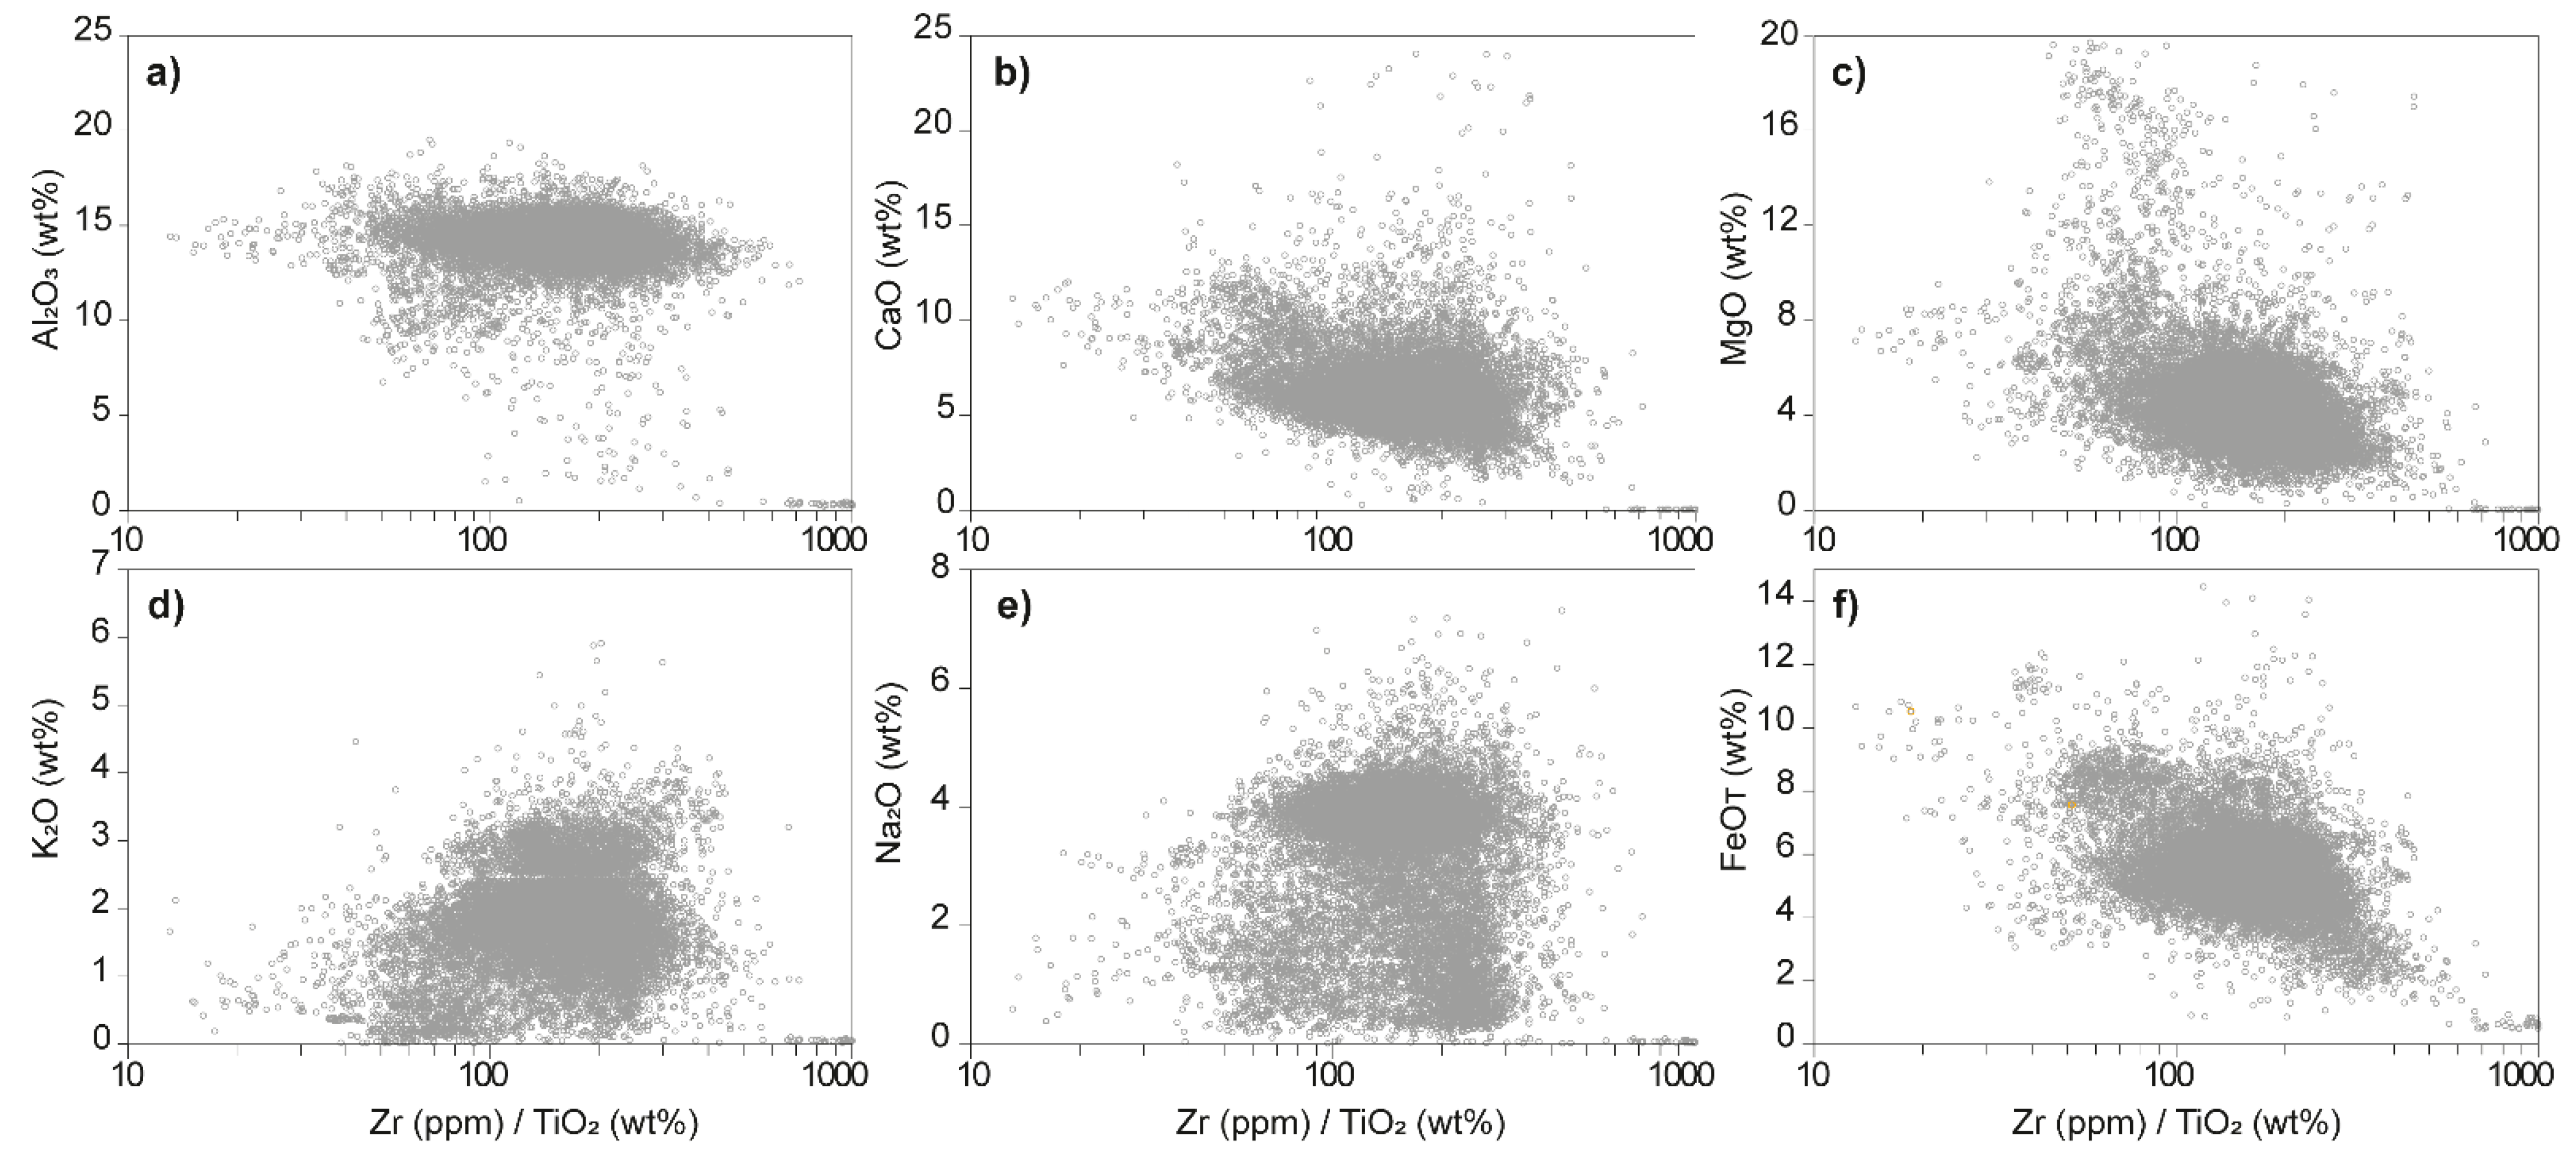
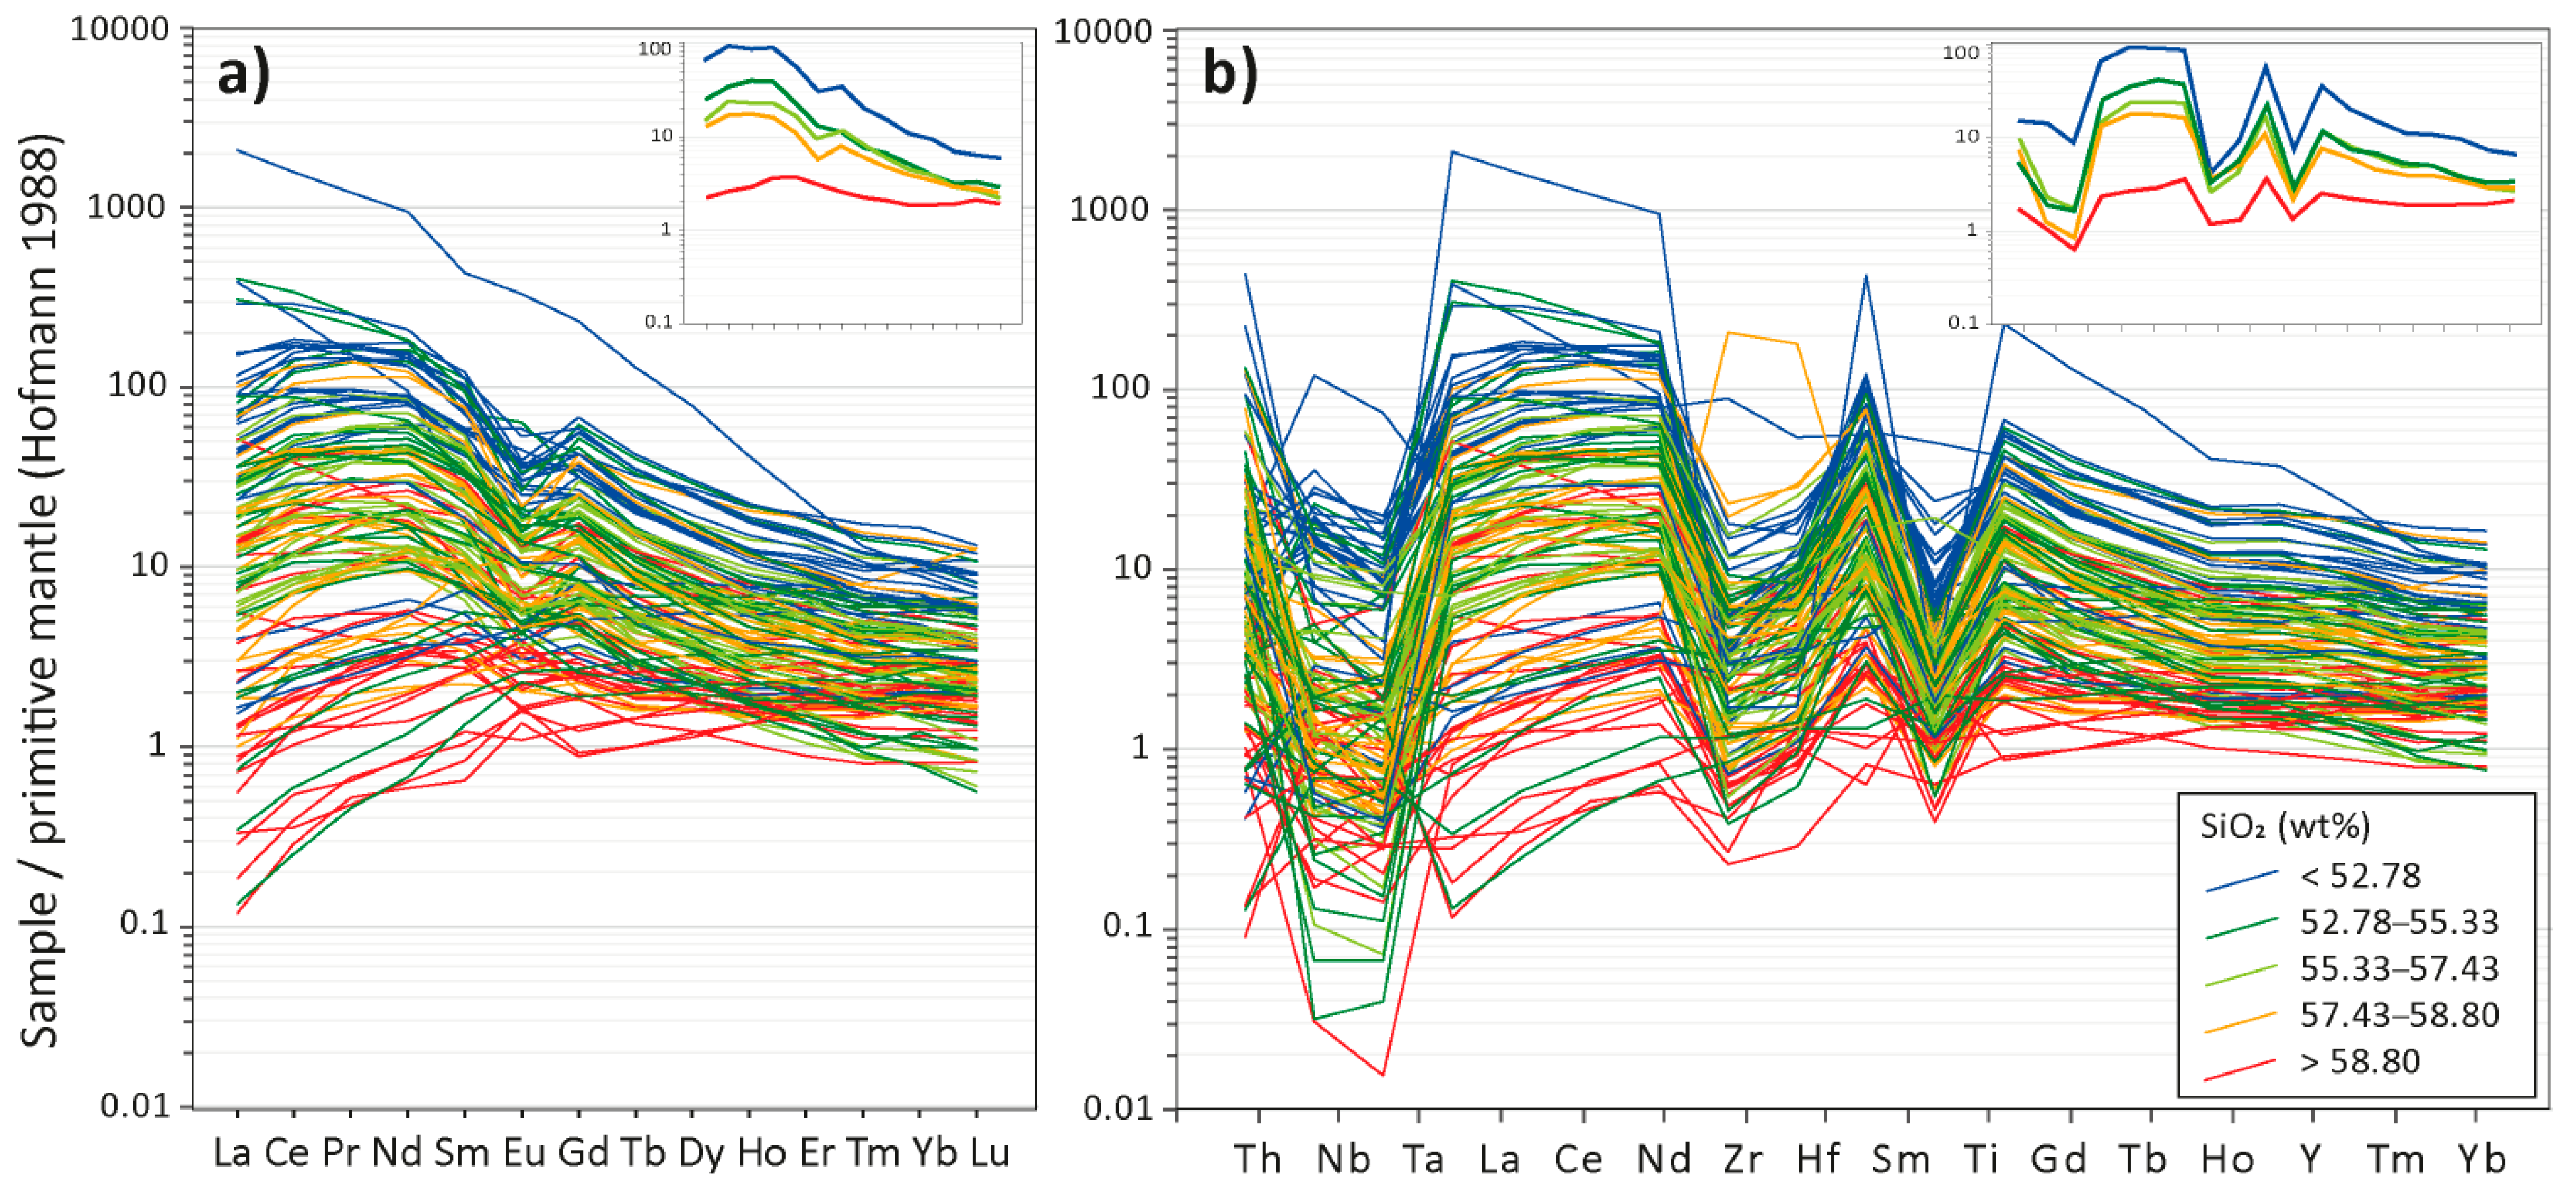
4.2. Whole-Rock Chemistry

The analyses of the Kenorland dataset provide information on most major elements (SiO2 excluded) and on some trace elements. The missing silica values were calculated using the modelled precursor method of Trépanier et al. [32], which is a neuronal network-based method designed to calculate the major element composition of altered rocks on the basis of their minor and trace element content, i.e., Al, Ti, Zr, Y, Cr, Th, and Nb, and that also performs mass balance calculations.
The calculated precursors (Kenorland dataset) are examined on the TAS and AFM diagrams (Figure 2a,b). With the exception of basalts, which may be tholeiitic, most samples define a single sub-alkaline and calc-alkaline trend on the TAS and AFM diagrams, respectively. Mafic to felsic samples are observed, with samples with intermediate composition (possibly diorite) being the most abundant (Figure 2a,b). A few samples are Na-K-enriched and plot in the alkaline field of the TAS diagram, which either indicates the presence of alkaline rocks or points to a few calculation errors generated by the method of Trépanier et al. [32]. The Kenorland dataset is also displayed on major elements vs. Zr/TiO2 binary diagrams (Figure 3). In these diagrams, Zr/TiO2 is used as a proxy to the un-analyzed SiO2 values, i.e., diagrams of Figure 3 are the equivalent of Harker diagrams. The lack of clear correlations can be a consequence of both alteration and multiple lithologies, as the dataset contains intrusive and extrusive rocks with calc-alkaline and tholeiitic affinities (Figure 2). Tendencies are nonetheless observed, as CaO, MgO, and FeOT are negatively correlated to the Zr/TiO2 ratio, and Al2O3 displays limited variation (Figure 3). The alkali content varies significantly among samples, possibly as a consequence of alteration.
The 22 new samples are irregularly distributed in the sub-alkaline field of the TAS diagram (Figure 4a). The precursors calculated using the method of Trépanier et al. [32] are less scattered, and these calculated compositions indicate that Phase 2 is mafic (gabbro), Phase 1b is intermediate (diorite), and Phases 1c and 1a are felsic (granodiorite), while volcanic rocks identified as andesite and dacite in the field correspond to basalt-andesite and dacite, respectively (Figure 4b). On the REE and multielement diagrams (Figure 4c,d), most samples are enriched in the most incompatible elements and display fractionated profiles, with fractionation increasing from dacite (La/YbN = 13, median value), through sample TR04 classified as Phase 2 (La/YbN = 15), Phase 1b (La/YbN = 22), Phase 1c (La/YbN = 25), to Phase 1a (La/YbN = 42). In these samples, trace elements are least abundant in dacite, and the trace element content increases from sample TR04 (Phase 2), through Phase 1b, Phase 1c, and is maximum in Phase 1a. The main exception is sample TR03 (Figure 4c,d), which is the most enriched in trace elements and has been assigned to Phase 1b on the basis of its petrology (Table 1). The samples display a “hockey stick” pattern in the REE diagram. Samples also lack Eu anomalies and display negative Nb-Ta and Ti anomalies. The negative Zr-Hf anomaly is most pronounced in Phase 2 (sample TR04) and Phase 1b, less pronounced in Phases 1c and 1a, and is lacking in dacite. The other samples display flat profiles (La/YbN = 0.5–1.4) and correspond to the two andesite samples and to sample TR23 assigned to Phase 2 (Figure 4c,d).
Results of mass balance calculation performed with the method of Trépanier et al. [32] indicate no mass change to minor MgO, FeOT, and CaO gains (i.e., 1–2 g gains per 100 g of precursor) and point to no mass change for Na2O and K2O. For silica, mass changes could not be calculated for the Kenorland dataset because silica analyses are not available. For the 22 new samples, silica mass changes are limited. Displaying the main mass changes on a binary diagram shows that 40% of the samples of the Kenorland dataset gained >2 g (FeO + MgO) and >1 g CaO (Figure 4e).

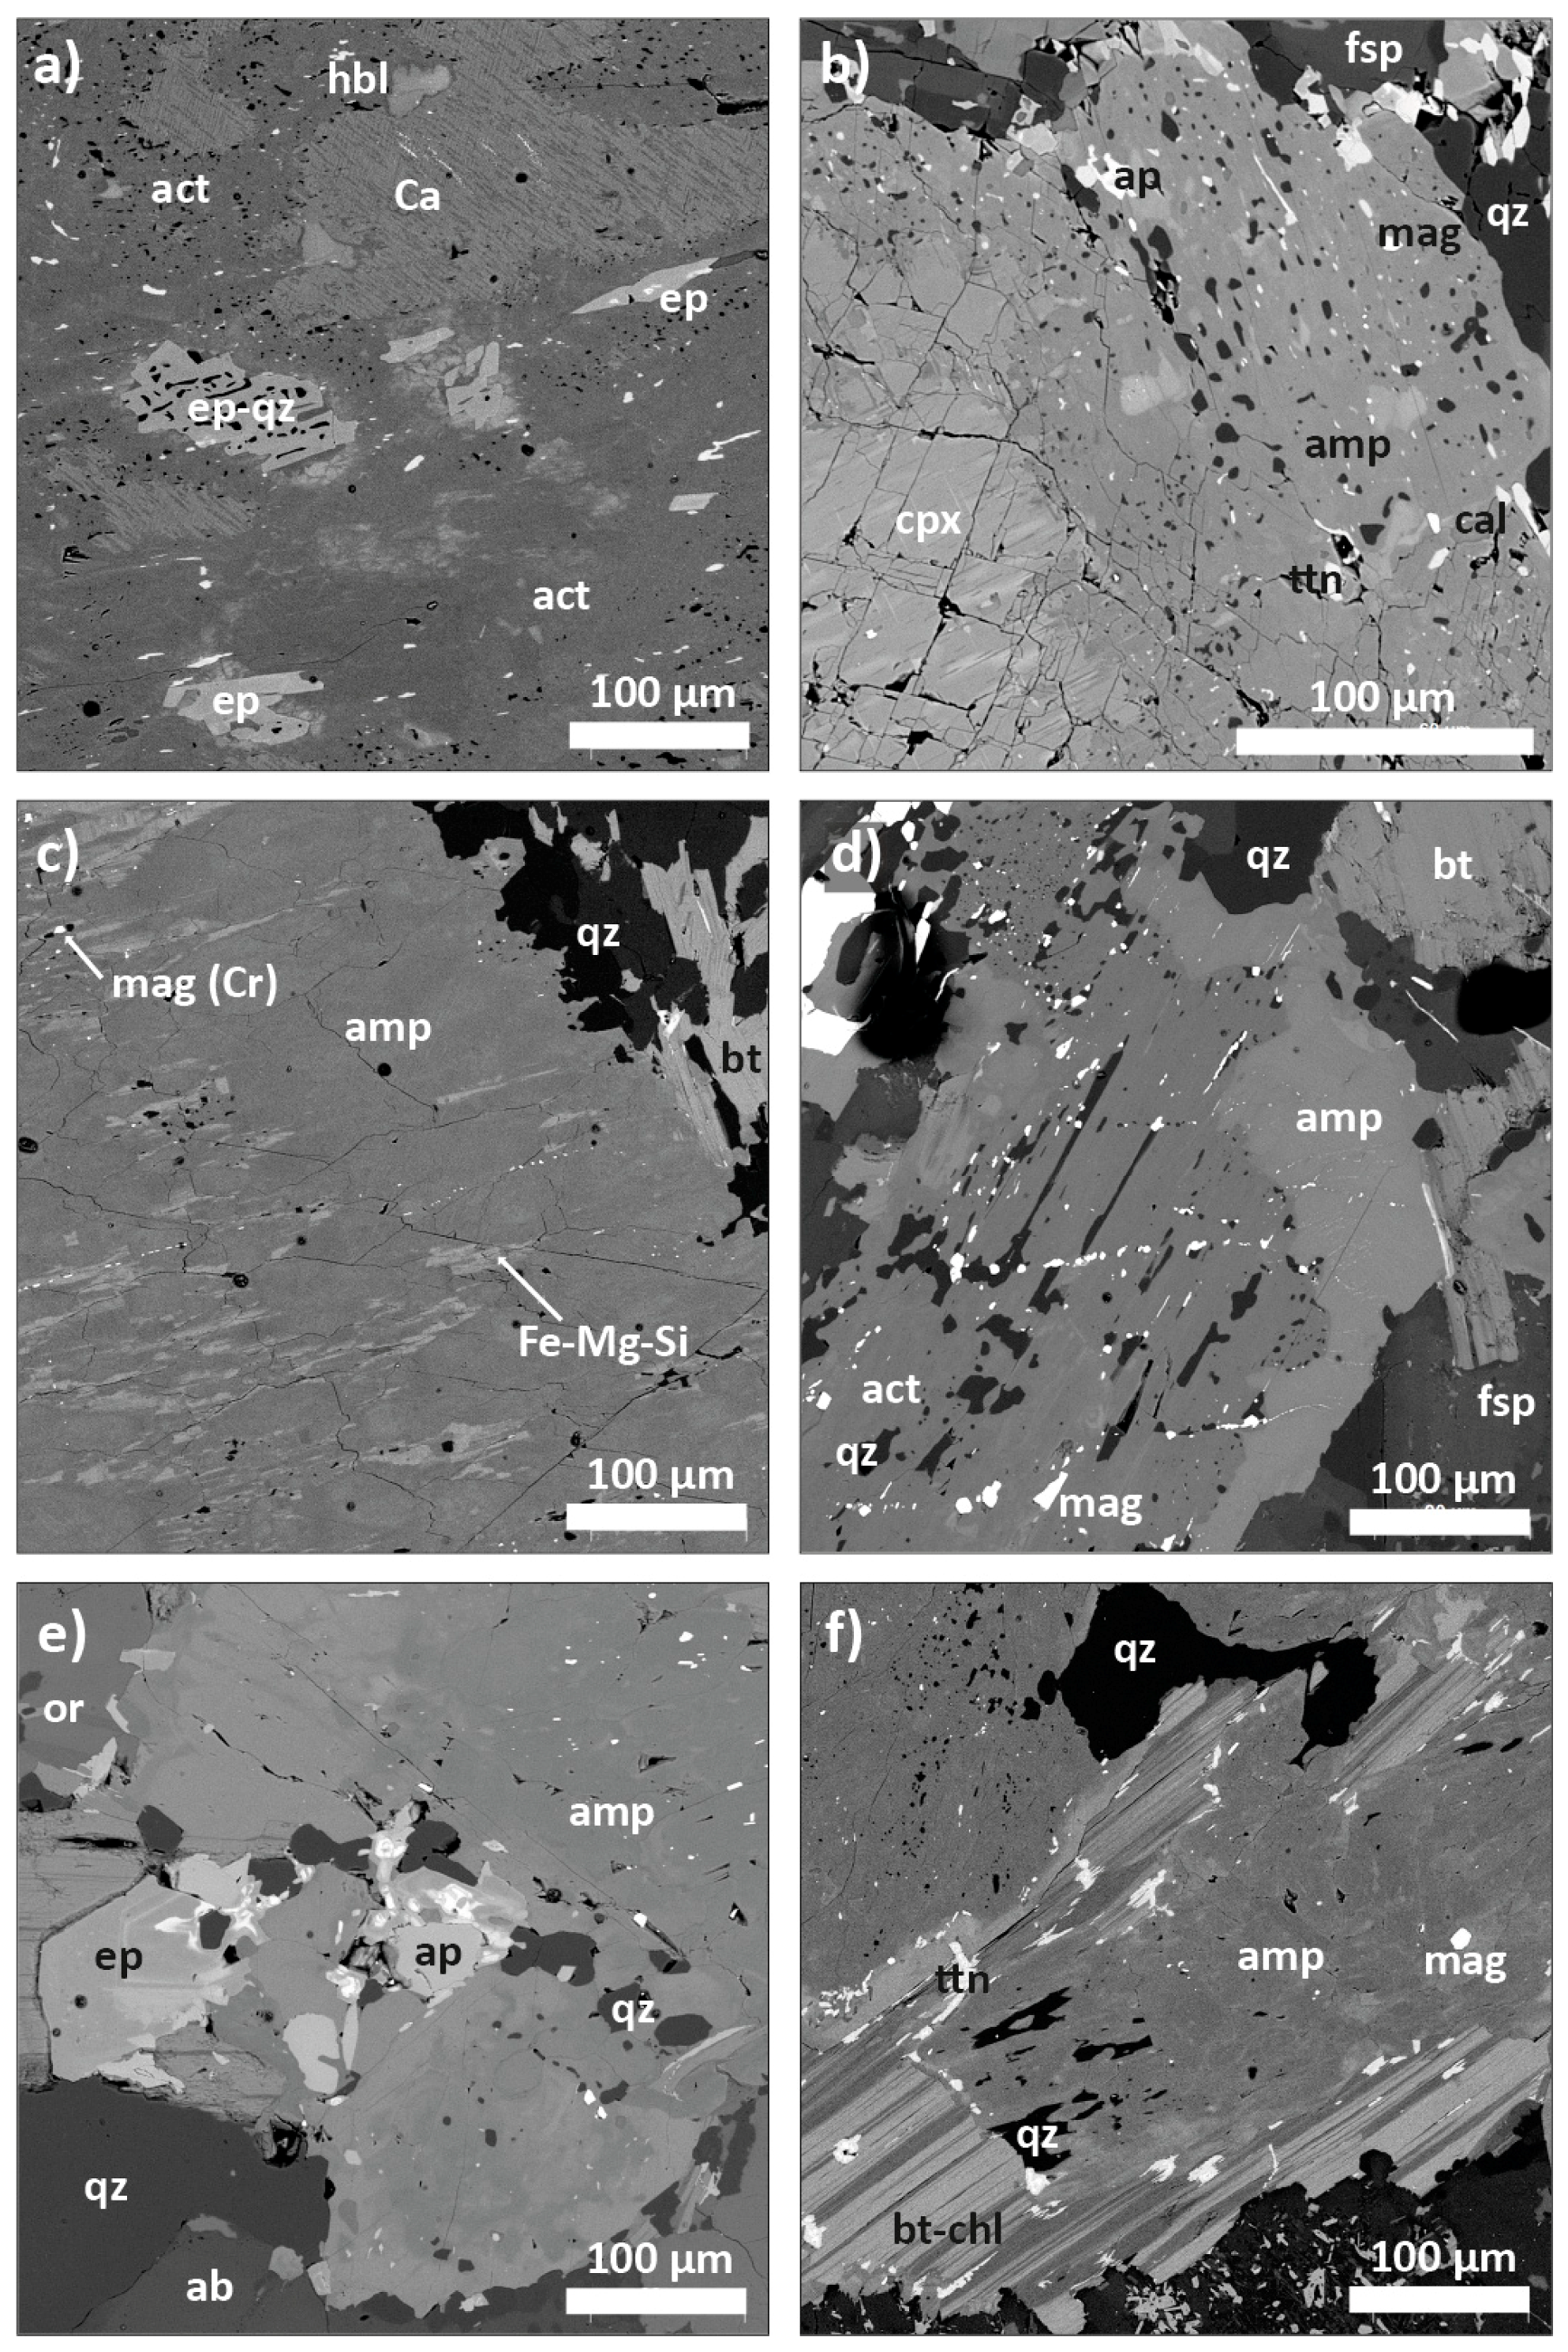
4.3. Texture of the Main Minerals and Accessory Phases

The textures described in this section mostly apply to Phase 1 (i.e., Phases 1a, 1b, and 1c). Phase 2 is more extensively altered than Phase 1, but textures similar to those observed in Phase 1 remain recognizable, especially in sample TR04. Volcanic rocks are fine-grained and extensively altered, but the minerals listed below have nonetheless been identified (zircon excepted) in these rocks (Table 1).
Plagioclase is the most abundant mineral in the studied rocks. It is generally euhedral and elongated (aspect ratio = 0.3–0.4) (Figure 5a,b). Alteration is limited in most samples, but feldspar hydrolysis (i.e., grains enriched in minute white mica and epidote inclusions) can be extensive (Figure 5b) and is generally observed along fractures and carbonate veinlets. Plagioclase also forms large inclusions in amphibole (Figure 5c) and these inclusions can be fully altered into epidote ± quartz assemblages (Figure 6a). In CL, plagioclase displays a light blue-brownish color (Figure 5a,c). Feldspar also displays an irregular brown (in CL) rim made of albite (Figure 5b). In CL, this brown zone (albitization) also forms patches within part of the plagioclase grains, and is best expressed along fractures and carbonate veinlets. In volcanic rocks (sample TR28 excepted) and some Phase 1 samples (Figure 5d), the bulk of feldspar displays a brown color indicative of extensive albitization (Figure S2).
In Phase 1c and in volcanic rocks, amphibole is generally small (~0.1 mm), elongated, can be associated with biotite, and is more homogeneous (i.e., inclusion-poor) than the amphibole of the other samples. In the other samples, i.e., Phases 2, 1a, and 1b, amphibole forms large (~1–3 mm) euhedral grains with complex texture (Figure 5c,e,f). In these samples, amphibole grains generally contain a medium-grey (BSE images) core in which 120° cleavages can still be identified. This core is homogeneous (i.e., lacks quartz and magnetite inclusions) and corresponds to hornblende relics (Figure 6e). In the most extensively altered samples (e.g., TR04), amphibole grains lack such hornblende cores. In rare instances (e.g., sample TR03), the hornblende core is rimmed by an inclusion-poor actinolite (Figure S3). More frequently, amphibole is extensively altered amphibole and are characterized by a dark-grey color (BSE image). This amphibole displays a well-expressed porosity and is enriched in small magnetite inclusions (~1–10 µm) and/or quartz inclusions (Figure 6a,b). These porous amphiboles generally rim the hornblende grains, but can also replace the core of amphibole grains (Figure 6d). Altered amphibole also contains some light-grey (BSE image) patches or thin lines of Ca-rich minerals (Figure 6a). Medium-grey (BSE image) patches or irregular lines are also observed, which correspond to Fe-Mg-Si-dominated minerals (Figure 6c). Small inclusions of carbonate are observed in most amphiboles. Carbonate is generally restricted to the edge of the amphibole and replaces 1–2 vol% of the grain (Figure 5c). Carbonate can also be well distributed within the grain for amphibole containing up to 10–20 vol% carbonate. Apart from quartz, magnetite, and carbonate, the main inclusions observed in amphibole are plagioclase, biotite, apatite, ilmenite, and titanite.
Relic clinopyroxene, recognizable by its orthogonal cleavage, can be identified in the core of a few amphibole grains of sample TR10. These pyroxenes are rimmed by amphibole enriched in quartz and magnetite inclusions (Figure 6b). K-feldspar is most abundant in Phase 1a diorite, but is also observed in the other samples of Phases 1 and 2. K-feldspar is anhedral and is generally an interstitial phase. It can also be observed as an inclusion in plagioclase (e.g., sample TR41). Quartz is an interstitial phase in the bulk of samples. Quartz also forms minute inclusions in altered feldspar (now epidote) and amphibole.
Biotite is a large (~0.5–1 mm), generally anhedral, mineral that can be isolated, but generally occurs as clusters. Titanite and/or ilmenite inclusions are frequent, and can be abundant along the edge of biotite grains (Figure 6f). Most biotite grains are partly replaced by chlorite bands parallel to biotite cleavage. In inclusion-poor amphibole, biotite inclusions are small (~10 µm), rare, and euhedral. In inclusion-rich parts of amphibole, biotite inclusions can be large (~100 µm) and more abundant (e.g., samples TR03; Figure S1) than in inclusion-poor amphibole. Small biotite grains can also rim, and locally replace, amphibole.
Epidote is a frequently observed minor phase. Disseminated epidote and quartz-bearing epidote pseudomorphing plagioclase grew at the expense of feldspar (Figure 6a) during alteration and/or metamorphism (see Section 5). Most samples also contain large (~50–100 µm) grains of magmatic epidote located in amphibole, in plagioclase, or next to these minerals. The core of these magmatic epidote displays light-grey (BSE images) irregular zoning associated with REE-enrichment (Figure 6e). Magmatic epidote can also contain apatite and titanite inclusions.
Ilmenite is a common accessory mineral that is often altered to titanite and, in two samples, to rutile. Ilmenite can be spatially associated to magnetite (sample TR13; Figure S2). In amphibole and plagioclase, ilmenite is generally rimmed by titanite. Titanite also forms small diamond-shaped inclusions in amphibole. Magnetite is an abundant micro-inclusion in amphibole (see above) and is also observed as larger grains in and outside of amphibole. These large (>100 µm) magnetite grains lack ilmenite oxy-exsolutions. Apatite is a common accessory mineral that forms sub-rounded to slightly elongated inclusions in amphibole. Needle-shaped apatite is also observed included in a variety of minerals, such as quartz and feldspar (Figure 5e). Zircon is another common accessory mineral in diorite, and might be too small to enable easy identification in volcanic rocks.
Calcite (<1–5 vol%, up to 10 vol%) is the main alteration mineral. It forms inclusions in amphibole and plagioclase, and is most abundant along the contacts between the main minerals (i.e., amphibole and plagioclase). Carbonate veinlets are also abundant in some samples (Figure 5d). Other alteration minerals are disseminated pyrite and chalcopyrite. The studied samples are not significantly mineralized because sampling targeted least-altered rocks to facilitate the characterization of intrusive phases.
According to the observations listed above, amphibole, plagioclase, REE-bearing epidote, and apatite, and possibly ilmenite-magnetite, are early co-crystallizing phases. Biotite is a later phase and may have, in part, co-crystallized with amphibole and plagioclase. Quartz and K-feldspar are interstitial and crystallized last from the residual melt.

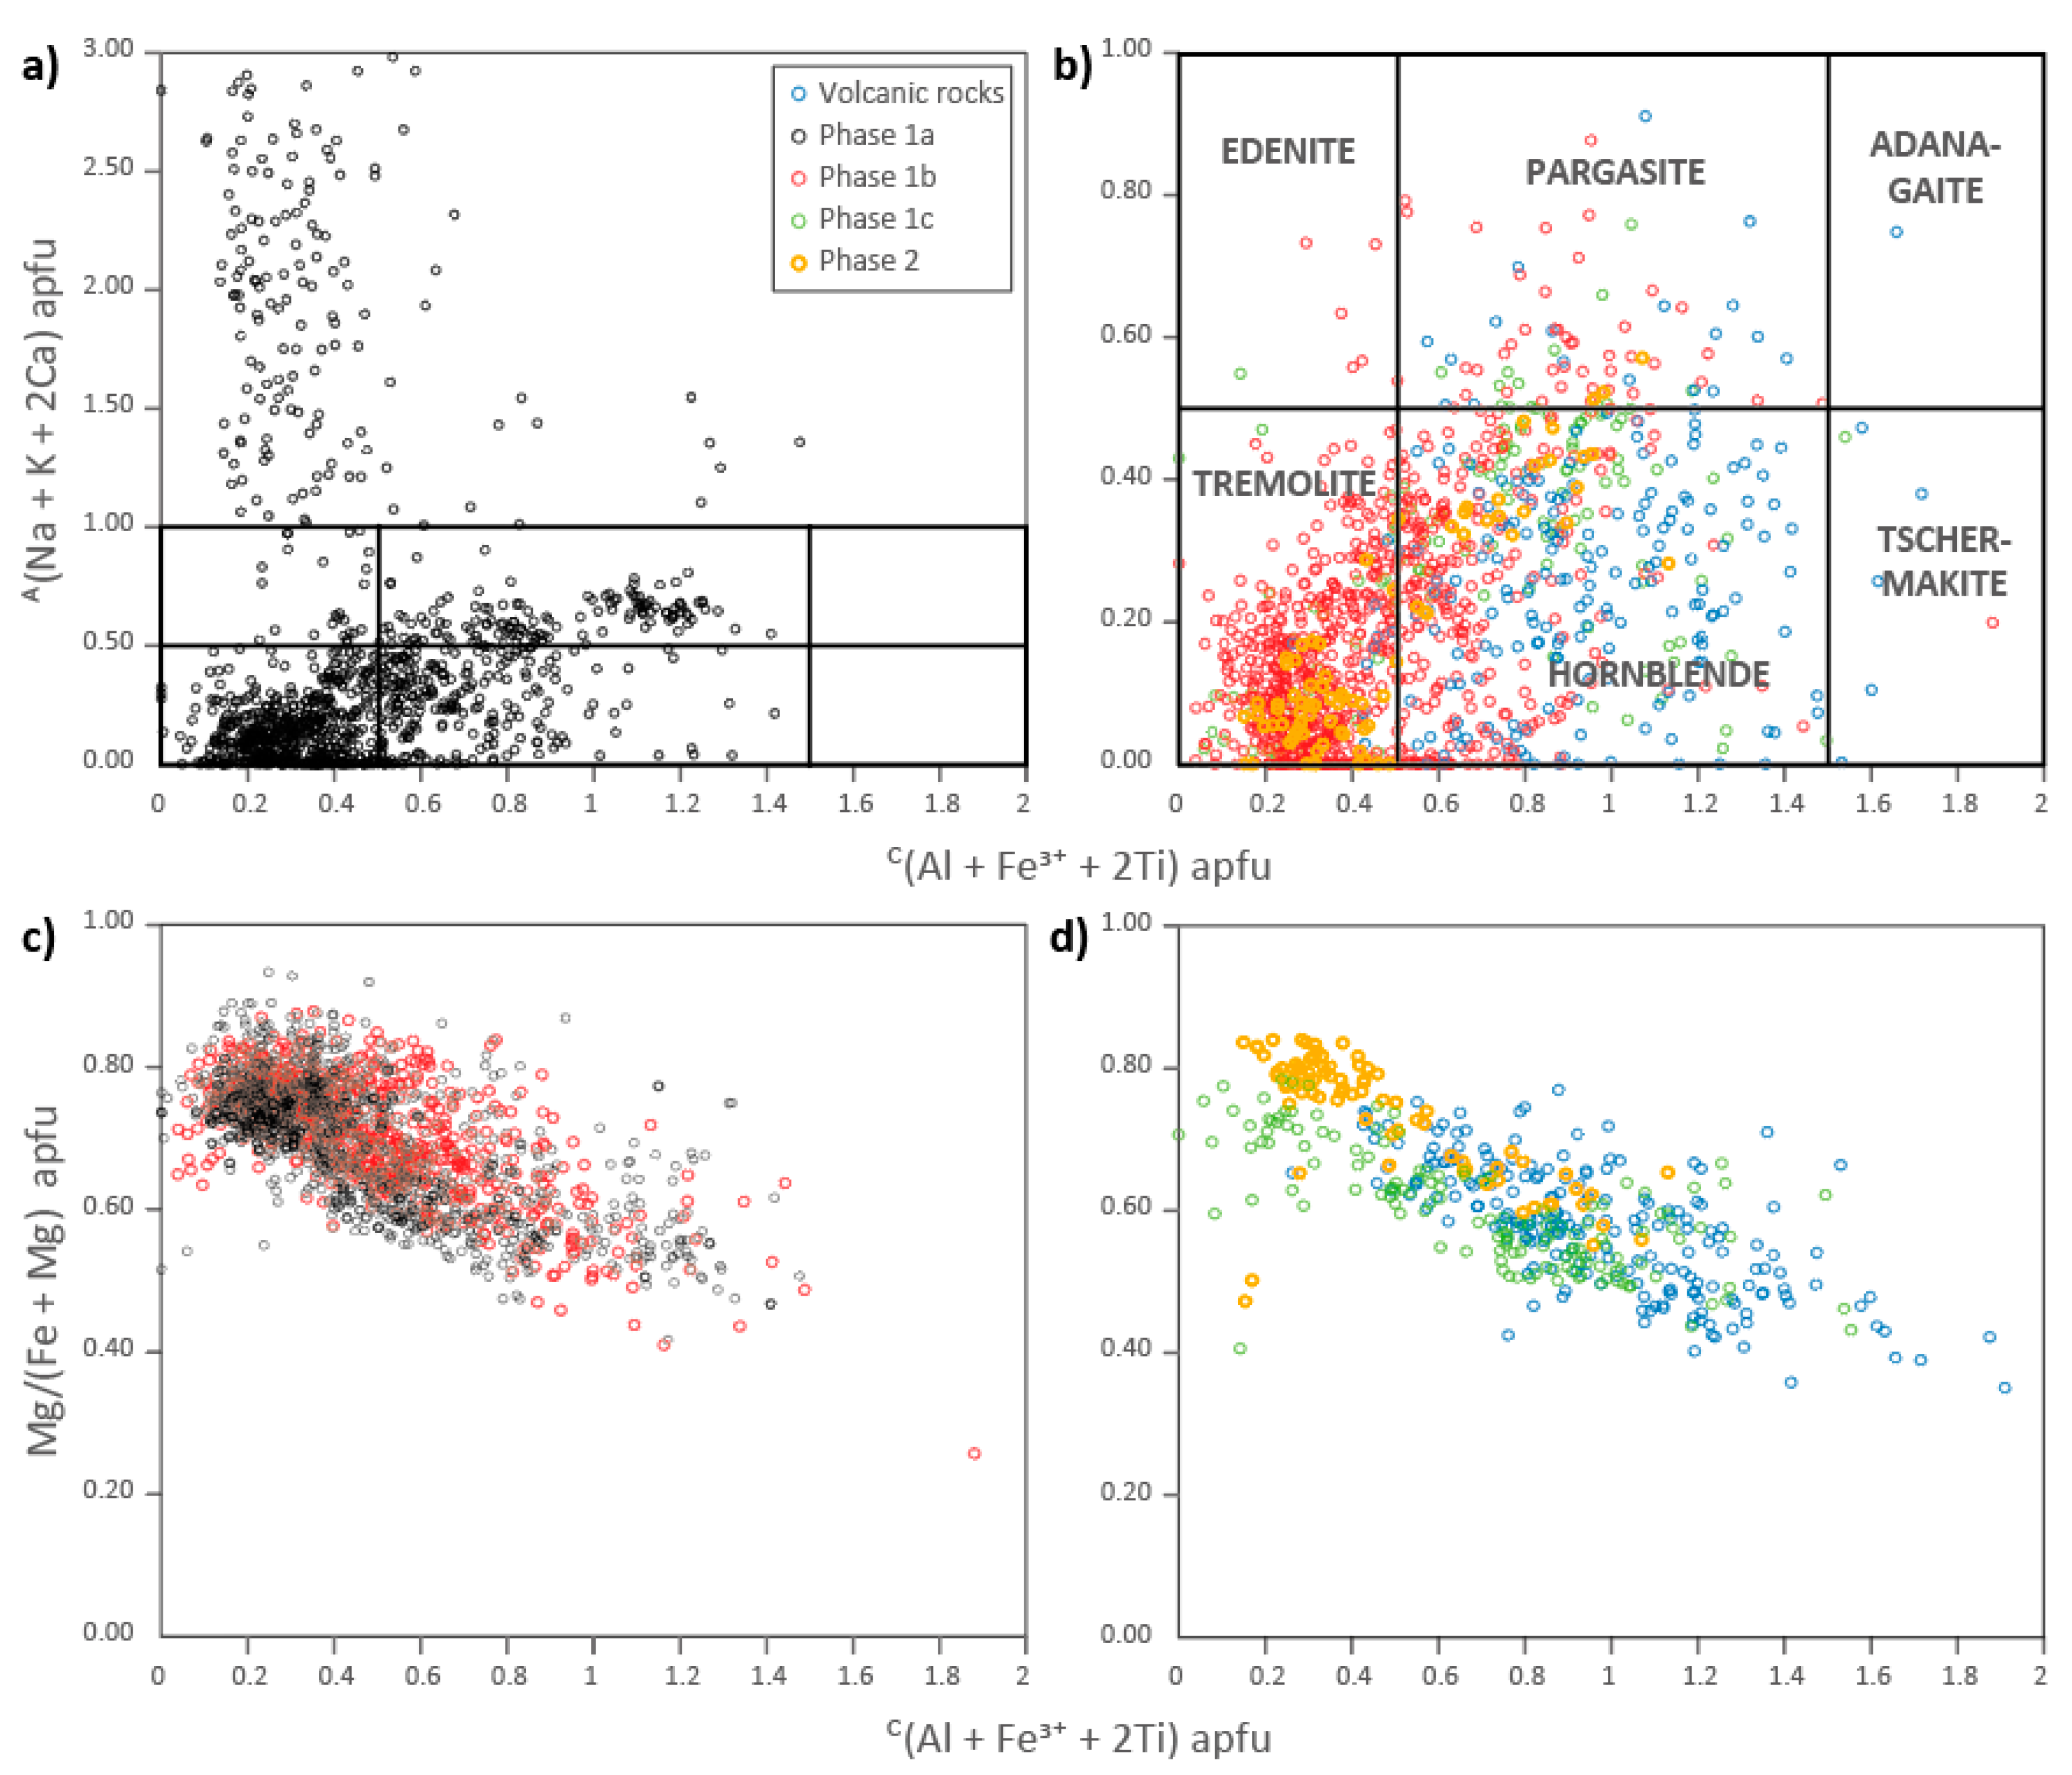
4.4. Mineral Chemistry

Mineral chemistry, as determined using the EDS detector (SEM instrument), provides insights into the general chemistry for the minerals described in the previous section. According to EDS analyses, plagioclase spans the range of compositions between andesine and albite. For Phases 1a and 1c, and for Phases 1b and 2, plagioclase is, respectively, oligoclase-albite and oligoclase-andesine (Figure 7a). Andesine-(oligoclase) is most frequent in volcanic rocks. In the bulk of rocks, the alkali feldspar is K-feldspar (Figure 7a).
The structural formula of biotite was calculated assuming 11 oxygens per formula and all iron as ferric iron. This calculation indicates that biotite is Al-enriched and K-Fe-Mg-Si-depleted compared to the ideal formula, i.e., K(Fe,Mg)3AlSi3O10(OH,F)2. Biotite has the following median apfu (atom per formula unit) composition: 0.78 ± 0.09 K, 1.04 ± 0.13 Fe, 1.49 ± 0.11 Mg, 1.44 ± 0.07 Al, and 2.86 ± 0.07 Si, with values provided as median ± standard deviation. Biotite is intimately associated with chlorite (Figure 6f) and the analyzed grains are likely partially chloritized. Biotite also contains a detectable amount of Ti, and temperature could be estimated using a Ti-in-biotite thermometer. Some biotites, however, are rimmed by Ti-minerals (Figure 6f), suggesting that biotite may have lost a part of its Ti during alteration and/or metamorphism, and only lower estimates of temperature conditions are obtained. The Ti-in-biotite thermometer used here is an empirical thermometer based on the Ti, Fe, and Mg content of biotite and developed for metamorphosed pelite [35]. This thermometer is nonetheless often applied to hydrothermal biotite observed in porphyry systems and it tends to overestimate temperature in such settings [36]. Applying this thermometer to the biotite of the Regnault project returns temperatures mostly between 800 °C and 900 °C for the bulk of samples (Figure 7b).
The structural formula of amphibole was calculated following the recommendations of the International Mineralogical Association (IMA) published by Hawthorne et al. [37] and all formulas are based on 24 (OH, F, Cl, O). Most amphiboles belong to the calcium amphibole group and are displayed on a classification diagram (Figure 8a,b) following the recommendations of Hawthorne et al. [37]. In Phases 1 and 2, amphibole forms a trend between hornblende (pargasite for some samples) and tremolite (Figure 8a,b). Pargasite and hornblende correspond to the inclusion-poor amphibole described in the previous section. Tremolite is most frequent in dark-grey (BSE image) inclusion-rich (porous) amphibole grains. Tremolite is distinctly Mg-richer than pargasite and hornblende (Figure 8c,d). The other areas observed in altered amphibole grains include light-grey (BSE) patches that are Ca-enriched ‘amphibole’ plotting outside of the classification diagram (Figure 8a). These Ca-rich patches are mostly observed in Phase 1a. Finally, the Fe-Mg-Si domains observed in altered amphibole belong to the Mg-Fe-Mn amphibole group and can be classified as cummingtonite. In volcanic rocks, amphibole is hornblende and actinolite with variable Ca and Na contents.
Physical-chemical parameters are calculated using amphibole chemistry and the method of Ridolfi et al. [38]. The basis for this method is a compilation of chemical data for amphibole grains from calc-alkaline magmas produced in subduction settings. It includes empirical thermobarometric formulations based on independent compositional components of a single phase, i.e., amphibole [38]. This method returned P, T, fO2, and melt water-content values for 352 out of 2384 analyses. The limited success of this method is likely a consequence of the extensive alteration that characterizes the studied amphibole (Figure 6). The Ridolfi et al. [38] method applies successfully to pargasite, hornblende, and tremolite, for which the highest (pargasite) to lowest (tremolite) calculated temperatures are obtained (Figure 9a). For most amphibole grains, the calculated P and T range between sub-surface to ~150 MPa and ~650 °C to 820 °C, respectively (Figure 9b). For amphibole of Phase 1c, higher P-T values are obtained and maximum P-T (up to 600 MPa and 1000 °C) is obtained for a pargasite of Phase 1a (Figure 9a,b). For the fO2 parameter, near NNO (nickel nickel oxide buffer), values are obtained for pargasite that crystallized at >850 °C. A negative correlation between oxidation state and temperature is observed, and tremolite grains crystallized at ~650 °C return a fO2 of ∆NNO + 3 (Figure 9c). Additionally, and according to amphibole chemistry, the water content of the melt was ~7.5–9.5 wt% H2O, which corresponds to the value returned by amphibole grains crystallized at high temperature, while the amphibole grains for which low T of 650 °C are obtained return values of 3–4 wt% H2O (Figure 9d).
Epidote, in the bulk of samples, has relatively homogeneous chemistry and corresponds to Fe-bearing clinozoisite, whose ideal formula is Ca2Al3(SiO4)3(OH). When calculated on the basis of 12.5 oxygens per formula, the apfu composition of epidote is 1.776 ± 0.035 Ca, 0.774 ± 0.218 Fe3+, 2.169 ± 0.194 Al, and 3.100 ± 0.132 Si, with values provided as median ± standard deviation. The REE-bearing epidote grains (magmatic epidote) contain up to 10 wt% LREE. According to EDS analyses, apatite is systematically a fluoroapatite. Magnetite has unremarkable chemistry, except for some minute magnetite inclusions observed in amphibole and that can be Cr-rich magnetite (samples TR04, TR06, TR10, TR13, and TR26) and chromite (sample TR10). Ilmenite can be enriched in Mn (up to 3–4 wt% MnO) and some titanite grains can contain a detectable amount of LREE. Carbonate is exclusively calcite and contains <1–2 wt% of MgO, FeO, and MnO. In addition, 44.2% of analyzed calcite (n = 172 analyzed in total) contains detectable La (Supplementary Material S2).

4.5. Amphibole Chemistry as Determined by Laser Ablation

In this section, LA-ICP-MS analyses are used to characterize the average chemistry of amphibole grains. To achieve this goal, ablation lines were designed to cross entire grains through their core in most cases, except for the largest amphiboles (>2–3 mm) for which half-grains were analyzed from core to rim. The 121 analyses thus obtained were classified following the recommendations of the IMA published by Hawthorne et al. [37] and all formulas are based on 24 (OH, F, Cl, O). Results indicate that the analyzed amphiboles are mostly hornblende, and some are pargasite and tremolite (Supplementary Material S3).
The trace element content of amphibole grains is displayed on multielement and REE arachnid diagrams, using a color code that highlights a negative correlation between silica and trace elements (Figure 10). The silica content of grains is a proxy to the type of amphibole that was analyzed, as tremolite contains more silica than hornblende, which contains more silica than pargasite [37]. Amphibole that contains <52.78 wt% SiO2 (pargasite and/or hornblende) is the most enriched in trace elements (Figure 10). Amphibole that contains 52.78 to 58.80 wt% SiO2 also contains a lesser amount of trace elements but display profiles, on arachnid diagrams, that are parallel to the profiles of an amphibole that contains <52.78 wt% SiO2 (Figure 10). The following remarks apply to amphibole grains that contain <58.80 wt% SiO2. On the REE diagrams, such amphibole grains display fractionated profiles, with (La/Yb)N = 6–7.5, as well as limited negative Eu anomalies (Eu* = 0.6–0.7), and the profiles are convex-shaped for LREE (Figure 10a). On a multielement diagram, pronounced negative Nb-Ta, Zr-Hf, and Ti anomalies are observed (Figure 10b).
The amphibole grains that contain >58.80 wt% SiO2 (mostly tremolite) are the most depleted in trace elements and are particularly depleted in LREE compared to hornblende and pargasite. On the REE and multielement diagrams, the profiles are flat to depleted in the most incompatible elements, and the negative Eu, Ti, Nb, and Ta anomalies are weak or lacking (Figure 10). A similar trend is observed for other trace elements, with silica-poor amphibole (hornblende, pargasite) being more enriched in most constitutive and trace elements than silica-rich (tremolite) amphibole (Table 2). Exceptions to this negative correlation between silica and other elements include MgO, with tremolite being more magnesian than hornblende and pargasite (Table 2), as is also indicated by EDS data (Figure 8c). Other elements, such as Cr, are not correlated to silica, with most grains being Cr-poor and some containing >0.1 wt% Cr. This is because the distribution of Cr is controlled by inclusions of Cr-rich magnetite and chromite according to SEM data. Silica and CaO are also un-correlated, which can be explained by the heterogeneous distribution of epidote inclusions and Ca-rich domains in amphibole (see Section 4.4.). The distribution of Th, U, and Zr is also likely controlled by inclusions of zircon and epidote. Additionally, silica-poor amphibole tends to contain more Rb, Sr, and Ba than silica-rich amphibole (Table 2), but the correlation is poor for these highly mobile elements. Most grains contain <10 ppm Cu, and some contain up to 0.1–0.3 wt% Cu, pointing to the presence of minute chalcopyrite inclusions. Silica is also un-correlated to S, Sc, Ni, Zn, As, Mo, Bi, and Au, with Au being close to detection limit (Table 2).
The Ridolfi et al. [38] method returned temperature values for 104 out of 121 analyses (Figure 11). This method, however, fails to return fO2 and P values, possibly because the studied grains are altered to various degrees. The temperature values obtained following the procedure outlined by Ridolfi et al. [38] display a clear correlation (R2 = 0.85) with the silica content of amphibole, with the highest temperatures (~900–950 °C) obtained for Si-rich grains, i.e., hornblende and pargasite (Figure 11). The largest amount of temperature data was obtained for Phases 1a, 1b, and 2, because amphibole grains observed in Phase 1c diorite and in volcanic rocks are small and hard to analyze. Results are similar for all phases, with the highest temperature obtained for amphibole of Phase 1a (Figure 11).

5. Discussion

5.1. Characteristics of the Granodiorite-Diorite-Gabbro Intrusive Complex of Regnault

The Regnault Au mineralization is hosted by diorite, gabbro, and volcanic rocks [26], and the chemistry of these rocks is discussed using the Kenorland dataset and 22 additional samples. The datasets considered here are dominated by fresh to weakly altered rocks according to mass balance calculations, and these rocks can thus be classified using the TAS and AFM diagrams. Using these diagrams, it can be concluded that most rocks display calc-alkaline affinities and are spatially associated with a minor volume of tholeiitic rocks (Figure 2 and Figure 4).
The rocks have been reclassified according to whole rock chemical and petrological data (Table 3). Rocks with calc-alkaline affinities are granodiorite (Phases 1a and 1c), diorite (Phase 1b), gabbro (Phase 2, sample TR04), and dacite with fractionated profiles on multielement arachnid diagrams (Figure 4c,d). Rocks with tholeiitic affinities correspond to basalt-andesite volcanic rocks that host the intrusive complex, and to sample TR23, which was initially classified as Phase 2 and which is here re-classified as a xenolith of tholeiitic gabbro (or coarse-grained basalt) based on flat trace element pattern (Figure 4c,d).
The granodiorite-diorite-gabbro intrusive complex of Regnault is chemically similar to nearby dacite (Figure 4c,d). These intrusive and volcanic rocks may be co-magmatic, and their spatial association suggests that the intrusion was a sub-volcanic complex. This interpretation implies shallow depth of emplacement, which is an important favorable parameter for magmatic-hydrothermal mineralizing systems [39,40,41]. The intrusive complex is also dominated by intermediate to felsic rocks, with a limited volume of mafic phases, suggesting differentiation. Differentiation, and especially fractional crystallization, is another favorable parameter as it promotes the concentration of fluids and metals in the residual melt, and this increases the probability for the magma to exsolve a large volume of mineralizing fluids [42].
Phases 1a and 1c granodiorite are plagioclase-quartz-dominated rocks with amphibole, biotite, and K-feldspar (Phase 1a) or biotite ± amphibole (Phase 1c). Phase 1b diorite displays a similar mineralogy, but contains trace amounts of K-feldspar and a lesser amount of quartz compared to Phase 1a (Table 1). Phases 1a granodiorite and Phase 1b diorite, which are the most abundant intrusive phases (Figure 1), may be related by a fractional crystallization process. Phase 1c granodiorite, which is spatially associated to Phase 1a granodiorite (Figure 1) and shares similar silica content (Figure 4b), may also correspond to an evolved melt possibly enriched in water, as water content can favor biotite over K-feldspar crystallization [43]. The increasing Na-content of plagioclase, which goes from oligoclase-andesine (Phase 1b diorite) to oligoclase-albite (Phases 1a and 1c granodiorite), and the increased concentration in trace elements with increasing silica content (Figure 4c,d), are also consequences of fractionation. It is thus concluded that that phases 1a and 1c granodiorite correspond to residual melts derived from Phase 1b diorite.
Phase 2 gabbro is not abundant and is only documented by sample TR04, which displays trace element content comparable to this of Phase 1b diorite. Sample TR04 may thus be representative of the parental melt to the intrusive complex. A mafic parental melt implies that the studied magma derives from a mantle source.
To further discuss the characteristics of this source, the intrusive suite of the Regnault project is compared to diorite-bearing intrusive suites documented in the Abitibi greenstone belt, south of the Opatica sub-province. In the Abitibi belt, diorites are part of tonalite-trondhjemite-diorite (TTD) intrusive suites and may correspond to a mixture of mantle-derived magma (tholeiitic melt) and TTG melt [9,44]. The Regnault intrusion is more enriched in the most incompatible elements (e.g., LREE and Th, Figure 4c,d) than the TTD suites of the Abitibi greenstone belt, and it may thus have a different petrogenesis. Another evidence for the LREE- and Th-enrichment of the primitive magma at Regnault is offered by the clinozoisite observed in most samples. This mineral displays oscillatory zoning and corresponds to a magmatic mineral. Some of the growth zones observed in clinozoisite are enriched in LREE (bright zones on BSE images; Figure 6e), indicating that magmatic epidote crystallized from a LREE-enriched magma.
The occurrence of mafic (Phase 2 gabbro) and intermediate (Phase 1b diorite) intrusive phases enriched in LREE and Th suggests a metasomatized mantle source for the Regnault intrusive suite. This is of significance, as metasomatized source may be enriched in volatiles (S, Cl, water) and metals (Au included), and may produce magmas with mineralizing potential [45].

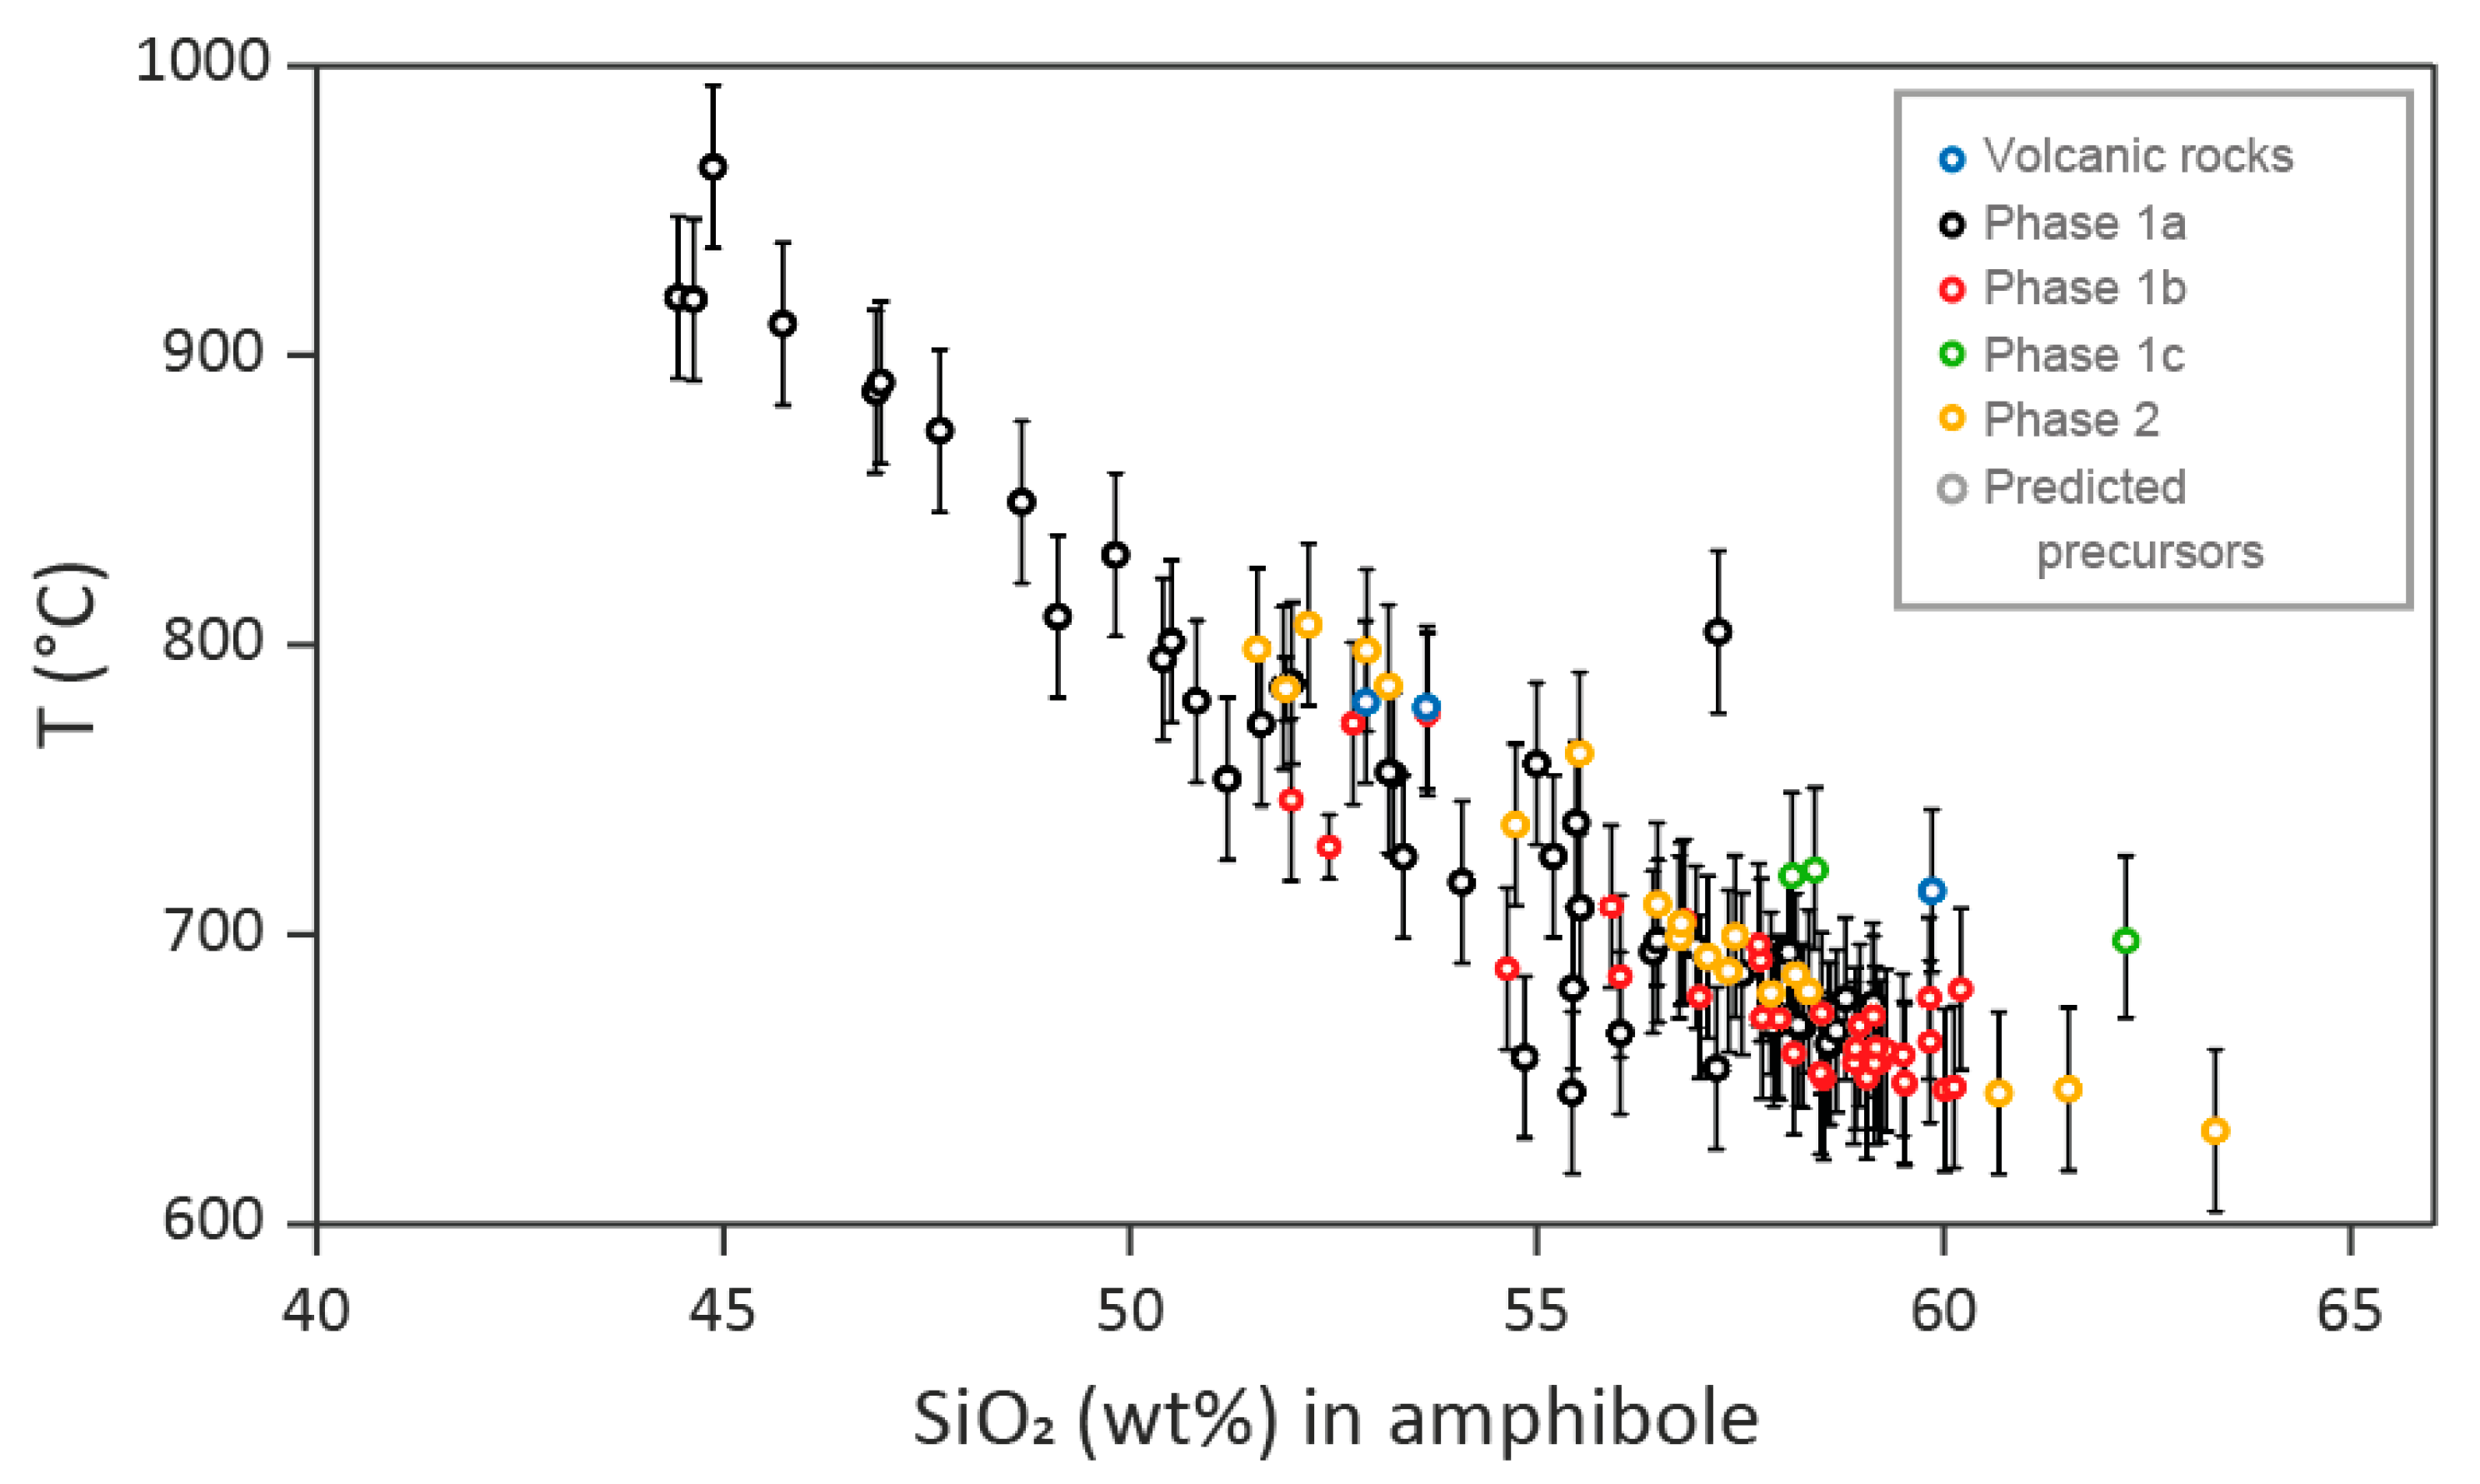
5.2. Physical-Chemical Parameters Deduced from Amphibole Chemistry

The presence of magmatic epidote indicates that fractionation initiated at a minimum of 600 MPa (~20 km) for granodiorite [46], which is within the range of pressure indicated by the amphibole from Phase 1a granodiorite (Figure 9b). Magmatic epidote is not frequently reported for diorite [46], but may also point to high-pressure crystallization, while the amphibole from Phase 1b diorite returns a maximum pressure of 400 MPa (Figure 9b). The magma likely crystallized over a range of pressures as it ascended through the crust.
Most amphiboles crystallized at low pressure and <850 °C (Figure 9b). These amphiboles correspond to hornblende crystallized from the residual melt and to actinolite crystallized within a magmatic-hydrothermal or later hydrothermal system (see below). The pressure values obtained from these amphiboles are consistent with an emplacement depth of ~1.5–5 km (50–150 MPa) or less for the intrusive complex. The magma likely raised rapidly and emplaced a few kilometers below the surface, where it became over-saturated in phosphorous and crystallized needle-shaped apatite. Low pressure estimates of <30 MPa, which fall outside of the stability curve for amphiboles (Figure 9b), are likely unreliable and are a consequence of the hydrothermal alteration that impacted amphibole.
Amphibole grains that return > 850 °C crystallization temperatures (EDS analyses) are probably the best indicators of magmatic conditions. These amphiboles point to a moderately oxidized (around NNO) and water-rich (~7.5–9.5 wt% H2O) magma. Moderately oxidizing conditions are consistent with the occurrence of large (>100 µm) grains of magmatic ilmenite and magnetite. The measured water content is consistent with petrographic observations indicating that clinopyroxene is an early crystallizing phase that was destabilized by amphibole, which is a process consistent with a water-bearing magma becoming water-rich as differentiation progresses [42,47,48]. The magma was thus volatile-bearing and moderately oxidized, which are favorable characteristics for Au transportation in magmatic systems [49]
The amphibole grains returning > 800 °C crystallization temperatures (LA-ICP-MS analyses) correspond to hornblende and pargasite that are enriched in trace elements compared to secondary actinolite (Table 2, Figure 10). This trace elements-enriched amphibole likely crystallized from a magma and is unlikely to have a metamorphic origin. Biotite is strongly altered (chloritized) and some biotite may be alteration minerals (see below). Other biotite grains are Ti-bearing minerals that return temperatures consistent with magmatic temperatures (800–900 °C), and these minerals likely crystallized from a magma.
Petrographic observations indicate that the studied magma crystallized feldspar, clinopyroxene, and some REE-rich epidote at depth. Amphibole stabilization occurred late and this mineral partially replaced pyroxene, while the magma continued crystallizing plagioclase, apatite, ±biotite, and possibly ilmenite and magnetite. Needle-shaped apatite then crystallized rapidly as the magma reached its final emplacement depth, while the crystallization of amphibole, plagioclase, and biotite continued. The residual melt then crystallized K-feldspar and/or biotite, and quartz.
The late crystallization of amphibole was induced by increasing water content as differentiation progressed and it initiated before or after emplacement of the intrusive complex in the upper crust at a depth of ~1.5–5 km. Such late crystallization of amphibole at the expense of clinopyroxene is reported for plutons associated with porphyry deposits [42,50]. This indicates that the shallow intrusive system, at the Regnault project, contained volatiles that could exsolve to generate a magmatic-hydrothermal mineralizing system.

5.3. Hydrothermal Alteration

This study focused on least-altered rocks with preserved magmatic textures. The studied rocks are weakly altered. Alteration minerals are discussed in this section and used to draw conclusions on the P-T conditions under which magmatic minerals were destabilized by circulating fluids.
The studied rocks display evidence for hydration and other styles of alteration that occurred in P-T conditions compatible with the stability fields of chlorite and actinolite, i.e., greenschist facies conditions [51]. Mass balance calculations performed on whole rock chemical data point to moderate Ca, Fe, and Mg gains. Calcium gains, as well as the trace amount to up to 10 vol% of calcite observed in the bulk of samples, are compatible with carbonatization. Iron and Mg gains may be related to chloritization (chlorite replacing biotite). The reorganization of Ca, Fe, and Mg within amphibole grains (Figure 6) may also have been promoted by the external addition of Ca, Fe, and/or Mg.
Petrographic observations also indicate that biotite locally replaces the outer margin of amphibole, pointing to K-metasomatism. In addition, Na metasomatism albitized the outer margin of most feldspars. Such modifications are likely related to minor Na- and K-metasomatism, which are too weak to induce Na- and K-gains detectable by mass balance calculations. Alkali metasomatism is likely a consequence of the exsolution and circulation of late magmatic fluids, i.e., autometasomatism [39]. Other alteration styles correspond to hydration that formed white mica and epidote in plagioclase (feldspar hydrolysis). Sulfurization also formed minor amounts of pyrite and chalcopyrite, even if sampling targeted the least mineralized and altered samples of the Regnault project.
Amphibole grains are large euhedral magmatic minerals that contain inclusions of apatite, ilmenite, titanite, and plagioclase. Alteration induced a series of modifications in these minerals. During alteration, hornblende and pargasite were replaced by inclusion-poor Mg-rich actinolite, as well as porous Mg-rich actinolite enriched in inclusions of quartz and magnetite. This latter mineral, which formed during alteration as a consequence of the oxidation of the Fe contained in amphibole, indicates that the hydrothermal fluid was oxidized. This is consistent with the elevated fO2 returned by actinolite grains (Figure 9c). Metamorphic fluids tend to be relatively reduced [5] and are unlikely to be responsible for the alteration reported here. Instead, the fluid that altered the studied amphibole grains likely corresponds to an oxidized magmatic fluid.
The recrystallisation of amphibole during hydrothermal alteration also removed most trace elements from amphibole grains. Several elements, and especially Ca, Fe, Mg, and Si, were re-organized within amphibole grains to form Ca-rich patches, Fe-Mg-Si-rich patches, and quartz inclusions. This too is inconsistent with metamorphism-induced recrystallisation, which would have produced textually homogeneous amphibole grains. Amphibole was likely recrystallized at >600 °C (Figure 11) in a magmatic-hydrothermal environment. The distribution of As, Mo, Bi, Au, and Cu (Table 2) also suggests that these elements are controlled by micro-inclusions of sulfide or sulfosalts, which is also consistent with the circulation of metal-bearing magmatic fluids.
The granodiorite-diorite-gabbro intrusive complex of Regnault likely assembled a few kilometers below the surface and released magmatic fluids that induced hydrothermal alteration in the intrusive complex (autometasomatism) and surrounding rocks. The metasomatized mantle source inferred for the Regnault intrusive complex on the basis of LREE-enrichment (see above) is consistent with syntectonic magmatism [52], and the complex may have emplaced between ca. 2702 Ma to 2686 Ma [16]. It can thus be concluded that a magmatic-hydrothermal system operated at the Regnault project, and possibly during the syntectonic period. The Regnault intrusive suite had the potential to exsolve mineralizing fluids. Determining whether these magmatic fluids mineralized the studied rocks or whether most gold was introduced subsequently by metamorphic fluids is beyond the scope of this paper.

6. Conclusions

The Regnault Au project, located in the Frotet–Evans greenstone belt, is hosted by volcanic rocks and by a granodiorite-diorite-gabbro intrusive suite that is, according to the results of this study, related to magmatic-hydrothermal mineralizing processes. The parental magma to the Regnault intrusive suite was likely a LREE-enriched mafic melt derived from the metasomatized mantle, and a syntectonic age is postulated for this intrusive suite. The magma was moderately oxidized and water-bearing, and may have transported Au. Whole-rock chemistry and petrographic observations point to extensive differentiation dominated by pyroxene and plagioclase fractionation, with amphibole crystallizing late and following the increase of the water content of the residual melt. The Regnault intrusive complex also emplaced at shallow depth, as suggested by chemical similarities between the calc-alkaline intrusive rocks and spatially associated calc-alkaline volcanic rocks. Amphibole chemistry confirms a shallow depth of emplacement that is poorly constrained at ~1.5–5 km. Significant increase of the water content during fractionation and shallow depth of emplacement are important favorable factors for porphyry style of mineralization. The Regnault intrusive complex may have generated a magmatic-hydrothermal system and is considered ‘fertile’ for Au mineralization.

Supplementary Materials

The following supporting information can be downloaded at: https://www.mdpi.com/article/10.3390/min12020128/s1, Table S1—contains sample location and whole-rock analyses, Table S2—mineral chemistry (EDS analyses), Table S3—mineral chemistry (LA-ICP-MS analyses), Figure S1—samples observed in natural light, Figure S2—samples observed in cathodoluminescence, Figure S3—samples observed in BSE.

Author Contributions

Conceptualization, L.M. and F.M.; methodology, L.M. and F.M.; validation, L.M.; formal analysis, L.M.; investigation, L.M.; resources, L.M. and F.M.; writing—original draft preparation, L.M.; writing—review and editing, L.M. and F.M.; funding acquisition, L.M. All authors have read and agreed to the published version of the manuscript.

Funding

This study was undertaken as part of the Metal Earth project (Laurentian University) investigation of the Chibougamau area. This research was funded by the Canada First Research Excellence Funds and federal/provincial/industry partners (http://merc.laurentian.ca/research/metal-earth/; accessed on 22 December 2021). This project was also funded by the NSERC (Natural Sciences and Engineering Research Council) Discovery Grant to L. Mathieu (Reference number RGPIN-2018-06325).

Data Availability Statement

The data presented in this study are available in the Supplementary Materials Documents.

Acknowledgments

Many thanks to assistant editor Phattranit Sophon, to academic editor Panagiotis Voudouris, and to two anonymous reviewers who commented on this contribution. The author is indebted to the many collaborators of the Metal Earth, NSERC, and FRQNT projects, and special thanks are addressed to David Mole. This paper is Metal Earth contribution number MERC-ME-2021-77.

Conflicts of Interest

The authors declare no conflict of interest.

References

  1. Fontaine, A.; Dubé, B.; Malo, M.; McNicoll, V.J.; Brisson, T.; Doucet, D.; Goutier, J. Geology of the metamorphosed Roberto gold deposit (Éléonore Mine), James Bay region, Quebec: Diversity of mineralization styles in a polyphase tectonometamorphic setting. In Targeted Geoscience Initiative 4: Contributions to the Understanding of Precambrian Lode Gold Deposits and Implications for Exploration; Dubé, B., Mercier-Langevin, P., Eds.; Geological Survey of Canada Open File 7852; Geological Survey of Canada: Québec, QC, Canada, 2015; pp. 209–227. [Google Scholar]
  2. Ravenelle, J.-F.; Dubé, B.; Malo, M.; McNicoll, V.; Nadeau, I.; Simoneau, J. Insights on the Geology of the World-Class Roberto Gold Deposit, Éléonore Property, James Bay Area, Quebec; Current Research 2010-1; Geological Survey of Canada: Québec, QC, Canada, 2010; ISBN 1100145885. [Google Scholar]
  3. Fontaine, A.; Dubé, B.; Malo, M.; Turcotte, J.; Doucet, D. Geology of the Cheechoo Gold Property, Eeyou Istchee Baie-James, Superior Province, Northern Quebec; Geological Survey of Canada Open File 8403; Geological Survey of Canada: Québec, QC, Canada, 2018. [Google Scholar]
  4. Diniz, T.B. An Overview of the Troilus Au-Cu Deposit, Frotet-Evans Greenstone Belt, Opatica Subprovince, Quebec. Unpublished Master’s Thesis, Queen’s University, Kingston, ON, Canada, 2019. [Google Scholar]
  5. Phillips, G.N.; Powell, R. Formation of gold deposits: A metamorphic devolatilization model. J. Metamorph. Geol. 2010, 28, 689–718. [Google Scholar] [CrossRef]
  6. Mathieu, L. Intrusion-associated gold systems and multistage metallogenic. Miner. Depos. 2021, 11, 261. [Google Scholar]
  7. Katz, L.R.; Kontak, D.J.; Dubé, B.; McNicoll, V.; Creaser, R.; Petrus, J.A. An archean porphyry-type gold deposit: The côté gold Au (-Cu) deposit, swayze greenstone belt, superior province, Ontario, Canada. Econ. Geol. 2020, 116, 47–89. [Google Scholar] [CrossRef]
  8. Katz, L.R.; Kontak, D.J.; Dubé, B.; Mcnicoll, V. The geology, petrology, and geochronology of the Archean côté gold large-tonnage, low-grade intrusion-related Au(–Cu) deposit, Swayze greenstone belt, Ontario, Canada. Can. J. Earth Sci. 2017, 54, 173–202. [Google Scholar] [CrossRef] [Green Version]
  9. Mathieu, L.; Racicot, D. Petrogenetic study of the multiphase chibougamau pluton: Archaean magmas associated with cu-au magmato-hydrothermal systems. Minerals 2019, 9, 174. [Google Scholar] [CrossRef] [Green Version]
  10. Pilote, P.; Guha, J. Partie B—Métallogénie de l’extrémité est de la sous-province de l’Abitibi. In Le Camp Minier de Chibougamau et le Parautochtone Grenvillien: Métallogénie, Métamorphisme et Aspects Structuraux; Pilote, P., Ed.; Geological Association of Canada Field Trip Guidebook B1: Québec, QC, Canada, 2006; pp. 29–46. [Google Scholar]
  11. Pilote, P.; Dion, C.; Joanisse, A.; David, J.; Machado, N.; Kirkham, R.V.; Robert, F. Géochronologie des minéralisations d’affiliation magmatique de l’Abitibi, secteurs Chibougamau et de Troilus-Frotet: Implications géotectoniques. In Programme et Résumés, Séminaire D’information Sur la Recherche Géologique; MRN Report, DV-97-03; Ministère des Ressources Naturelles: Québec, QC, Canada, 1997; p. 47. [Google Scholar]
  12. Goodman, S.; Williams-Jones, A.E.; Carles, P. Structural controls on the Archean Troilus gold-copper deposit, Quebec, Canada. Econ. Geol. 2005, 100, 577–582. [Google Scholar] [CrossRef]
  13. David, J.; Parent, M. Géochronologie U-Pb du Projet Moyen-Nord; MRNF Document GM 59903; Ministère des Ressources Naturelles et de la Faune: Québec, QC, Canada, 1997. [Google Scholar]
  14. El Rassi, D. Technical Report on the Douay Gold Project, Northwestern Québec, Canada; Technical Report NI 43-101; Maple Gold Mines Ltd.: Vancouver, BC, Canada, 2019. [Google Scholar]
  15. Gosselin, C. Synthèse Géologique de la Région de Frotet-Troïlus. Ministère des Ressources Naturelles, Québec; MERN Report ET 96-02; Ministère de l’Énergie et des Ressources Naturelles: Québec, QC, Canada, 1996. [Google Scholar]
  16. Davis, W.J.; Machado, N.; Gariépy, C.; Sawyer, E.W.; Benn, K. U-Pb geochronology of the Opatica tonalite-gneiss belt and its relationship to the Abitibi greenstone belt, superior province, Quebec. Can. J. Earth Sci. 1995, 32, 113–127. [Google Scholar] [CrossRef]
  17. Davis, W.J.; Gariepy, C.; Sawyer, E.W. Pre-2.8 Ga crust in the Opatica gneiss belt: A potential source of detrital zircons in the Abitibi and Pontiac subprovinces, superior province, Canada. Geology 1994, 22, 1111–1114. [Google Scholar] [CrossRef]
  18. Boily, M.; Dion, C. Geochemistry of boninite-type volcanic rocks in the Frotet-Evans greenstone belt, Opatica subprovince, Quebec: Implications for the evolution of Archaean greenstone belts. Precambr. Res. 2002, 115, 349–371. [Google Scholar] [CrossRef]
  19. Laurent, O.; Martin, H.; Moyen, J.-F.; Doucelance, R. The diversity and evolution of late-Archean granitoids: Evidence for the onset of “modern-style” plate tectonics between 3.0 and 2.5 Ga. Lithos 2014, 205, 208–235. [Google Scholar] [CrossRef]
  20. Benn, K.; Sawyer, E.W.; Bouchez, J.L. Orogen parallel and transverse shearing in the Opatica Belt, Quebec: Implications for the structure of the Abitibi Subprovince. Can. J. Earth Sci. 1992, 29, 2429–2444. [Google Scholar] [CrossRef]
  21. Sawyer, E.W.; Benn, K. Structure of the high-grade Opatica Belt and adjacent low-grade Abitibi Subprovince, Canada: An Archaean mountain front. J. Struct. Geol. 1993, 15, 1443–1458. [Google Scholar] [CrossRef]
  22. Simard, A. Stratigraphie et Volcanisme Dans la Partie Orientale de la Bande Volcano-Sédimentaire Archéenne Frotet-Evans; MERN Report MB 87-17; Ministère de l’Énergie et des Ressources Naturelles: Québec, QC, Canada, 1987. [Google Scholar]
  23. Magnan, M. La Zone 87 du Gisement d’or et De Cuivre du Lac Troilus: Pétrographie et Géochimie; Université du Québec à Chicoutimi: Saguenay, QC, Canada, 1993; ISBN 1412305314. [Google Scholar]
  24. Carles, P. Constraints on the Genesis of the Archean Troilus Gold-Copper Deposit, Quebec: Montreal. Unpublished Master’s Thesis, McGill University, Montréal, QC, Canada, 2000. [Google Scholar]
  25. Larouche, J. Caractérisation de la Minéralisation de la Fosse J4 à la Mine Troilus, Chibougamau. Unpublished Master’s Thesis, Université du Québec à Chicoutimi, Chicoutimi, QC, Canada, 2005. [Google Scholar]
  26. Hawkins, T.; Charbonneau, R. NI 43-101 Technical Report for the Frotet Gold Project; NI 43-101 Report; Northway Resources and Kenorland Minerals Ltd.: Vancouvert, BC, Canada, 2020. [Google Scholar]
  27. Warr, L.N. IMA-CNMNC approved mineral symbols. Mineral. Mag. 2021, 85, 291–320. [Google Scholar] [CrossRef]
  28. Jochum, K.P.; Weis, U.; Stoll, B.; Kuzmin, D.; Yang, Q.; Raczek, I.; Jacob, D.E.; Stracke, A.; Birbaum, K.; Frick, D.A. Determination of reference values for NIST SRM 610-617 glasses following ISO guidelines. Geostand. Geoanal. Res. 2011, 35, 397–429. [Google Scholar] [CrossRef]
  29. Jochum, K.P.; Nohl, U.; Herwig, K.; Lammel, E.; Stoll, B.; Hofmann, A.W. GeoReM: A new geochemical database for reference materials and isotopic standards. Geostand. Geoanal. Res. 2005, 29, 333–338. [Google Scholar] [CrossRef]
  30. Jochum, K.P.; Willbold, M.; Raczek, I.; Stoll, B.; Herwig, K. Chemical characterisation of the USGS reference glasses GSA 1G, GSC 1G, GSD 1G, GSE 1G, BCR 2G, BHVO 2G and BIR 1G using EPMA, ID TIMS, ID-ICP-MS and LA-ICP-MS. Geostand. Geoanal. Res. 2005, 29, 285–302. [Google Scholar] [CrossRef]
  31. Dare, S.A.S.; Barnes, S.-J.; Beaudoin, G. Variation in trace element content of magnetite crystallized from a fractionating sulfide liquid, Sudbury, Canada: Implications for provenance discrimination. Geochim. Cosmochim. Acta 2012, 88, 27–50. [Google Scholar] [CrossRef]
  32. Trépanier, S.; Mathieu, L.; Daigneault, R.; Faure, S. Precursors predicted by artificial neural networks for mass balance calculations: Quantifying hydrothermal alteration in volcanic rocks. Comput. Geosci. 2016, 89, 32–43. [Google Scholar] [CrossRef] [Green Version]
  33. Pearce, J.A. Geochemical fingerprinting of oceanic basalts with applications to ophiolite classification and the search for Archean oceanic crust. Lithos 2008, 100, 14–48. [Google Scholar] [CrossRef]
  34. Hofmann, A.W. Chemical differentiation of the Earth: The relationship between mantle, continental crust, and oceanic crust. Earth Planet. Sci. Lett. 1988, 90, 297–314. [Google Scholar] [CrossRef] [Green Version]
  35. Henry, D.J.; Guidotti, C.V.; Thomson, J.A. The Ti-saturation surface for low-to-medium pressure metapelitic biotites: Implications for geothermometry and Ti-substitution mechanisms. Am. Mineral. 2005, 90, 316–328. [Google Scholar] [CrossRef]
  36. Rezaei, M.; Zarasvandi, A. Titanium in biotite thermometry in porphyry copper systems: Challenges to application of the thermometer. Resour. Geol. 2020, 70, 157–168. [Google Scholar] [CrossRef]
  37. Hawthorne, F.C.; Oberti, R.; Harlow, G.E.; Maresch, W.V.; Martin, R.F.; Schumacher, J.C.; Welch, M.D. Ima report: Nomenclature of the amphibole supergroup. Am. Mineral. 2012, 97, 2031–2048. [Google Scholar] [CrossRef]
  38. Ridolfi, F.; Renzulli, A.; Puerini, M. Stability and chemical equilibrium of amphibole in calc-alkaline magmas: An overview, new thermobarometric formulations and application to subduction-related volcanoes. Contrib. Mineral. Petrol. 2010, 160, 45–66. [Google Scholar] [CrossRef]
  39. Pirajno, F. Hydrothermal Processes and Mineral Systems; Springer Science & Business Media: Dordrecht, The Netherlands, 2009; ISBN 140208613X. [Google Scholar]
  40. Richards, J.P.; Mumin, A.H. Magmatic-hydrothermal processes within an evolving Earth: Iron oxide-copper-gold and porphyry Cu ± Mo ± Au deposits. Geology 2013, 41, 767–770. [Google Scholar] [CrossRef]
  41. Audétat, A.; Simon, A.C. Magmatic controls on porphyry copper genesis. In Geology and Genesis of Major Copper Deposits and Districts of the World—A Tribute to Richard H. Sillitoe; Society of Economic Geology: Littleton, CO, USA, 2020; Volume 16, pp. 553–572. ISBN 9781629490410. [Google Scholar]
  42. Burnham, C.W. Magmas and hydrothermal fluids. In Geochemistry of Hydrothermal Ore Deposits; Barnes, L.H., Ed.; John Wiley & Sons: New York, NY, USA, 1979; pp. 71–136. [Google Scholar]
  43. Nachit, H.; Ibhi, A.; Ohoud, M.B. Discrimination between primary magmatic biotites, reequilibrated biotites and neoformed biotites. Comptes Rendus Geosci. 2005, 337, 1415–1420. [Google Scholar] [CrossRef]
  44. Mathieu, L.; Crépon, A.; Kontak, D.J. Tonalite-dominated magmatism in the abitibi subprovince, canada, and significance for Cu-Au magmatic-hydrothermal systems. Minerals 2020, 10, 242. [Google Scholar] [CrossRef] [Green Version]
  45. Chiaradia, M. Copper enrichment in arc magmas controlled by overriding plate thickness. Nat. Geosci. 2014, 7, 43–46. [Google Scholar] [CrossRef]
  46. Schmidt, M.W.; Poli, S. Magmatic epidote. Rev. Mineral. Geochem. 2004, 56, 399–430. [Google Scholar] [CrossRef]
  47. Smith, D.J. Clinopyroxene precursors to amphibole sponge in arc crust. Nat. Commun. 2014, 5, 4329. [Google Scholar] [CrossRef] [Green Version]
  48. Blake, S. Volatile oversaturation during the evolution of silicic magma chambers as an eruption trigger. J. Geophys. Res. Solid Earth 1984, 89, 8237–8244. [Google Scholar] [CrossRef]
  49. Botcharnikov, R.E.; Linnen, R.L.; Wilke, M.; Holtz, F.; Jugo, P.J.; Berndt, J. High gold concentrations in sulphide-bearing magma under oxidizing conditions. Nat. Geosci. 2011, 4, 112. [Google Scholar] [CrossRef]
  50. Dilles, J.H. Petrology of the Yerington Batholith, Nevada; evidence for evolution of porphyry copper ore fluids. Econ. Geol. 1987, 82, 1750–1789. [Google Scholar] [CrossRef]
  51. Spear, F.S. Metamorphic Phase Equilibria and Pressure-Temperature Time Paths. Mineralogical Society of America, Monograph; Monograph series; Mineralogical Society of America: Washington, DC, USA, 1993; Volume 1. [Google Scholar]
  52. Moyen, J.-F. Archean granitoids: Classification, petrology, geochemistry and origin. Geol. Soc. Lond. Spec. Publ. 2019, 489, 15–49. [Google Scholar] [CrossRef]
Figure 1. Geological map of the Frotet–Troilus greenstone belt showing the distribution of the main lithologies. The map is modified from the Ministère de l’Énergie et des Ressources Naturelles of Québec (MERN), Sigeom dataset, and from the Ontario Geological Survey (OGS). The projection is UTM NAD83 Zone 18N. The inset displays the location of the samples considered in this contribution.
Minerals 12 00128 g001
Figure 2. Precursor calculated using the method Trépanier et al. [32] and the Kenorland dataset (n = 14,312). Calculated precursors are displayed on the Total Alkali Silicate (TAS) diagram (a) and Alkali-Fe-Mg (AFM) diagram (b).
Minerals 12 00128 g002
Figure 3. Whole rock chemical analyses of the Kenorland dataset (n = 14,312) displayed on (a) Al2O3, (b) CaO, (c) MgO, (d) K2O, (e) Na2O, and (f) FeOT vs. Zr/TiO2 binary diagrams. In these diagrams, Zr/TiO2 is used as a proxy to un-analyzed SiO2 values and these diagrams are the equivalent of Harker diagrams.
Minerals 12 00128 g003
Figure 4. The 22 new whole rock analyses displayed on (a,b) the TAS diagram, (c) a REE diagram, and (d) a multielement spider diagram [33]. The data in (c,d) are normalized to the primitive mantle [34]; (e) binary diagram displaying CaO, FeO, and MgO mass changes in g per 100 g of precursor. These mass changes are calculated using the method Trépanier et al. [32] for the 22 new chemical data and for the Kenorland dataset (n = 14,312).
Minerals 12 00128 g004
Figure 5. (ad) Diorite observed in cathodoluminescence and showing: (a) elongated apatite and euhedral feldspar (blue) altered along their edges (brown-orange) in sample TR13; (b) coarse-grained sample TR43 that contains large euhedral feldspar with sericitized core (dark blue-grey), least-altered rim (blue), and albitized ± carbonatized edge (brown-orange), as well as amphibole (black), apatite (green), and interstitial K-feldspar (bright blue); (c) large amphibole grain with feldspar inclusions and a carbonatized rim in sample TR10; (d) feldspar-porphyry with oscillatory zoning altered along its edge, in a feldspar-dominated albitized and carbonatized matrix, in sample TR16; (e) samples TR10 and (f) TR13 observed in natural light and displaying large amphibole grains with clinopyroxene core (e), altered amphiboles (f), and euhedral feldspars (e,f); mineral abbreviations are from Warr [27]. Additional CL images are available as supplementary material to this publication (Figure S2).
Minerals 12 00128 g005
Figure 6. Backscatter electron (BSE) images of (a) altered amphibole grain dominated by actinolite and containing altered feldspar inclusions (now epidote-quartz), minute quartz inclusions (black), Ca-rich patches (Ca), relic hornblende patches, and REE-bearing epidote inclusions; (b) sample TR10 displays a clinopyroxene relic partially replaced by a porous amphibole that contains apatite, magnetite, quartz, calcite, and titanite inclusions; (c) sample TR13 showing a partially altered amphibole that contains Fe-Mg-Si-rich domains; (d) sample TR13 containing porous (quartz inclusions-rich) actinolite rimmed by a more homogeneous amphibole; (e) altered amphibole in sample TR43 that contains apatite and REE-bearing epidote that display oscillatory zoning; (f) porous amphibole and chloritized biotite grain rimmed by titanite. Mineral abbreviations are from Warr [27]. Additional BSE images are available as supplementary material to this publication (Figure S3).
Minerals 12 00128 g006
Figure 7. (a) Analyses performed using an Energy-Dispersive Detector (EDS) and displayed on the ternary diagram for feldspar (n = 589); (b) temperature calculated using EDS analyses performed on biotite grains (n = 272) and the Ti-in-biotite thermometer of Henry et al. [35].
Minerals 12 00128 g007
Figure 8. Punctual analyses performed on amphibole grains using EDS; (a,b) amphibole analyses displayed on the binary diagram for Ca-amphiboles and classified following the recommendations of Hawthorne et al. [37]. These diagrams display amphiboles (a) from phase 1a (n = 990) and (b) from the other phases (n = 1381), excluding the 13 analyses of Ca-rich domains that plotted outside of the diagram; (c,d) binary diagram showing the Mg# of amphibole as a function of Al-Fe-Ti (apfu) content (c) for phases 1a and 1b, and (d) for the other phases.
Minerals 12 00128 g008
Figure 9. Subset (n = 352) of the punctual analyses performed on amphibole grains using EDS, i.e., only the grains for which the method of Ridolfi et al. [38] returned results are shown. Amphibole analyses are (a) classified following the recommendations of Hawthorne et al. [37] and returned physical-chemical parameters [38] that are displayed on a (b) pressure vs. temperature, (c) a delta nickel nickel oxide buffer (∆NNO) vs. temperature, and (d) a water (H2O content of the melt) vs. temperature binary diagrams.
Minerals 12 00128 g009
Figure 10. Amphibole chemistry (n = 121) as analyzed using laser ablation (LA-ICP-MS) and displayed on (a) a REE diagram and (b) a multielement spider diagram [33]. The data are normalized to the primitive mantle [34]. The silica content is displayed using a centile-based classification. The main diagrams show the bulk of analyses, and insets in the upper-right corners display median values for each silica interval.
Minerals 12 00128 g010
Figure 11. Amphibole composition as documented by LA-ICP-MS analyses and displayed on a temperature vs. silica binary diagram (n = 104). Temperature values are calculated using the method of Ridolfi et al. [38].
Minerals 12 00128 g011
Table 1. Modal proportions for the 22 intrusive and volcanic rock samples.
SamplePhasePl 1KfsQzAmp (cpx)Bt-ChlApEpMagTtnIlmPyCpyCal
TR06Phase 1a455251561 11 TrTr1
TR1056522471Tr 211 Tr 3
TR414415241131 11 Tr Tr
TR4365510114111Tr 1 1
TR4455522291 21 TrTr3
TR03Phase 1b58 527511TrTr 1Tr2
TR0558Tr102181Tr11 Tr
TR0775 51231 21 Tr 1
TR1365Tr4233111TrTrTrTr2
TR1552Tr5325112Tr 1Tr1
TR4061 72181Tr1Tr 1
TR11Phase 1c55 132201 1 3 5
TR1669 8 141 1 2 5
TR215512458111 TrTrTr4
TR29 348 287131Tr2 TrTr1
TR23Phase 242 545 1 1 TrTrTr6
TR04401548 1Tr21 1 1
TR28Andesite71 518 1 5
TR3160 30 1 9
TR35Dacite45 271341Tr Tr 10
TR2639Tr242141Tr 1Tr 10
TR3259 201551 Tr
1 Abbreviations are from Warr [27] and stand for plagioclase (Pl), K-feldspar (Kfs), quartz (Qz), amphibole (Amp), clinopyroxene (cpx), biotite (Bt), chlorite (Chl), apatite (Ap), epidote (Ep), magnetite (Mag), titanite (Ttn), ilmenite (Ilm), pyrite (Py), chalcopyrite (Cpy), and calcite (Cal); 2 Tr stands for trace amount; 3 Modal proportions for the main intrusive phase observed in sample TR29 (enclaves are described in the text).
Table 2. Amphibole composition as documented by LA-ICP-MS and classified as a function of silica content.
<52.78 152.78–55.3355.33–57.4357.43–58.80>58.80
Med 2StdMedStdMedStdMedStdMedStd
SiO2 (wt%)50.466.6254.520.8156.460.7058.200.3459.512.02
P2O50.120.830.020.150.020.330.010.050.010.04
TiO21.271.840.520.290.360.660.400.210.240.17
Al2O37.872.455.592.203.740.903.162.123.182.80
Cr2O30.030.100.130.210.220.190.150.190.120.33
MnO0.340.120.270.070.270.070.280.050.280.08
FeOT13.141.1910.593.1610.212.659.320.988.621.61
MgO11.482.0012.701.1014.251.0714.561.7814.192.93
CaO12.478.8413.793.9413.292.9513.071.3812.671.83
Na2O0.870.270.670.220.430.110.360.520.361.04
K2O0.710.480.330.220.150.190.190.340.060.14
S (wt%)0.080.390.050.050.040.010.040.020.050.02
Sc (ppm)54.2925.5759.7725.8663.0223.0055.2826.5946.5534.54
V285.0164.39238.1184.33207.0580.02201.9585.30154.26104.54
Cr183.10714.99885.931426.001487.051279.231026.151293.32829.512260.56
Co61.7431.8057.169.6157.157.4857.586.4058.7111.34
Ni168.9085.10222.13104.34285.1584.02293.31125.57239.15155.95
Cu3.59252.932.61676.503.0585.254.2725.901.2810.86
Zn227.9751.33148.8578.94197.4580.70199.9558.23196.4057.28
As1.831.161.481.720.851.541.090.650.580.54
Rb7.0810.553.554.451.075.011.418.000.453.45
Sr135.21196.2390.16121.1134.1945.9829.5351.0717.00145.10
Y42.1331.2218.4819.4613.7212.0315.0115.197.496.24
Zr43.46168.4130.8723.2324.6835.1233.65406.739.3121.22
Nb9.1014.341.073.981.332.640.741.620.600.81
Mo0.120.280.070.100.060.220.090.180.040.28
Sn2.612.541.113.160.812.620.781.110.720.66
Ba77.33258.5128.34112.949.7931.8513.7890.066.6452.89
La41.27258.8515.0059.738.987.937.7914.611.107.21
Ce152.39499.7751.11136.1830.9632.2326.2852.463.7718.40
Pr22.3557.688.6216.885.105.294.278.460.692.78
Nd105.37218.6240.0567.2326.1625.6518.5438.724.1513.54
Sm22.5432.447.9512.235.695.444.238.001.383.15
Eu4.439.291.721.931.080.630.840.690.450.44
Gd17.4322.905.548.224.363.924.065.401.352.43
Tb1.922.330.670.920.520.480.550.630.200.29
Dy9.689.654.124.432.802.533.023.251.291.51
Ho1.611.180.700.720.540.440.570.570.270.25
Er3.952.271.641.751.431.161.461.490.810.62
Tm0.460.250.200.210.180.150.190.190.130.08
Yb2.711.501.351.211.080.911.201.230.850.46
Lu0.380.190.190.160.140.120.160.190.120.06
Hf2.622.821.360.871.041.401.319.680.350.77
Ta0.300.510.060.150.050.100.030.060.020.04
Au0.000.020.000.000.000.000.000.000.000.00
Pb4.414.062.662.481.270.601.7012.570.781.45
Bi0.110.160.040.120.040.210.040.030.030.02
Th1.227.950.412.620.741.000.542.330.131.04
U0.772.560.241.160.240.190.191.390.070.79
1 Silica content of amphibole; 2 Med stands for median value, and Std stands for standard deviation.
Table 3. Classification of the 22 intrusive and volcanic rocks samples.
Field DesignationMineralogyMineralogy and ChemistryFinal
DioritePhase 1aGranodioriteGranodiorite intrusive phase (1a–1c)
Phase 1c
Phase 1bDioriteDiorite intrusive phase (1b)
GabbroPhase 2 (TR04)GabbroGabbro intrusive phase
Phase 2 (TR23)BasaltVolcanic hostrock
Dacite(thin-grained and altered)Dacite
AndesiteBasalt-Andesite
Publisher’s Note: MDPI stays neutral with regard to jurisdictional claims in published maps and institutional affiliations.

