3.2. Structure Description
The title compound’s asymmetric unit is composed of two crystallographically independent tetrachlorocuprate (II) anions and four non-equivalent (C
9H
14N))
+ cations (
Figure 3). The structure of (C
9H
14N)
2[CuCl
4] consists of an infinity of flat strips parallel to the [001] direction at x= 1/4, y = 0, formed by [(C
9H
14N)
2Cu(1)Cl
4]
S(I) and at x =3/4, y =1/2, formed by [(C
9H
14N)
2Cu(2)Cl
4]
S(II) (
Figure 4). As shown in
Figure 4 S(I), each [Cu(1)Cl
4]
2− tetrahedron links to three neighboring hexagonal rings [N41–C42–C41–C45–C44–C43] from 4-TBP molecules (named No. 4) and one counterpart from the No. 2 (4-TBP) molecule by hydrogen bonds to form strip I. Interestingly, each hexagonal ring of the No. 4 (4-TBP) molecule also links to three neighboring [Cu1Cl
4]
2− tetrahedra. Moreover, the plane of the hexagonal ring of the No. 4 (4-TBP) molecule is also parallel to (100) plane, but that of the No. 2 (4-TBP) molecule is not. Similarly, each [Cu(2)Cl
4]
2− tetrahedron links to three neighboring hexagonal rings from No. 1 (4-TBP) molecules and one counterpart from No. 3 (4-TBP) molecules by hydrogen bonds to form strip II. Strips I and II are combined with each other via hexagonal rings from both No. 2 and 3 (4-TBP) molecules. The hexagonal ring from the No. 2 (4-TBP) molecule links to two [Cu(2)Cl
4]
2− tetrahedra and one [Cu(1)Cl
4]
2− tetrahedron, whereas that from No. 3 links to one [Cu(2)Cl
4]
2− tetrahedron and two [Cu(1)Cl
4]
2− tetrahedra. Strips I and II are crystallographically independent, leading to a non-centrosymmetric space group of
Pc.
Each Cu(II) atom coordination geometry may be defined as a distorted [CuCl
4]
2− tetrahedron. The Cu–Cl bond lengths in this compound vary between 2.2391 (2) and 2.2790 (12) Å, while the bond angles around the Cu atom range from 96.46 (5)° to 140.37 (6)° for the Cu(1)Cl
4 tetrahedron and from 94.75 (5)° to 137.91 (6)° for the Cu(2)Cl4 tetrahedron (
Table 2). These results are analogous to those found in other Cu(II) tetrahedral complexes [
37,
38,
39,
40,
41].
The Cl–Cu–Cl angles depart from the perfect 109.5°. This distortion is induced by the interaction of the NH
+ group with the chloride pairs, which affects the distortion of the [CuCl
4]
2− anions. To investigate this fact, the distortion indices were calculated: DI(Cl–Cu(1)) = 0.0072, DI(Cl–Cl) = 0.1016, and DI(Cl–Cu(1)–Cl) = 0.1661 for [Cu(1)Cl
4]
2− anions and DI(Cl–Cu(2)) = 0.0054, DI(Cl–Cl) = 0.1210, and DI(Cl–Cu(2)–Cl) = 0.1770 for [Cu(2)Cl
4]
2− anions. These values indicate a high distortion of the Cl–Cu–Cl angles for both anions when compared to Cl–Cl distances. The anions [CuCl
4]
2− are assumed to be constructed by a regular arrangement of chlorine atoms, with the copper atom faintly displaced from the center of gravity of the tetrahedron. Moreover, the Yang parameter τ may be used to measure the geometry of the four-coordinated metal complex, with zero indicating a perfect square planar geometry and one indicating a perfect tetrahedral geometry [
42]. For the [Cu(1)Cl
4]
2− tetrahedron, the calculated τ value is 0.58, while the value of the [Cu(2)Cl
4]
2− tetrahedron is equal to 0.55 (
Figure 5). These two τ values clearly indicate that the shape of the tetrachlorocuprate anions falls between tetrahedral geometry and square-planar geometry.
The two neighbouring strips, [Cu(1)Cl
4(C
9H
14N)
2]
n at x = 1/4, y= 0 and [Cu(2)Cl
4(C
9H
14N)
2]
n at x = 3/4 y = 1/2, are interconnected into a 3D supramolecular network by means of C23–H23...Cl8, C32–H32...Cl1, C33–H33...Cl4, and C(41)–H...Cl(4) H-bonds (
Table 3) (
Figure 4). As can be seen in
Figure 4, the N atoms of each cation are directed toward each tetrahedron [CuCl
4]
2−, where the non-equivalent cations in each strip are locked on a triangle made up of three [CuCl
4]
2− anions, establishing multiple hydrogen bonds. The N21–H21A...Cl1, C23–H23...Cl1, C(44)–H(44)...Cl(1), C42–H42...Cl2, N(41)–H(41A)...Cl(2), N21–H21...Cl4, C(43)–H(43)...Cl(3),N(41)–H(41A)...Cl(3), C41–H41...Cl4, and N21–H(21A)...Cl4 are responsible for the generation of the flat strips
S(I) made by [Cu(1)Cl
4]
2− anions and the organic cations at x = 1/4 and y = 0. However, the flat strips’
S(II) cohesiveness is due to the hydrogen bonds, C11–H11...Cl5, C33–H33...Cl5,C12–H12...Cl6, C13–H13...Cl6, N11–H11A...Cl6, C13–H13...Cl7, N11–H11A...Cl7, C14–H14...Cl8, and N31–H31...Cl8 at x = 3/4 and y = 1/2, made by [Cu(2)Cl
4]
2− anions and the organic cations as listed in
Table 3.
The basic geometrical properties of the (C
9H
14N)
+ organic cations are gathered in
Table 4. The values are compatible with those reported in the literature [
42,
43,
44,
45]. The pyridinium cation always has an expanded C–N–C angle compared to the parent pyridine. As reported in many structures [
45,
46,
47], the C12–N11–C13 = 120.9 (5)°, C22–N21–C23 = 122.0 (5)°, C32–N31–C33 = 122.1 (5)°, and C43–N41–C42 = 121.9 (4)° are typical for protonated pyridine forms.
Figure 6 represents all the contact between the organic cations in the atomic arrangement [
48,
49,
50]. We conclude from these results that the C–H⋯π interactions, which vary from 3.424 Å to 3.723 Å, and the H-bond help to keep the crystal packing stable and allow the formation of the three-dimensional network.
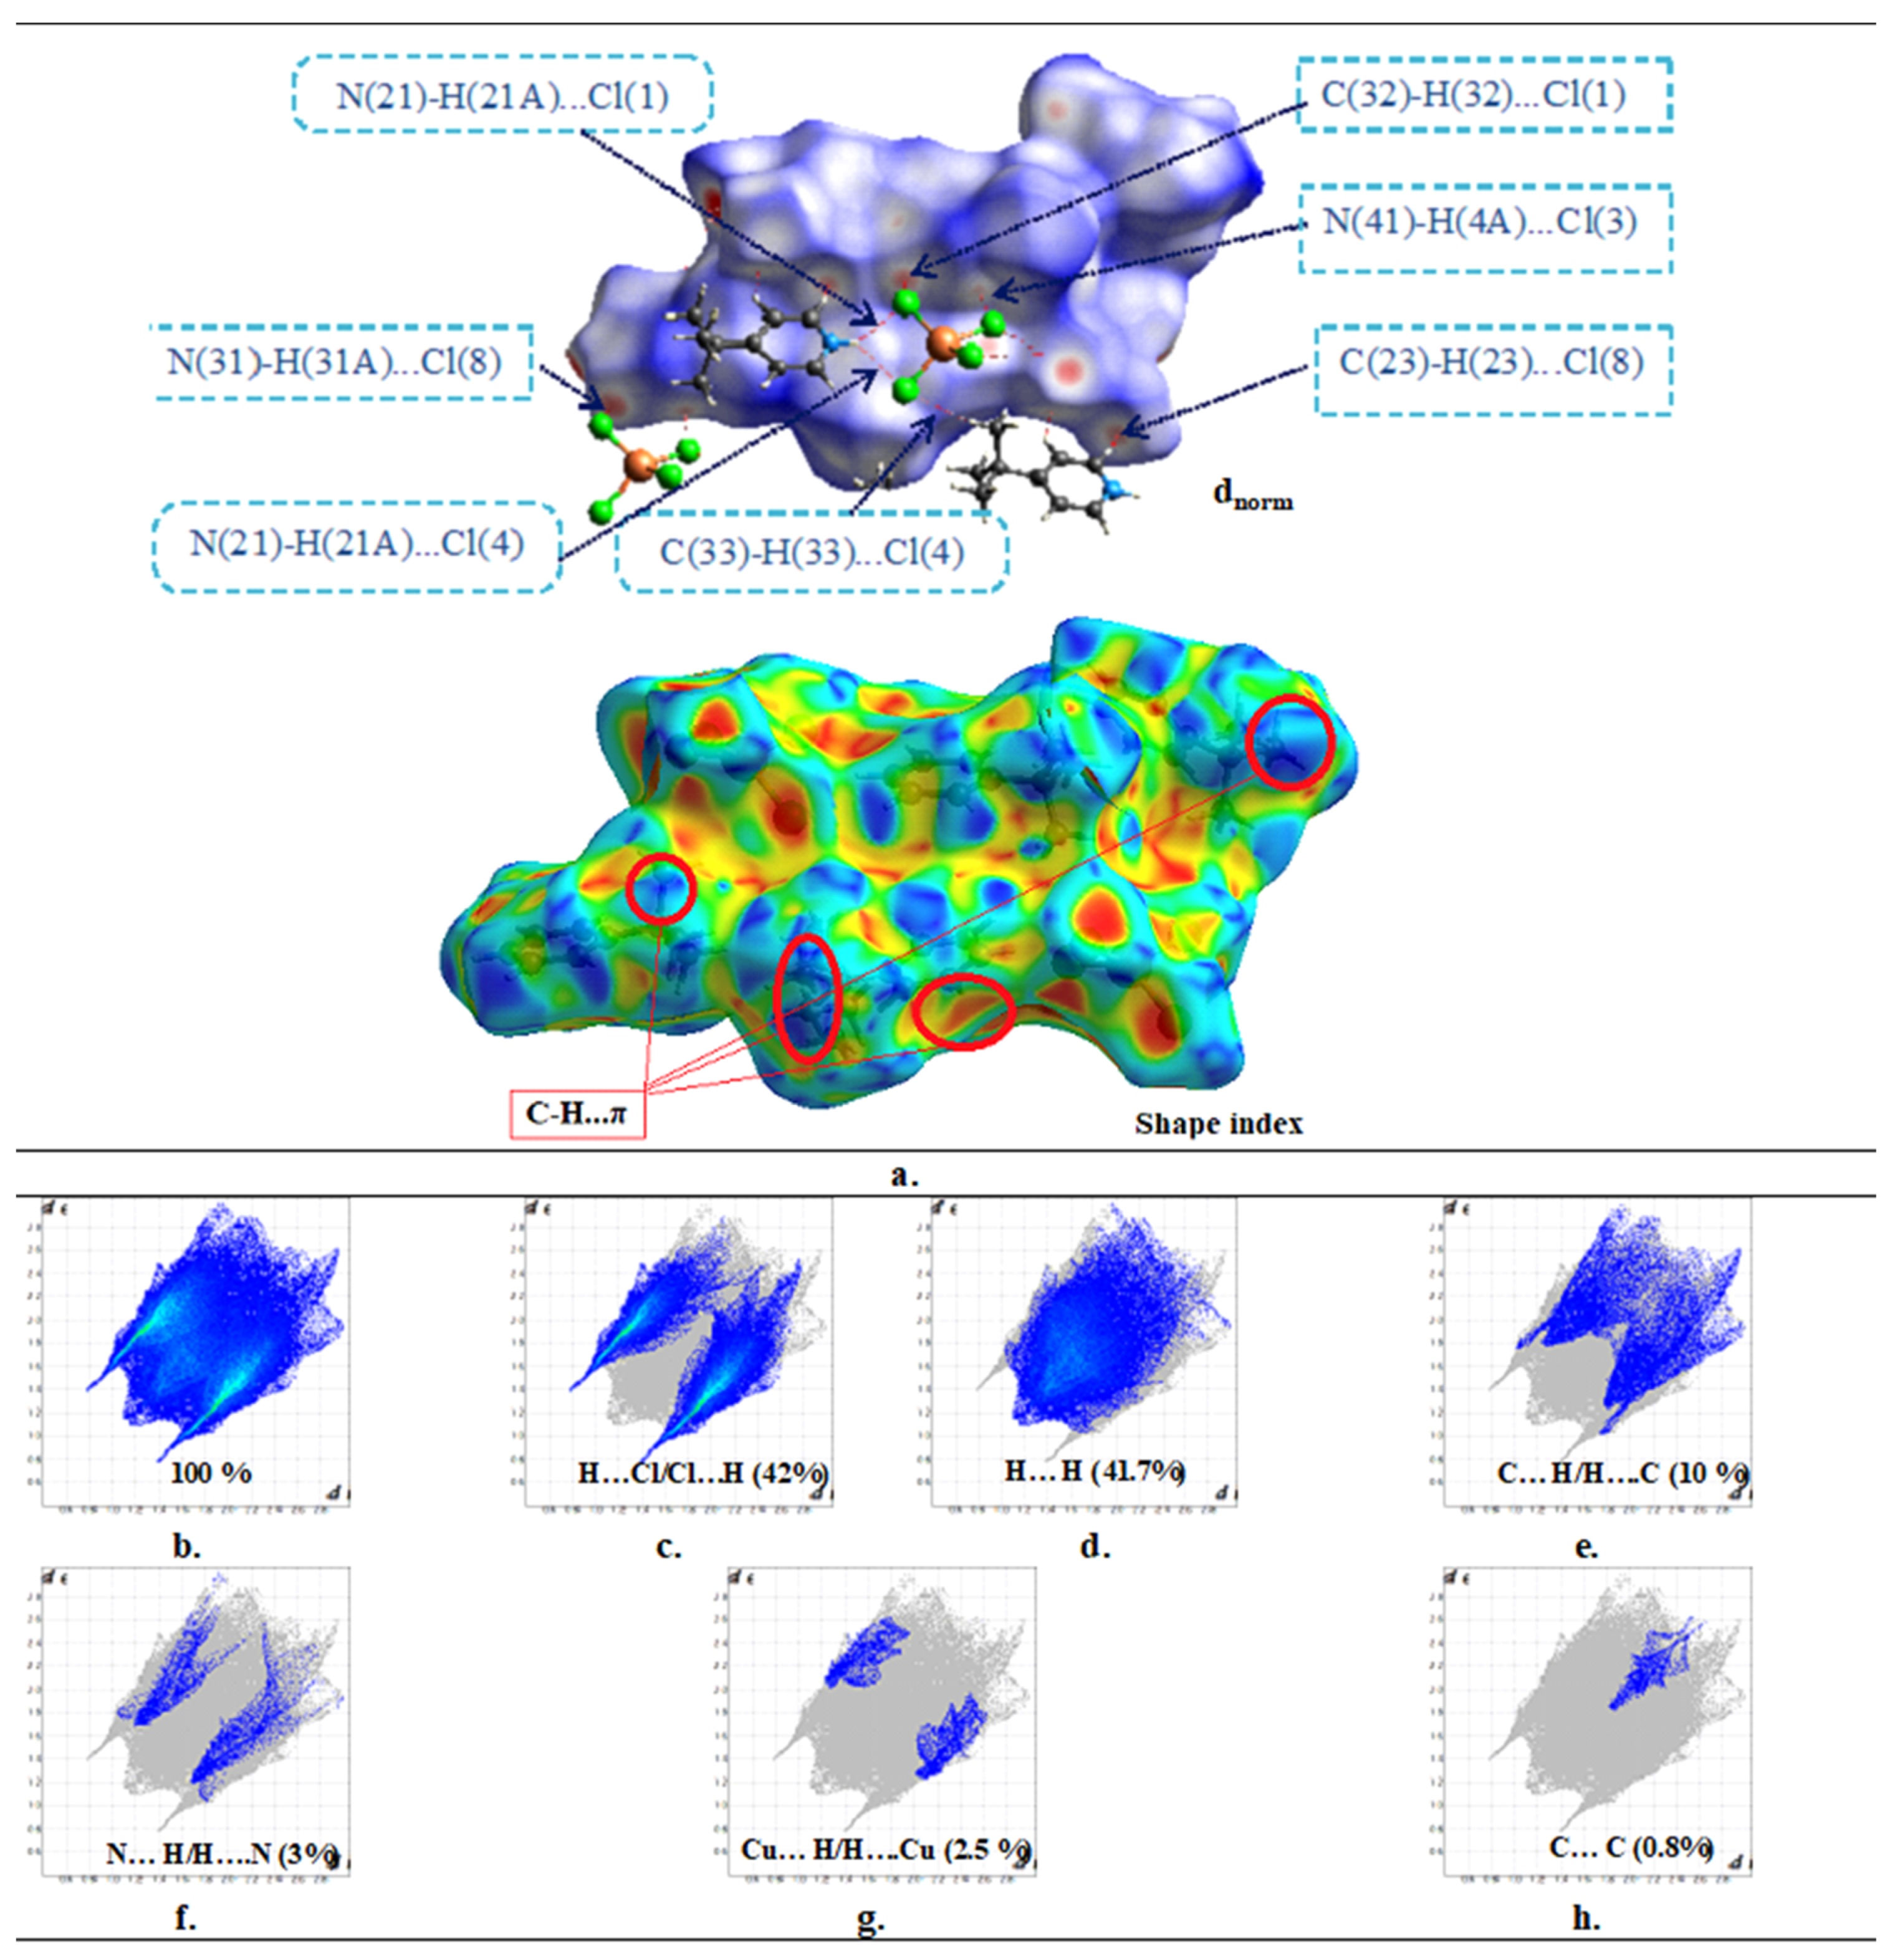
3.3. Hirshfeld Analysis
Hirshfeld surface analysis is useful in determining the importance of the non-strong method for investigating intermolecular interactions and gaining insight into crystal packing behaviour by giving information about the molecules’ surroundings in the crystallized environment [
51]. Companion techniques to the structural descriptions, HS and fingerprint plots (FP), are utilized to decode the intermolecular interactions involved in crystal packing and their magnitudes. In addition, the enrichment ratio (ER) computation in conjunction with the HS analysis provides insight into the likelihood that the compound under study will interact [
52]. With an EXY greater than one, favoured contacts are more likely to make contacts, while element pairings with an E
XY < 1 are more likely to not form contacts (
Table 5). The Hirshfeld surface was produced for the compound’s asymmetric components (
Figure 7a), the H-bonding; C–H...Cl and N–H...Cl may be seen on the d
norm surfaces as deep-red spots, where all the atoms inside the surface can be observed through a translucent surface. Moreover, there are multiple bright-red spots associated to C-H⋯π interactions, which are well confirmed by the Shape-index function as hollow orange areas and bulging blue areas. Furthermore,
Figure 7b depicts the 2D FP of all contacts that contribute to the Hirshfeld surface.
The FP decomposition reveals two prominent spikes, indicating a strong interaction between H...Cl/Cl...H contacts associated with the N(C)–H...Cl H-bonds (
Table 4), accounting for (42%) of the total Hirshfeld surface. Moreover, chloride and hydrogen are present in large concentrations on the molecular surface (%SH = 69.45% and %S Cl = 21%), making these interactions the most prevalent with E
H...Cl = 1.43 (
Figure 7c). Additionally, the fingerprint pattern exhibited by H...H contacts, which contribute 41.7% to the total HS, is interpreted as a high concentration in the center area, owing to the molecule’s high hydrogen content on the surface (%SH = 69.45%). The distribution of scattered points in the 2D FP map reflects the H...H interactions, although they are underrepresented, with an enrichment ratio of around 0.86 (
Figure 7d). Despite its significant percentage, this interaction’s role in structure stabilization is quite minor in magnitude, because it is between the same species. With an enrichment ratio greater than the unit (E
C...H = 1.23), the C...H/H...C contact, attributed to the C–H…π interactions, is the third most prominent surface interaction, accounting for 10% of the Hirshfeld surface (
Figure 7e). This demonstrates the significance of this interaction on the structure of this compound. However, even though the N...H/H...N and Cu...H/H...Cu interactions have relatively modest surface areas, they are preferred and show enrichment values of E
N...H = 1.39 and E
Cu...H = 1.43 (
Figure 7f,g). There is only 0.8% of the total HS area that C...C contact, but they are more abundant with E
C...C = 2.33 (
Figure 7h). Finally, the seven kinds of connections contribute greatly to the crystal structure’s stability, and the results of this research are congruent with those reported by X-ray diffraction analysis.
3.4. IR Spectroscopy
The infrared spectroscopy approach was utilized to understand more about the functional groups in the compound, verified by comparison with other compounds that are connected with the same cation [
53,
54]. For the 4000–400 cm
−1 range,
Figure 8 shows a recording of this compound’s IR spectrum at ambient temperature. Asymmetric and symmetric N–H stretching vibrations are responsible for the band between 3300–3000 cm
−1 in the IR spectrum of (C
9H
14N)
2[CuCl
4]. The C–H stretching modes are responsible for the large absorption bands in the range of 3000–2900 cm
−1. The C=C bonds in the pyridine may be identified by the shoulder band in the spectral area at 1590 cm
−1, whereas the C=N bonds can be identified by the peak at 1492 cm
−1. However, at 688 cm
−1, the ring deformation band δ(py) is observed. The out-of-plane ring deformation band (py) develops at 550 cm
−1 as well. C–N stretching bands were found at 1340 and 1150 cm
−1. Asymmetric and symmetric C–C stretching modes were shown to be responsible for the 1102 cm
−1 band. Twisting and rocking modes of NH
+ groups occur at 1014 and 930 cm
−1, respectively. C–H out-of-plane deformation is detected at 801 cm
−1, whereas δ(C–C–C) and δ(C–C–N) are detected at 670 cm
−1.
3.5. UV-Visible Spectrum
The UV-Visible spectrum of (C
9H
14N)
2[CuCl
4] was examined in the 200–800 nm range (
Figure 9a). This finding is consistent with other compounds containing the [CuCl
4]
2− anion, including (C
5H
7N
2)
2CuCl
4H
2O, (C
4H
9NH
3)
2CuCl
4, (C
10H
21NH
3)
2CuCl
4, and (C
6H
9N
2)
2[CuCl
4] [
55,
56]. Two distinct bands were observed in the UV-Vis spectrum. The band at 350 nm (the least intense) is associated with the
π–
π* transition, owing to the (C
9H
14N)
+ organic group [
57]. The second band (most intense), at 580 nm, refers to a d–d transition in the orbits of the metal Cu
2+.
To obtain insight into the behavior of this material (conductor, semiconductor, or insulator), we examined the gap energy Eg of (C
9H
14N)
2[CuCl
4]. To illustrate this, we plotted the change of (αhv)
2 vs. hv. As seen in
Figure 9b, the optical band gap energy can be determined by linear interpolation of the
x-axis of the graphical representation (αhν)
2 (direct band gap) and (αhν)
1/2 (indirect band gap), which is predicted to be 1.75 eV. These gap energy values may be used to classify this material as a semiconductor [
58].

 ,
, 


