
Machine Learning-Assisted Dual-Marker Detection in Serum Small Extracellular Vesicles for the Diagnosis and Prognosis Prediction of Non-Small Cell Lung Cancer

 , , ,
, , , 
Abstract
:1. Introduction
2. Materials and Methods
2.1. Cell Culture
2.2. Clinical Samples
2.3. sEV Purification
2.4. Nanoparticle Tracking Analysis
2.5. Transmission Electron Microscopy
2.6. Scanning Electron Microscopy
2.7. Flow Cytometry Analysis
2.8. Protein Separation and Western Blot Analysis
2.9. Immunohistochemical Analysis
2.10. RNA Extraction and Real-Time Polymerase Chain Reaction (PCR)
2.11. Logistic Regression
2.12. Machine Learning
2.13. Statistical Analysis
3. Results
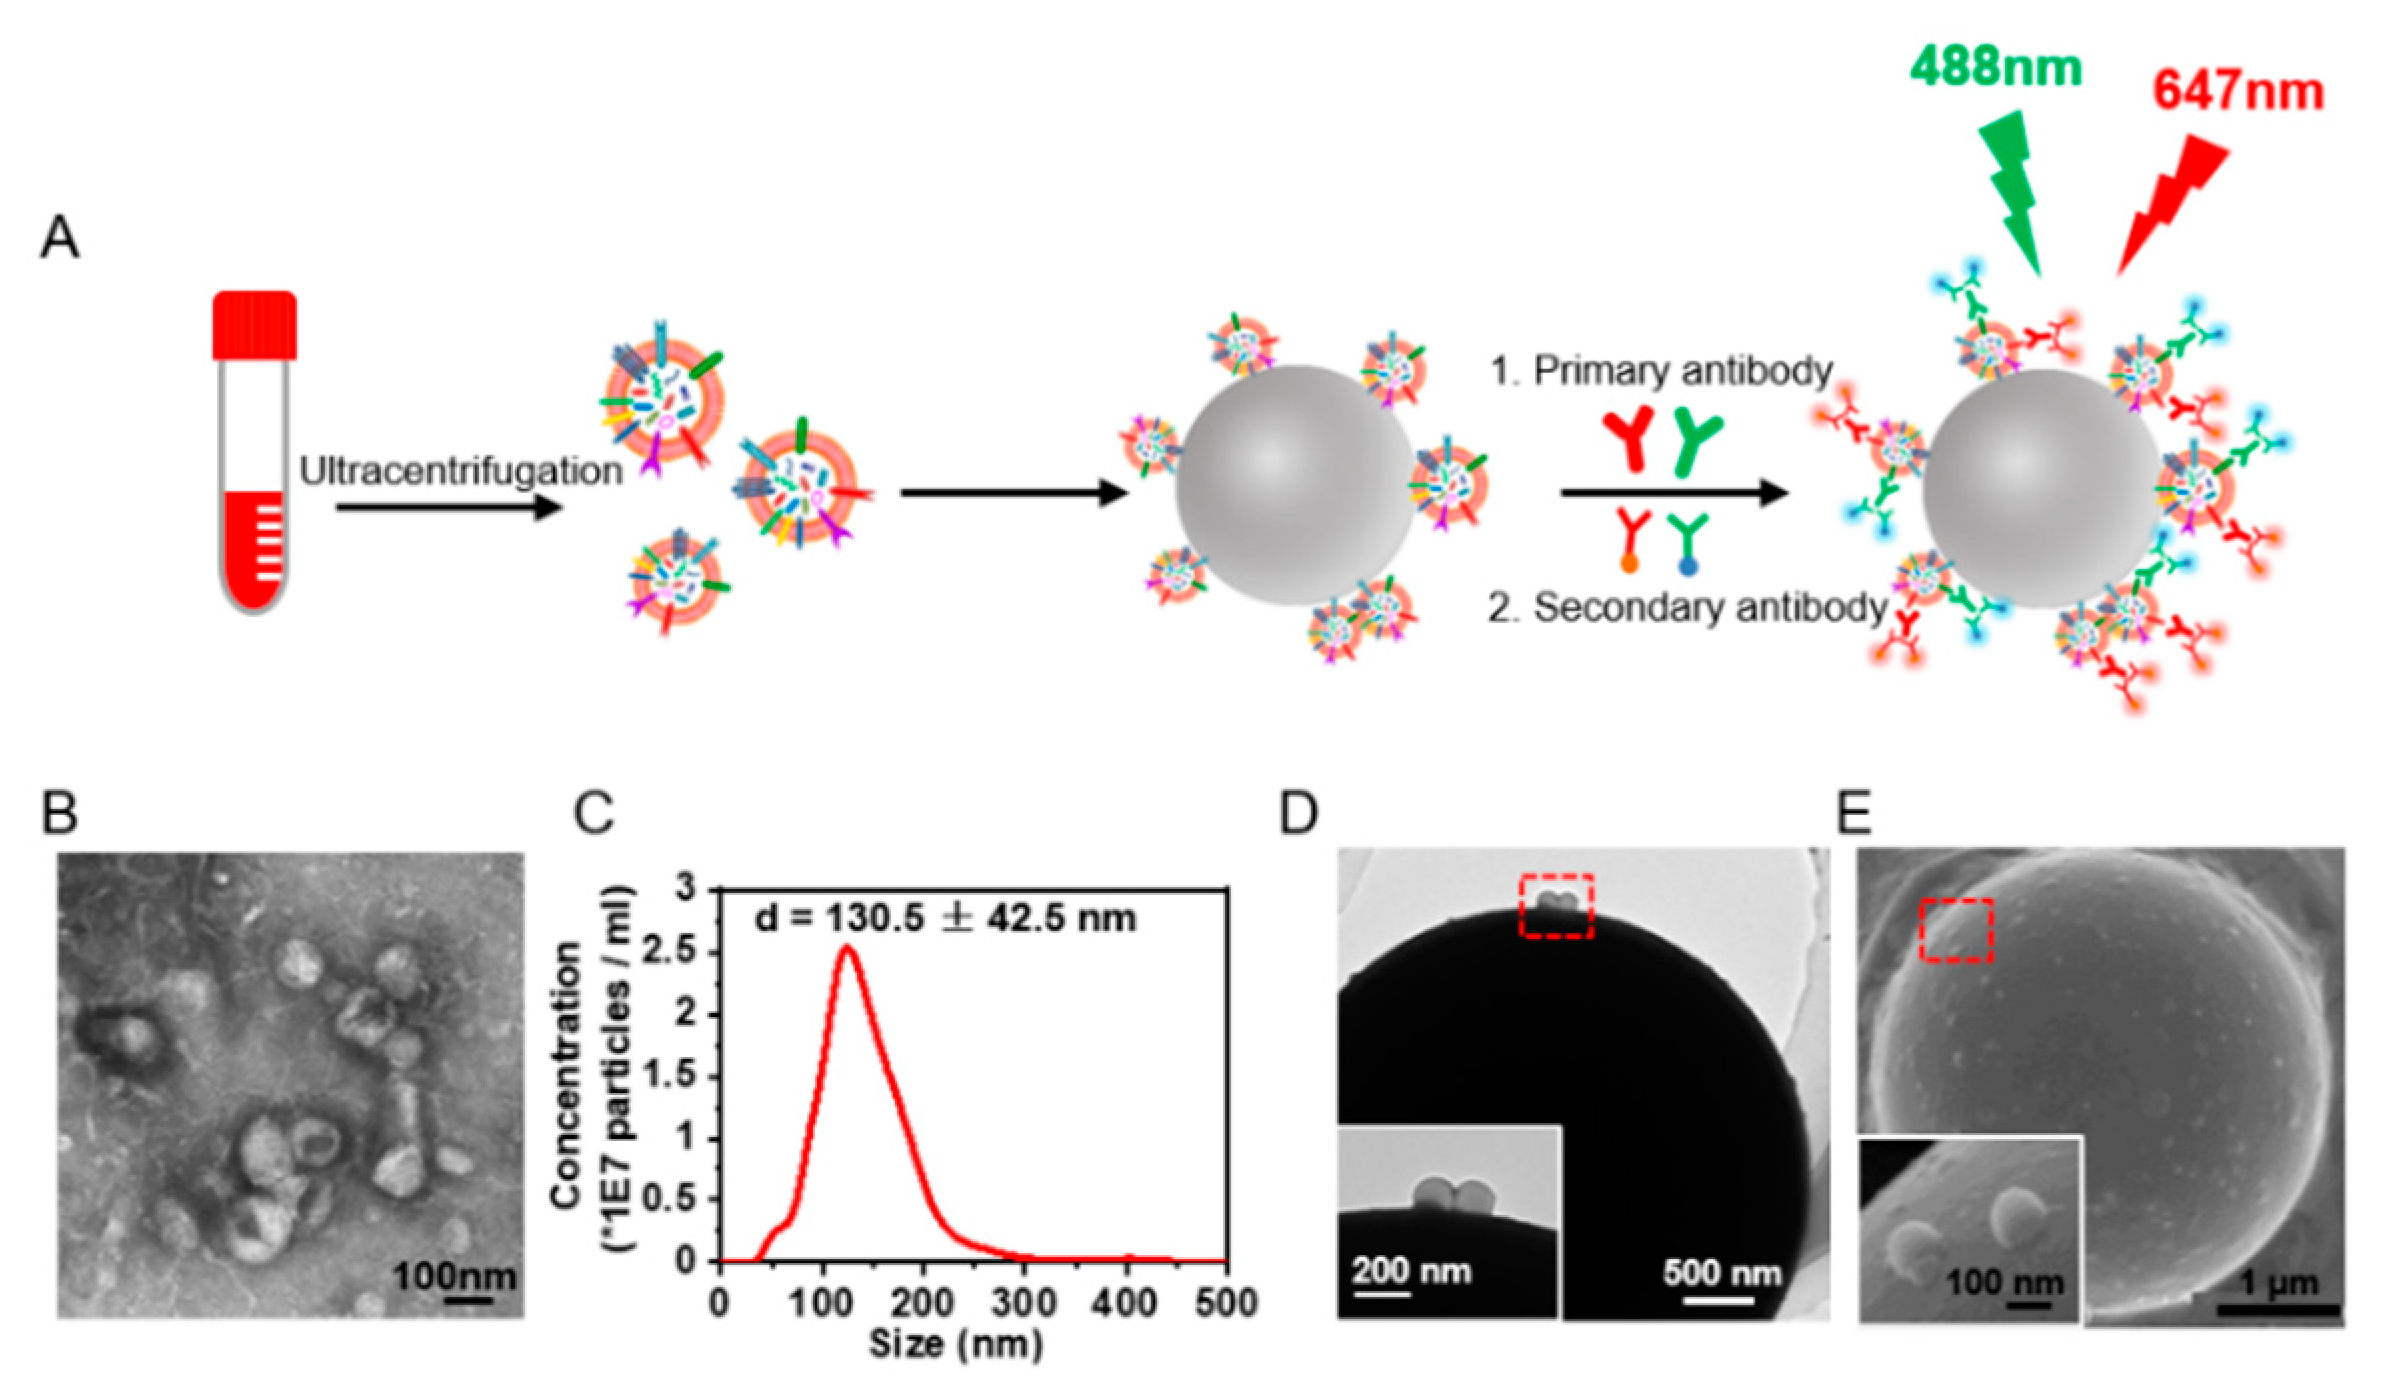
3.1. Signal-Amplified Detection of Protein Expression on the sEVs
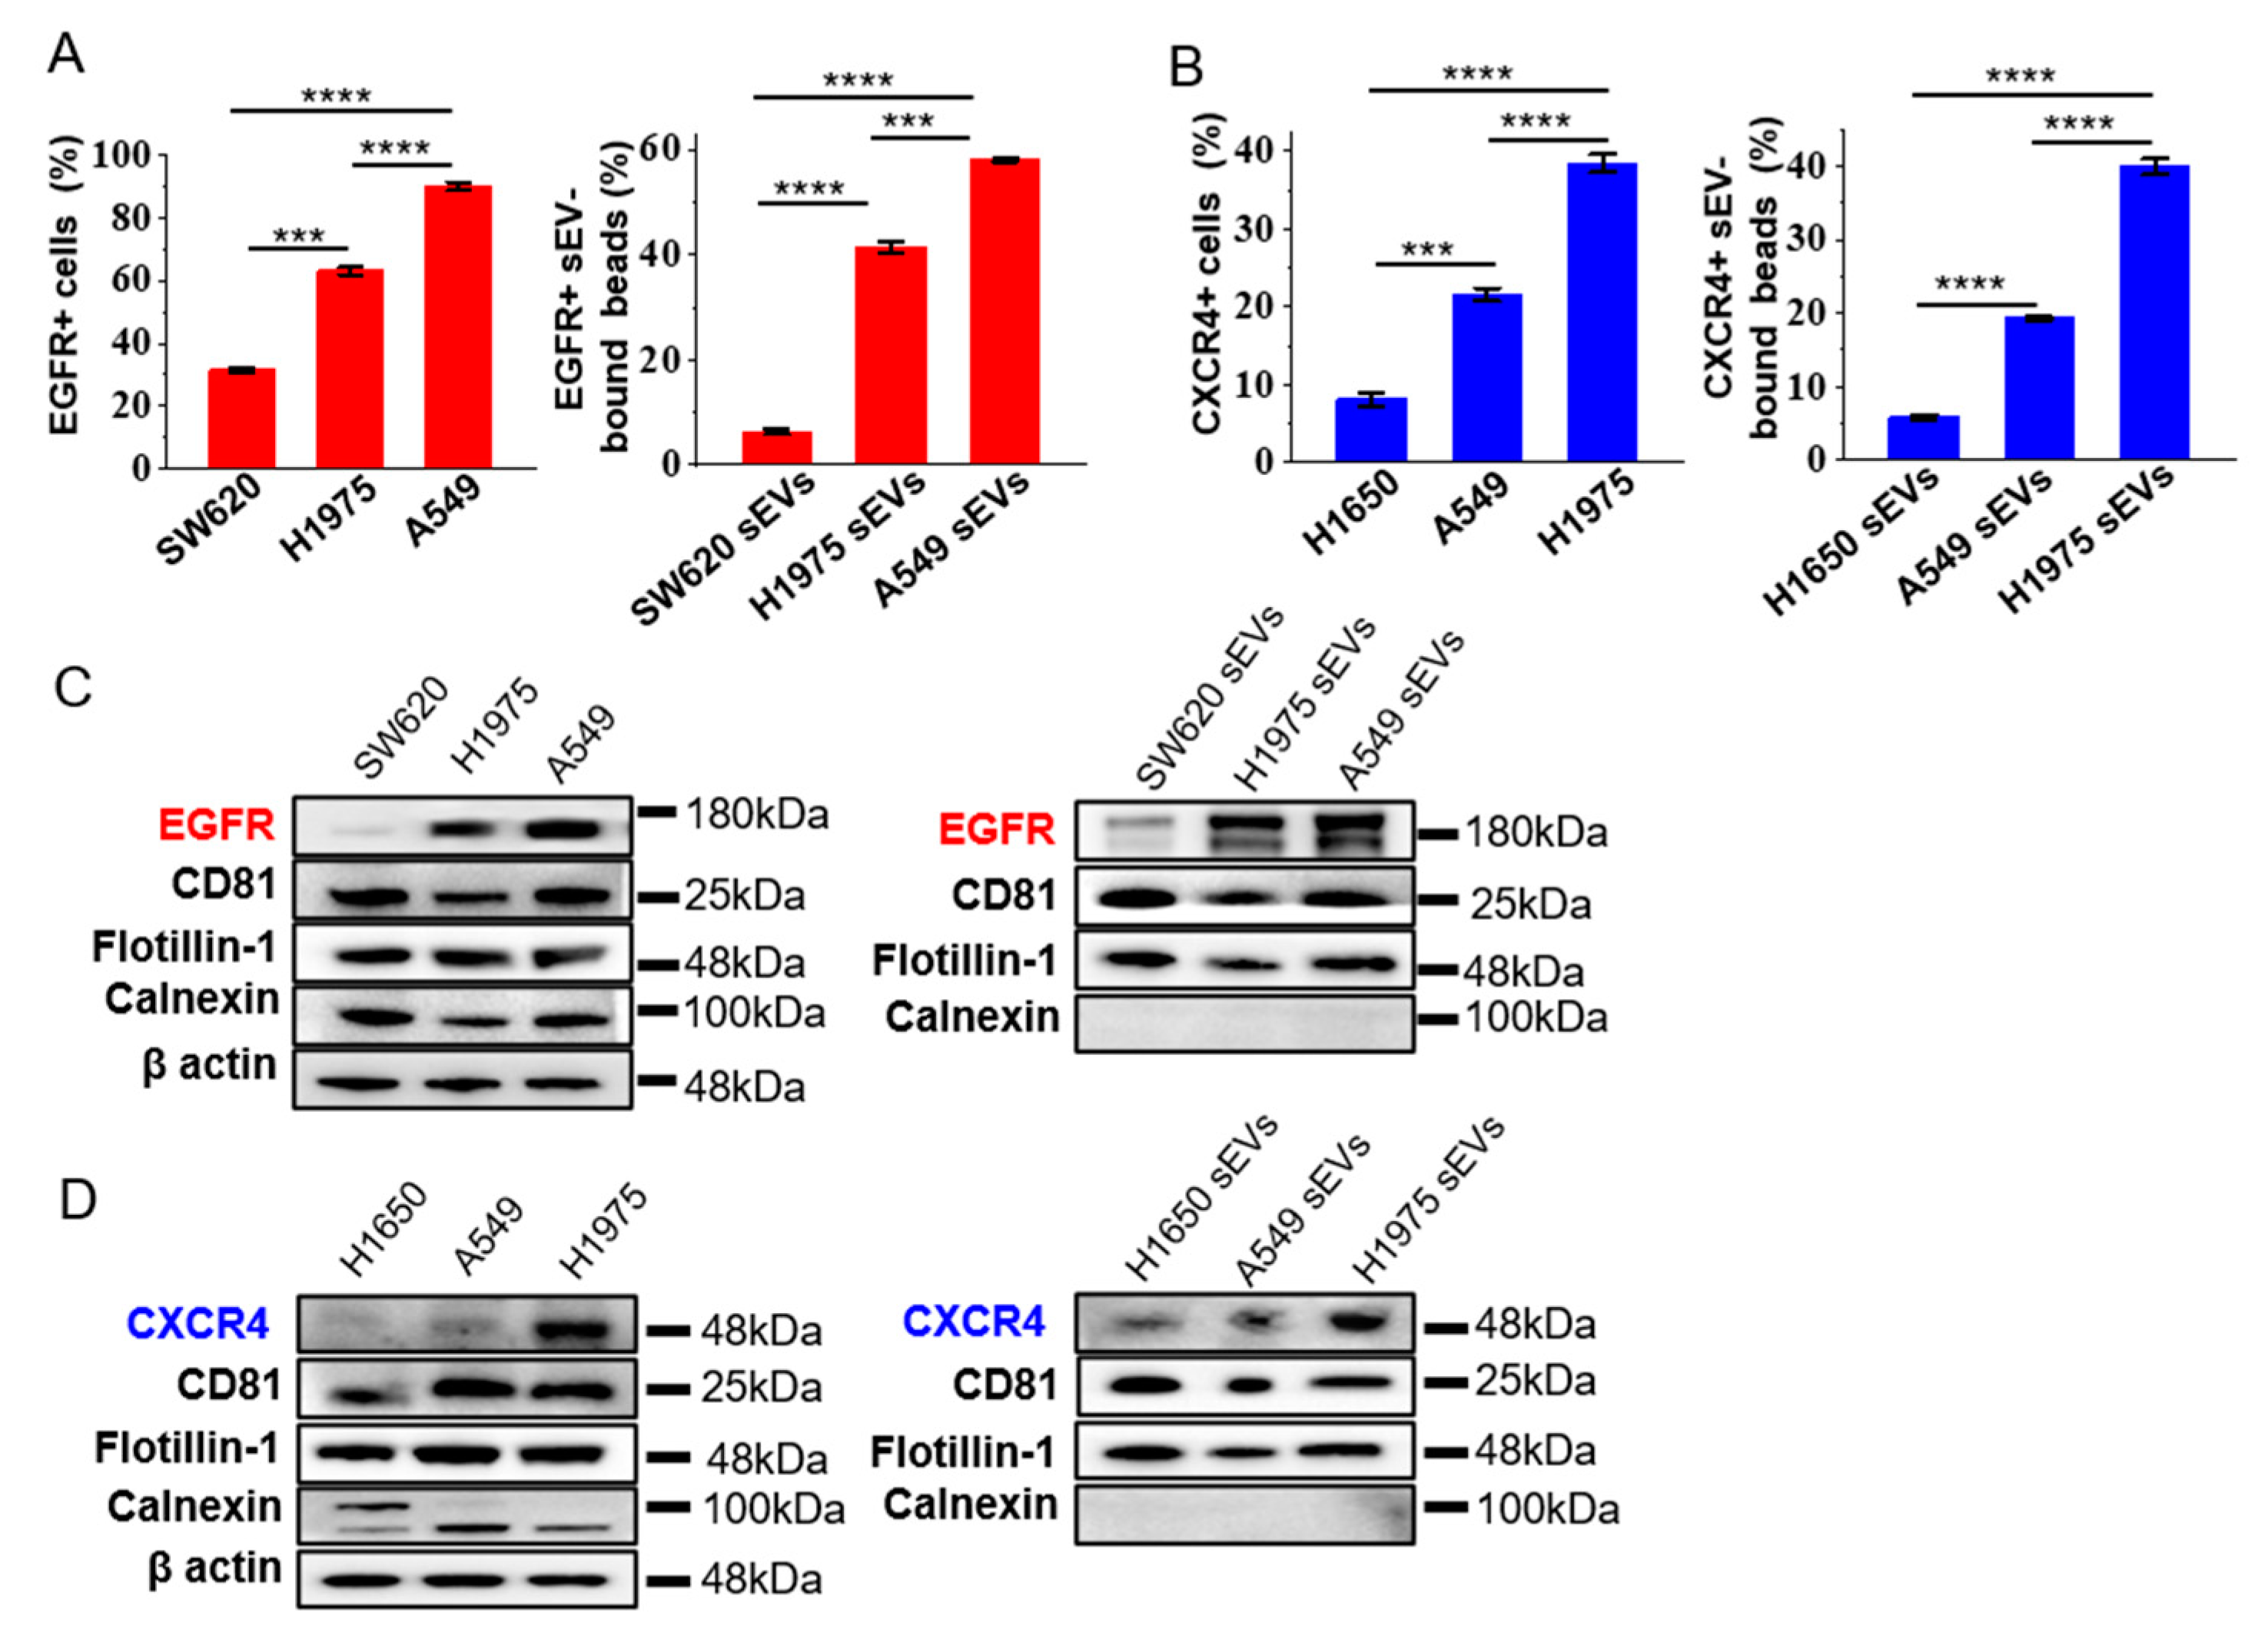
3.2. Expression of EGFR and CXCR4 in sEVs Represent the Ones in the Cells of Origin
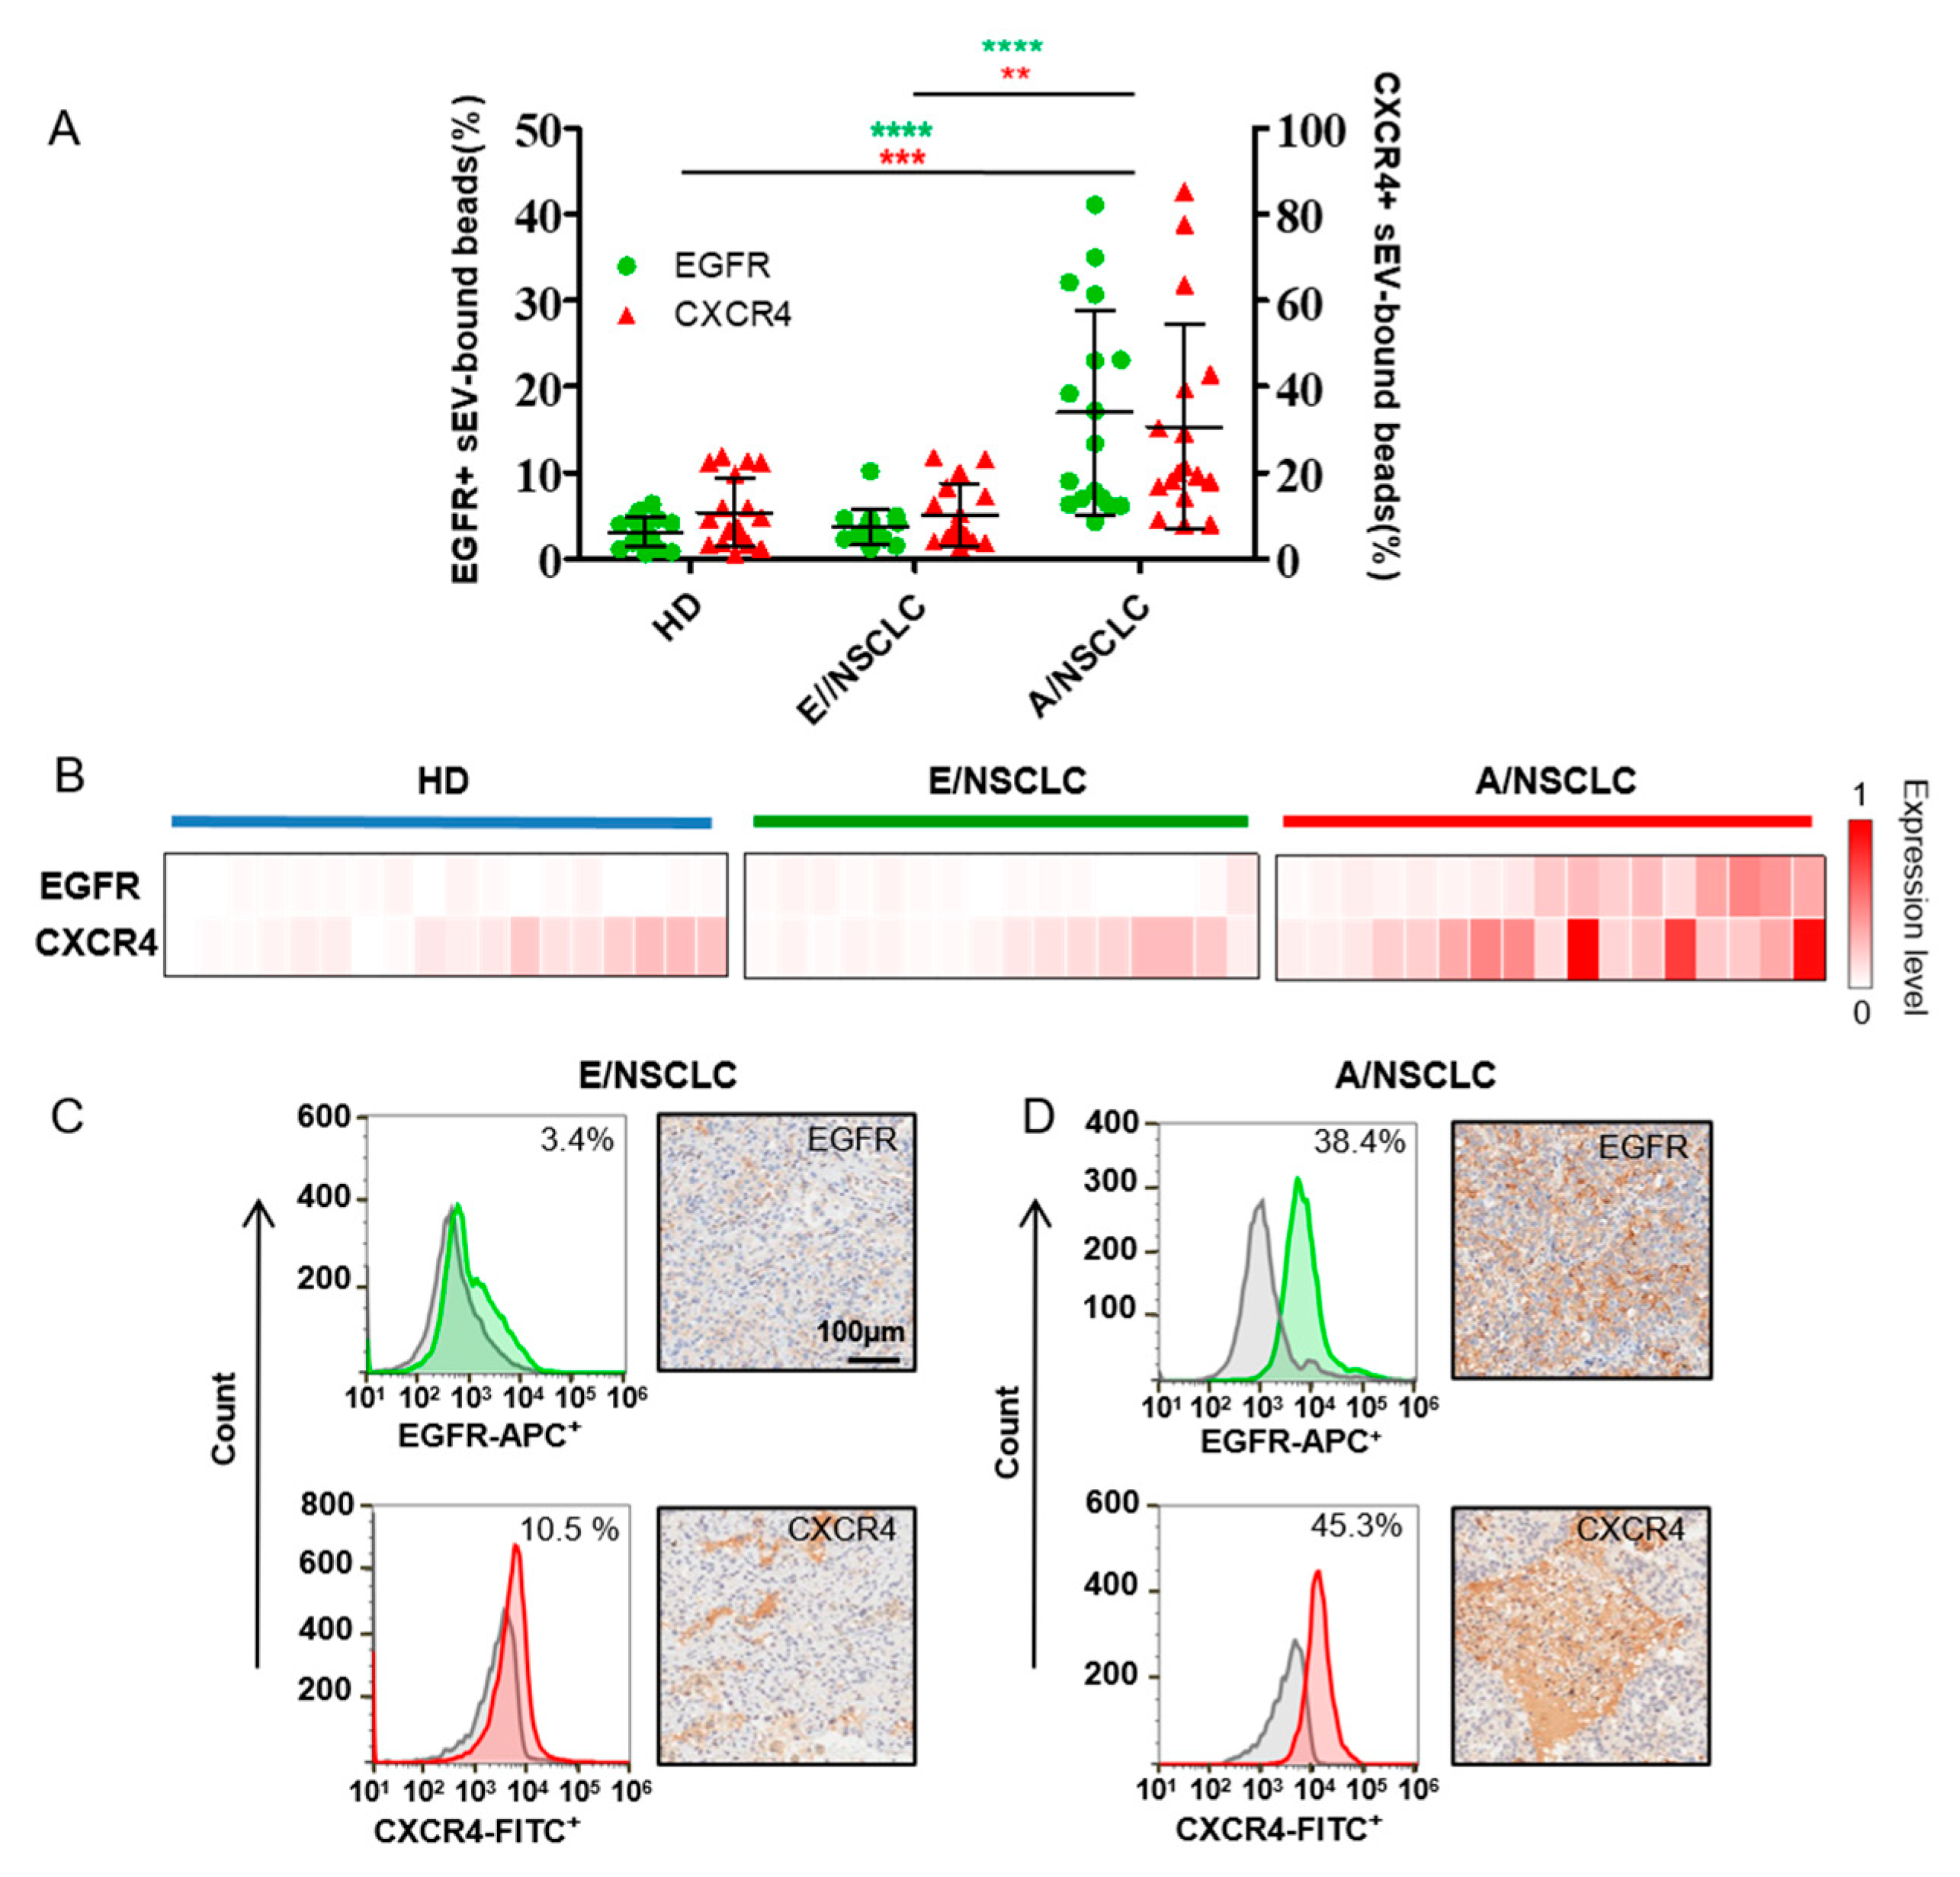
3.3. EGFR and CXCR4 in Serum sEVs as Biomarkers for NSCLC Diagnosis and Staging
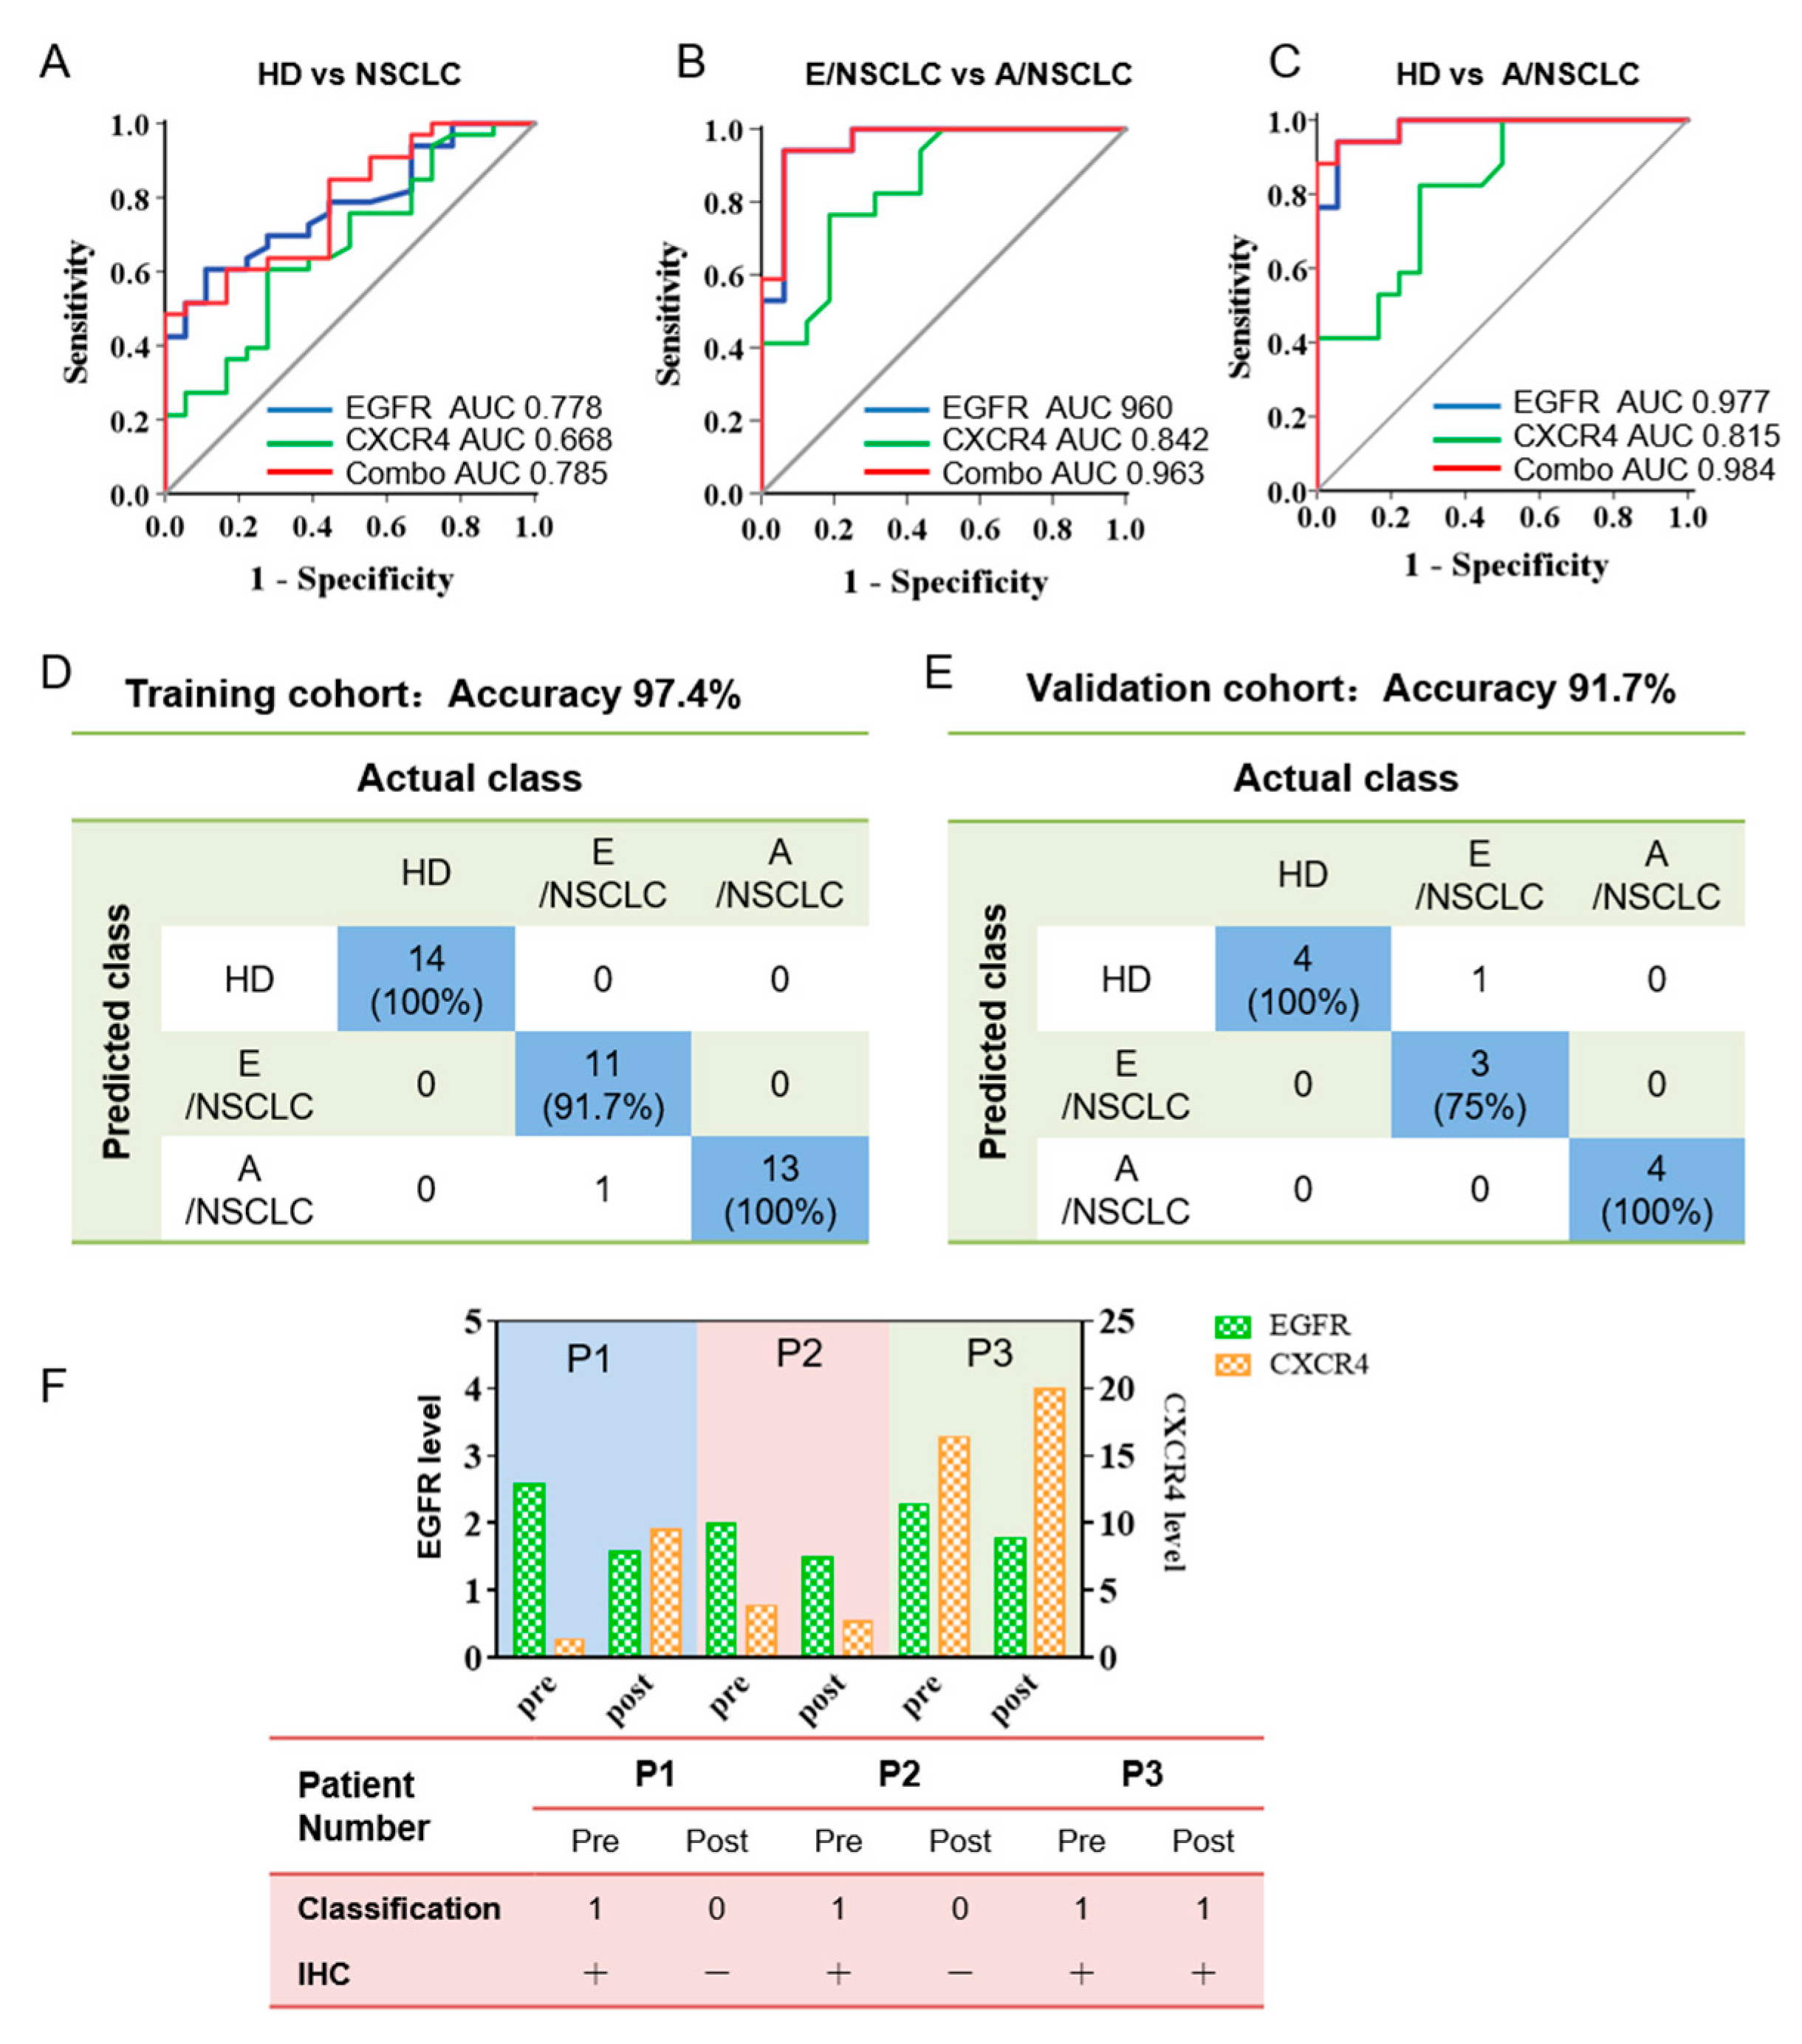
3.4. Bivariate Analysis and Machine Learning of EGFR and CXCR4 Expression on Sera sEVs Showing High Accuracy for the Diagnosis and Prognosis Prediction of NSCLC
4. Discussion
Supplementary Materials
Author Contributions
Funding
Institutional Review Board Statement
Informed Consent Statement
Data Availability Statement
Acknowledgments
Conflicts of Interest
References
- Jackman, D.M.; Miller, V.A.; Cioffredi, L.A.; Yeap, B.Y.; Janne, P.A.; Riely, G.J.; Ruiz, M.G.; Giaccone, G.; Sequist, L.V.; Johnson, B.E. Impact of epidermal growth factor receptor and KRAS mutations on clinical outcomes in previously untreated non-small cell lung cancer patients: Results of an online tumor registry of clinical trials. Clin. Cancer Res. 2009, 15, 5267–5273. [Google Scholar] [CrossRef] [Green Version]
- Bray, F.; Ferlay, J.; Soerjomataram, I.; Siegel, R.L.; Torre, L.A.; Jemal, A. Global cancer statistics 2018: GLOBOCAN estimates of incidence and mortality worldwide for 36 cancers in 185 countries. CA Cancer J. Clin. 2018, 68, 394–424. [Google Scholar] [CrossRef] [PubMed] [Green Version]
- Crowley, E.; Di Nicolantonio, F.; Loupakis, F.; Bardelli, A. Liquid biopsy: Monitoring cancer-genetics in the blood. Nat. Rev. Clin. Oncol. 2013, 10, 472–484. [Google Scholar] [CrossRef] [PubMed]
- Gerlinger, M.; Rowan, A.J.; Horswell, S.; Larkin, J.; Endesfelder, D.; Gronroos, E.; Martinez, P.; Matthews, N.; Stewart, A.; Tarpey, P.; et al. Intratumor Heterogeneity and Branched Evolution Revealed by Multiregion Sequencing. N. Engl. J. Med. 2012, 366, 883–892. [Google Scholar] [CrossRef] [Green Version]
- Aggarwal, C.; Thompson, J.C.; Black, T.A.; Katz, S.I.; Fan, R.; Yee, S.S.; Chien, A.L.; Evans, T.L.; Bauml, J.M.; Alley, E.W.; et al. Clinical Implications of Plasma-Based Genotyping with the Delivery of Personalized Therapy in Metastatic Non-Small Cell Lung Cancer. JAMA Oncol. 2019, 5, 173–180. [Google Scholar] [CrossRef]
- Thompson, J.C.; Yee, S.S.; Troxel, A.B.; Savitch, S.L.; Fan, R.; Balli, D.; Lieberman, D.B.; Morrissette, J.D.; Evans, T.L.; Bauml, J.; et al. Detection of Therapeutically Targetable Driver and Resistance Mutations in Lung Cancer Patients by Next-Generation Sequencing of Cell-Free Circulating Tumor DNA. Clin. Cancer Res. 2016, 22, 5772–5782. [Google Scholar] [CrossRef] [PubMed] [Green Version]
- Yu, W.; Hurley, J.; Roberts, D.; Chakrabortty, S.K.; Enderle, D.; Noerholm, M.; Breakefield, X.O.; Skog, J.K. Exosome-based liquid biopsies in cancer: Opportunities and challenges. Ann. Oncol. 2021, 32, 466–477. [Google Scholar] [CrossRef]
- Colombo, M.; Raposo, G.; Théry, C. Biogenesis, Secretion, and Intercellular Interactions of Exosomes and Other Extracellular Vesicles. Annu. Rev. Cell Dev. Biol. 2014, 30, 255–289. [Google Scholar] [CrossRef]
- Valadi, H.; Ekstrom, K.; Bossios, A.; Sjostrand, M.; Lee, J.J.; Lotvall, J.O. Exosome-mediated transfer of mRNAs and microRNAs is a novel mechanism of genetic exchange between cells. Nat. Cell Biol. 2007, 9, 654–659. [Google Scholar] [CrossRef] [Green Version]
- Zhang, H.; Deng, T.; Liu, R.; Bai, M.; Zhou, L.; Wang, X.; Li, S.; Wang, X.; Yang, H.; Li, J.; et al. Exosome-delivered EGFR regulates liver microenvironment to promote gastric cancer liver metastasis. Nat. Commun. 2017, 8, 15016. [Google Scholar] [CrossRef] [Green Version]
- Plebanek, M.P.; Angeloni, N.L.; Vinokour, E.; Li, J.; Henkin, A.; Martinez-Marin, D.; Filleur, S.; Bhowmick, R.; Henkin, J.; Miller, S.D.; et al. Pre-metastatic cancer exosomes induce immune surveillance by patrolling monocytes at the metastatic niche. Nat. Commun. 2017, 8, 1319. [Google Scholar] [CrossRef] [PubMed]
- Jorissen, R.N.; Walker, F.; Pouliot, N.; Garrett, T.P.J.; Ward, C.W.; Burgess, A.W. Epidermal growth factor receptor: Mechanisms of activation and signalling. Exp. Cell Res. 2003, 284, 31–53. [Google Scholar] [CrossRef]
- Lynch, T.J.; Bell, D.W.; Sordella, R.; Gurubhagavatula, S.; Okimoto, R.A.; Brannigan, B.W.; Harris, P.L.; Haserlat, S.M.; Supko, J.G.; Haluska, F.G.; et al. Activating mutations in the epidermal growth factor receptor underlying responsiveness of non-small-cell lung cancer to gefitinib. N. Engl. J. Med. 2004, 350, 2129–2139. [Google Scholar] [CrossRef]
- Pao, W.; Miller, V.; Zakowski, M.; Doherty, J.; Politi, K.; Sarkaria, I.; Singh, B.; Heelan, R.; Rusch, V.; Fulton, L.; et al. EGF receptor gene mutations are common in lung cancers from “never smokers” and are associated with sensitivity of tumors to gefitinib and erlotinib. Proc. Natl. Acad. Sci. USA 2004, 101, 13306–13311. [Google Scholar] [CrossRef] [PubMed] [Green Version]
- Kucia, M.; Reca, R.; Miekus, K.; Wanzeck, J.; Wojakowski, W.; Janowska-Wieczorek, A.; Ratajczak, J.; Ratajczak, M.Z. Trafficking of Normal Stem Cells and Metastasis of Cancer Stem Cells Involve Similar Mechanisms: Pivotal Role of the SDF-1-CXCR4 Axis. Stem Cells 2005, 23, 879–894. [Google Scholar] [CrossRef]
- Burger, J.A.; Kipps, T.J. CXCR4: A key receptor in the crosstalk between tumor cells and their microenvironment. Blood 2006, 107, 1761–1767. [Google Scholar] [CrossRef]
- Gangadhar, T.; Nandi, S.; Salgia, R. The role of chemokine receptor CXCR4 in lung cancer. Cancer Biol. Ther. 2010, 9, 409–416. [Google Scholar] [CrossRef] [PubMed]
- Li, W.; Shao, B.; Liu, C.; Wang, H.; Zheng, W.; Kong, W.; Liu, X.; Xu, G.; Wang, C.; Li, H.; et al. Noninvasive Diagnosis and Molecular Phenotyping of Breast Cancer through Microbead-Assisted Flow Cytometry Detection of Tumor-Derived Extracellular Vesicles. Small Methods 2018, 2, 1800122. [Google Scholar] [CrossRef]
- Melo, S.A.; Luecke, L.B.; Kahlert, C.; Fernandez, A.F.; Gammon, S.T.; Kaye, J.; LeBleu, V.S.; Mittendorf, E.A.; Weitz, J.; Rahbari, N.; et al. Glypican-1 identifies cancer exosomes and detects early pancreatic cancer. Nature 2015, 523, 177–182. [Google Scholar] [CrossRef] [Green Version]
- Théry, C.; Amigorena, S.; Raposo, G.; Clayton, A. Isolation and characterization of exosomes from cell culture supernatants and biological fluids. Curr. Protoc. Cell Biol. 2006, 30, 3.22.21–23.22.29. [Google Scholar] [CrossRef]
- Keller, S.; Rupp, C.; Stoeck, A.; Runz, S.; Fogel, M.; Lugert, S.; Hager, H.D.; Abdel-Bakky, M.S.; Gutwein, P.; Altevogt, P. CD24 is a marker of exosomes secreted into urine and amniotic fluid. Kidney Int. 2007, 72, 1095–1102. [Google Scholar] [CrossRef] [PubMed] [Green Version]
- Keller, S.; Ridinger, J.; Rupp, A.-K.; Janssen, J.W.G.; Altevogt, P. Body fluid derived exosomes as a novel template for clinical diagnostics. J. Transl. Med. 2011, 9, 86. [Google Scholar] [CrossRef] [PubMed] [Green Version]
- Yoshimoto, M.; Hirata, M.; Kanai, Y.; Naka, S.; Nishii, R.; Kagawa, S.; Kawai, K.; Ohmomo, Y. Monitoring of Gefitinib Sensitivity with Radioiodinated PHY Based on EGFR Expression. Biol. Pharm. Bull. 2014, 37, 355–360. [Google Scholar] [CrossRef] [PubMed] [Green Version]
- Yun, M.; Kim, D.Y.; Lee, J.J.; Kim, H.S.; Kim, H.S.; Pyo, A.; Ryu, Y.; Kim, T.Y.; Zheng, J.H.; Yoo, S.W.; et al. A High-Affinity Repebody for Molecular Imaging of EGFR-Expressing Malignant Tumors. Theranostics 2017, 7, 2620–2633. [Google Scholar] [CrossRef] [PubMed] [Green Version]
- Thery, C.; Zitvogel, L.; Amigorena, S. Exosomes: Composition, biogenesis and function. Nat. Rev. Immunol. 2002, 2, 569–579. [Google Scholar] [CrossRef]
- Sitar, S.; Kejzar, A.; Pahovnik, D.; Kogej, K.; Tusek-Znidaric, M.; Lenassi, M.; Zagar, E. Size Characterization and Quantification of Exosomes by Asymmetrical-Flow Field-Flow Fractionation. Anal. Chem. 2015, 87, 9225–9233. [Google Scholar] [CrossRef] [PubMed]
- Théry, C.; Witwer, K.W.; Aikawa, E.; Alcaraz, M.J.; Anderson, J.D.; Andriantsitohaina, R.; Antoniou, A.; Arab, T.; Archer, F.; Atkin-Smith, G.K.; et al. Minimal information for studies of extracellular vesicles 2018 (MISEV2018): A position statement of the International Society for Extracellular Vesicles and update of the MISEV2014 guidelines. J. Extracell. Vesicles 2018, 7, 1535750. [Google Scholar] [CrossRef] [Green Version]
- Oken, M.M.; Creech, R.H.; Tormey, D.C.; Horton, J.; Davis, T.E.; McFadden, E.T.; Carbone, P.P. Toxicity and response criteria of the Eastern Cooperative Oncology Group. Am. J. Clin. Oncol. 1982, 5, 649–656. [Google Scholar] [CrossRef] [Green Version]


Publisher’s Note: MDPI stays neutral with regard to jurisdictional claims in published maps and institutional affiliations. |
© 2022 by the authors. Licensee MDPI, Basel, Switzerland. This article is an open access article distributed under the terms and conditions of the Creative Commons Attribution (CC BY) license (https://creativecommons.org/licenses/by/4.0/).
Share and Cite
Li, W.; Zhu, L.; Li, K.; Ye, S.; Wang, H.; Wang, Y.; Xue, J.; Wang, C.; Li, S.; Liang, N.; et al. Machine Learning-Assisted Dual-Marker Detection in Serum Small Extracellular Vesicles for the Diagnosis and Prognosis Prediction of Non-Small Cell Lung Cancer. Nanomaterials 2022, 12, 809. https://doi.org/10.3390/nano12050809
Li W, Zhu L, Li K, Ye S, Wang H, Wang Y, Xue J, Wang C, Li S, Liang N, et al. Machine Learning-Assisted Dual-Marker Detection in Serum Small Extracellular Vesicles for the Diagnosis and Prognosis Prediction of Non-Small Cell Lung Cancer. Nanomaterials. 2022; 12(5):809. https://doi.org/10.3390/nano12050809
Chicago/Turabian StyleLi, Wenzhe, Ling Zhu, Kaidi Li, Siyuan Ye, Huayi Wang, Yadong Wang, Jianchao Xue, Chen Wang, Shanqing Li, Naixin Liang, and et al. 2022. "Machine Learning-Assisted Dual-Marker Detection in Serum Small Extracellular Vesicles for the Diagnosis and Prognosis Prediction of Non-Small Cell Lung Cancer" Nanomaterials 12, no. 5: 809. https://doi.org/10.3390/nano12050809