2.1. Characterization and Identification of HPN
HPN was obtained as a yellowish powder. The electron ionization mass spectroscopy (EIMS) spectrum showed the tribrominated molecular ion peak cluster at m/z 544/542/540/538 (1:3:3:1). The molecular formula was determined as C17H16Br3O5 by HREIMS at m/z 536.8525 (calcd for C17H16Br3O5 536.8548). The 1H NMR spectrum revealed the presence of four phenol hydroxyl protons (δ 9.72, δ 9.69, δ 9.26, δ 9.11), two phenyl ring protons (δ 6.88, δ 6.05), two methylene protons (δ 4.15, δ 3.98) and the isopropyl group (δ 3.51, δ 1.02). The 13C NMR spectrum showed the signals representing twelve phenyl ring carbons (δ 144.9–113.0), one methine carbon (δ 79.1, δ 67.6, δ 38.3) and two methyl carbons (δ 21.7). Detailed spectrum data are: 1H-NMR (500 MHz, DMSO-d6) δ: 9.72 (s, 1H, OH), 9.69 (s, 1H, OH), 9.26 (s, 1H, OH), 9.11 (s, 1H, OH), 6.88 (s, 1H), 6.05 (s, 1H), 4.15 (s, 2H), 3.98 (s, 2H), 3.51 (m, J = 6.43 Hz, 2H), 1.02 (d, J = 6.43 Hz, 6H); 13C-NMR (125 MHz, DMSO-d6) δ: 144.9 (C), 144.3 (C), 142.5 (C), 142.4 (C) 130.5 (C), 129.3 (C), 127.5 (C), 115.4 (CH), 114.5 (C), 114.3 (C), 113.9 (CH), 112.9 (C), 79.1 (CH), 67.6 (CH2) 38.3 (CH2), 21.7 (2 × CH3). EIMS m/z (% relative intensity): 544/542/540/538 [M]+ (1/3/3/1), 484/482/480/478 (2/7/7/2), 467/465/463/461 (2/6/6/2), 403/401/399 (5/10/5), 322/320 (10/9), 82/80 (98/100), 59 (30). HRMS m/z calcd for C17H16O5Br3 [M − H]−, 536.8548; found, 536.8525.
2.2. Enzyme-Based Inhibitory Activities Assays in Vitro
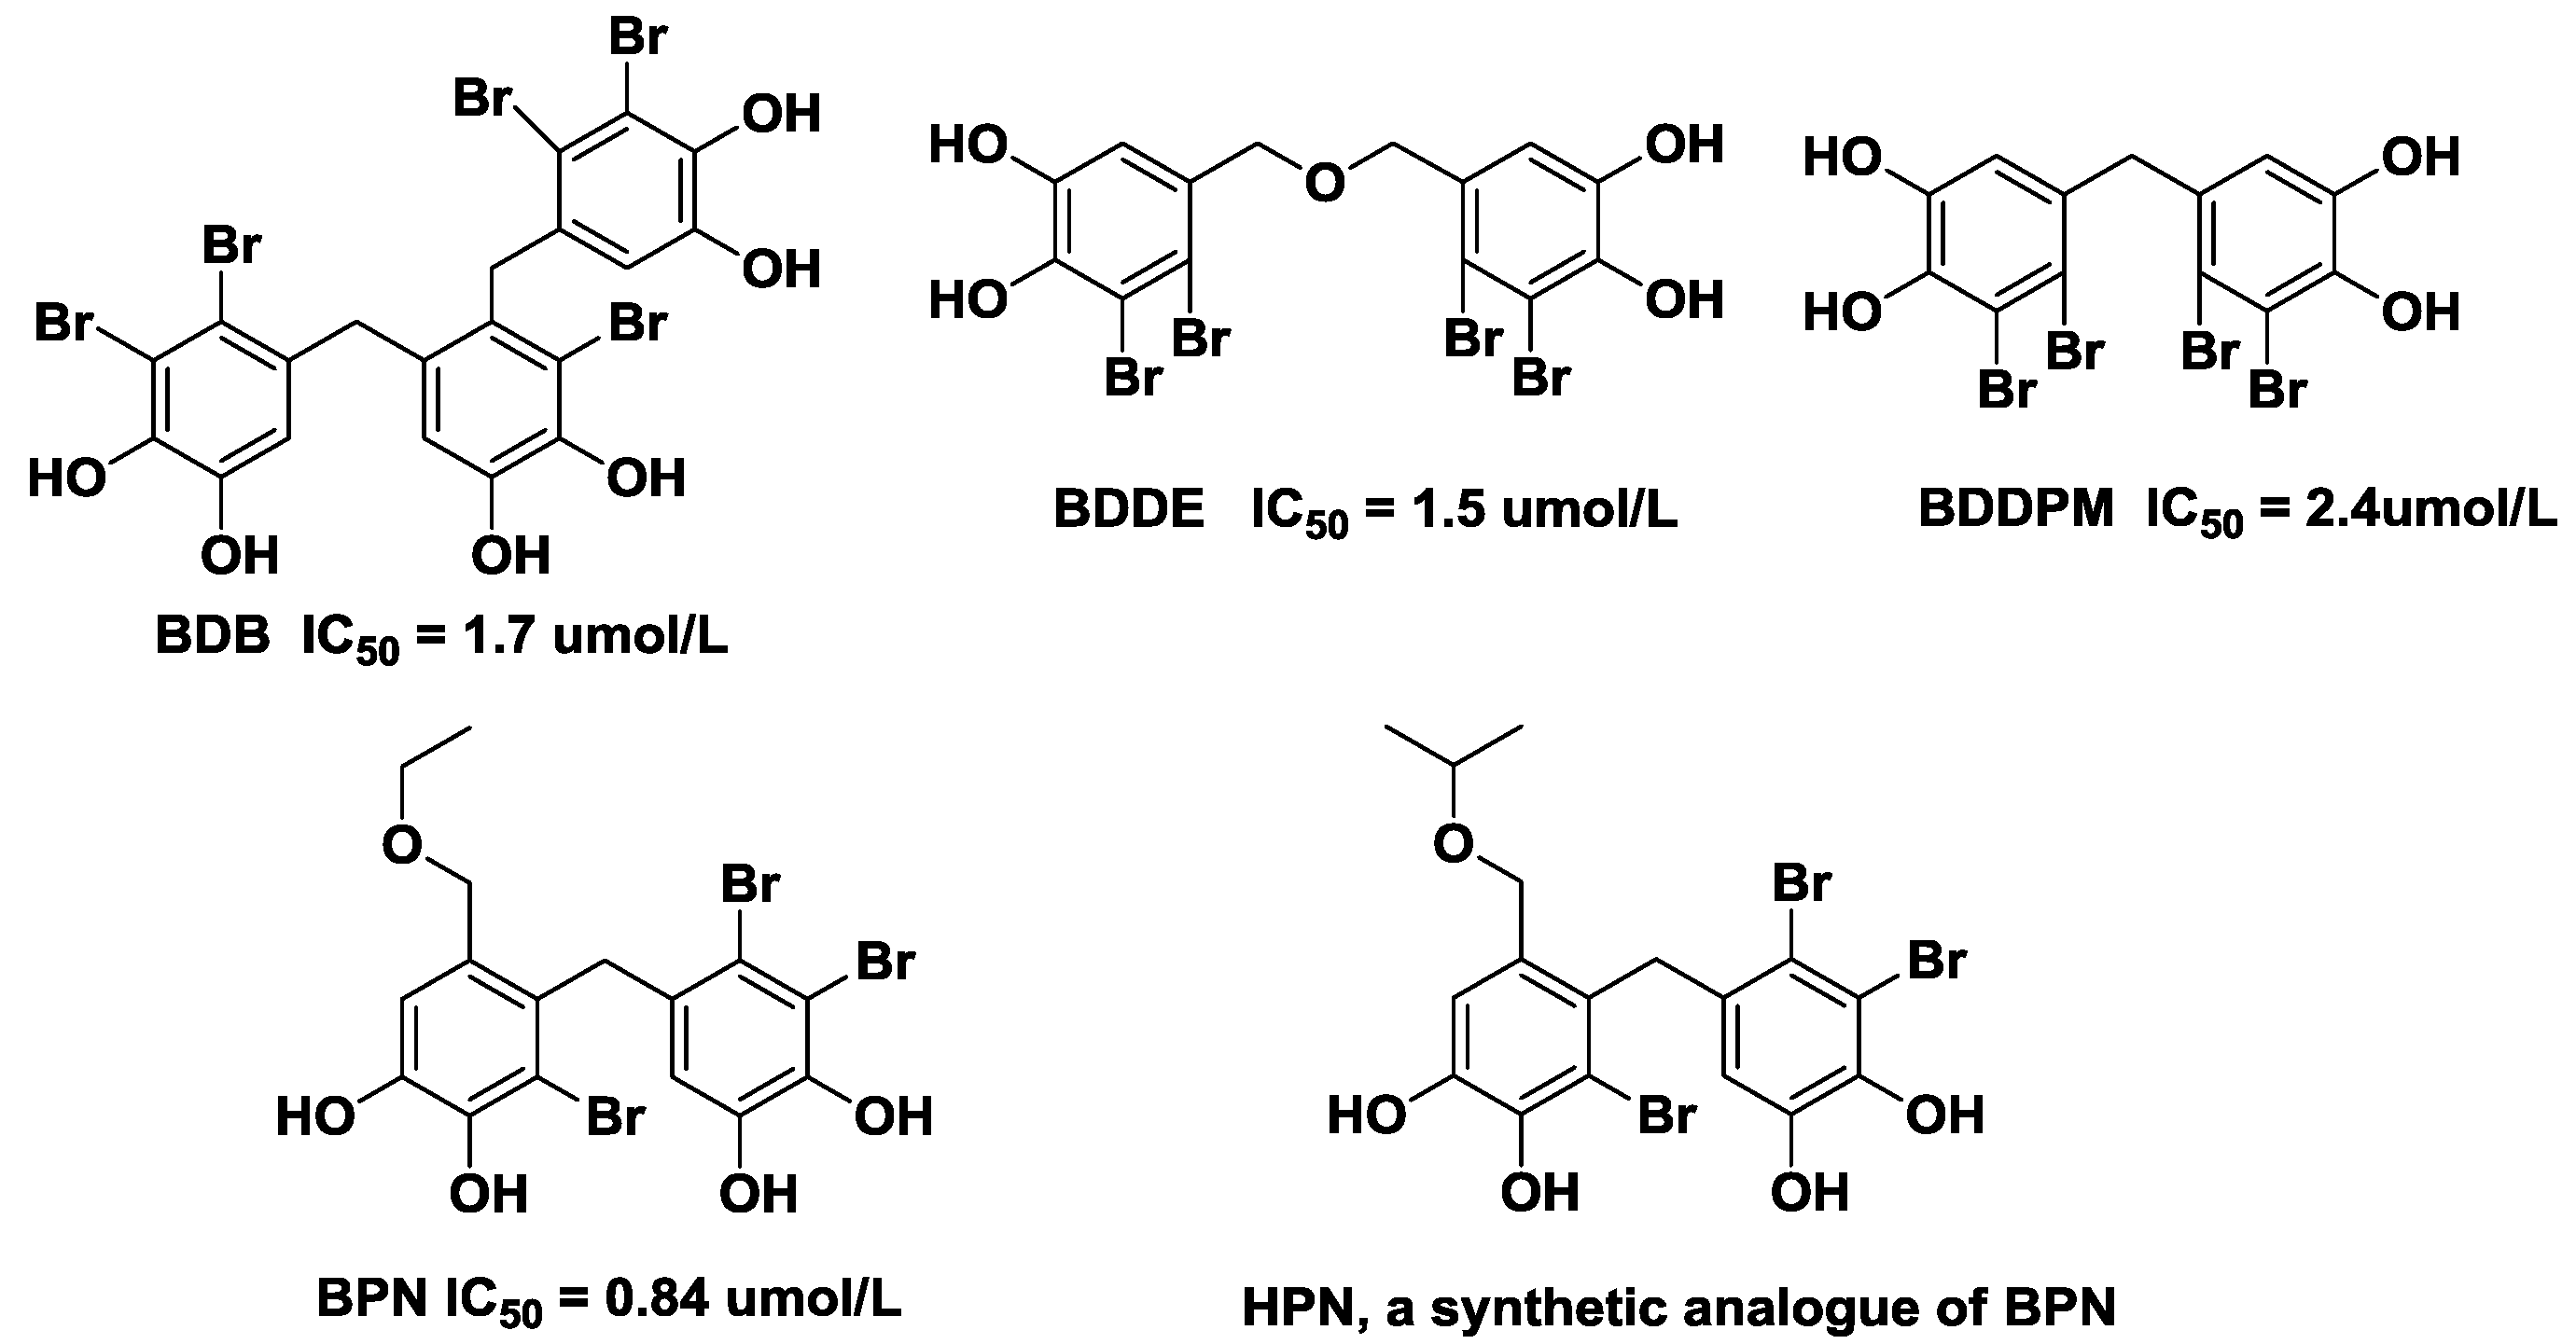
We firstly evaluated the inhibition of HPN against recombinant PTP1B in vitro. HPN exhibited remarkable inhibitory activity against PTP1B with IC50 0.63 μmol/L, which was more potent than BPN (IC50 = 0.84 μmol/L). Selectivity is one of the major issues for the development of PTP1B inhibitors as drugs, hence, we investigated the selectivity of HPN against other PTPs (TCPTP, LAR, SHP-1 and SHP-2), which share a high degree of structural conservation in the active site. We found that HPN demonstrated an excellent selectivity against TCPTP, LAR, SHP-1 and SHP-2 (>50-fold).
2.3. Effects of HPN on Body Weight, Food and Water Intake
The typical symptoms of diabetes are polydipsia, polyuria, and polyphagia, so we studied the effects on body weight, food and water intake after HPN administration for 8 weeks in
db/
db mice. Since no small molecule inhibitors of PTP1B are on the market, we selected rosiglitazone as the positive control, which is an effective antidiabetic drug and works as an insulin sensitizer. During the 8-week period, there were no significant changes in defecation and urination of mice treated with HPN and rosiglitazone, and no mortality occurred. As shown in
Table 1, the initial and final body weights of the
db/
db mice were significantly higher than those in
db/
dm mice. There was no significant difference in the food and water intake between the model and control groups. The body weights increased gradually during the treatment period. At the end of the study, the mice in the rosiglitazone treated group had a significantly higher body weight compared to the HPN treated groups. The mice in the HPN treated group exhibited greater body weight gain, however, the increase was less than that observed in the rosiglitazone treated group. In the low-dose treated group, the body weight was obviously lower than in the model group (
P < 0.05). HPN at different doses reduced the food and water intake in
db/
db mice, but the differences were not significant. The results indicated that HPN could reduce diabetes-related symptoms.
Table 1.
Effects of HPN on food and water intake, and body weight in db/db mice.
Table 1.
Effects of HPN on food and water intake, and body weight in db/db mice.
| Group | Body weight (g) a | Food intake (g/day) a | Water intake (mL/day) a |
|---|
| initial | final | initial | final | initial | final |
|---|
| Control | 17.7 ± 0.9 | 22.0 ± 2.5 | 3.42 ± 0.03 | 3.26 ± 0.40 | 3.46 ± 0.04 | 3.67 ± 0.19 |
| Model | 36.6 ± 2.1 ** | 53.7 ± 2.6 ** | 5.05 ± 0.03 | 7.67 ± 0.62 | 7.55 ± 0.17 | 13.12 ± 0.95 |
| HPN (40 mg/kg) | 35.9 ± 1.6 | 52.3 ± 3.1 | 4.88 ± 0.07 | 5.46 ± 0.89 | 7.89 ± 0.13 | 9.94 ± 0.41 |
| HPN (20 mg/kg) | 35.7 ± 1.8 | 50.5 ± 4.4 | 4.85 ± 0.02 | 6.54 ± 0.70 | 7.96 ± 0.34 | 12.00 ± 0.39 |
| HPN (10 mg/kg) | 35.7 ± 1.5 | 48.1 ± 3.0 # | 4.79 ± 0.08 | 6.65 ± 0.68 | 7.67 ± 0.04 | 12.92 ± 0.36 |
| Rosiglitazone (20 mg/kg) | 36.0 ± 3.1 | 54.8 ± 4.1 | 5.03 ± 0.06 | 7.09 ± 0.48 | 8.41 ± 0.49 | 11.72 ± 0.34 |
2.4. Effects of HPN on Blood Glucose
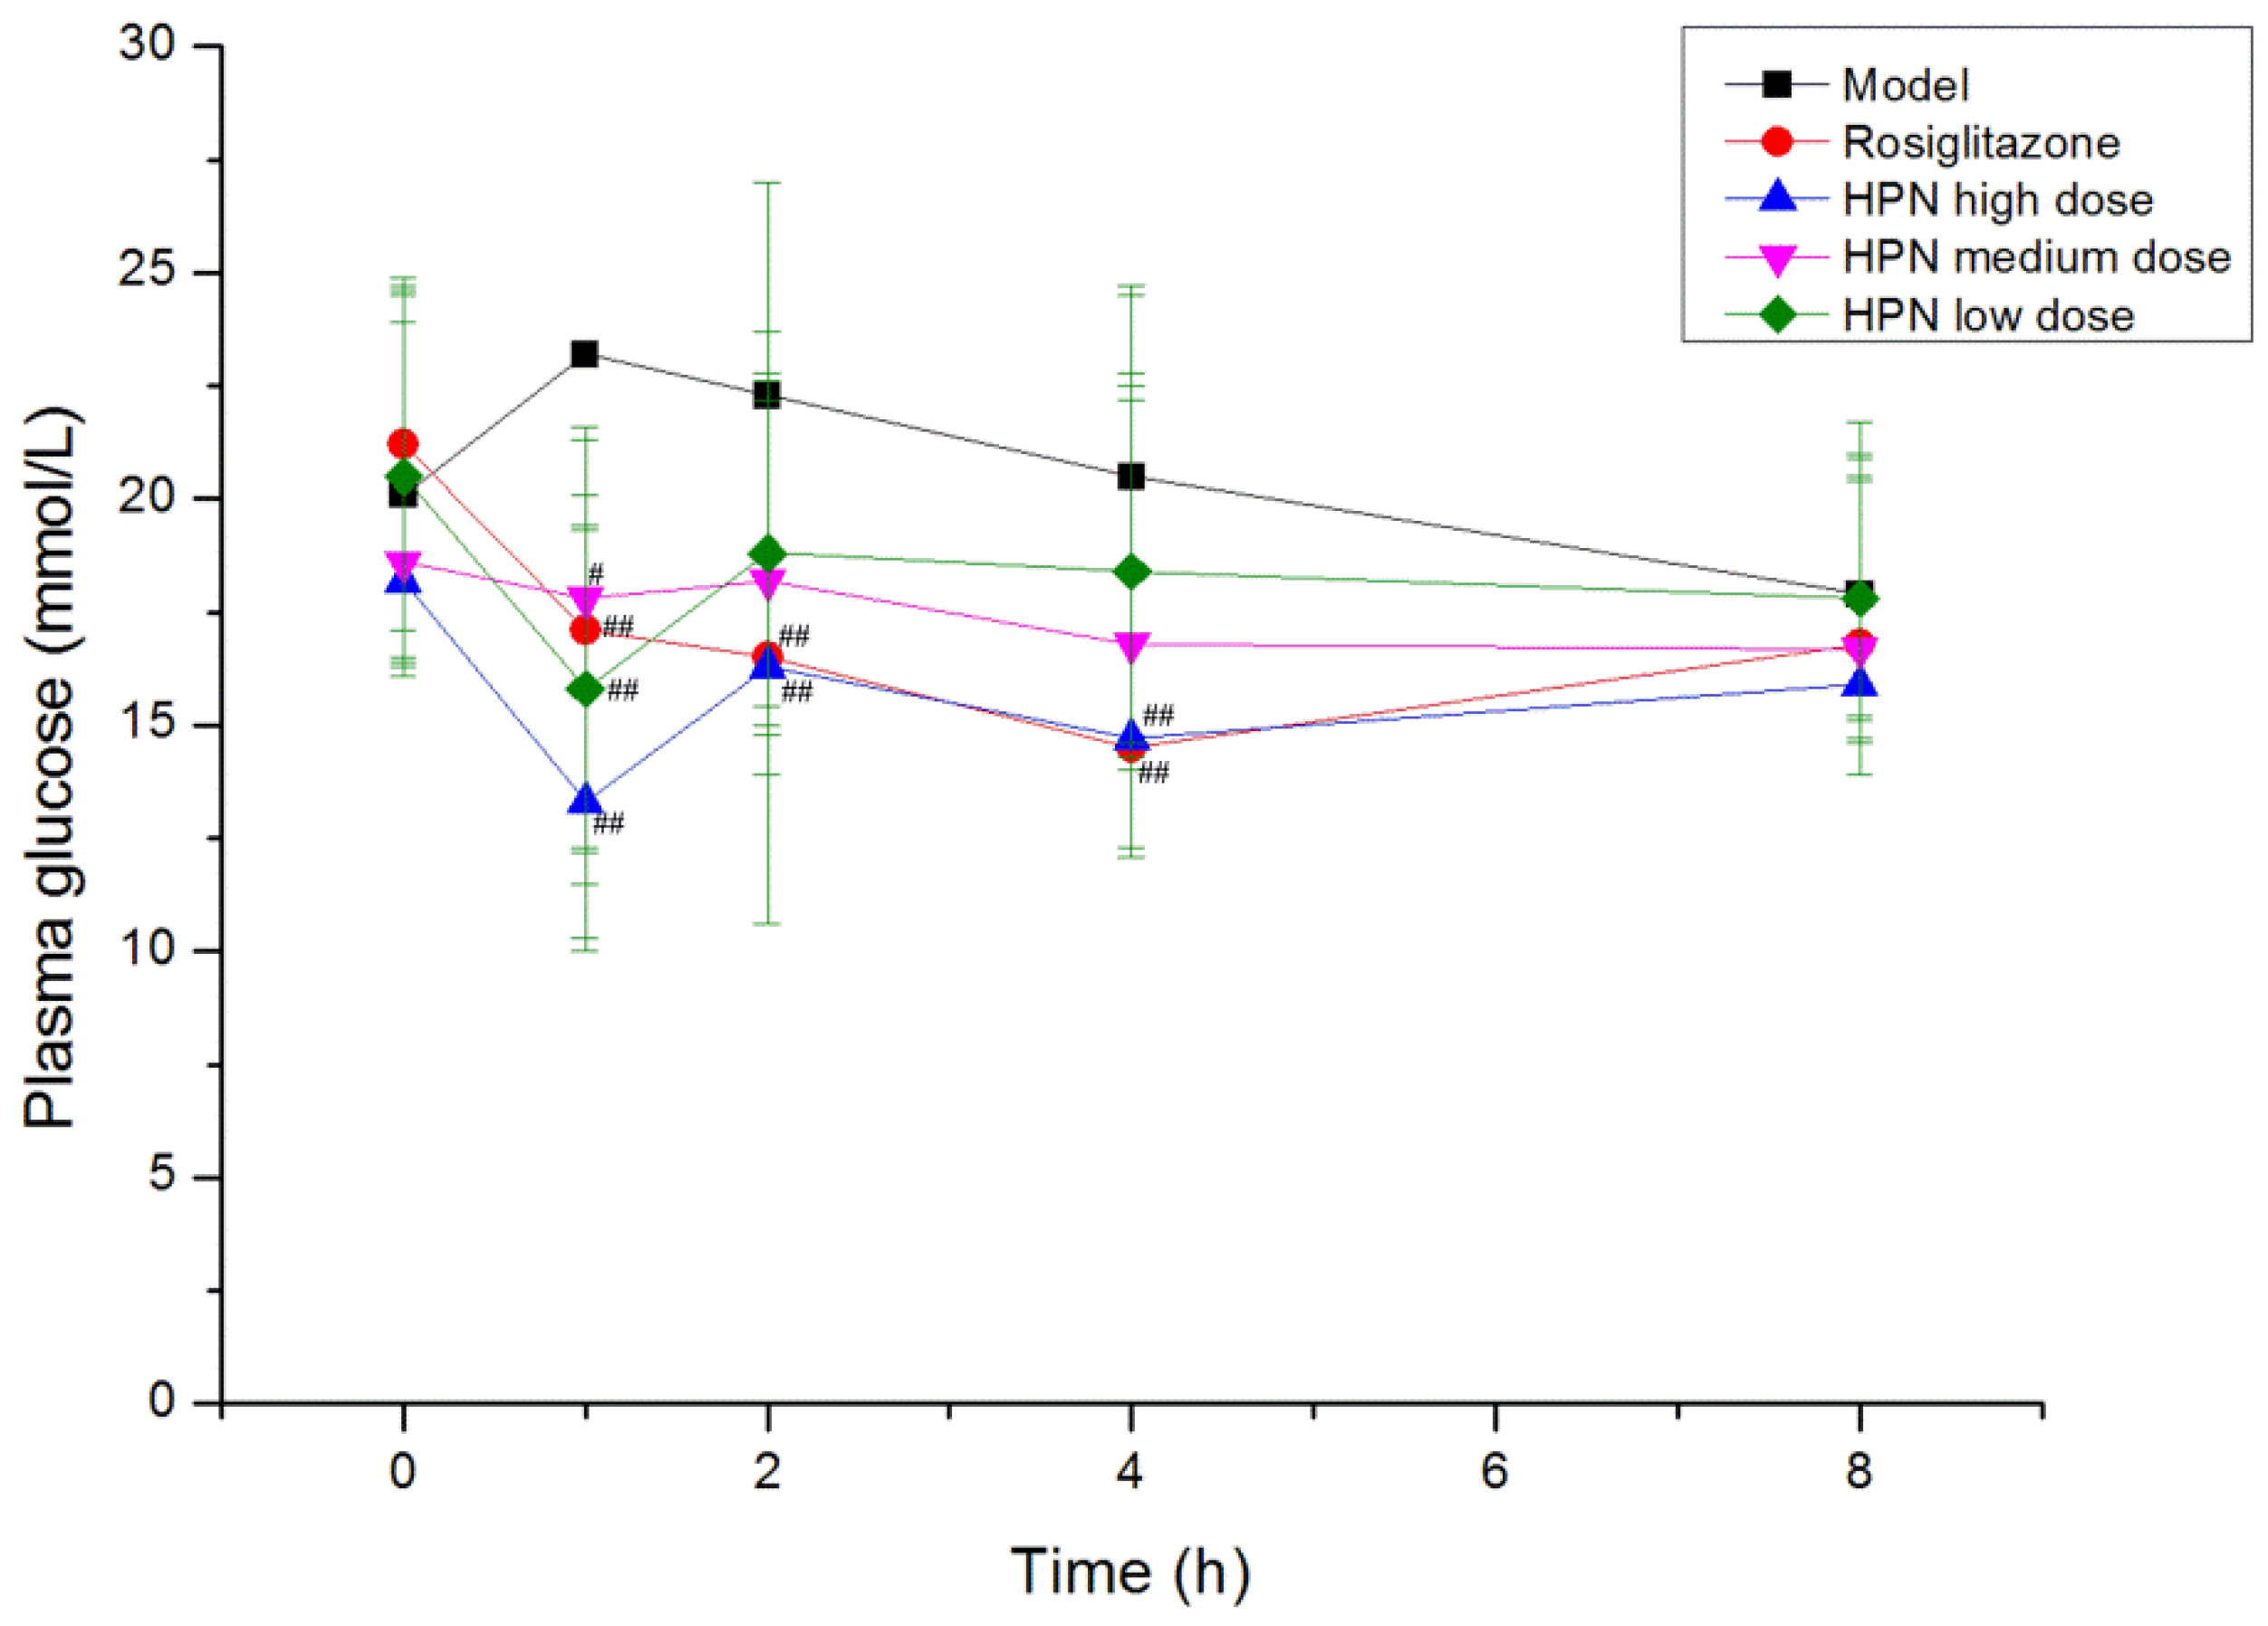
Hyperglycemia plays an important role in the development of Type 2 diabetes mellitus, therefore, the effective control of the blood glucose level is crucial for preventing diabetic complications and improving the quality of the life in diabetic patients. Firstly, we examined the time-effect relationship of the compound in a
db/
db mice model on the fifth day. As shown in
Figure 2, the high dose of HPN produced a remarkable reduction in plasma glucose at 1 h, 2 h and 4 h during the intervention period (
P < 0.01,
P < 0.05), and its greatest effect was 1 h after intragastric administration, lowering plasma glucose from 18.2 mmol/L to 13.3 mmol/L (
P < 0.01). At that time, a notable reduction was observed in the medium and low dose groups of HPN (
P < 0.01,
P < 0.05). There was no decline of effect in plasma glucose prolonged to 8 h and the plasma glucose maintained at 16 mmol/L. The antihyperglycemic activity results of HPN are illustrated in
Table 2, the positive control rosiglitazone decreased plasma glucose levels from 18.7 mmol/L to 15.5 mmol/L in the first week (
P < 0.05). Similarly, HPN at 40 mg/kg significantly decreased plasma glucose (
P < 0.01) and maintained the plasma glucose level at 15 mmol/L after an 8-week treatment period. In general, the high dose and medium dose of HPN were more effective in decreasing the blood glucose level compared to the low dose group of HPN.
Figure 2.
The time-effect relationship of HPN on the fifth day in db/db mice model. # P <0.05, ## P <0.01 vs. model.
Figure 2.
The time-effect relationship of HPN on the fifth day in db/db mice model. # P <0.05, ## P <0.01 vs. model.
Table 2.
Effects of HPN on blood glucose level in db/db mice.
Table 2.
Effects of HPN on blood glucose level in db/db mice.
| Group | Dose (mg/kg) | Plasma glucose (mmol/L) a |
|---|
| Baseline | 1 week | 4 weeks | 8 weeks |
|---|
| Control | | 6.0 ± 0.6 | 6.0 ± 0.4 | 6.1 ± 0.3 | 5.8 ± 0.4 |
| Model | | 18.9 ± 4.5 ** | 20.0 ± 3.6 ** | 20.2 ± 4.6 ** | 18.9 ± 4.1 ** |
| HPN | 40 | 19.8 ± 5.0 | 15.1 ± 3.6 ## | 14.7 ± 3.7 ## | 15.8 ± 2.4 # |
| 20 | 18.6 ± 4.5 | 16.6 ± 3.4 # | 15.4 ± 4.7 # | 15.5 ± 3.3 # |
| 10 | 19.4 ± 4.9 | 16.0 ± 3.7 # | 17.5 ± 3.9 | 16.5 ± 3.5 |
| Rosiglitazone | 20 | 18.7 ± 3.8 | 15.5 ± 4.0 # | 15.6 ± 3.1 # | 13.9 ± 2.9 ## |
2.7. Effects of HPN on Plasma Insulin Level
In general, the
db/
db mice exhibit an initial phase of hyperinsulinemia. In this study, the plasma insulin levels in
db/
db mice were significantly higher than in the control group at 4 weeks and 8 weeks (
P < 0.01). As shown in
Table 5, the rosiglitazone treated group had a significantly lower insulin level at 20 mg/kg (
P < 0.01). As for HPN treated group, the effects were less marked than for the rosiglitazone group. The insulin levels increased during the treatment period from 4 weeks to 8 weeks. Only the high dose of HPN markedly lowered plasma insulin levels compared to the model group (
P < 0.05).
Table 5.
Effects of HPN on plasma insulin level in db/db mice.
Table 5.
Effects of HPN on plasma insulin level in db/db mice.
| Group | Dose (mg/kg) | Insulin (ng/mL) a |
|---|
| 4 weeks | 8 weeks |
|---|
| Control | | 1.18 ± 0.37 | 1.36 ± 0.42 |
| Model | | 22.56 ± 6.61 ** | 27.94 ± 4.78 ** |
| | 40 | 15.30 ± 6.26 # | 20.80 ± 8.31 # |
| HPN | 20 | 15.94 ± 7.02 | 22.22 ± 6.10 # |
| | 10 | 15.55 ± 3.79 # | 23.40 ± 6.50 |
| Rosiglitazone | 20 | 10.60 ± 3.71 ## | 10.80 ± 3.43 ## |
2.9. Intraperitoneal Glucose Tolerance Test in Sprague–Dawley Rats
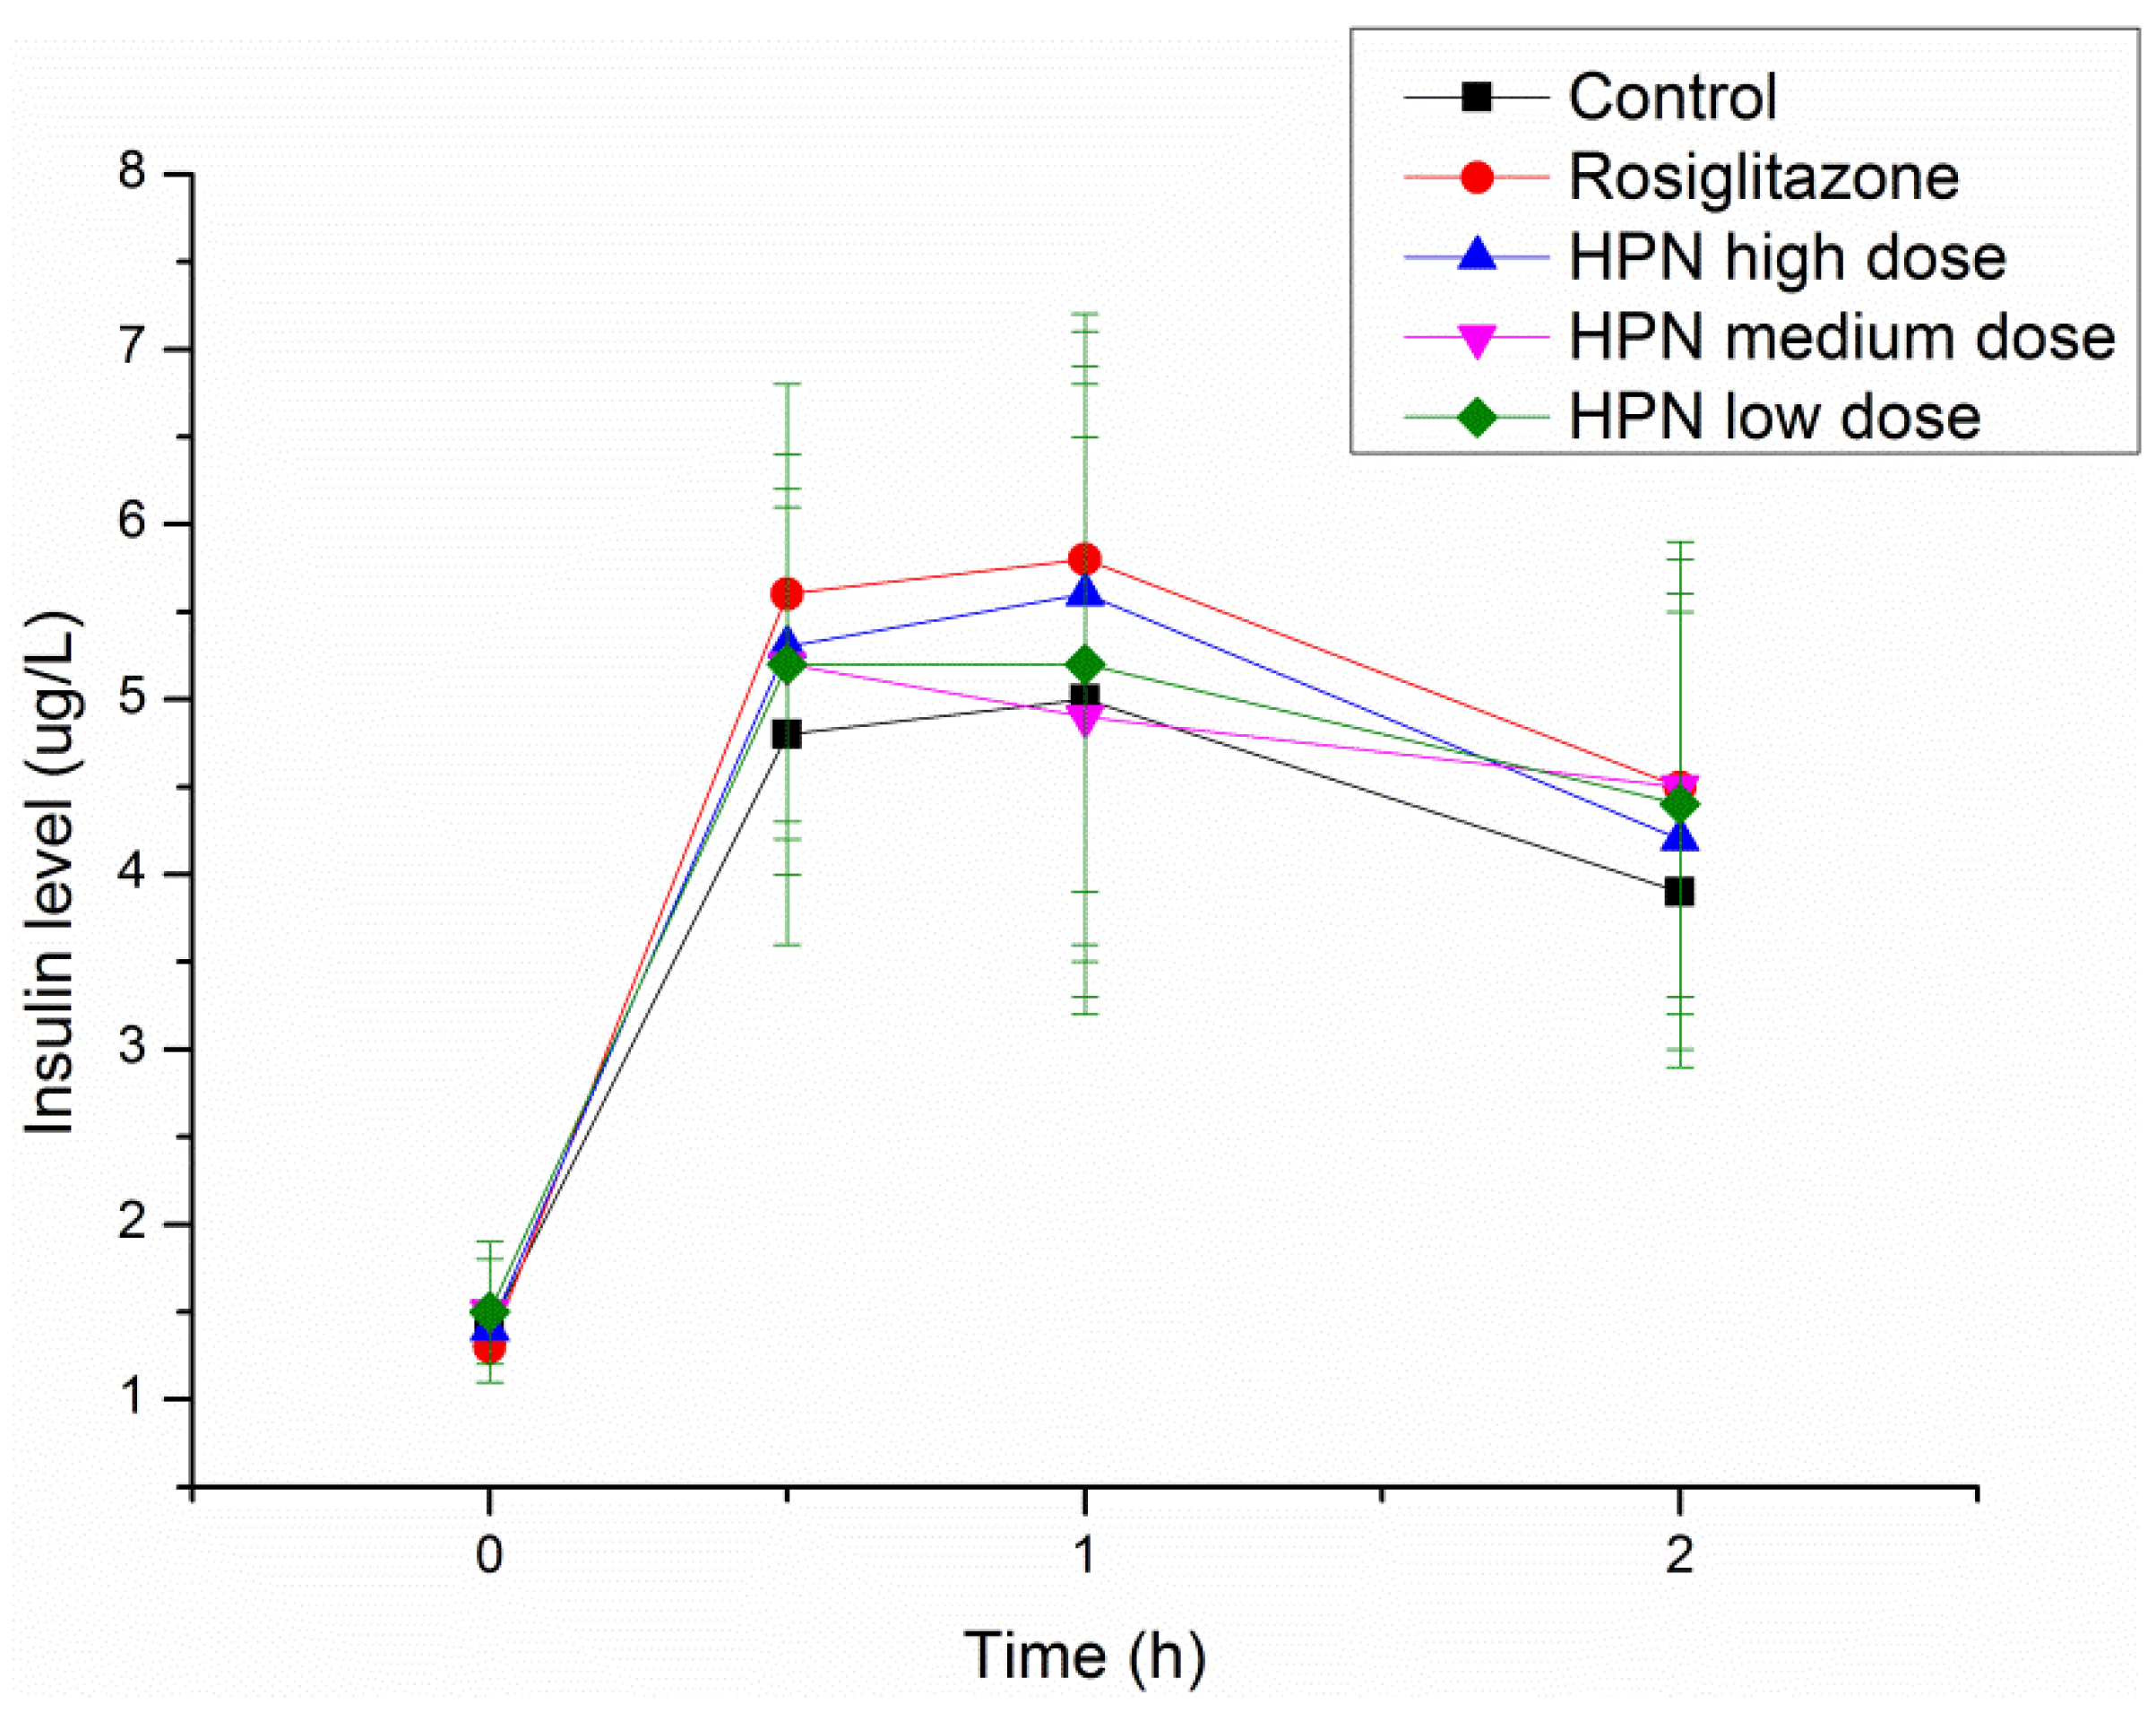
An intraperitoneal glucose tolerance test (IPGTT) in Sprague–Dawley (SD) rats was performed to investigate the effects of HPN on glucose tolerance during the treatment period and explore the possible mechanism of antihyperglycemic activity of HPN. As illustrated in
Table 6, there are no differences of plasma glucose levels among the control, rosiglitazone and HPN groups prior to glucose load. After glucose administration, the plasma glucose levels significantly elevated at 0.5 and 1 h (from 4 mmol/L to 10.7 mmol/L) and decreased to 7.3 mmol/L at 2 h. Similar trends were observed in the rosiglitazone and HPN groups. Furthermore, we examined the insulin levels. As shown in
Figure 4, insulin levels in the rosiglitazone and HPN groups were higher than in the control group, but the difference was not statistically significant. In general, as the findings of plasma glucose and insulin levels in the HPN group are similar to those of the rosiglitazone group, it is then implied that HPN conducts its antihyperglycemic activity by enhancing insulin sensitivity.
Table 6.
Effects of HPN on blood glucose in intraperitoneal glucose tolerance test (IPGTT) in Sprague–Dawley (SD) rats.
Table 6.
Effects of HPN on blood glucose in intraperitoneal glucose tolerance test (IPGTT) in Sprague–Dawley (SD) rats.
| Group | Dose (mg/kg) | Plasma glucose (mmol/L) a |
|---|
| 0 h | 0.5 h | 1 h | 2 h |
|---|
| Control | | 4.0 ± 0.4 | 10.7 ± 3.5 | 10.7 ± 2.8 | 7.3 ± 1.4 |
| HPN | 40 | 4.0 ± 0.8 | 10.4 ± 2.2 | 10.3 ± 2.1 | 7.4 ± 0.9 |
| 20 | 4.0 ± 0.4 | 10.7 ± 3.1 | 10.3 ± 2.1 | 7.8 ± 1.0 |
| 10 | 4.2 ± 0.5 | 10.9 ± 2.9 | 10.8 ± 2.7 | 8.3 ± 1.1 |
| Rosiglitazone | 20 | 3.9 ± 0.3 | 9.7 ± 1.7 | 10.4 ± 2.5 | 7.4 ± 1.1 |
Figure 4.
Effects of HPN on insulin level in IPGTT in SD rats.
Figure 4.
Effects of HPN on insulin level in IPGTT in SD rats.


