2.1. Structure Elucidation of Compounds 1–5
Quinomycin G (
1) was obtained as an amorphous yellow powder, a molecular formula of C
51H
64N
12O
12S
2 was determined by HRESIMS (
m/
z 1101.4288 [M + H]
+, calcd for C
51H
65N
12O
12S
2, 1101.4286), requiring 26 degrees of unsaturation. The chemical structure of
1 was adumbrated as an echinomycin analogue by the close similarity of its molecular formula and ultraviolet spectral properties (λ
max (log ε) 245.2 nm (2.6), 325.8 nm (1.9), respectively) to those of echinomycin [
10]. The
1H NMR spectrum of
1 (
Table 1) displayed four NH resonances (δ
H: 10.67 (1H, s), 9.20 (1H, d,
J = 9.5 Hz), 9.01 (1H, d,
J = 9.5 Hz), 7.83 (1H, overlap)); 12 aromatic protons signals (δ
H: 9.68 (1H, s), 9.63 (1H, s), 8.27 (1H, d,
J = 8.0 Hz), 8.20 (3H, d,
J = 8.0 Hz), 7.95–7.97 (2H, overlap), 7.84–7.89 (2H, overlap), 6.90 (1H, brs), 6.11 (1H, brs)); two methylene resonances (δ
H: 5.02 (1H, dd,
J = 11.5, 3.0 Hz), 4.67 (1H, d,
J = 11.5 Hz); 3.47 (1H, dd,
J = 16.0, 5.0 Hz), 2.54 (1H, d,
J = 16.0 Hz)); ten methine signals (δ
H: 6.03 (1H, d,
J = 4.0 Hz), 5.70 (1H, s), 5.37 (1H, d,
J = 9.0 Hz), 5.28 (1H, m), 4.85 (1H, m), 4.47 (1H, d,
J = 11.0 Hz), 3.74 (1H, d,
J = 2.0 Hz), 3.42 (1H, d,
J = 10.5 Hz), 2.49 (1H, m), 2.27 (1H, m)); 11 methyl signals in the upfield region, including four N-Me groups (δ
H: 3.37 (3H, s), 3.15 (3H, s), 3.02 (3H, s), 2.97 (3H, s)), one S-Me group (δ
H: 2.07 (3H, s)). 51 carbons were observed in the
13C NMR spectrum of compound
1 (
Table 1), including ten ester/amide carbonyls (δ
C: 172.2 (2C), 171.5, 169.9 (2C), 169.8, 168.3, 163.6, 163.2, 161.9) and 18 sp
2 carbon signals (δ
C: 143.9 (2C), 143.7, 143.5, 143.4, 142.4, 140.3 (2C), 133.0, 132.4, 131.9, 131.6, 131.0, 130.0 (2C), 129.4 (2C), 104.3). Comprehensive analysis of the
1H-
1H COSY (
Supplementary Materials Figure S8) and HSQC of compound
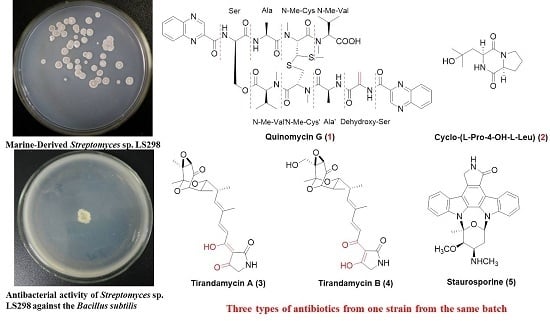
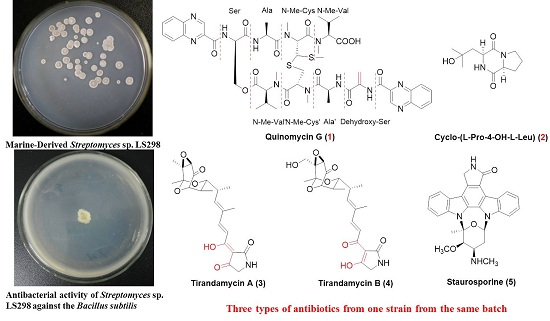
1, indicated that compound
1 was comprised of two quinoxalines and eight amino acid moieties (two N-Me-Val, two Ala, two N-Me-Cys, one Ser, and one Dehydroxy-Ser) (
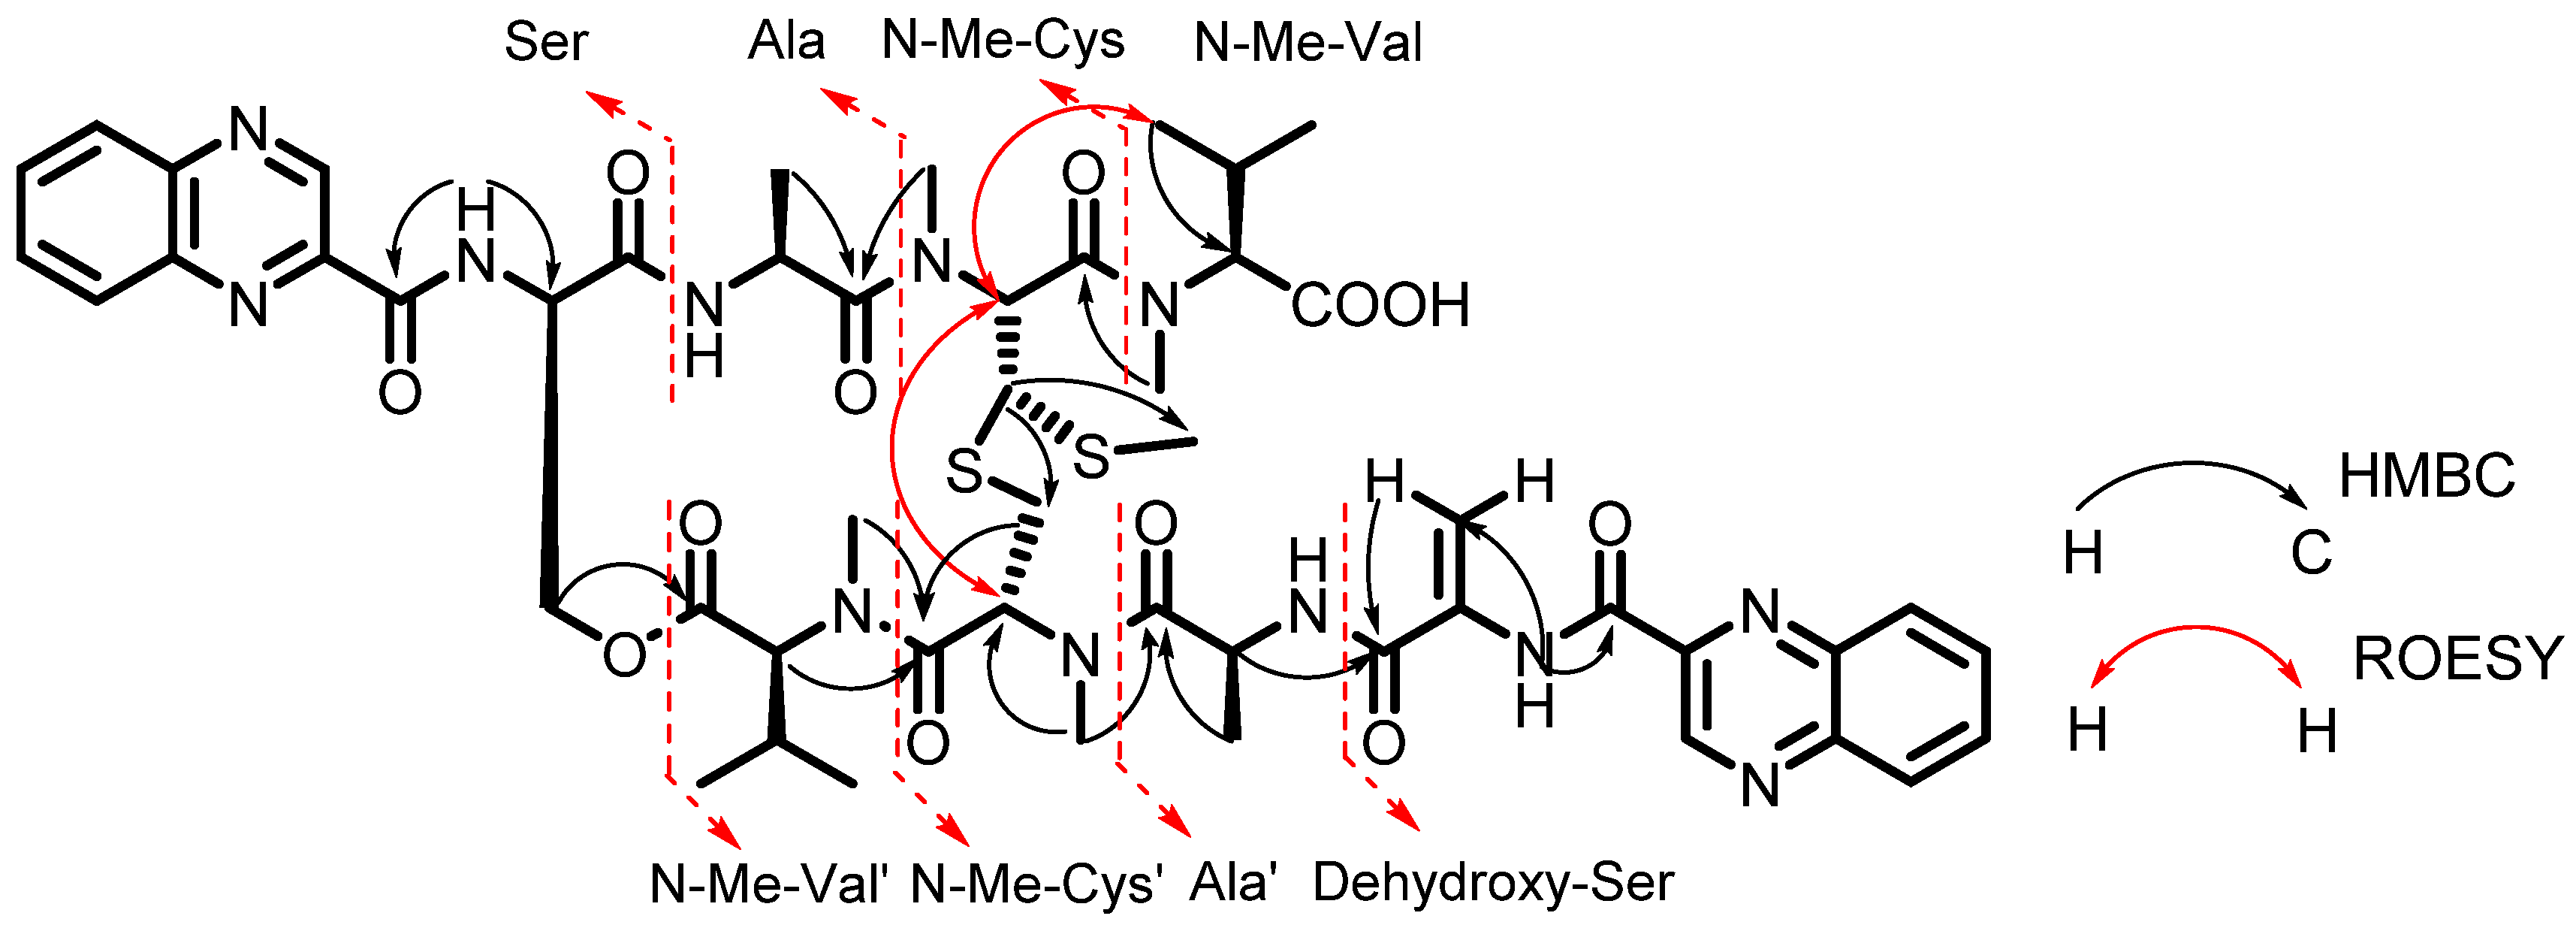
Figure 2). The connections between amino acids moieties were confirmed by an HMBC experiment. The HMBCs ((H-α (δ
H: 4.85 (1H, m) of Ala′ to the C=O (δ
C: 163.2) of Dehydroxy-Ser; N-CH
3 (δ
H: 3.37 (3H, s) of N-Me-Cys′ to the C=O (δ
C: 172.2) of Ala′; N-CH
3 (δ
H: 3.02 (3H, s) of N-Me-Val′ to the C=O (δ
C: 171.5) of N-Me-Cys′; H-β (δ
H: 4.67 (1H, d,
J = 11.5 Hz) of Ser to the C=O (δ
C: 169.9) of N-Me-Val′; NH (δ
H: 9.20 (1H, d,
J = 9.5 Hz) of Ala to the C=O (δ
C: 169.9) of Ser; N-CH
3 (δ
H: 3.15 (3H, s) of N-Me-Cys to the C=O (δ
C: 172.2) of Ala; N-CH
3 (δ
H: 2.97 (3H, s) of N-Me-Val to C=O (δ
C: 168.3) of N-Me-Cys)), indicated that the connections were Dehydroxy-Ser-Ala′-N-Me-Cys′-N-Me-Val′-Ser-Ala-N-Me-Cys-N-Me-Val. Above all evidence, compound
1 was structurally similar to echinomycin. The only difference between them was the presence of a double bond (δ
H: 6.90 (1H, brs), 6.11 (1H, brs); δ
C: (133.0, 104.3)) in compound
1. In the HMBC spectrum, the methylene protons (δ
H: 6.90 (1H, brs), 6.11 (1H, brs)) to C=O (δ
C: 163.2), confirmed that the double bond originated from the Ser. On the basis of the above information, all protons and carbon resonances were assigned and the planar structure of compound
1 was established. Because the planar differences in the structures of compound
1 and echinomycin cause the changes on spatial configurations, the NMR spectral data, especially
1H NMR spectral data of compound
1 were different with that of echinomycin. The appearance of double bond of Dehydroxy-Ser may make the quinoxaline, amide, alkene, and carbonyl groups form a large conjugate plane (
Supplementary Materials Figure S9). The CH
3 of the Ala′ positioned in the shielding area, so its
1H NMR spectral data upfielded to δ
H: 0.19.
Table 1.
1H (500 MHz) and 13C (125 MHz) NMR Date for Compound 1 (CDCl3).
Table 1.
1H (500 MHz) and 13C (125 MHz) NMR Date for Compound 1 (CDCl3).
| Position | δH, mult (J in Hz) | δC | Position | δH, mult (J in Hz) | δC | Position | δH, mult (J in Hz) | δC |
|---|
| Quinoxaline | | | β | 5.02, dd (11.5, 3.0) | 65.8 | α | 5.28, m | 45.6 |
| 2 | | 143.9 | | 4.67, d (11.5) | | β | 1.35, d (6.0) | 18.3 |
| 2′ | | 143.9 | C=O | | 169.9 | C=O | | 172.2 |
| 3 | 9.68, s | 143.5 | Dehydroxy-Ser | | | Ala′ | | |
| 3′ | 9.63, s | 143.7 | NH | 10.67, s | | NH | 7.83 a | |
| 5 | 8.20, d (8.0) | 129.4 | α | | 133.0 | α | 4.85, m | 44.9 |
| 5′ | 8.20, d (8.0) | 129.4 | β | 6.90, brs; 6.11, brs | 104.3 | β | 0.19, d (6.0) | 16.4 |
| 6 | 7.84–7.89 a | 132.4 | C=O | | 163.2 | C=O | | 172.2 |
| 6′ | 7.84–7.89 a | 131.9 | N-Me-Cys | | | N-Me-Val | | |
| 7 | 7.95–7.97 a | 131.6 | N-Me | 3.15, s | 33.2 | N-Me | 2.97, s | 29.0 |
| 7′ | 7.95–7.97 a | 131.0 | α | 5.70, s | 60.4 | α | 3.42, d (10.5) | 65.8 |
| 8 | 8.27, d (8.0) | 130.0 | β | 3.74, d (2.0) | 52.1 | β | 2.27, m | 27.4 |
| 8′ | 8.20, d (8.0) a | 130.0 | S-Me | 2.07,s | 13.4 | γ | 1.04 a | 19.5 |
| 9 | | 140.3 | C=O | | 168.3 | γ | 0.97, d (6.0) | 18.5 |
| 9′ | | 140.3 | N-Me-Cys′ | | | COOH | | 169.8 |
| 10 | | 143.4 | N-Me | 3.37, s | 33.8 | N-Me-Val′ | | |
| 10′ | | 142.4 | α | 6.03, d (4.0) | 61.1 | N-Me | 3.02, s | 28.8 |
| C=O | | 163.6 | β | 3.47, dd (16.0, 5.0) | 29.2 | α | 4.47, d (11.0) | 64.6 |
| C=O′ | | 161.9 | | 2.54, d (16.0) | | β | 2.49, m | 28.6 |
| Ser | | | C=O | | 171.5 | γ | 1.06, d (7.0) | 19.7 |
| NH | 9.01, d (9.5) | | Ala | | | γ | 1.03, d (7.0) | 18.8 |
| α | 5.37, d (9.0) | 52.6 | NH | 9.20, d (9.5) | | C=O | | 169.9 |
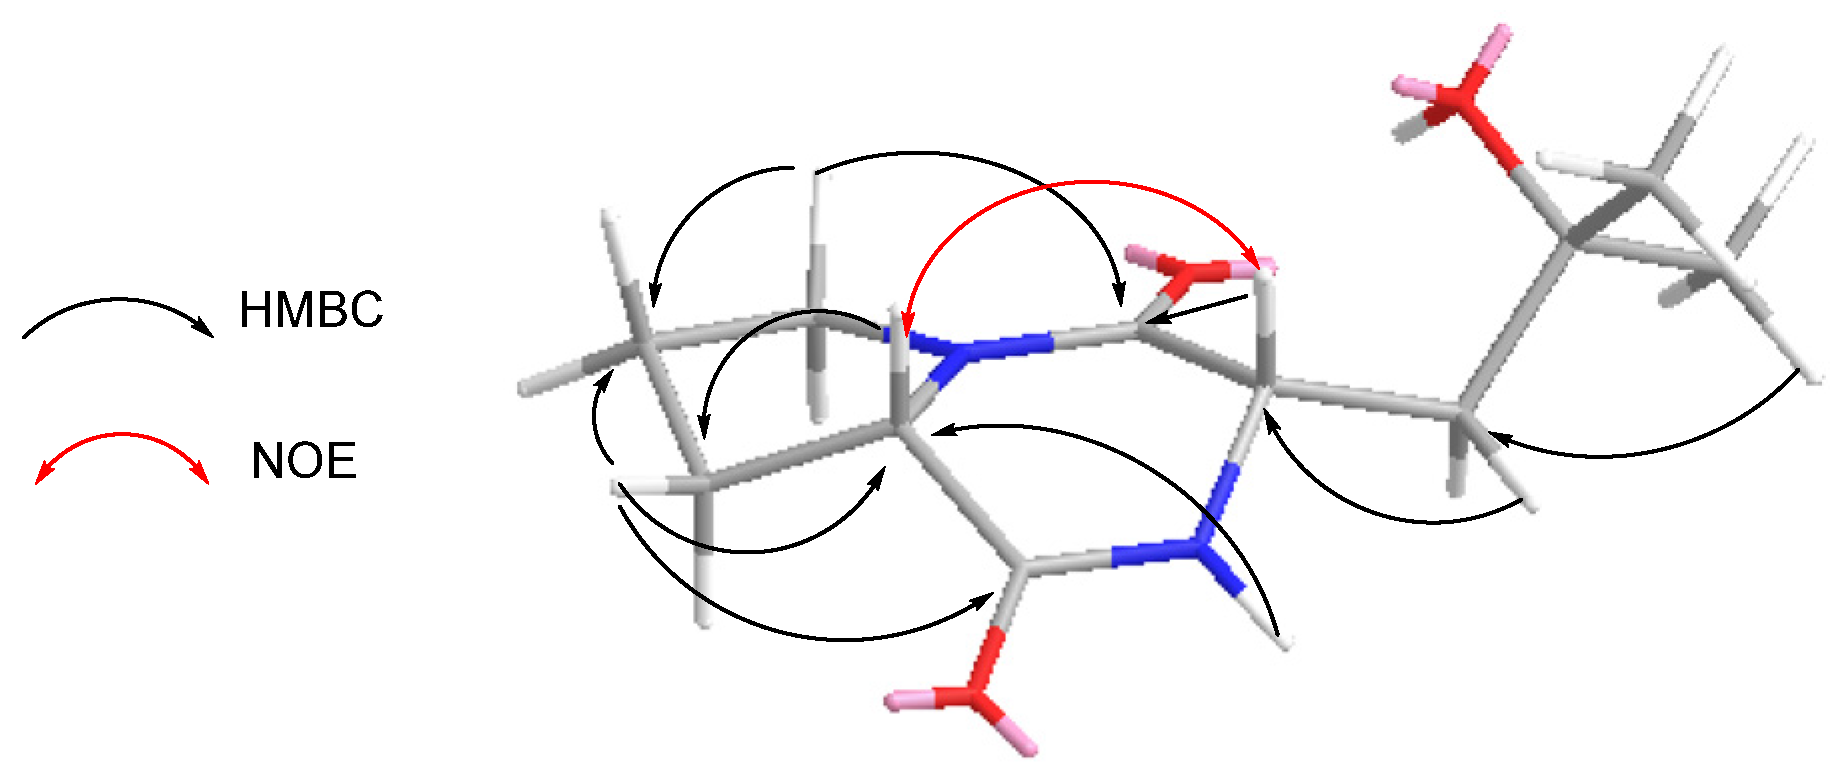
Figure 2.
Key HMBC and ROESY correlations of compound 1.
Figure 2.
Key HMBC and ROESY correlations of compound 1.
Marfey’s method was employed to assign the absolute configurations of the amino acid residues resulting from acid hydrolysis of
1 [
15,
16]. The 1-fluoro-2,4-dinitrophenyl-5-
l-alanine amide (FDAA) derivatives of the acid hydrolysate of
1 and the authentic
d- and
l-amino acids were subjected to HPLC analysis. The absolute configurations of all amino acid residues in
1 except for N-Me-Cys were established by comparing their HPLC retention times with those of the corresponding authentic
d- and
l- amino acid standards (
Table 2,
Supplementary Materials Figure S17). The ROESY correlation between H-α of N-Me-Cys (δ
H: 5.70) and H-α of N-Me-Cys′ (δ
H: 6.03) showed they necessarily positioned
cis to each other. In other words, these two N-Me-Cys were either
d or
l amino acids. The absolute configuration of the N-Me-
l-Cys was confirmed by the ROESY correlation between H-α of N-Me-Cys (δ
H: 5.70) and H-γ of N-Me-
l-Val (δ
H: 0.97) (
Figure 2), because this correlation was observed implying H-α of N-Me-Cys (δ
H: 5.70) located at β-orientaion as same as H-γ of N-Me-
l-Val (δ
H: 0.97). The results indicated that the amino acid residues were
l-Ala/Ala′,
d-Ser, N-Me-
l-Val/N-Me-
l-Val′ and N-Me-
l-Cys/N-Me-
l-Cys′ configurations.
Table 2.
The retention times of 1-fluoro-2,4-dinitrophenyl-5-l-alanine amide (FDAA) derivatives of the hydrolysates of 1–2 and amino acids standards.
Table 2.
The retention times of 1-fluoro-2,4-dinitrophenyl-5-l-alanine amide (FDAA) derivatives of the hydrolysates of 1–2 and amino acids standards.
| | Retention Time (TR) Min |
|---|
| Amino Acid Standards | Compound 1 | Compound 2 |
|---|
| l-Ser | 15.787 | - | - |
| d-Ser | 16.422 | 16.649 | - |
| l-Ala | 22.125 | 21.952 | - |
| d-Ala | 23.789 | - | - |
| N-Me-l-Val | 17.499 | 17.528 | - |
| N-Me-d-Val | 19.732 | - | - |
| l-Pro | 14.544 | - | 14.677 |
| d-Pro | 17.528 | - | - |
| FDAA | 19.772 | 19.804 | 19.782 |
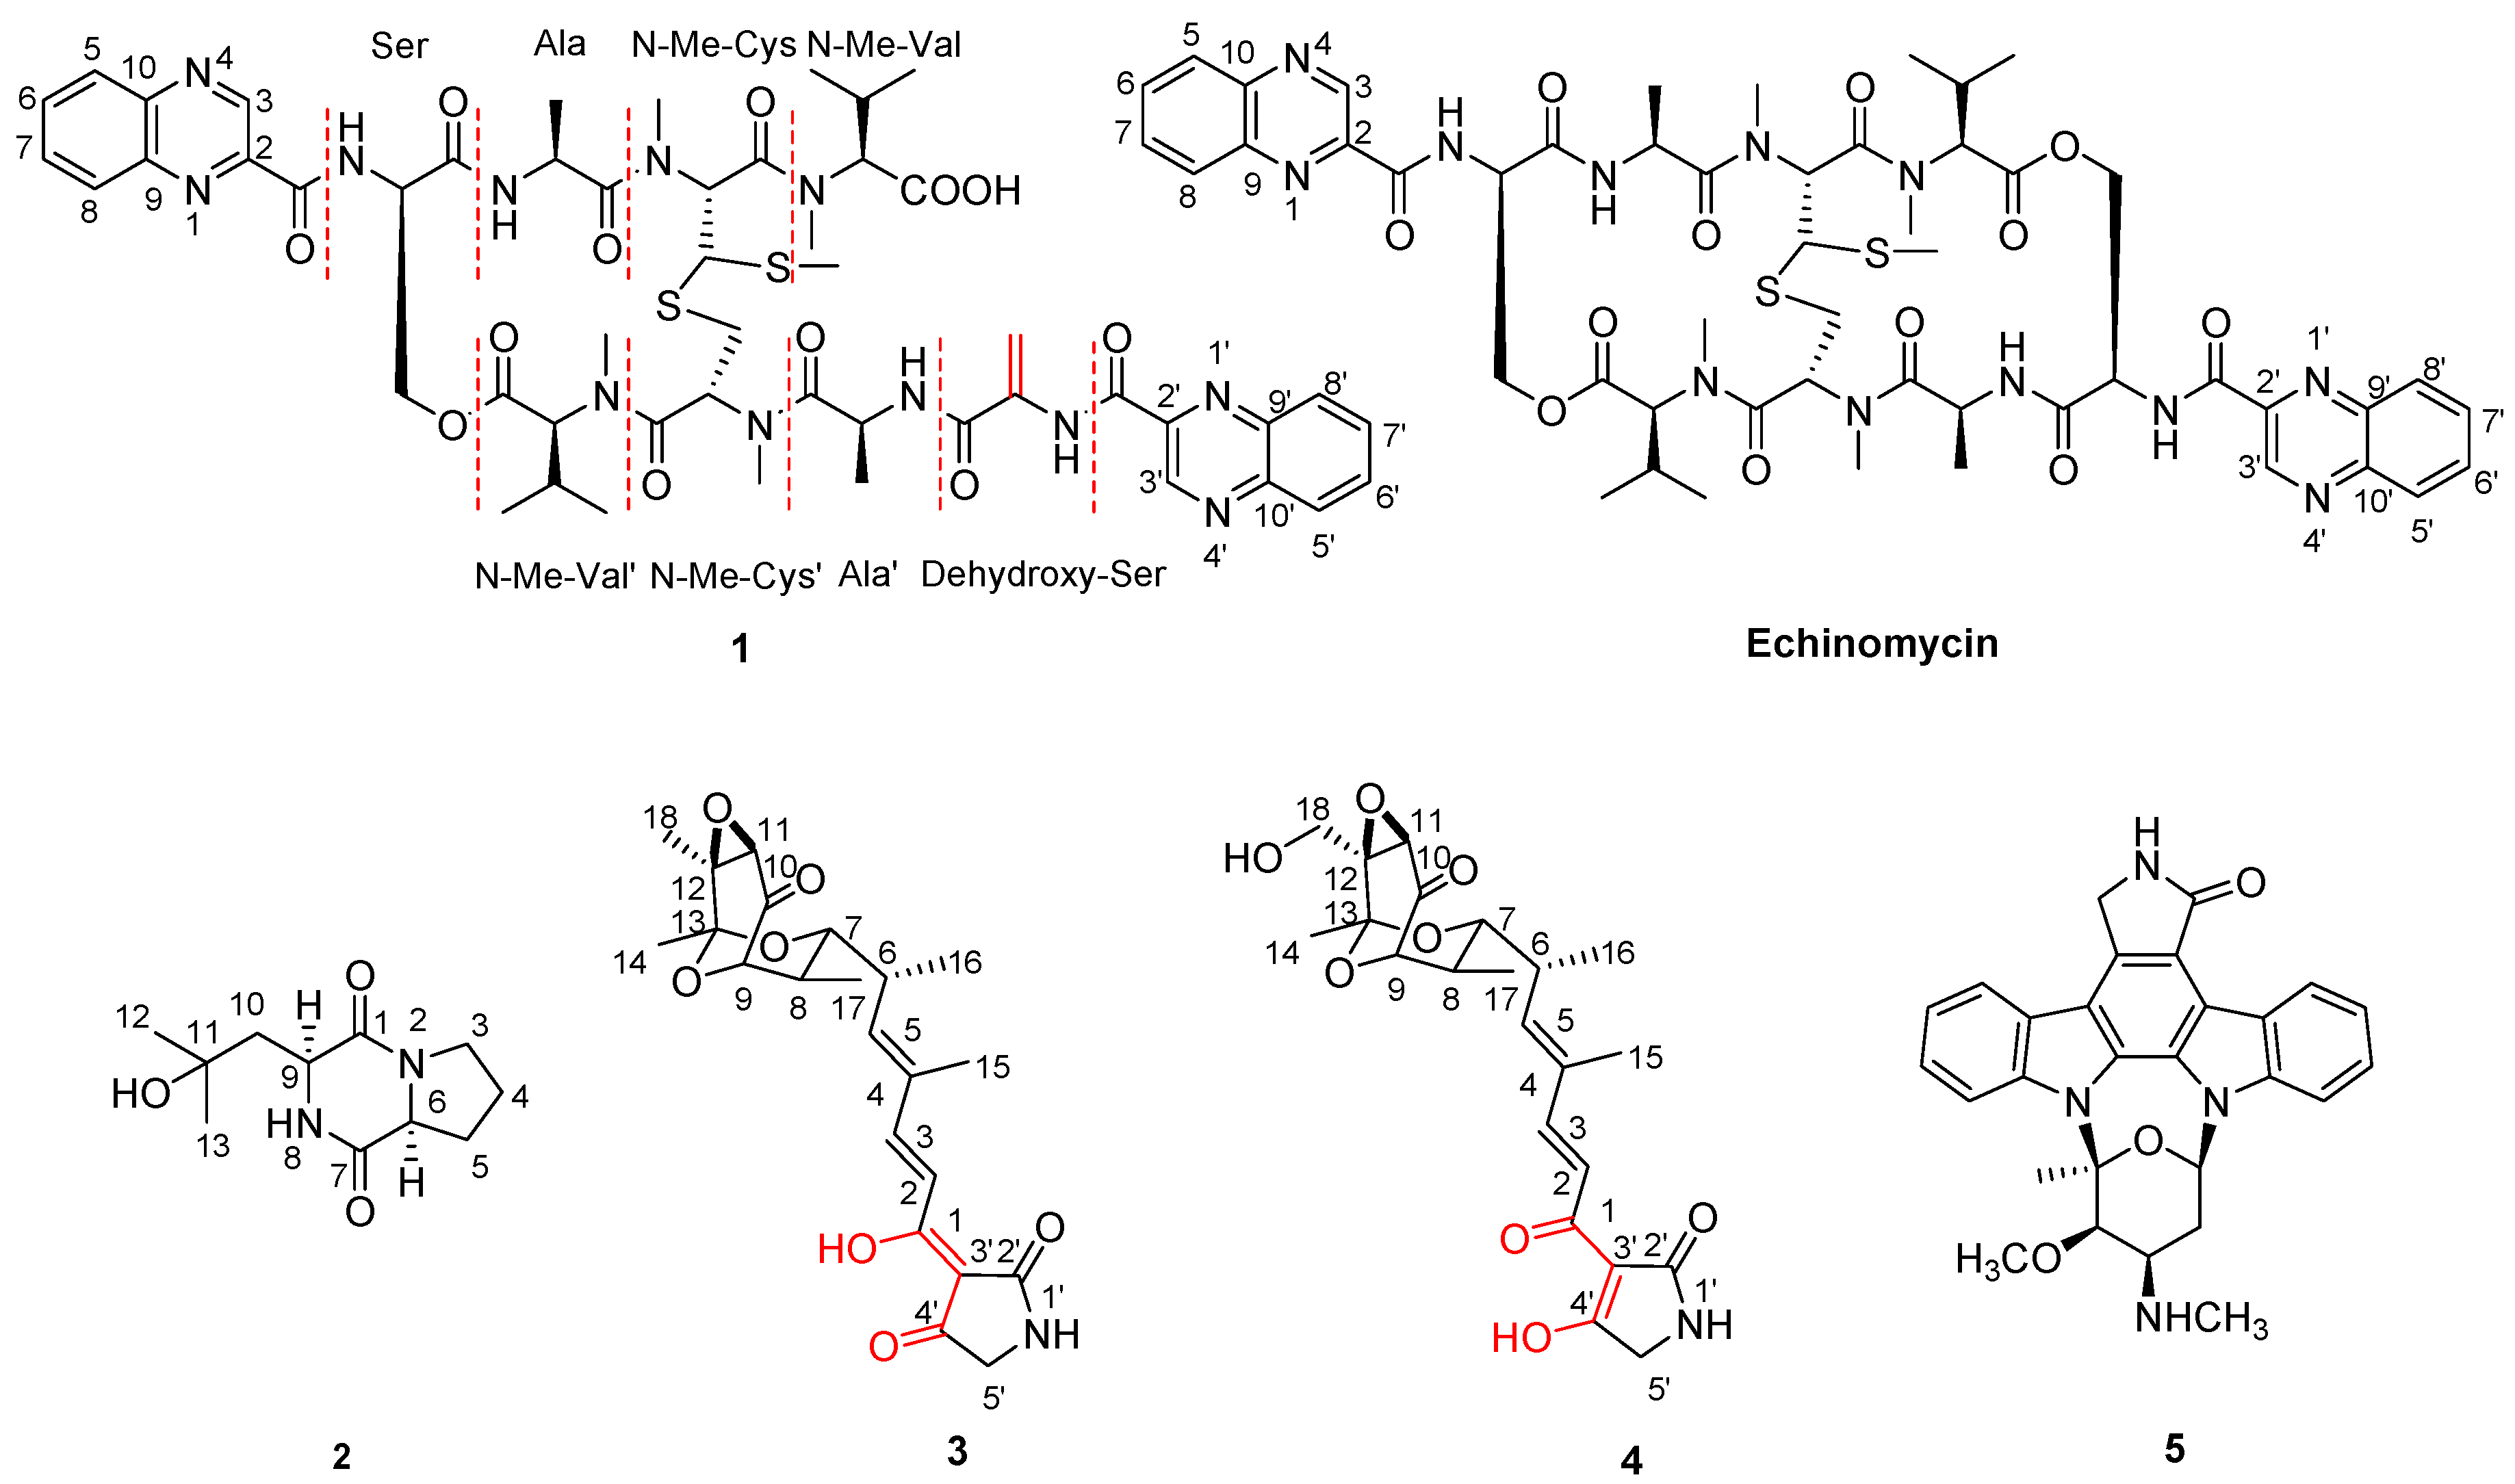
Thus, as shown in
1 (
Figure 1), the absolute stereochemistry of this novel echinomycin analogue was assigned and it was given the trivial name quinomycin G.
Cyclo(
l-Pro-4-OH-
l-Leu) (
2) was isolated as a white powder, its molecular formula C
11H
18N
2O
3 was established upon the analysis of the HRESIMS peak at
m/
z 249.1209 [M + Na]
+, indicating four degrees of unsaturation. The
1H NMR spectrum of
2 (
Table 3) revealed one NH resonance (δ
H: 7.66 (1H, s)); two methine signals (δ
H: 4.23 (1H, d,
J = 10.5 Hz), 4.08 (1H, t,
J = 8.0 Hz)); four methylene resonances (δ
H: 3.56 (2H, m); 2.01 (1H, m), 1.89 (1H, m); 2.36 (1H, dd,
J = 8.5, 2.5 Hz), 2.10 (1H, m); 2.32 (1H, dd,
J = 14.5, 2.0 Hz), 1.79 (1H, dd,
J = 14.5, 11.0 Hz)); two methyl signals in the upfield region (δ
H: 1.31 (1H, s), 1.35 (1H, s)). The
13C NMR spectra of
2 (
Table 3) showed a total of 11 carbon resonances, and they were classified as two amide carbonyls (δ
C: 169.7, 166.1), three methines (δ
C: 70.9, 58.8, 53.2), four methylene signals (δ
C: 45.6, 41.1, 28.3, 22.6), two methyl signals (δ
C: 32.3, 27.4). Further analysis of the NMR data confirmed the existence of moieties of Pro and 4-hydroxyl-Leu. In the HMBC experiment (
Figure 3), the correlations of H-3 (δ
H: 3.56 (2H, m)), and H-9 (δ
H: 4.23 (1H, d,
J = 10.5 Hz)) with C-1 (δ
C: 166.1); H-5 (δ
H: 2.36 (1H, dd,
J = 8.5, 2.5 Hz), 2.10 (1H, m)) and H-8 (δ
H: 7.66 (1H, s)) with C-6 (δ
C: 58.8) confirmed the planar structure for compound
2 was cyclo(Pro-4-hydroxyl-Leu). The relative stereochemistry of
2 was deduced from the NOE spectrum (
Figure 3). When irradiating H-6 at δ
H: 4.08 and H-9 at δ
H: 4.23, the integration values of H-9 and H-6 were enhanced respectively, which showed that H-6 and H-9 positioned
cis to each other. That is to say relative configurations of Pro and 4-hydroxyl-Leu were either
l or
d configurations. On the basis of Marfey’s method, the presence of
l-Pro in
2 compared with the appropriate amino acid standards (
Table 2,
Supplementary Materials Figure S17), determined the configuration of compound
2 as cyclo(
l-Pro-4-hydroxyl-
l-Leu).
Table 3.
1H (500 MHz) and 13C (125 MHz) NMR Date for compound 2 (CDCl3).
Table 3.
1H (500 MHz) and 13C (125 MHz) NMR Date for compound 2 (CDCl3).
| No. | δH, mult (J in Hz) | δC | No. | δH, mult (J in Hz) | δC |
|---|
| 1 | | 166.1 | 7 | | 169.7 |
| 2 | | | 8 | 7.66, s | |
| 3 | 3.56, m | 45.6 | 9 | 4.23, d (10.5) | 53.2 |
| 4α | 1.89, m | 22.6 | 10α | 2.32, dd (14.5, 2.0) | 41.1 |
| 4β | 2.01, m | 10β | 1.79, dd (14.5, 11.0) |
| 5α | 2.36, dd (8.5, 2.5) | 28.3 | 11 | | 70.9 |
| 5β | 2.10, m | 12 | 1.31, s | 27.4 |
| 6 | 4.08, t (8.0) | 58.8 | 13 | 1.35, s | 32.3 |
Figure 3.
The Key HMBC and NOE correlations of compound 2.
Figure 3.
The Key HMBC and NOE correlations of compound 2.
In our ongoing investigation of active metabolites, tirandamycins A (
3) [
17] and B (
4) [
18] were obtained and their structures were elucidated by the MS,
1H,
13C NMR, HSQC, HMBC spectral analysis (
Supplementary Materials Figure S27) and comparison of the respective spectral data with those found in the literature. Surprisingly, their
1H and
13C NMR spectral data showed significant differences at positions 1, 2, 3 and 5 (
Table 4), though they were tested in the same solvent (DMSO-
d6). Subsequently, this inspired us to study the structural distinction between them. The literature survey indicated that the substituent groups on bicyclic ketal moiety have little influence on the NMR spectral data of the long conjugated system [
17,
18,
19,
20,
21,
22]. Therefore, we proposed that the distinct differences of NMR spectral data were caused by the positions of the enolic hydroxy and carbonyl group. Compared with C-1 at δ
C: 173.5 in tirandamycin A (
3), the data of C-1 in tirandamycin B (
4) moved to the downfield at δ
C: 181.0, implying that
4 should be in 1-keto-4′-enol form. The keto-enol tautomer existed widely in the structure of natural products, and the rules of NMR data of these two tautomers have been studied [
23], which also supported that tirandamycin B (
4) was the 1-keto-4′-enol form. It is the first time to reveal the 1-keto-4′-enol form of tirandamycin B explicitly. Because the structures of 1-keto-4′-enol form of tirandamycins were unclear previously, the assignments of the NMR data of these compounds were not correct [
21,
22]. Herein, we summarized the trend in NMR data of keto-enol tautomers exist in tirandamycins in order to raise concern on the structural and NMR data differences between these two forms. In the
13C NMR spectrum, when the structure was in 1-enol-4′-keto form just like tirandamycin A, the carbon signals occurred at approximately δ
C: 173.5 (C-1), 116.2 (C-2), 147.9 (C-3) and 143.7 (C-5), however the carbons of the 1-keto-4′-enol form as tirandamycin B resonated at approximately δ
C: 181.0 (C-1), 124.8 (C-2), 143.2 (C-3) and 137.9 (C-5). More importantly, three olefinic protons had obvious differences in these two tautomers in the
1H NMR spectrum, δ
H: 7.05 (H-2) 7.47 (H-3) and 6.19 (H-5) in 1-enol-4′-keto form changed to δ
H: 7.55 (H-2) 7.14 (H-3) and 5.81 (H-5) in 1-keto-4′-enol form. The chemical shift of H-2 at δ
H: 7.55 increased abnormally, which may be due to the shielding effect of the double bond (1C=O). According to the above results and literature survey [
17,
18,
19,
20,
21,
22,
24], we also summed up a brief rule that if the
1H NMR data of H-5 is more than δ
H: 6.00, the structure of tirandamycin is in 1-enol-4′-keto form, otherwise, it is in the other form.
Table 4.
The 1H (500 MHz) and 13C (125 MHz) NMR Date for Tirandamycins A and B (DMSO-d6).
Table 4.
The 1H (500 MHz) and 13C (125 MHz) NMR Date for Tirandamycins A and B (DMSO-d6).
| No. | Tirandamycin A | Tirandamycin B |
|---|
| δH, mult (J in Hz) | δC | δH, mult (J in Hz) | δC |
|---|
| 1 | | 173.5 | | 181.0 |
| 2 | 7.05, d (15.5) | 116.2 | 7.55, d (15.5) | 124.8 |
| 3 | 7.47, d (15.5) | 147.9 | 7.14, d (15.5) | 143.2 |
| 4 | | 134.1 | | 134.2 |
| 5 | 6.19, d (9.5) | 143.7 | 5.81, d (10.0) | 137.9 |
| 6 | 2.88, m | 33.9 | 2.83, m | 33.5 |
| 7 | 3.77, dd (9.0, 2.0) | 75.8 | 3.73, m | 76.1 |
| 8 | 1.81, m | 33.9 | 1.77, m | 33.7 |
| 9 | 4.03, d (6.5) | 77.8 | 4.04, d (6.5) | 77.7 |
| 10 | | 202.8 | | 202.5 |
| 11 | 3.47, s | 59.9 | 3.56, s | 56.0 |
| 12 | | 56.7 | | 59.8 |
| 13 | | 96.2 | | 95.3 |
| 14 | 1.44, s | 22.4 | 1.43, s | 23.3 |
| 15 | 1.84, s | 12.0 | 1.79, s | 12.5 |
| 16 | 1.07, d (7.0) | 16.6 | 1.05, d (6.5) | 16.9 |
| 17 | 0.62, d (7.0) | 11.0 | 0.62, d (6.5) | 11.1 |
| 18 | 1.40, s | 15.1 | 3.84, dd (12.5, 3.5) 3.74, dd (12.5, 3.5) | 56.5 |
| 1′ | 8.74, s | | 7.58, s | |
| 2′ | | 176.0 | | 177.9 |
| 3′ | | 100.7 | | 101.2 |
| 4′ | | 193.9 | | 192.9 |
| 5′ | 3.77, dd (9.0, 2.0) 3.75, dd (9.0, 2.0) | 51.4 | 3.47, s | 50.2 |
| 18-OH | | | 5.02 brs | |
The variable temperature experiments for
1H NMR of tirandamycins A (
3) and B (
4) were employed for studying the tautomerizm of keto-enol tirandamycins and the test temperatures were set at 40, 60, 80 °C. With the increase of test temperature, the structure of tirandamycin A (
3) was still in the 1-enol-4′-keto form (
Supplementary Materials Figure S21), but the structure of tirandamycin B (
4) gradually transformed to 1-enol-4′-keto form (
Supplementary Materials Figure S26). The results suggested that in the DMSO-
d6 solution, tirandamycin A (
3) was stable in 1-enol-4′-keto form, while tirandamycin B (
4) was more stable in 1-keto-4′-enol form than the other form. The reason may be the structure itself or external factors, which need to be further investigated.
The known antibiotic staurosporine (
5) was characterized by comparison of the respective spectral data (MS,
1H,
13C NMR) with those found in the literature [
25].


