1. Introduction
The development of anticancer drugs with effective therapeutic mechanisms is most interesting [
1]. In that sense, various herbal and marine compounds have emerged as potential alternative medicines because of their structural diversity and safety, which was demonstrated by their long history of dietary use [
2,
3]. Marine natural products have been isolated since 1950s and marine sponges are one of the richest sources of bioactive compounds, showing the anti-proliferative effect through the inhibition of microtubule formation, the promotion of cell growth arrest, and stimulation of the cells death program [
1]. Of these, the discovery of the sponge-derived nucleoside such as spongothymidine and spongouridine was made and three marine-based, anti-cancer drugs are currently being marketed [
4]. Cytarabine was the first marine-derived anticancer drug approved in 1998 for the treatment of acute myelogenous leukemia. It was isolated from the marine sponge, Cryptotethya crypta, and induced apoptotic signals by inhibiting the NF-κB/Rel nuclear factor and binding to Bcl-2, and resulting in growth arrest at the G1/S phase [
5]. Trabectedin, isolated from Ecteinascidia turbinata, was an approved anti-cancer drug against metastatic soft tissue carcinoma and ovarian cancer in 2009 in Europe [
1]. Another approved marine drug is eribulin, an analog of halichondrin B, extracted from the marine sponge, Halichondria okadai [
6], in 2010 from the FDA for the treatment of metastatic breast cancer. It also showed Bcl-2 inactivation and inhibition of microtubule polymerization [
1,
6].
Metabolites of sphingolipids such as ceramide, sphingosine, and sphingosine-1-phosphate (S1P), have been emerged as modulators for cancer progression [
7]. Several studies addressing the effectiveness of sphingosine kinase SphK1 inhibition for cancer therapy have been reported [
8,
9,
10,
11]. The mRNA levels of SphK1 were significantly increased in breast, colon, lung, ovary, uterus, and kidney cancer patients, as well as in acute leukemia patients [
12,
13,
14], and the downregulation of SphK1 decreased the epidermal growth factor and reduced prolactin- and E2-induced migration in metastatic breast cancer [
7].
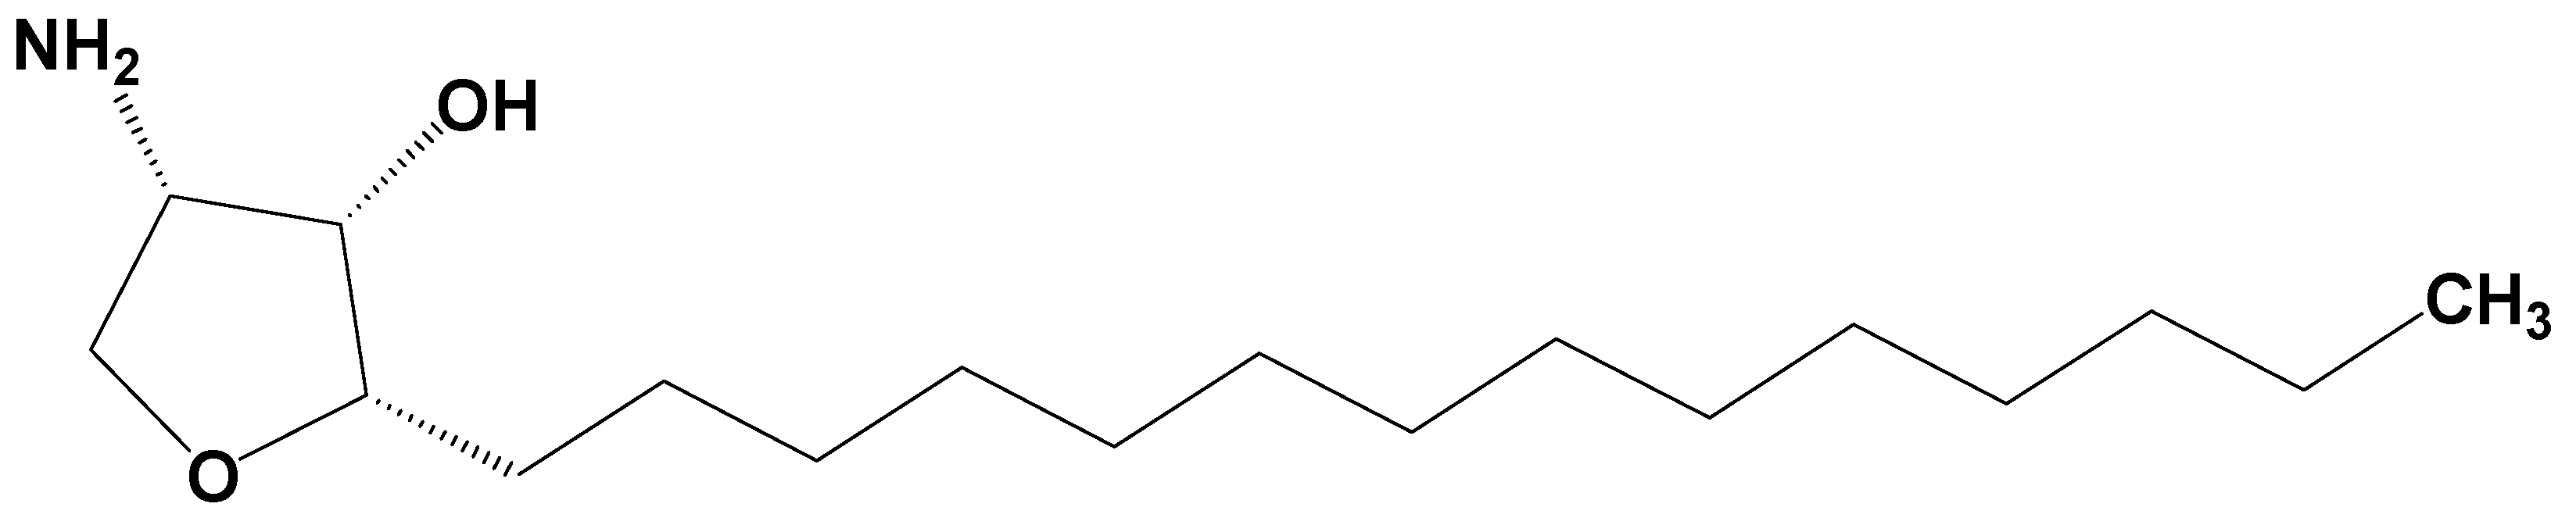
Jaspine B (pachastrissamine) (
Figure 1) is an anhydrophytosphingosine, which is extracted from the marine sponge,
Pachastrissa spp. [
15]. It showed effective anti-cancer activity against several human carcinomas. Owing to its structural similarity with sphingosine, Jaspine B inactivated SphK1 and induced apoptotic signals [
16]. In addition, Jaspine B inhibited melanoma cell growth by inhibiting the phosphorylation of Forkhead box O3 (FOXO3) [
17] and by inducing apoptosis [
18].
Previously, we had reported the anti-tumor activity of Jaspine B against various tumor cells that overexpressed sphingosine kinase. The results showed that Jaspine B was the most effective against breast cancer cells (MCF-7, IC
50 = 2.31 μM) and showed differential cytotoxicity towards human breast adenocarcinoma (MDA-MB-231, IC
50 > 100 μM), renal carcinoma (786-O, IC
50 = 29.4 μM), melanoma (MDA-MB-435, IC
50 = 2.60 μM), ovarian (SK-OV3, IC
50 = 4.78 μM), and hepatoma (HepG2, IC
50 = 5.69 μM) cells. The steady-state cellular concentration of Jaspine B was associated with the cytotoxic effect [
19].
However, there have been few studies determining the absorption, disposition, and pharmacokinetic properties of Jaspine B, despite the importance of understanding these properties of the active, natural components. Therefore, in this study, we aimed to evaluate the pharmacokinetics, absorption, disposition, and excretion profile of Jaspine B and to investigate the underlying mechanisms related to its pharmacokinetic properties.
3. Discussion
Jaspine B is an anhydrophytosphingosine, extracted from the marine sponge,
Pachastrissa spp. It shows meaningful inhibitory activity against sphingosine kinases (SphK1 and SphK2), which is an important mechanism of action for its anti-proliferative effect [
28]. Jaspine B shows differential efficacy against a variety of tumor types of different tissue origins, and the cellular accumulation of Jaspine B at steady-state is a crucial determining factor of efficacy [
19]. Moreover, the intravenous injection of Jaspine B (200 mg/mouse, equivalent to 6.7 mg/kg) on 4th, 8th, and 12th day dramatically decreased metastatic melanoma cell growth in the lungs of Jaspine B-injected mice on day 14 [
18]. Although this in vivo and in vitro anti-proliferative effects of Jaspine B, the pharmacokinetics features of this compound was not investigated.
Therefore, the next step in understanding the anti-tumor activity of Jaspine B was to investigate its pharmacokinetic characteristics and the underlying mechanisms controlling the absorption, distribution, metabolism, and elimination of this compound.
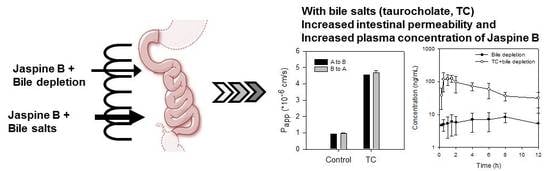
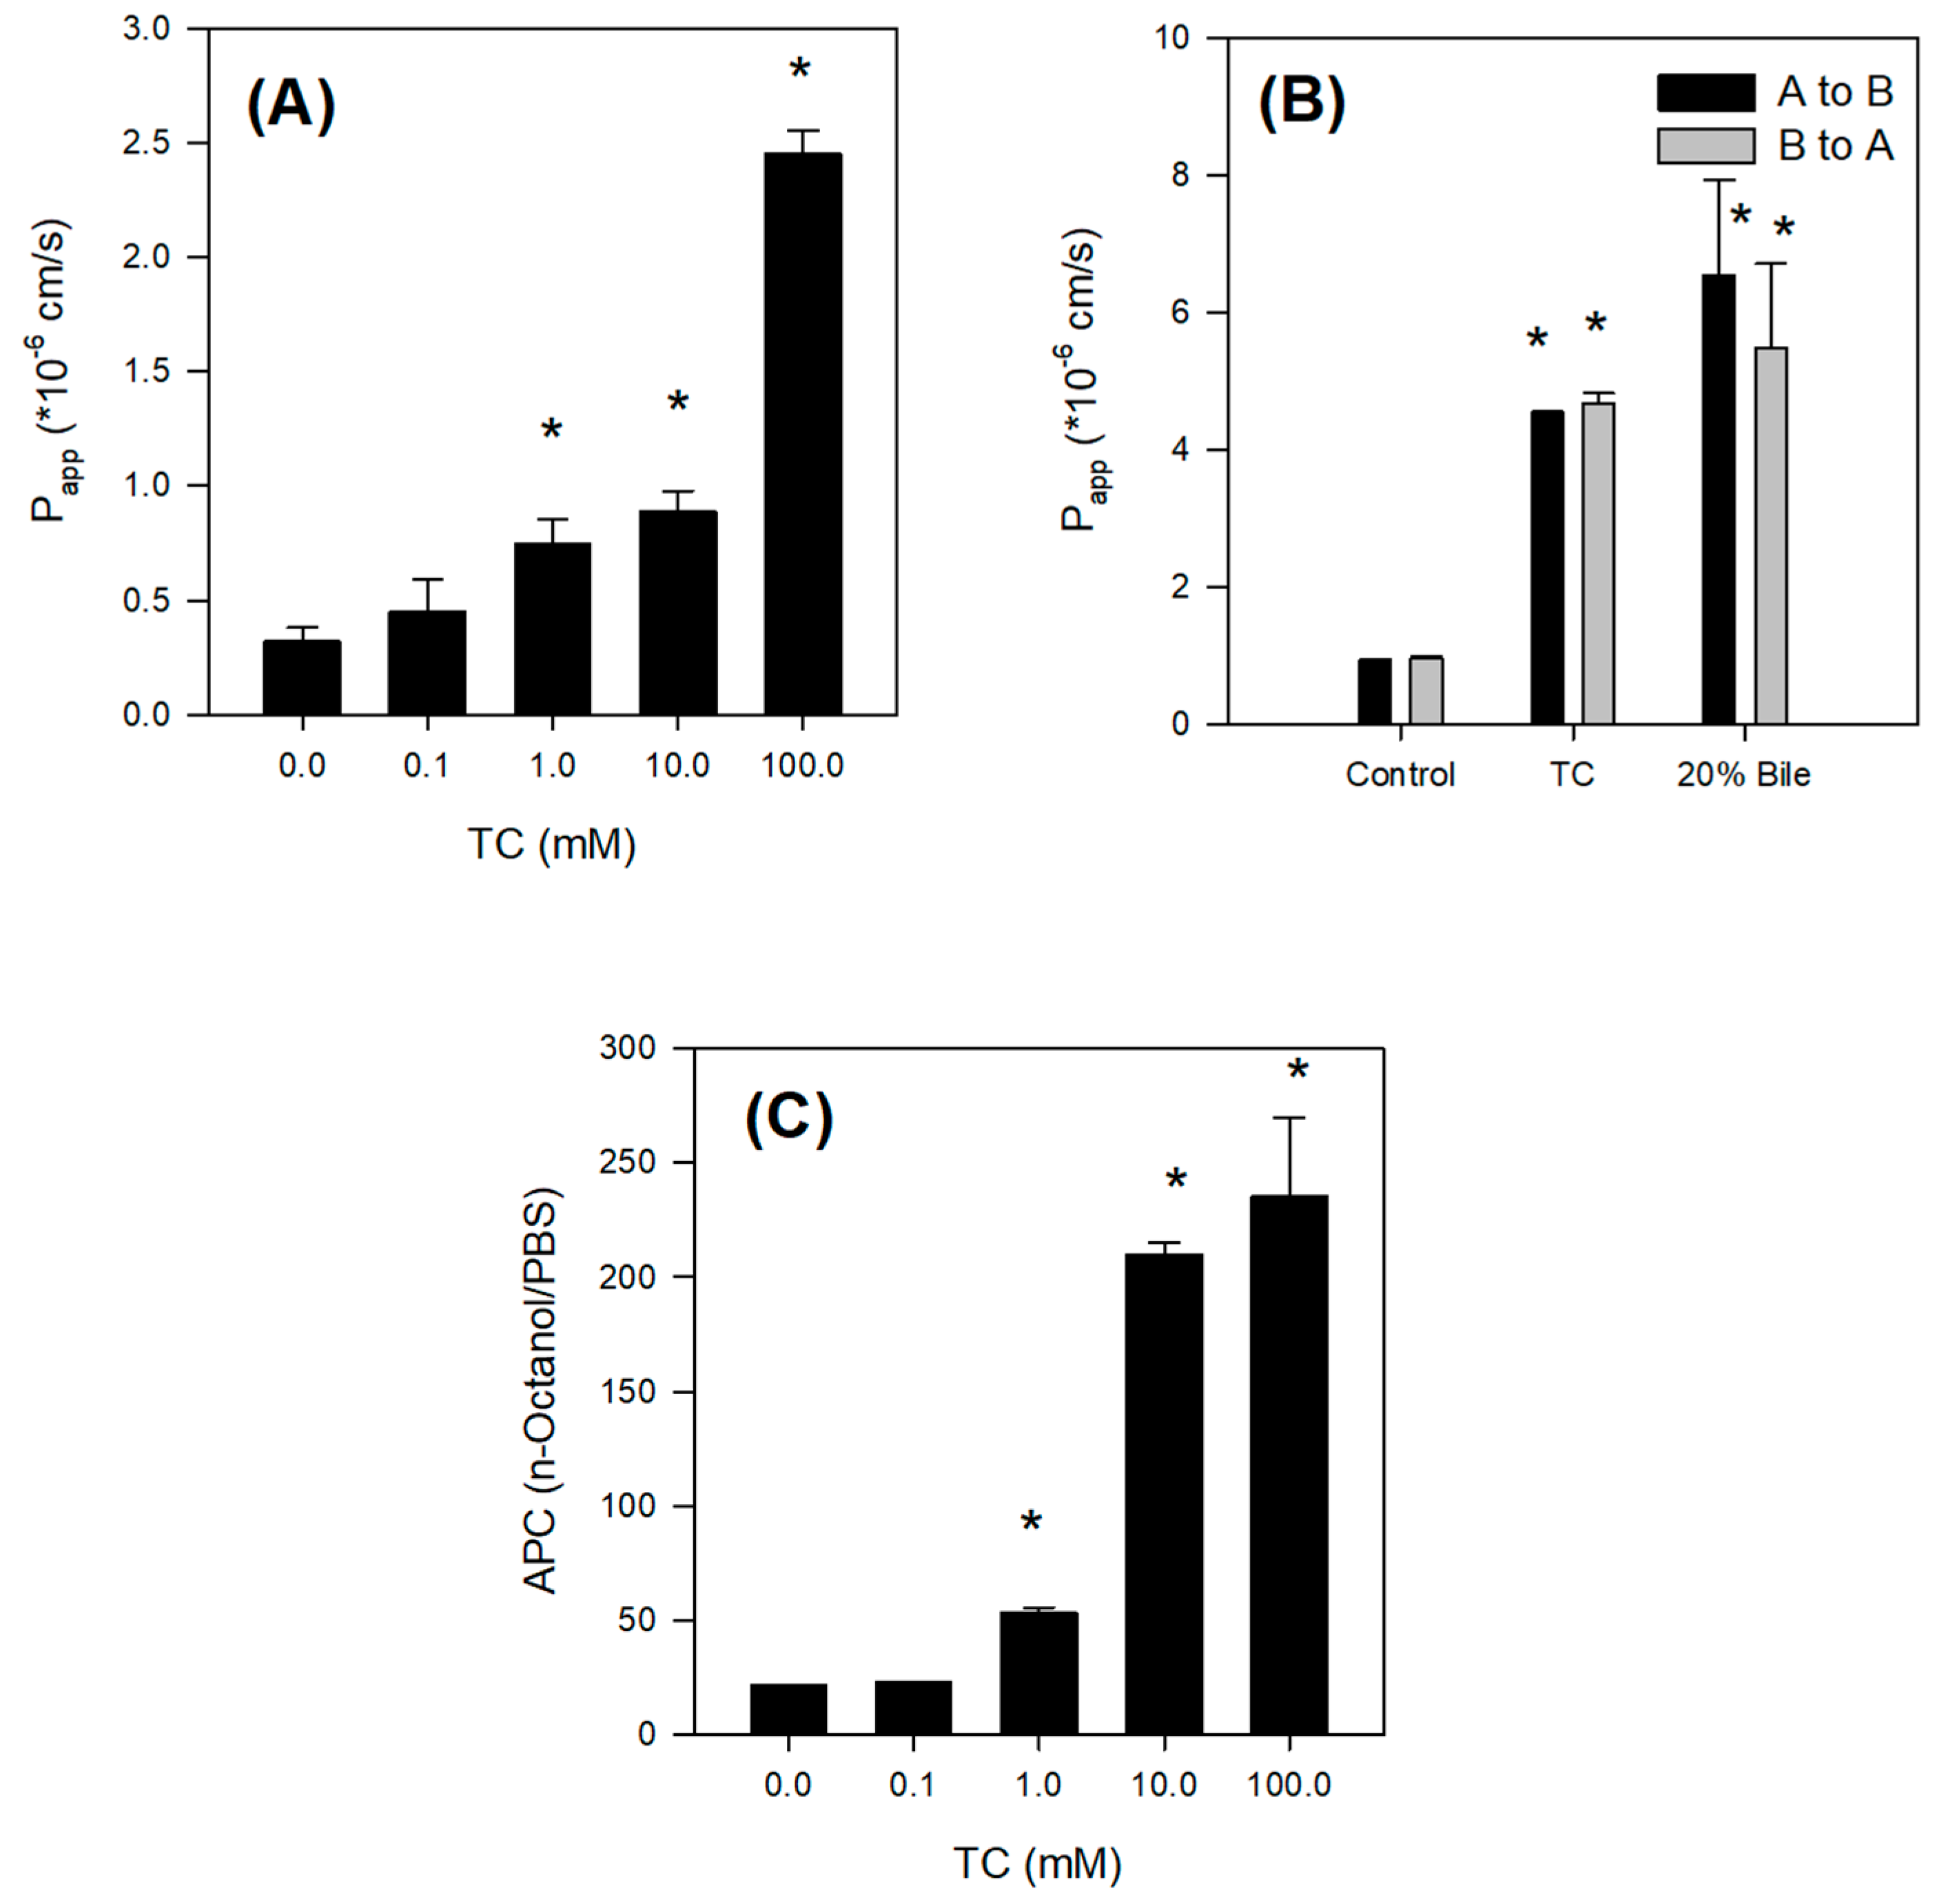
The absorption of Jaspine B itself was limited, however, and the presence of bile salts increased the intestinal permeability of this compound over 5-fold by increasing partitioning of Jaspine B to lipophilic phase and tight junction opening (
Figure 6). However, since the TC infusion to the rat liver did not significantly alter the metabolic activity of sulfobromophthalein [
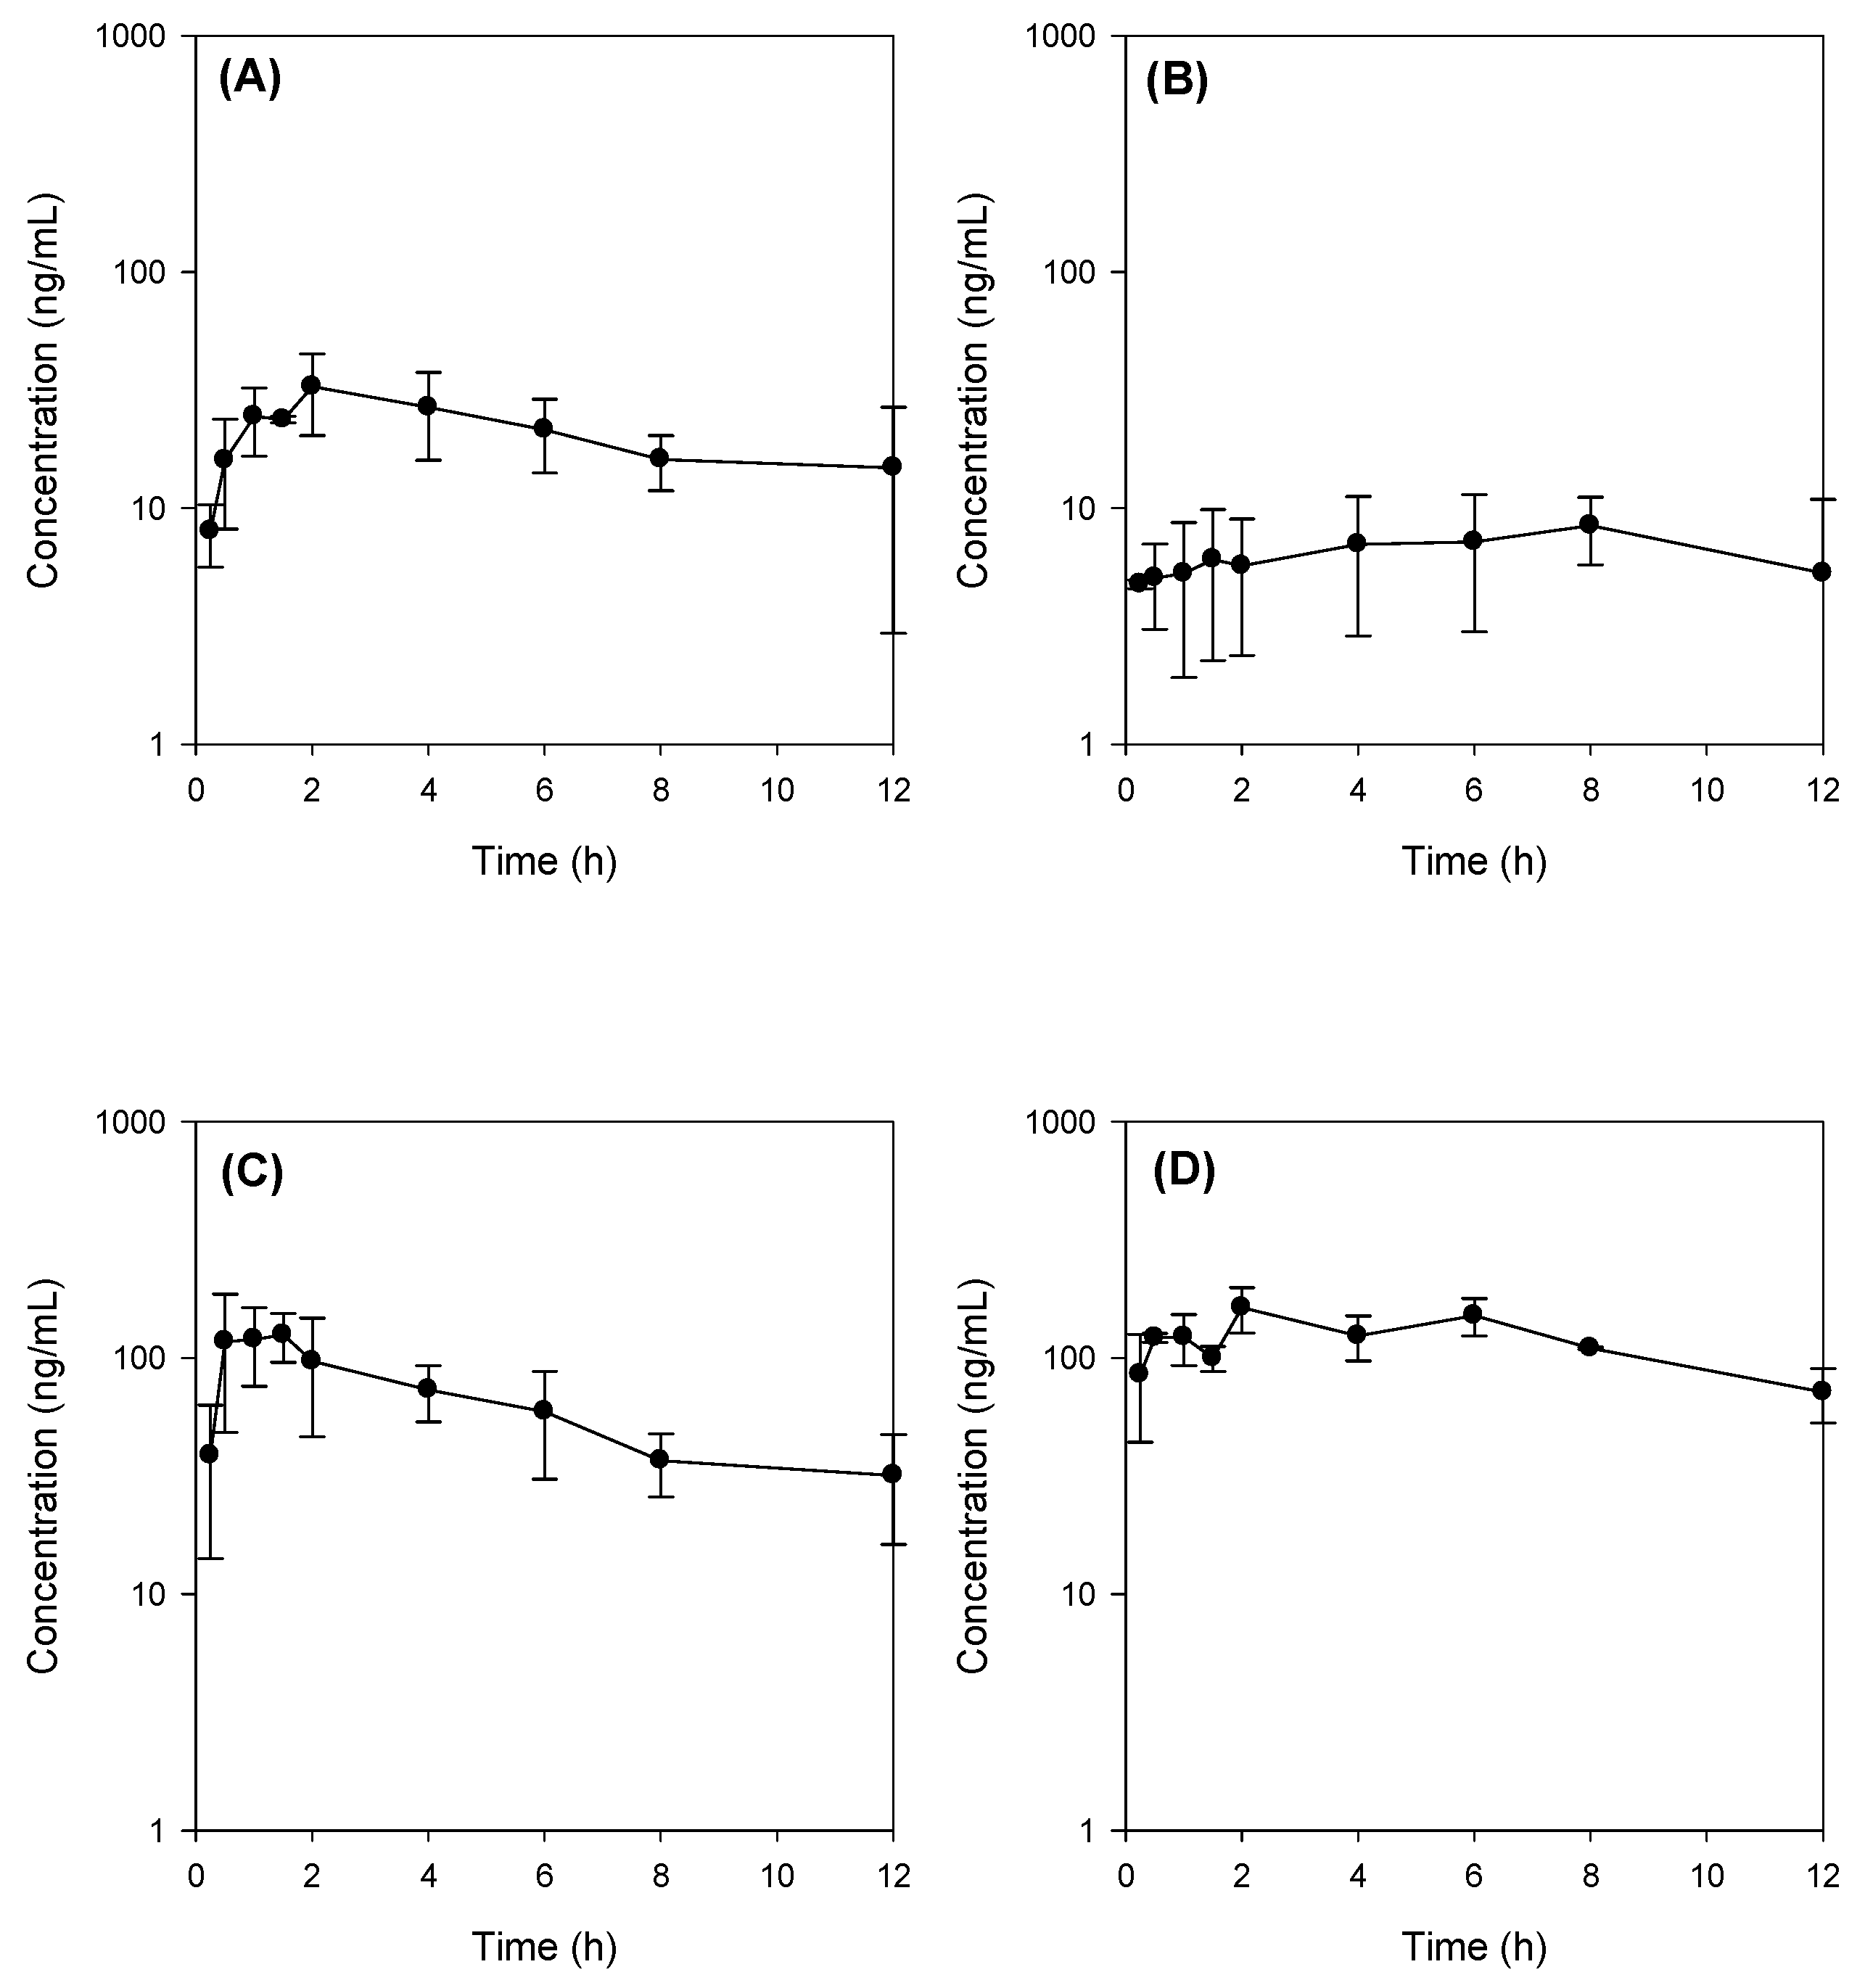
29], it is unlikely to conclude that concomitant administration of Jaspine B with TC inhibited metabolism of Jaspine B, and consequently increased BA of Jaspine B. To the contrary, the co-existence of Jaspine B with TC increased intestinal permeability and thereby increased the intestinal absorption and BA of Jaspine B. The results were consistent with a low oral BA of Jaspine B (6.2%) that decreased to 1.6% in bile-depleted rats, and after the co-addition of TC, oral BA increased to 23.5% in bile-depleted rats and 41.2% in control rats. Since the increased permeability of Jaspine B was the modulating factor that increased the low oral BA of Jaspine B and the permeability of Jaspine B in the rat intestine was very limited (0.11 × 10
−6 cm/s), the important factors for the low BA of Jaspine B can be elucidated as low intestinal permeability. In addition, the low oral BA was known to be attributed to the limited permeability, the chemical and enzymatic degradation of a drug in the gut lumen, and the intestinal or hepatic first-pass effect [
30]. The instability of Jaspine B in the gut lumen and the hepatic or intestinal first-pass effect also need to be investigated to elucidate the underlying mechanisms for the low BA of Jaspine B.
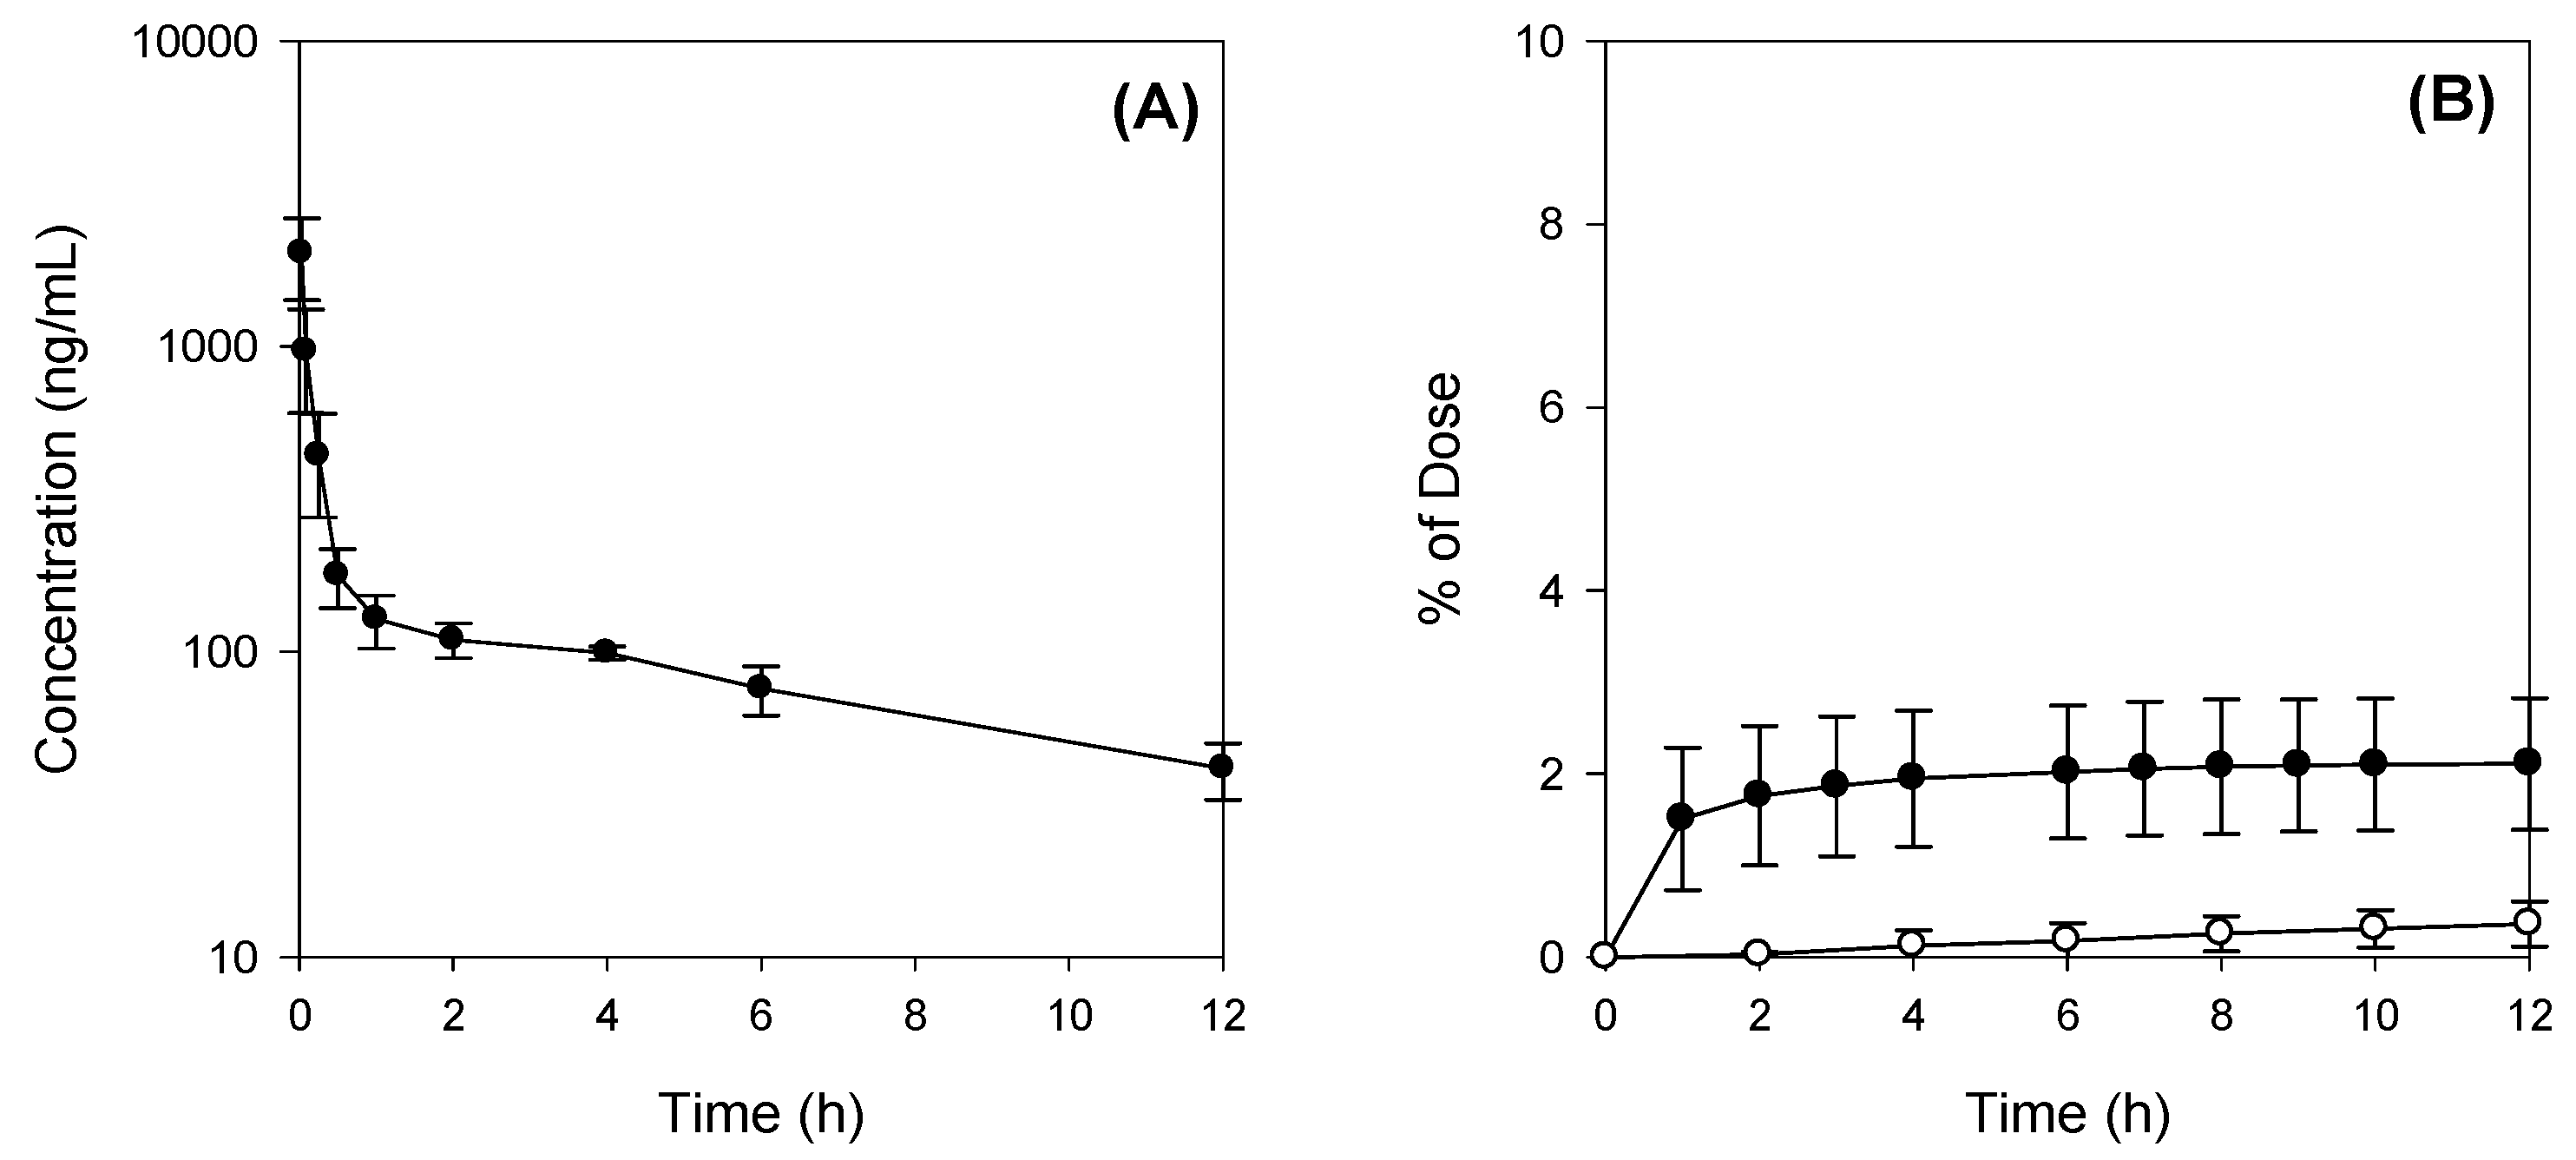
In our study, bile depletion was accomplished with 4 h drainage of bile through the bile cannula, which was evidenced by the 70% reduction of total bile salts concentration (from 50.1 ± 6.5 mM in control rats to 15.3 ± 5.7 mM) in bile drainage rats, which we named as bile-depleted rats. Since over 90% of bile salts were recirculated gut-liver-bile cycle [
31], a 70% decrease of bile salts concentration in the bile implicated the significant decrease of bile salts in the gut as well, which resulted in the decreased absorption of Jaspine B in bile-depleted rats (
Figure 5B). As a result of TC supplementation (60 mg/kg) with Jaspine B, which was suspended in 3 mL of DMSO: PEG400: saline solution, the TC concentration would be approximately 10 mM in the gut and could enhance the absorption of Jaspine B in rats from bile depletion + TC group and control + TC group (
Figure 5C,D).
These results could be applied to the development of oral Jaspine B formulations consisting of bile salts and lipophilic phospholipids, i.e., mixed micelle formulations [
32], to increase the permeability and lipophilicity of this compound. However, for the clinical and pharmaceutical application, the use of pharmaceutical excipients that enhance the transport without affecting tight junctions of intestine rather than high concentrations of TC would be the best approach. For example, SP1049C (Supratek Pharma Inc., Montreal, PQ, Canada), a doxorubicin-containing mixed-micelle formulation with Pluronic L61 and F127, showed increased cellular concentration of the doxorubicin in tumor cells and has reached clinical phase 3 study because of its superior antitumor activity compared with that of doxorubicin standard formulation [
33]. A phospholipid-Tween 80 mixed micelle formulation of paclitaxel showed higher anti-tumor activity and reduced systemic toxicity than Taxol formulation did [
34].
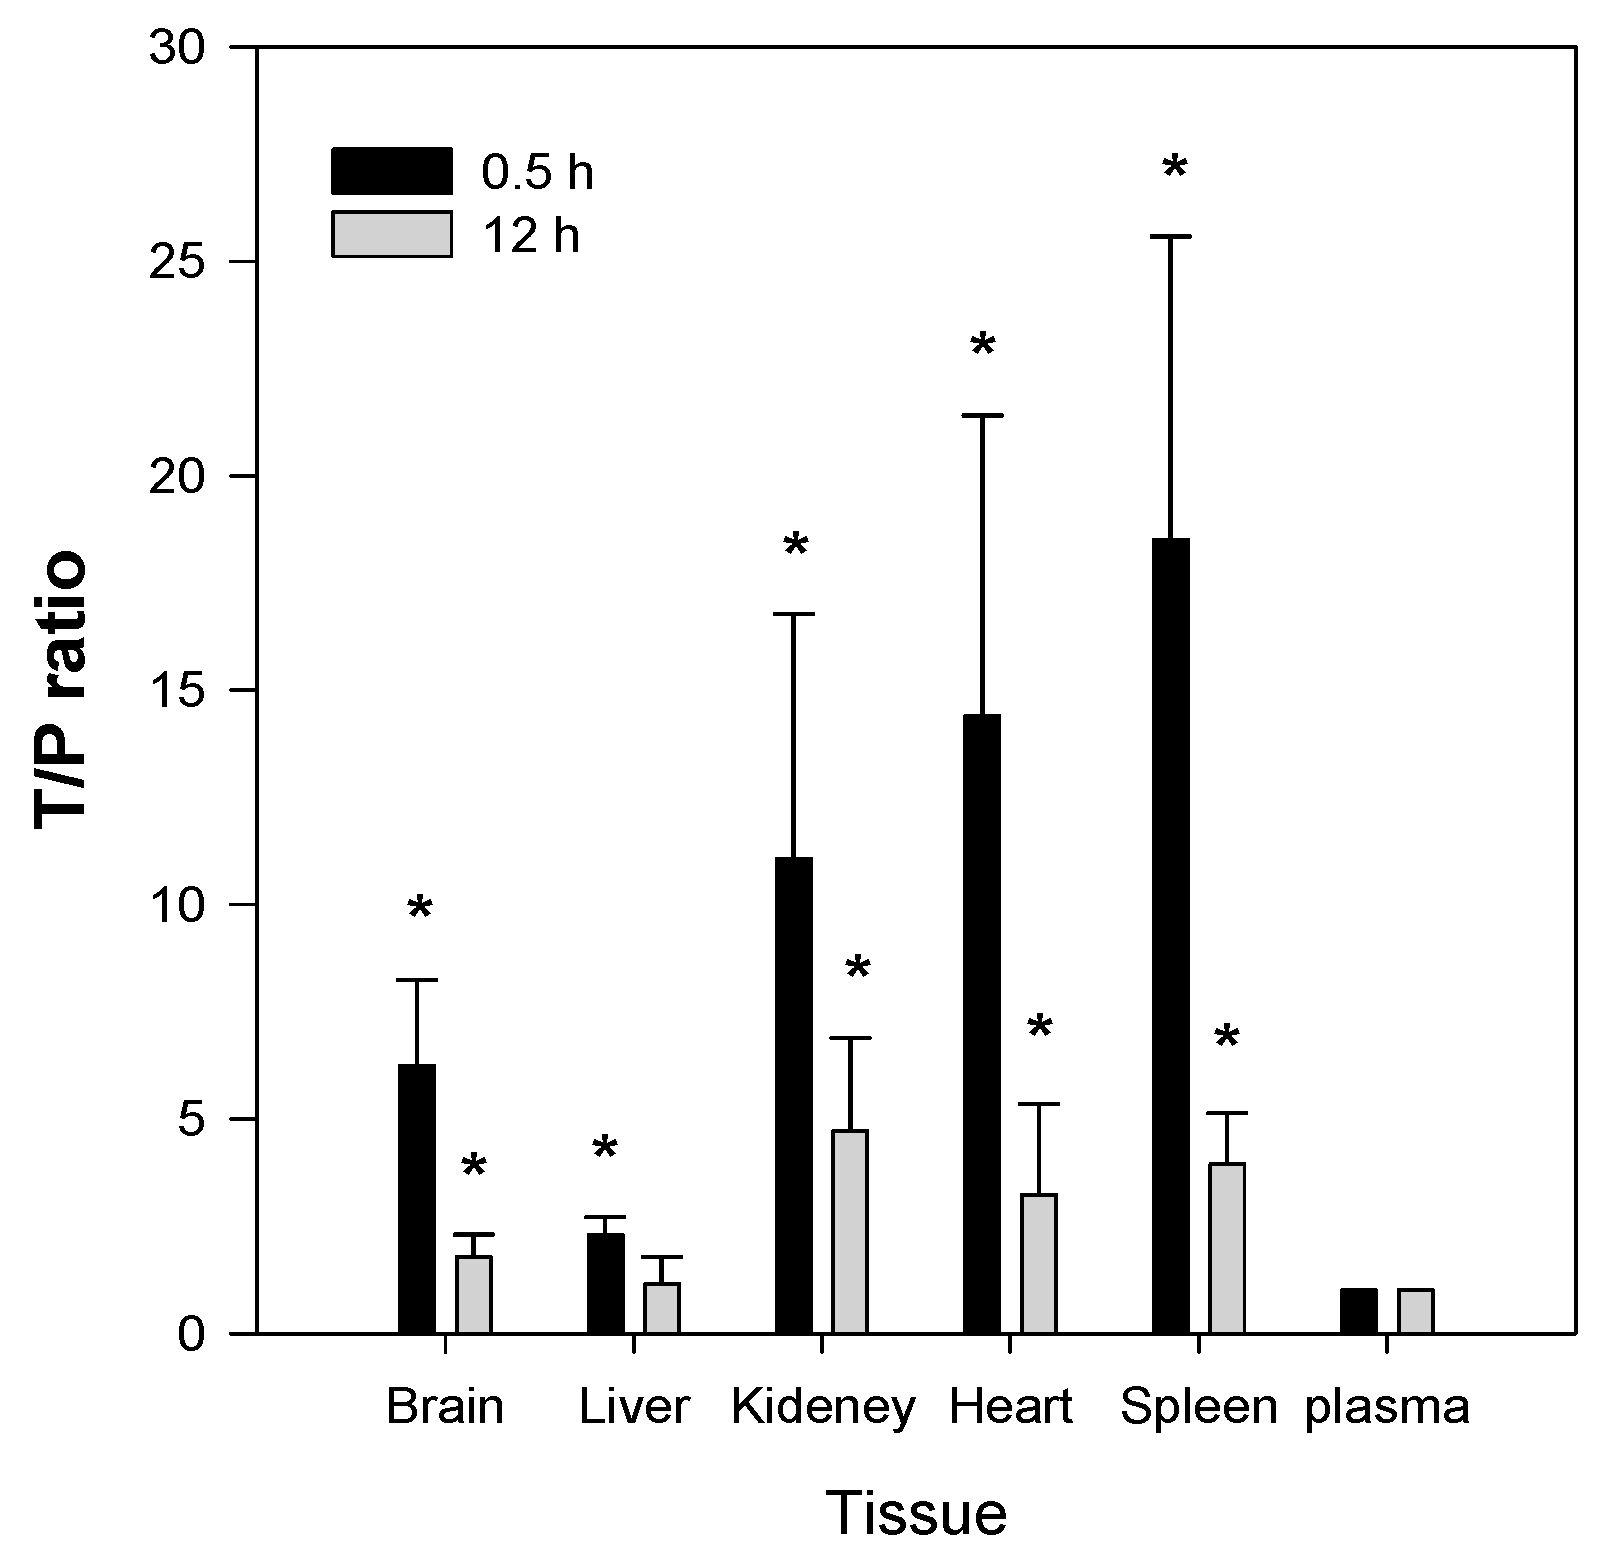
The second feature of Jaspine B is that it is highly distributed to tissues such as brain, kidney, heart, and spleen. The T/P ratios in these organs were 6.2, 11.1, 14.4, and 18.5, respectively, and remained elevated 2–4-fold 12 h after a single IV administration of Jaspine B (
Figure 7). Since we previously reported that the steady-state drug concentration was important for the anti-cancer efficacy of this compound [
19,
35,
36], the tissue distribution of Jaspine B is very important to predict the therapeutic efficacy of this compound. Moreover, this compound showed differential cytotoxicity depending on the cancer cell type, thus the highly tissue distributed features of this compound should be carefully considered in terms of drug response and toxicity. However, we should note that the use of PEG400 as a vehicle in the tissue distribution study (
Figure 7) might change the tissue distribution profile of Jaspine B because PEG400 has an ability to entrap of this compound in the spleen’s reticuloendothelial systems and thereby increase the in vivo metabolic stability compared with in vitro metabolic stability results (
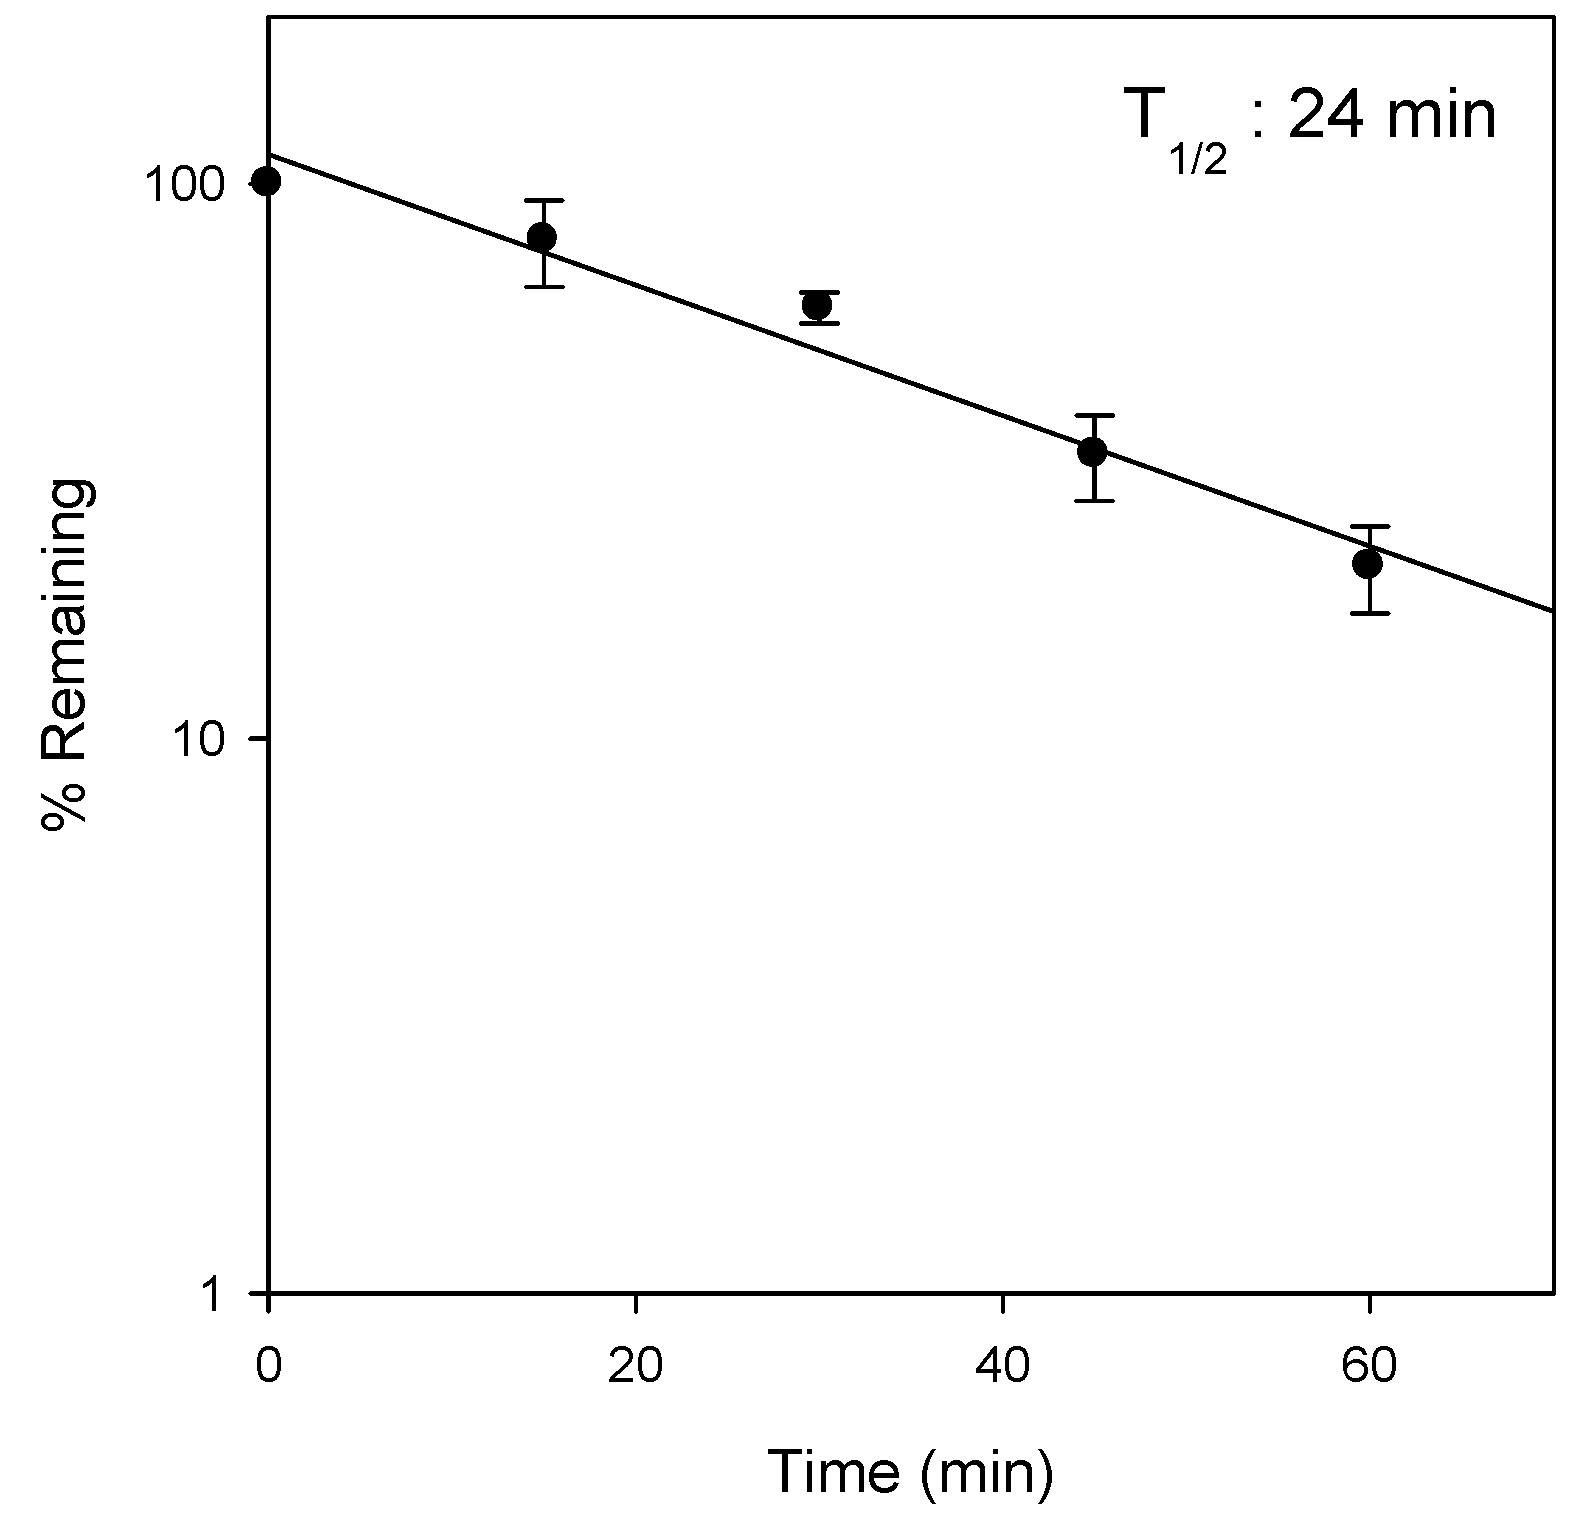
Figure 4).
In addition, the low the recovery from feces and urine (about 6.3% after IV administration) was consistent with the observed microsomal instability in the rat liver microsomes (
Figure 4), although the involvement CYP enzymes as well as the proposed metabolite structures were not investigated in this study. Therefore, identification of metabolites and the elucidation of the metabolic enzyme(s) involved will be necessary for future investigation. Moreover, since the metabolites of Jaspine B may have pharmacological activities on the inhibition of SphK1 and the inhibition of FOXO3 phosphorylaiton, the evaluation of the pharmacological activity or toxicity of the proposed metabolite would be of importance.
4. Materials and Methods
4.1. Reagents
Jaspine B was synthesized by Dr. D. Lee (Ajou University, Suwon, Korea) with a purity of over 99% and was confirmed by nuclear magnetic resonance (NMR) and mass spectroscopy results [
37]. Its structure is shown in
Figure 1.
Hank’s balanced salt solution (HBSS), taurocholate (TC), Lucifer yellow, dimethyl sulfoxide (DMSO), polyethylene glycol (PEG) 400, β-nicotinamide adenine dinucleotide (β-NAD), 3α-hydroxysteroid dehyrogenase (3α-HSD), EDTA, and Tris base were purchased from Sigma-Aldrich (St. Louis, MO, USA). Fetal bovine serum, Dulbecco’s Modified Eagle’s medium (DMEM), and penicillin-streptomycin were purchased from Hyclone Laboratories (Logan, UT, USA). All other reagents were reagent grade.
Rat liver microsomes (RLMs) from Sprague Dawley (SD) rats and the reaction solutions, including the NADH-generating system were purchased from BD-Corning (Corning, NY, USA).
A NaviCyte Ussing chamber system was obtained from Harvard Apparatus Co. (Holliston, MA, USA). Round metabolic cages for rats were purchased from Jungdo B&P Inc. (Seoul, Korea).
4.2. LC-MS/MS Analysis of Jaspine B
The concentrations of Jaspine B in the biological samples were analyzed using an Agilent 6430 Triple Quad LC/MS-MS system (Agilent, Wilmington, DE, USA) coupled with an Agilent Infinity 1290 series high performance liquid chromatography (HPLC) system. The separation was performed on a Synergi Polar RP column (2.0 mm i.d.× 150 mm, 4 μm, Phenomenex) using a mobile phase that consisted of acetonitrile and DDW (85:15, v/v) with 0.1% formic acid at a flow rate of 0.2 mL/min. Mass spectra were recorded by electrospray ionization in the positive mode. Quantification was performed using multiple reaction monitoring (MRM) at m/z 300.3→270.2 for Jaspine B and m/z 336.1→320.0 for berberine.
For the analytical validation of Jaspine B in plasma samples, the standard curve range was 25–5000 ng/mL and the concentrations of quality control (QC) samples were 75, 500, and 3000 ng/mL. The recovery of these spiked QC sample were in the range of 88.2–98.1%. Intra- and inter-day precision and accuracy had coefficients of variance of less than 10%. The stability of Jaspine B QC samples after 3 freeze thaw cycles were 83.9–94.4% and the short-term stability of these samples after standing for 6 h at room temperature was 94.3–100.1%.
The respective standard curve range and sample preparation methods in various biological samples from various experiments were described in detail in each experimental section.
4.3. Pharmacokinetics of Jaspine B
Male SD rats (aged 8–9 weeks, weighing 250–300 g) were obtained from Samtako Bio Korea, Inc. (Osan, Korea). The rats were acclimatized for 1 week in a temperature-controlled room (23 ± 2 °C) with a 12-h illumination cycle. Food and water were given ad libitum. All animal procedures were approved by the Animal Care and Use Committee of the Kyungpook National University (No. 2015-0064). The rats were fasted for at least 12 h before the oral administration of drugs.
The femoral artery, femoral vein, and bile duct were cannulated with polyethylene tubes (PE-50 and PE-10; Jungdo, Seoul, Korea) under light anesthesia with isoflurane.
For intravenous (IV) dosing, Jaspine B was dissolved in a vehicle containing DMSO: PEG400: saline (2:4:4, v/v/v) and was IV-injected via the femoral vein at 10 mg/kg (vehicle volume, 1 mL/kg). Blood samples were collected from the femoral artery at 0, 0.083, 0.167, 0.25, 0.5, 1, 2, 4, 6, 8, and 12 h following the IV administration of Jaspine B. Bile and urine samples were collected every 2 h for a total of 12 h. After centrifugation of blood samples at 13,200 rpm for 10 min, aliquots of 50 μL of plasma, bile, and urine were stored at −80 °C until the analysis of Jaspine B.
In the experiment using metabolic cages, feces were collected at 12, 24, 48, and 72 h following the IV administration of Jaspine B (10 mg/kg). Aliquots of 50 μL of urine and 10% feces homogenates were stored at −80 °C until the analysis.
Aliquots (50 μL) of plasma, bile, feces homogenates, and urine samples were added to 250 μL of acetonitrile containing 0.5 ng/mL of berberine (an internal standard). After vortexing for 10 min and centrifugation at 13,200 rpm for 5 min, an aliquot (2 μL) of the supernatant was injected directly into the LC-MS/MS system. For the analysis of plasma concentration, the standard curve range was 25–5000 ng/mL and the concentrations of quality control (QC) samples were 75, 500, and 3000 ng/mL, as described previously. Concentrations of Jaspine B in urine, bile, and feces homogenates were 5–300 ng/mL, 20–5000 ng/mL, and 20–5000 ng/mL, respectively. The concentrations of QC samples were 15, 100, and 300 ng/mL for urine samples and 75, 500, and 3000 ng/mL for bile and feces homogenates.
For oral dosing, Jaspine B was dissolved in a vehicle containing DMSO: PEG400: saline (2:4:4, v/v/v) and was administered by oral gavages at a single dose of 30 mg/kg of Jaspine B concomitantly with or without 60 mg/kg TC (vehicle volume, 3 mL/kg) to the control and bile-depleted rats. Bile depletion was accomplished with 4 h drainage of bile through the bile cannula, which was cannulated to the bile duct using PE-10 tubing.
Blood samples (approximately 250 μL each) were collected from the femoral artery at 0, 0.25, 0.5, 1, 1.5, 2, 4, 8, and 12 h following the oral administration of Jaspine B. After centrifugation of blood samples at 13,200 rpm for 10 min, plasma samples (50 μL) were collected and stored at −80 °C until the analysis by liquid chromatography tandem-mass spectrometry (LC-MS/MS). Aliquots (50 μL) of plasma samples were added to 250 μL of acetonitrile containing 0.5 ng/mL of berberine (an internal standard). After vortexing for 10 min and centrifugation at 13,200 rpm for 5 min, an aliquot (10 μL) of the supernatant was injected directly into the LC-MS/MS system. The standard curve range was 5–2000 ng/mL and the concentrations of quality control (QC) samples were 60, 300, and 2000 ng/mL. Standard curves showed good linearity (R2 > 0.999) and the interday accuracy and precision was 99.0–105.1% and 0.3–6.9%, respectively.
4.4. Tissue Distribution of Jaspine B
Jaspine B was dissolved in a vehicle containing DMSO: PEG400: saline (2:4:4, v/v/v) and IV-injected via the femoral vein at a dose of 10 mg/kg (vehicle volume, 1 mL/kg). Blood samples were collected from the abdominal artery and animals were euthanized at 0.5 h and 12 h after IV dosing. The blood, brain, liver, kidney, heart, and spleen were immediately excised, gently washed with ice-cold saline, and weighed. The tissue samples were homogenized with 9 volumes of saline. Aliquots of 50 μL of tissue homogenates and plasma were stored at −80 °C until the analysis.
Aliquots (50 μL) of plasma and tissue homogenates were added to 250 μL of acetonitrile containing 0.5 ng/mL of berberine. After vortexing for 10 min and centrifugation at 13,200 rpm for 5 min, an aliquot (2 μL) of the supernatant was injected directly into the LC-MS/MS system. For the analysis of plasma and tissue concentration, the standard curves with a range of 5–1000 ng/mL in the blank plasma and 10% bank tissue homogenates from brain, liver, kidney, heart, and spleen were prepared, and the concentrations of quality control (QC) samples of respective plasma and tissue homogenates were 25 and 750 ng/mL. The recovery of these spiked QC samples were in the range of 73.6–112.2% in all tissue homogenates. Intra- and inter-day precision and accuracy had coefficients of variance of less than 15%.
4.5. Metabolic Stability of Jaspine B in Rat Liver Microsomes (RLMs)
Jaspine B (1 μM) was reconstituted in 100 mM potassium phosphate buffer (pH 7.4) containing 0.25 mg of RLMs and was pre-incubated for 5 min at 37 °C. The reaction was initiated by adding an NADPH-generating system (1.3 mM
β-NADP, 3.3 mM glucose-6-phosphate, 3.3 mM MgCl
2, and 1.0 unit/mL glucose-6-phosphate dehydrogenase) and then incubated (final volume 100 μL) for 0, 15, 30, and 60 min at 37 °C in a shaking water bath. The reaction was stopped by placing the incubation tubes on ice and adding 200 μL of ice-cold acetonitrile containing 0.5 ng/mL of berberine. After vortexing for 10 min and centrifugation at 13,200 rpm for 5 min, 2 μL of the supernatant was injected directly into the LC-MS/MS system. We also determined the metabolic stability of 1 μM propranolol and 1 μM metformin as a positive and negative control, respectively, using the same procedure [
38]. The remaining % of propranolol and metformin after 60 min incubation was 12.2% and 63.4% of initial concentration, indicating the feasibility of this system.
4.6. Determination of Bile Salts Concentration in Bile
Total bile salt concentrations in bile samples were determined by means of an enzymatic-fluorometric assay with the slight modification of Choi at al. [
20]. Briefly, bile samples were collected. Fifty μL aliquots of standard TC solutions (5, 10, 25, 50, 100, 200 μM), bile samples were added to 950 μL of reaction buffer containing 1mM
β-nicotinamide adenine dinucleotide (
β-NAD), 50 μU 3
α-hydroxysteroid dehyrogenase (3
α-HSD), 0.385 mM EDTA and 760 mM Tris (pH 9.5), followed by incubation at 37 °C for 30 min. The reaction was quenched by the addition of 3 mL of ice cold water and the fluorescence was measured at an excitation wavelength of 340 nm and an emission wavelength of 465 nm.
4.7. Determination of the Intestinal Permeability of Jaspine B
For the measurement of the effect of TC on the tight junction of biological membranes, the permeability of 50 μM Lucifer yellow, a marker of paracellular permeation [
21], was measured in the presence of TC (0, 0.1, 1, 10, 100 mM). Prior to the experiment, ileal segments from SD rats (about 20 cm) were placed in the chambers and were submerged in fresh, prewarmed (37 °C) HBSS for 15 min for acclimatization. The chambers were continuously bubbled with carbogen gas (5% CO
2/ 95% O
2) during the experiment. The experiments began by replacing the HBSS with HBSS containing 50 μM Lucifer yellow and various concentrations of TC on the apical side (A) and adding fresh HBSS to the basal side (B). Aliquots (400 μL) of media were withdrawn from the receiver compartment (B) after 0, 20, 40, 60, and 80 min, and the volume of liquid in the receiver compartment was replenished with fresh, prewarmed HBSS after each sampling. Aliquots (200 μL) of all samples were used for the determination of Lucifer yellow concentration. The fluorescence of Lucifer yellow in the samples was measured using a fluorescence spectrophotometer (Infinite 200 PRO, Tecan, Switzerland) with excitation at 425 nm and emission at 535 nm.
A to B and B to A permeability of Jaspine B was measured in the presence of TC and rat bile. One mL of HBSS containing 50 μM Jaspine B and 10 mM TC or 20% bile was added to the donor side and 1 mL of preheated fresh HBSS was added to the receiver side. Aliquots (400 μL) of media were withdrawn at 0, 20, 40, 60, and 80 min from the receiver compartment as described above. Aliquots (50 μL) of all samples were stored at −80 °C until analysis.
Aliquots (50 μL) of all samples were added to 250 μL of acetonitrile containing 0.5 ng/mL of berberine. After vortexing for 10 min and centrifugation at 13,200 rpm for 5 min, 2 μL of the supernatant was injected directly into the LC-MS/MS system.
4.8. Effect of TC on the Lipophilicity of Jaspine B
The effect of TC on the apparent partition coefficients (APC) of Jaspine B between aqueous and organic phases was investigated [
26].
n-Octanol and phosphate-buffered saline (PBS, pH 7.4) were used as the organic and aqueous phases, respectively, in the partition study.
n-Octanol and PBS were saturated with respect to one another prior to use. An equal volume of
n-octanol was added to PBS (5 mL each) containing Jaspine B (10 mM) and TC (0, 0.1, 1, 10, or 100 mM) in a screw-capped test tube, and the mixture was vortexed vigorously for 5 min followed by shaking for 2 h at 25 °C in a temperature-controlled water bath. After standing for 1 h at 25 °C in the water bath, the mixture was separated into two phases by centrifugation at 3000 rpm for 10 min. The concentration of Jaspine B in a 50-μL aliquot of aqueous and organic phase was measured. Briefly, 50 μL of sample was added to 250 μL of acetonitrile containing 0.5 ng/mL of berberine. After vortexing for 10 min and centrifugation at 13,200 rpm for 5 min, an aliquot (2 μL) of the supernatant was injected directly into the LC-MS/MS system. The APC was calculated from the concentration ratio of each compound between the octanol and PBS phases.
4.9. Data Analysis
Pharmacokinetic parameters were determined using a non-compartmental analysis (WinNonlin
® 2.0; Pharsight, Mountain View, CA, USA). Maximum plasma concentration (C
max) and time to reach C
max (T
max) values were obtained from plasma concentration-time curves. The area under the plasma concentration–time curve from zero to infinity (AUC) was calculated using the trapezoidal-extrapolation method. For extrapolation, the area from the last data point to infinity was estimated by dividing the terminal-phase rate constant by plasma concentration at the last time point. Oral bioavailability was calculated by dividing AUC
PO, which was normalized by Jaspine B dose (30 mg/kg) by AUC
IV, which was also normalized by IV dose of Jaspine B (10 mg/kg):
However, in the case of bile-depleted rats, AUC
∞ and T
1/2 were not calculated because the elimination rate constant could not be obtained. Therefore, the oral bioavailability of Jaspine B was calculated as follows:
Total systemic clearance (CLtotal) was calculated by dividing IV dose by plasma AUC and the apparent volume of distribution at steady-state (Vss) was calculated by multiplying mean residence time (MRT) by CLtotal. Urinary and biliary clearances of Jaspine B (CLurine and CLbile) were estimated by dividing the total amount of Jaspine B excreted into urine and bile, respectively, for the 0–12 h period by plasma AUC.
The apparent permeability (P
app) of the drug was calculated by dividing the initial drug transport rate (dQ/dt, pmol/min) by the initial drug concentration in the donor compartment of the insert (C
o) multiplied by the surface area of the insert (A, cm
2) [
22]:
Data are expressed as the means ± standard deviations (S.D.), and statistical significance was determined by t-test using SPSS software version 16.1.


