Valorization of Aquaculture By-Products of Salmonids to Produce Enzymatic Hydrolysates: Process Optimization, Chemical Characterization and Evaluation of Bioactives

 ,
,  , ,
, , 
Abstract
1. Introduction
2. Results and Discussion
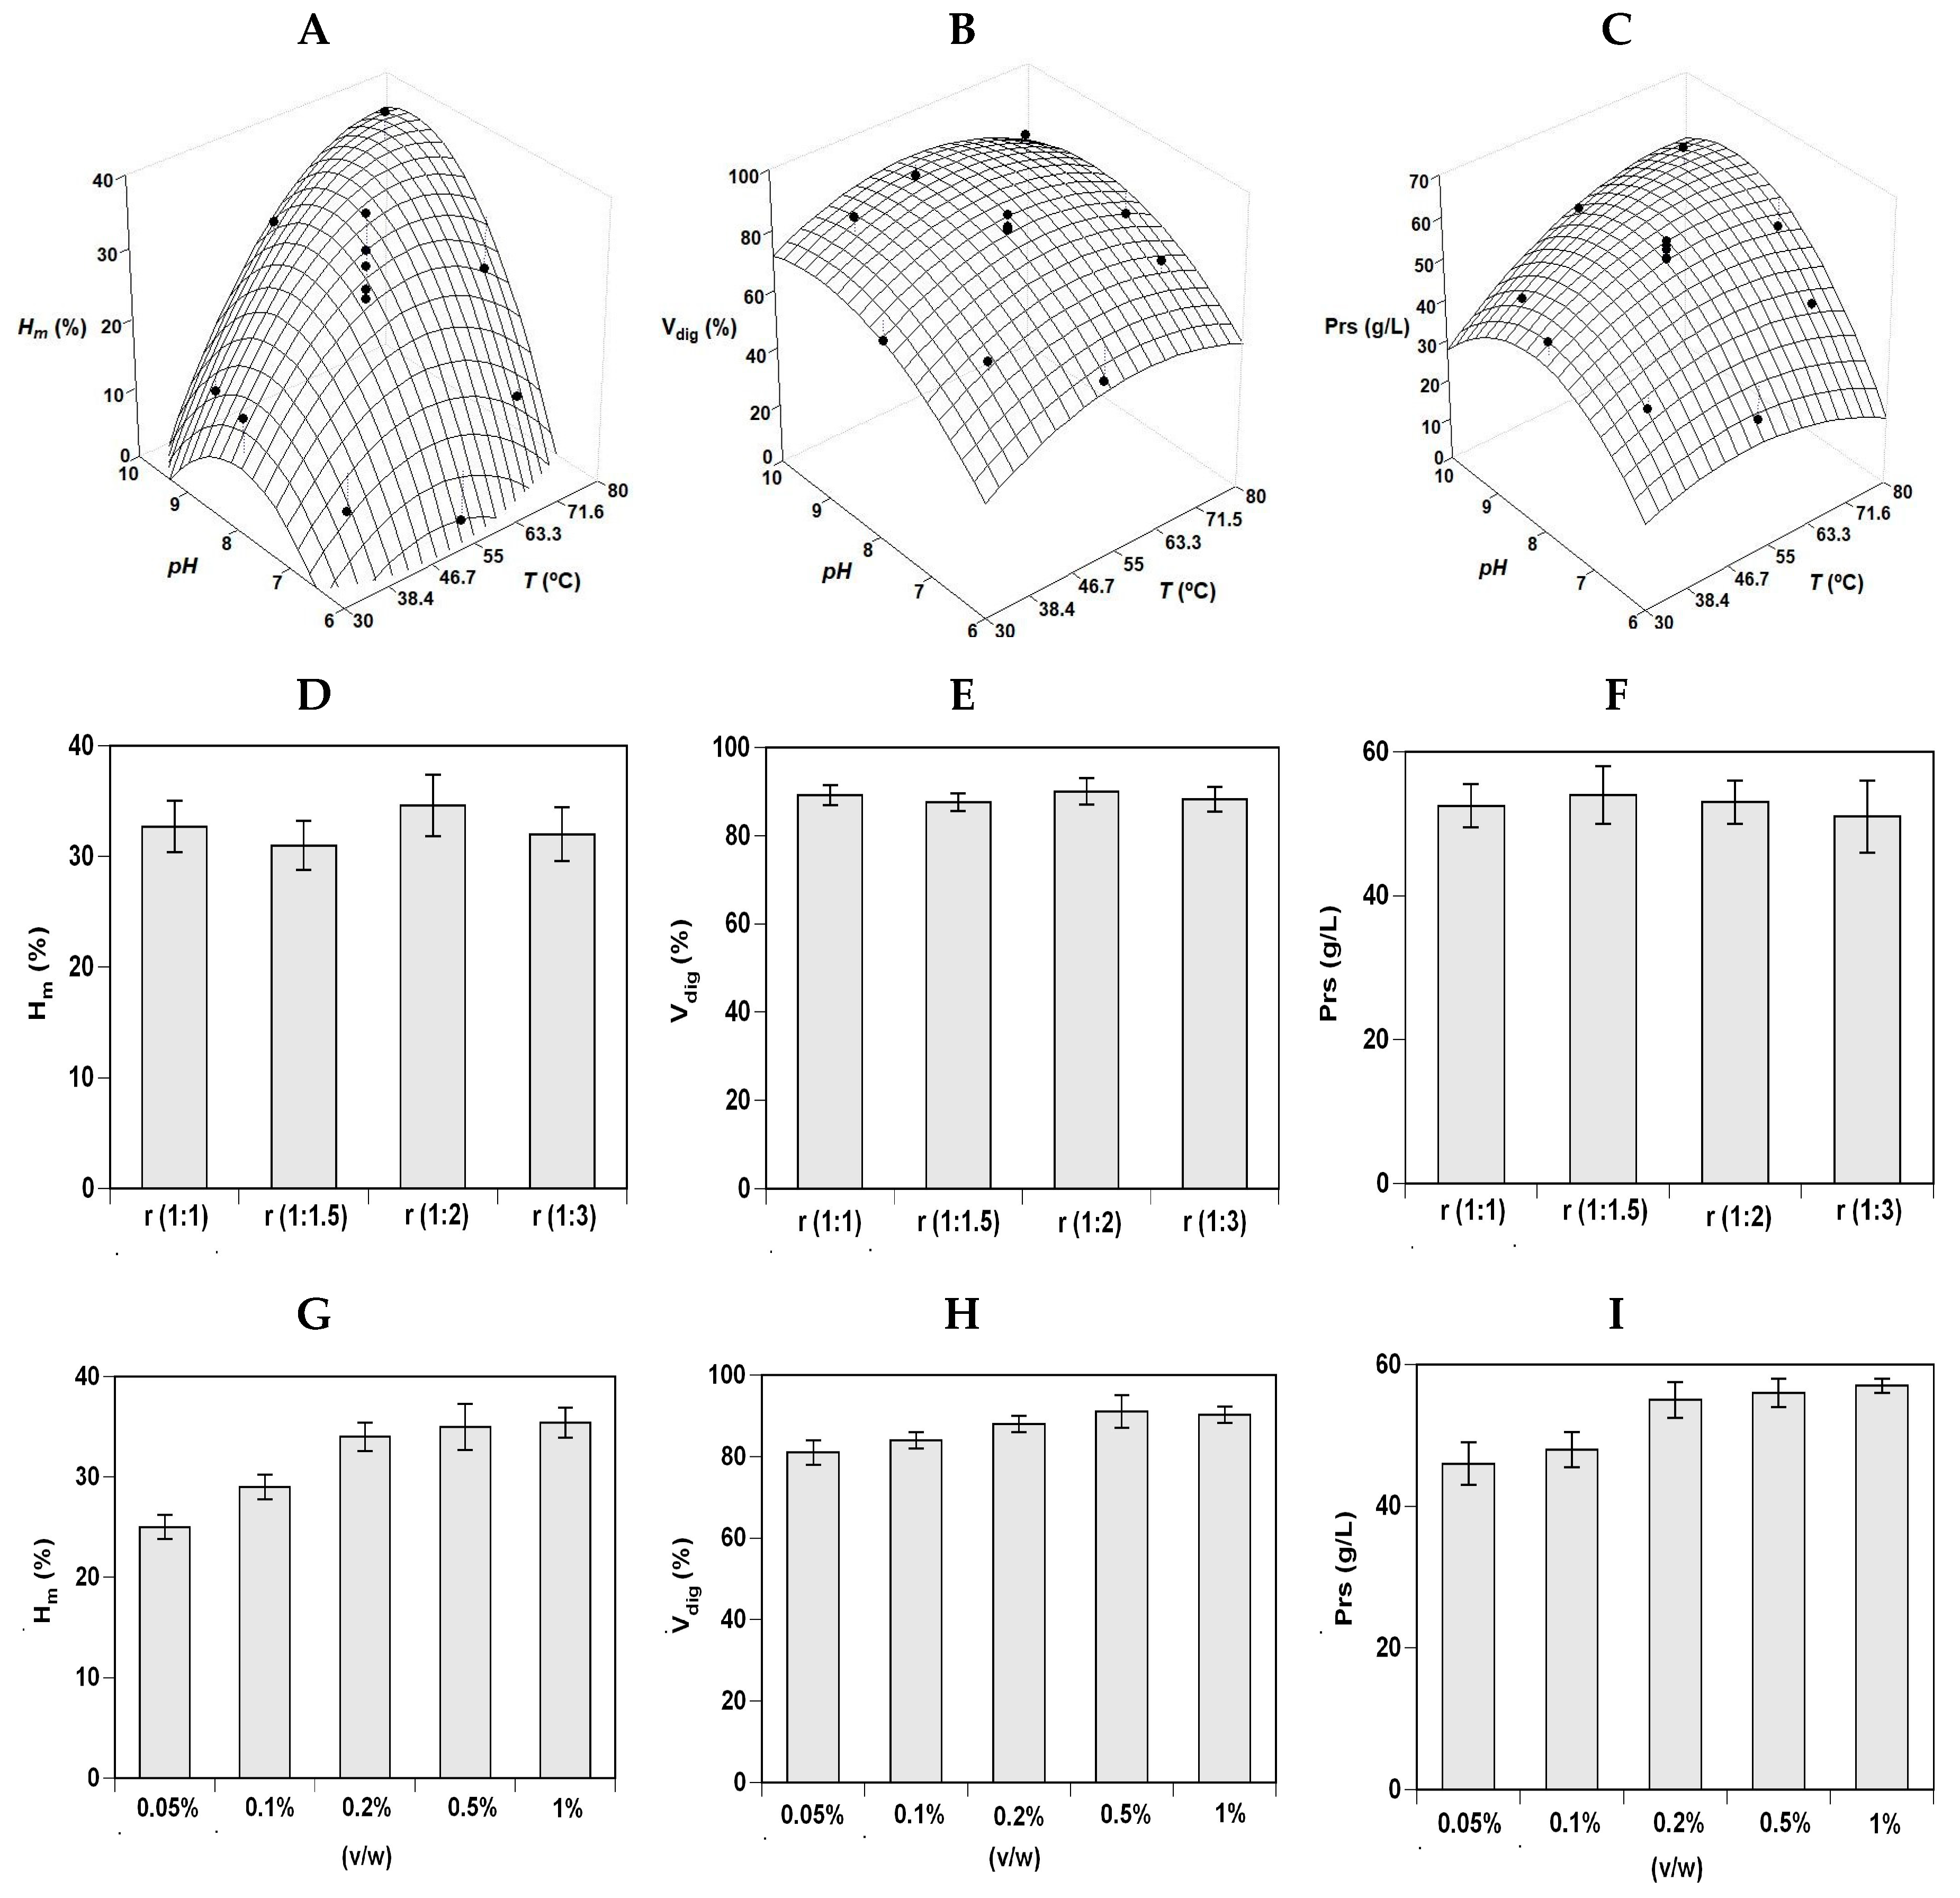
2.1. Optimization of Salmonid By-Products Hydrolysis
2.2. Production and Chemical Composition of FPHs
2.3. In Vitro Bioactivities of Hydrolysates from Salmonids By-Products
3. Materials and Methods
3.1. Fish Material Processing
3.2. Optimization of Enzyme Hydrolysis of Salmonid By-Products
3.3. Production of Enzymatic Hydrolysates from Salmonids By-Products
3.4. Chemical and Biological Analyses of Substrates and Bioproducts Obtained
3.5. Numerical and Statistical Analyses
4. Conclusions
Supplementary Materials
Author Contributions
Funding
Acknowledgments
Conflicts of Interest
References
- FAO. 2018. Available online: http://www.fao.org/state-of-fisheries-aquaculture (accessed on 20 July 2019).
- Nurdiani, R.; Dissanayake, M.; Street, W.E.; Donkor, O.N.; Singh, T.K.; Vasiljevic, T. Sustainable use of marine resources–turning waste into food ingredients. Int. J. Food Sci. Technol. 2015, 50, 2329–2339. [Google Scholar] [CrossRef]
- Liaset, B.; Nortvedt, R.; Lied, E.; Espe, M. Studies on the nitrogen recovery in enzymic hydrolysis of Atlantic salmon (Salmo salar, L.) frames by Protamex™ protease. Process Biochem. 2002, 37, 1263–1269. [Google Scholar] [CrossRef]
- Mock, T.S.; Francis, D.S.; Jago, M.K.; Glencross, B.D.; Smullen, R.P.; Keast, R.S.J.; Turchini, G.M. The impact of dietary protein: Lipid ratio on growth performance, fatty acid metabolism, product quality and waste output in Atlantic salmon (Salmo salar). Aquaculture 2019, 501, 191–201. [Google Scholar] [CrossRef]
- He, S.; Franco, C.; Zhang, W. Process optimisation and physicochemical characterisation of enzymatic hydrolysates of proteins from co-products of Atlantic Salmon (Salmo salar) and Yellowtail Kingfish (Seriola lalandi). Int. J. Food Sci. Technol. 2012, 47, 2397–2404. [Google Scholar] [CrossRef]
- Blanco, M.; Vázquez, J.A.; Pérez-Martín, R.I.; Sotelo, C.G. Hydrolysates of fish skin collagen: An opportunity for valorizing fish industry byproducts. Mar. Drugs 2017, 15, 131. [Google Scholar] [CrossRef]
- Halim, N.R.A.; Yusof, H.M.; Sarbon, N.M. Functional and bioactive properties of fish protein hydolysates and peptides: A comprehensive review. Trends Food Sci. Technol. 2016, 51, 24–33. [Google Scholar] [CrossRef]
- Chalamaiah, M.; Dinesh Kumar, B.; Hemalatha, R.; Jyothirmayi, T. Fish protein hydrolysates: Proximate composition, amino acid composition, antioxidant activities and applications: A review. Food Chem. 2012, 135, 3020–3038. [Google Scholar] [CrossRef]
- Idowu, A.T.; Benjakul, S.; Sinthusamran, S.; Sookchoo, P.; Kishimura, H. Protein hydrolysate from salmon frames: Production, characteristics and antioxidative activity. J. Food Biochem. 2019, 43, e12734. [Google Scholar] [CrossRef]
- Vázquez, J.A.; Menduíña, A.; Durán, A.I.; Nogueira, M.; Fernández-Compás, A.; Pérez-Martín, R.I.; Rodríguez-Amado, I. Production of valuable compounds and bioactive metabolites from by-products of fish discards using chemical processing, enzymatic hydrolysis, and bacterial fermentation. Mar. Drugs 2019, 17, 139. [Google Scholar] [CrossRef]
- Batista, I.; Ramos, C.; Coutinho, J.; Bandarra, N.M.; Nunes, M.L. Characterization of protein hydrolysates and lipids obtained from black scabbardfish (Aphanopus carbo) byproducts and antioxidative activity of the hydrolysates produced. Proc. Biochem. 2010, 45, 18–24. [Google Scholar] [CrossRef]
- Nasri, R.; Younes, I.; Jridi, M.; Trigui, M.; Boutagef, A.; Nedjar-Arroume, N.; Dhulster, P.; Nasri, M.; Karra-Chaabouni, M. ACE-inhibitory and antioxidative activities of Goby (Zosterissessor ophiocephalus) (FPH): Effect on meat lipid oxidation. Food Res. Int. 2013, 54, 552–561. [Google Scholar] [CrossRef]
- Wang, L.; Sun, J.; Ding, S.; Qi, B. Isolation and identification of novel antioxidant and antimicrobial oligopeptides from enzymatically hydrolysed anchovy fish meal. Process Biochem. 2018, 74, 148–155. [Google Scholar] [CrossRef]
- García-Moreno, P.J.; Pérez-Gálvez, R.; Espejo-Carpio, R.J.; Ruiz-Quesada, C.; Pérez-Morilla, A.I.; Martínez-Agustín, O.; Guadix, A.; Guadix, E.M. Functional, bioactive and antigenicity properties of blue whiting protein hydrolysates: effect of enzymatic treatment and degree of hydrolysis. J. Sci. Food Agric. 2017, 97, 299–308. [Google Scholar] [CrossRef]
- Nørgaard, J.V.; Blaabjerg, K.; Poulsen, H.D. Salmon protein hydrolysate as a protein source in feed for young pigs. Anim. Feed Sci. Technol. 2012, 177, 124–129. [Google Scholar] [CrossRef][Green Version]
- Ospina-Salazar, G.H.; Ríos-Durán, M.G.; Toledo-Cuevas, E.M.; Martínez-Palacios, C.A. The effects of fish hydrolysate and soy protein isolate on the growth performance, body composition and digestibility of juvenile pike silverside, Chirostoma estor. Anim. Feed Sci. Technol. 2016, 220, 168–179. [Google Scholar] [CrossRef]
- Swanepoel, J.C.; Goosen, N.J. Evaluation of fish protein hydrolysates in juvenile African catfish (Clarias gariepinus) diets. Aquaculture 2018, 496, 262–269. [Google Scholar] [CrossRef]
- Opheim, M.; Strube, M.L.; Sterten, H.; Øverland, M.; Kjos, N.P. Atlantic salmon (Salmo salar) protein hydrolysate in diets for weaning piglets—Effect on growth performance, intestinal morphometry and microbiota composition. Arch. Anim. Nutr. 2016, 70, 44–56. [Google Scholar] [CrossRef]
- Vázquez, J.A.; Ramos, P.; Valcarcel, J.; Antelo, L.T.; Novoa-Carballal, R.; Reis, R.L.; Pérez-Martín, R.I. An integral and sustainable valorisation strategy of squid pen byproducts. J. Clean. Prod. 2018, 201, 207–218. [Google Scholar] [CrossRef]
- Vázquez, J.A.; Blanco, M.; Fraguas, J.; Pastrana, L.; Pérez-Martín, R.I. Optimisation of the extraction and purification of chondroitin sulphate from head by-products of Prionace glauca by environmental friendly processes. Food Chem. 2016, 198, 28–35. [Google Scholar] [CrossRef]
- Vázquez, J.A.; Ramos, P.; Mirón, J.; Valcarcel, J.; Sotelo, C.G.; Pérez-Martín, R.I. Production of chitin from Penaeus vannamei by-products to pilot plant scale using a combination of enzymatic and chemical processes and subsequent optimization of the chemical production of chitosan by response surface methodology. Mar. Drugs 2017, 15, 180. [Google Scholar] [CrossRef]
- Vázquez, J.A.; Blanco, M.; Massa, A.E.; Amado, I.R.; Pérez-Martín, R.I. Production of fish protein hydrolysates from Scyliorhinus canicula discards with antihypertensive and antioxidant activities by enzymatic hydrolysis and mathematical optimization using response surface methodology. Mar. Drugs 2017, 15, 306. [Google Scholar] [CrossRef] [PubMed]
- See, S.F.; Hoo, L.L.; Babji, A.S. Optimization of enzymatic hydrolysis of salmon (Salmo salar) skin by Alcalase. Int. Food Res. J. 2011, 18, 1359–1365. [Google Scholar]
- Gbogouri, G.A.; Linder, M.; Fanni, J.; Parmentier, M. Influence of hydrolysis degree on the functional properties of salmon byproducts hydrolysates. J. Food Sci. 2004, 69, C615–C622. [Google Scholar] [CrossRef]
- Rajabzadeh, M.; Pourashouri, P.; Shabanpour, B.; Alishahi, A. Amino acid composition, antioxidant and functional properties of protein hydrolysates from the roe of rainbow trout (Oncorhynchus mykiss). Int. J. Food Sci. Technol. 2018, 53, 313–319. [Google Scholar] [CrossRef]
- Nikoo, M.; Benjakul, S.; Gavlighi, H.A.; Xu, X.; Regenstein, J.M. Hydrolysates from rainbow trout (Oncorhynchus mykiss) processing byproducts: Properties when added to fish mince with different freeze-thaw cycles. Food Biosci. 2019, 30, 100418. [Google Scholar] [CrossRef]
- Vázquez, J.A.; Fernández-Compás, A.; Blanco, M.; Rodríguez-Amado, I.; Moreno, H.; Borderías, J.; Pérez-Martín, R.I. Development of bioprocesses for the integral valorisation of fish discards. Biochem. Eng. J. 2019, 144, 198–208. [Google Scholar] [CrossRef]
- Blanchet, C.; Michel Lucas, M.; Pierre Julien, P.; Morin, R.; Gingras, S.; Dewaily, E. Fatty acid Composition of wild and farmed Atlantic salmon (Salmo salar) and Rainbow Trout (Oncorhynchus mykiss). Lipids 2005, 40, 529–531. [Google Scholar] [CrossRef]
- Simopoulos, A.P.; DiNicolantonio, J.J. Mediterranean diet: ω-6 and ω-3 fatty acids and diabetes. Am. J. Clin. Nutr. 2017, 106, 953–954. [Google Scholar]
- FAO/WHO/UNU. Energy and Protein Requirements; Report of a Joint FAO/WHO/UNU Expert Consultation; World Health Organization: Geneva, Switzerland, 1985. [Google Scholar]
- FAO/WHO. Food and Agriculture Organization/World Health Organization Protein quality evaluation. In Proceedings of the Report of a Joint FAO/WHO Expert Consultation, Bethesda, MD, USA, 4–8 December 1989; FAO/WHO: Rome, Italy, 1990. [Google Scholar]
- Lapeña, D.; Vuoristo, K.S.; Kosa, G.; Horn, S.J.; Eijsink, V.G.H. Comparative assessment of enzymatic hydrolysis for valorization of different protein-rich industrial byproducts. J. Agric. Food Chem. 2018, 66, 9738–9749. [Google Scholar] [CrossRef]
- Nikoo, M.; Benjakul, S.; Yasemi, M.; Gavlighi, H.A.; Xu, X. Hydrolysates from rainbow trout (Oncorhynchus mykiss) processing byproduct with different pretreatments: Antioxidant activity and their effect on lipid and protein oxidation of raw fish emulsion. LWT—Food Sci. Technol. 2019, 108, 120–128. [Google Scholar] [CrossRef]
- Ahn, C.B.; Kim, J.G.; Je, J.Y. Purification and antioxidant properties of octapeptide from salmon byproduct protein hydrolysate by gastrointestinal digestion. Food Chem. 2014, 147, 78–83. [Google Scholar] [CrossRef] [PubMed]
- Wu, R.; Wu, C.; Liu, D.; Yang, X.; Huang, J.; Zhang, J.; Liao, B.; He, H. Antioxidant and anti-freezing peptides from salmon collagen hydrolysate prepared by bacterial extracellular protease. Food Chem. 2018, 248, 346–352. [Google Scholar] [CrossRef] [PubMed]
- Cheung, I.W.Y.; Cheung, L.K.Y.; Tan, N.Y.; Li-Chan, E.C.Y. The role of molecular size in antioxidant activity of peptide fractions from Pacific hake (Merluccius productus) hydrolysates. Food Chem. 2012, 134, 1297–1306. [Google Scholar] [CrossRef] [PubMed]
- Amado, I.R.; Vázquez, J.A.; González, M.P.; Murado, M.A. Production of antihypertensive and antioxidant activities by enzymatic hydrolysis of protein concentrates recovered by ultrafiltration from cuttlefish processing wastewaters. Biochem. Eng. J. 2013, 76, 43–54. [Google Scholar] [CrossRef]
- Taheri, A.; Farvin, K.H.S.; Jacobsen, C.; Baron, C.P. Antioxidant activities and functional properties of protein and peptide fractions isolated from salted herring brine. Food Chem. 2014, 142, 318–326. [Google Scholar] [CrossRef]
- Zhao, W.H.; Chi, C.F.; Zhao, Y.Q.; Wang, B. Preparation, physicochemical and antioxidant properties of acid- and pepsin-soluble collagens from the swim bladders of miiuy croaker (Miichthys miiuy). Mar. Drugs 2018, 16, 161. [Google Scholar] [CrossRef]
- Hayes, M.; Mora, L.; Hussey, K.; Aluko, R.E. Boarfish protein recovery using the pH-shift process and generation of protein hydrolysates with ACE-I and antihypertensive bioactivities in spontaneously hypertensive rats. Innov. Food Sci. Emerg. Technol. 2016, 37, 253–260. [Google Scholar] [CrossRef]
- Cinq-Mars, C.D.; Li-Chan, E.C. Optimizing angiotensin I-converting enzyme inhibitory activity of Pacific hake (Merluccius productus) fillet hydrolysate using response surface methodology and ultrafiltration. J. Agric. Food Chem. 2007, 55, 9380–9388. [Google Scholar] [CrossRef]
- García-Moreno, P.J.; Pérez-Gálvez, R.; Morales-Medina, R.; Guadix, A.; Guadix, E.M. Discarded species in the west Mediterranean sea as sources of omega-3 PUFA. Eur. J. Lipid Sci. Technol. 2013, 115, 982–989. [Google Scholar] [CrossRef]
- Pires, C.; Teixeira, B.; Cardoso, C.; Mendes, R.; Nunes, M.L.; Batista, I. Cape hake protein hydrolysates prepared from alkaline solubilised proteins pre-treated with citric acid and calcium ions: Functional properties and ACE inhibitory activity. Process Biochem. 2015, 50, 1006–1015. [Google Scholar] [CrossRef]
- Slizyte, R.; Rommi, K.; Mozuraityte, R.; Eck, P.; Five, K.; Rustad, T. Bioactivities of fish protein hydrolysates from defatted salmon backbones. Biotechnol. Rep. 2016, 11, 99–109. [Google Scholar] [CrossRef] [PubMed]
- Neves, A.C.; Harnedy, P.A.; O’Keeffe, M.B.; FitzGerald, R.J. Bioactive peptides from Atlantic salmon (Salmo salar) with angiotensin converting enzyme and dipeptidyl peptidase IV inhibitory, and antioxidant activities. Food Chem. 2017, 218, 396–405. [Google Scholar] [CrossRef] [PubMed]
- Ketnawa, S.; Suwal, S.; Huang, J.Y.; Liceaga, A.M. Selective separation and characterisation of dual ACE and DPP-IV inhibitory peptides from rainbow trout (Oncorhynchus mykiss) protein hydrolysates. Int. J. Food Sci. Technol. 2019, 54, 1062–1073. [Google Scholar] [CrossRef]
- Box, G.E.; Hunter, J.S.; Hunter, W.G. Statistics for Experimenters: Design, Innovation, and Discovery; Wiley-Interscience: New York, NY, USA, 2005. [Google Scholar]
- Adler-Nissen, J. Enzymic Hydrolysis of Food Proteins; Elsevier Applied Science Publishers: New York, NY, USA, 1986. [Google Scholar]
- AOAC. Association of Official Analytical Chemistry. Methods of Analysis, 15th ed.; AOAC: Washington, DC, USA, 1997. [Google Scholar]
- Bligh, E.G.; Dyer, W.J. A rapid method of total lipid extraction and purification. Can. J. Biochem. Physiol. 1959, 37, 911–917. [Google Scholar] [CrossRef]
- Lepage, G.; Roy, C.C. Direct transesterification of all classes of lipids in a one-step reaction. J. Lipid Res. 1986, 27, 114–120. [Google Scholar]
- Dubois, M.; Gilles, K.A.; Hamilton, J.K.; Rebers, P.A.; Smith, F. Colorimetric method for determination of sugars and related substances. Anal. Chem. 1956, 28, 350–356. [Google Scholar] [CrossRef]
- Lowry, O.H.; Rosebrough, N.J.; Farr, A.L.; Randall, R.J. Protein measurement with the Folin phenol reagent. J. Biol. Chem. 1951, 193, 265–275. [Google Scholar]
- Moore, S.; Spackman, D.H.; Stein, W.H. Chromatography of amino acids on sulfonated polystyrene resins. An improved system. Anal. Chem. 1958, 30, 1185–1190. [Google Scholar] [CrossRef]
- Miller, E.L.; Bimbo, A.P.; Walters, D.E.; Barlow, S.M.; Sheridan, B. Determination of nitrogen solubility in dilute pepsin hydrochloric acid solution of fishmeal: Interlaboratory study. J. AOAC Int. 2002, 85, 1374–1381. [Google Scholar]
- Prieto, M.A.; Curran, T.; Gowen, A.; Vázquez, J.A. An efficient methodology for quantification of synergy and antagonism in single electron transfer antioxidant assays. Food Res. Int. 2015, 67, 284–298. [Google Scholar] [CrossRef]
- Prieto, M.A.; Vázquez, J.A.; Murado, M.A. Crocin bleaching antioxidant assay revisited. Application to microplate to analyse antioxidant and prooxidant activities. Food Chem. 2015, 167, 299–310. [Google Scholar] [CrossRef] [PubMed]
- Estévez, N.; Fuciños, P.; Sobrosa, A.C.; Pastrana, L.; Pérez, N.; Rúa, M.L. Modeling the angiotensinconverting enzyme inhibitory activity of peptide mixtures obtained from cheese whey hydrolysates using concentration-response curves. Biotechnol. Prog. 2012, 28, 1197–1206. [Google Scholar] [CrossRef] [PubMed]


| FPHs | Mo (%) | OM (%) | Ash (%) | Lip (%) | Pr-tN (%) | Pr-tN * (%) |
|---|---|---|---|---|---|---|
| RT_H | 69.6 ± 0.2 | 27.7 ± 0.2 | 2.7 ± 0.1 | 47.7 ± 0.4 | 35.2 ± 1.0 | 66.1 ± 3.4 |
| RT_TF | 66.5 ± 0.9 | 30.6 ± 0.4 | 3.0 ± 0.5 | 44.0 ± 0.9 | 45.1 ± 2.3 | 84.5 ± 2.5 |
| S_H | 62.6 ± 1.0 | 34.7 ± 1.2 | 2.7 ± 0.6 | 54.3 ± 0.3 | 30.1 ± 1.0 | 78.3 ± 4.0 |
| S_TF | 63.1 ± 0.5 | 34.0 ± 1.0 | 2.9 ± 0.3 | 46.2 ± 0.9 | 44.8 ± 2.0 | 82.9 ± 3.0 |
| Second Order Models | Topt (°C) | pHopt | Ymax | ||
|---|---|---|---|---|---|
| RT_H | Hm (%) = 27.10 + 2.72 pH – 9.16 T2 – 6.39 pH2 | 0.909 | 55.0 | 8.30 | 30.1% |
| Vdig (%) = 83.34 – 2.35 T + 3.21 pH – 12.17 T2 – 6.86 pH2 | 0.759 | 53.3 | 8.33 | 83.8% | |
| Prs (g/L) = 55.4 + 4.42 T + 3.60 pH + 2.25 T pH – 8.19 T2 – 13.1 pH2 | 0.869 | 60.2 | 8.17 | 56.3 g/L | |
| S_H | Hm (%) = 29.44 + 5.30 T + 8.54 pH – 5.36 T2 – 7.30 pH2 | 0.803 | 63.8 | 8.83 | 33.3% |
| Vdig (%) = 85.72 + 2.11 T + 8.76 pH – 5.62 T2 – 5.62 pH2 | 0.779 | 58.4 | 9.10 | 89.3% | |
| Prs (g/L) = 54.71 + 3.49 T + 6.77 pH + 3.25 T pH – 3.30 T2 – 6.82 pH2 | 0.902 | 70.5 | 9.00 | 58.6 g/L |
| FPHs | Hm (%) | β (Dimensionless) | τ (min) | vm (% min−1) | R2 | p-Values |
|---|---|---|---|---|---|---|
| RT_H | 29.66 ± 0.17 | 0.801 ± 0.008 | 32.07 ± 0.37 | 0.257 ± 0.004 | 0.999 | <0.005 |
| RT_TF | 30.94 ± 0.25 | 0.807 ± 0.011 | 34.19 ± 0.56 | 0.253 ± 0.005 | 0.999 | <0.005 |
| S_H | 31.55 ± 0.06 | 0.770 ± 0.006 | 15.85 ± 0.11 | 0.531 ± 0.004 | 1.000 | <0.005 |
| S_TF | 34.27 ± 0.10 | 0.756 ± 0.007 | 18.41 ± 0.14 | 0.488 ± 0.005 | 0.999 | <0.005 |
| FPHs | mb (%) | Voil (%) | Vdig (%) | Prs (g/L) | Pr-tN (g/L) | TS (g/L) | Dig (%) |
|---|---|---|---|---|---|---|---|
| RT_H | 9.98 ± 1.31 | 9.36 ± 0.75 | 88.4 ± 1.2 | 47.8 ± 4.8 | 53.1 ± 1.9 | 1.40 ± 0.10 | 92.5 ± 3.2 |
| RT_TF | 9.43 ± 0.52 | 10.63 ± 0.42 | 84.4 ± 1.1 | 53.9 ± 5.1 | 58.4 ± 2.7 | 1.22 ± 0.10 | 93.2 ± 2.5 |
| S_H | 11.13 ± 1.36 | 11.37 ± 0.60 | 89.8 ± 0.7 | 61.0 ± 1.3 | 64.2 ± 3.1 | 1.29 ± 0.09 | 93.0 ± 2.2 |
| S_TF | 11.59 ± 0.44 | 9.30 ± 0.12 | 86.3 ± 1.1 | 69.7 ± 2.1 | 71.1 ± 2.6 | 1.50 ± 0.10 | 94.1 ± 2.8 |
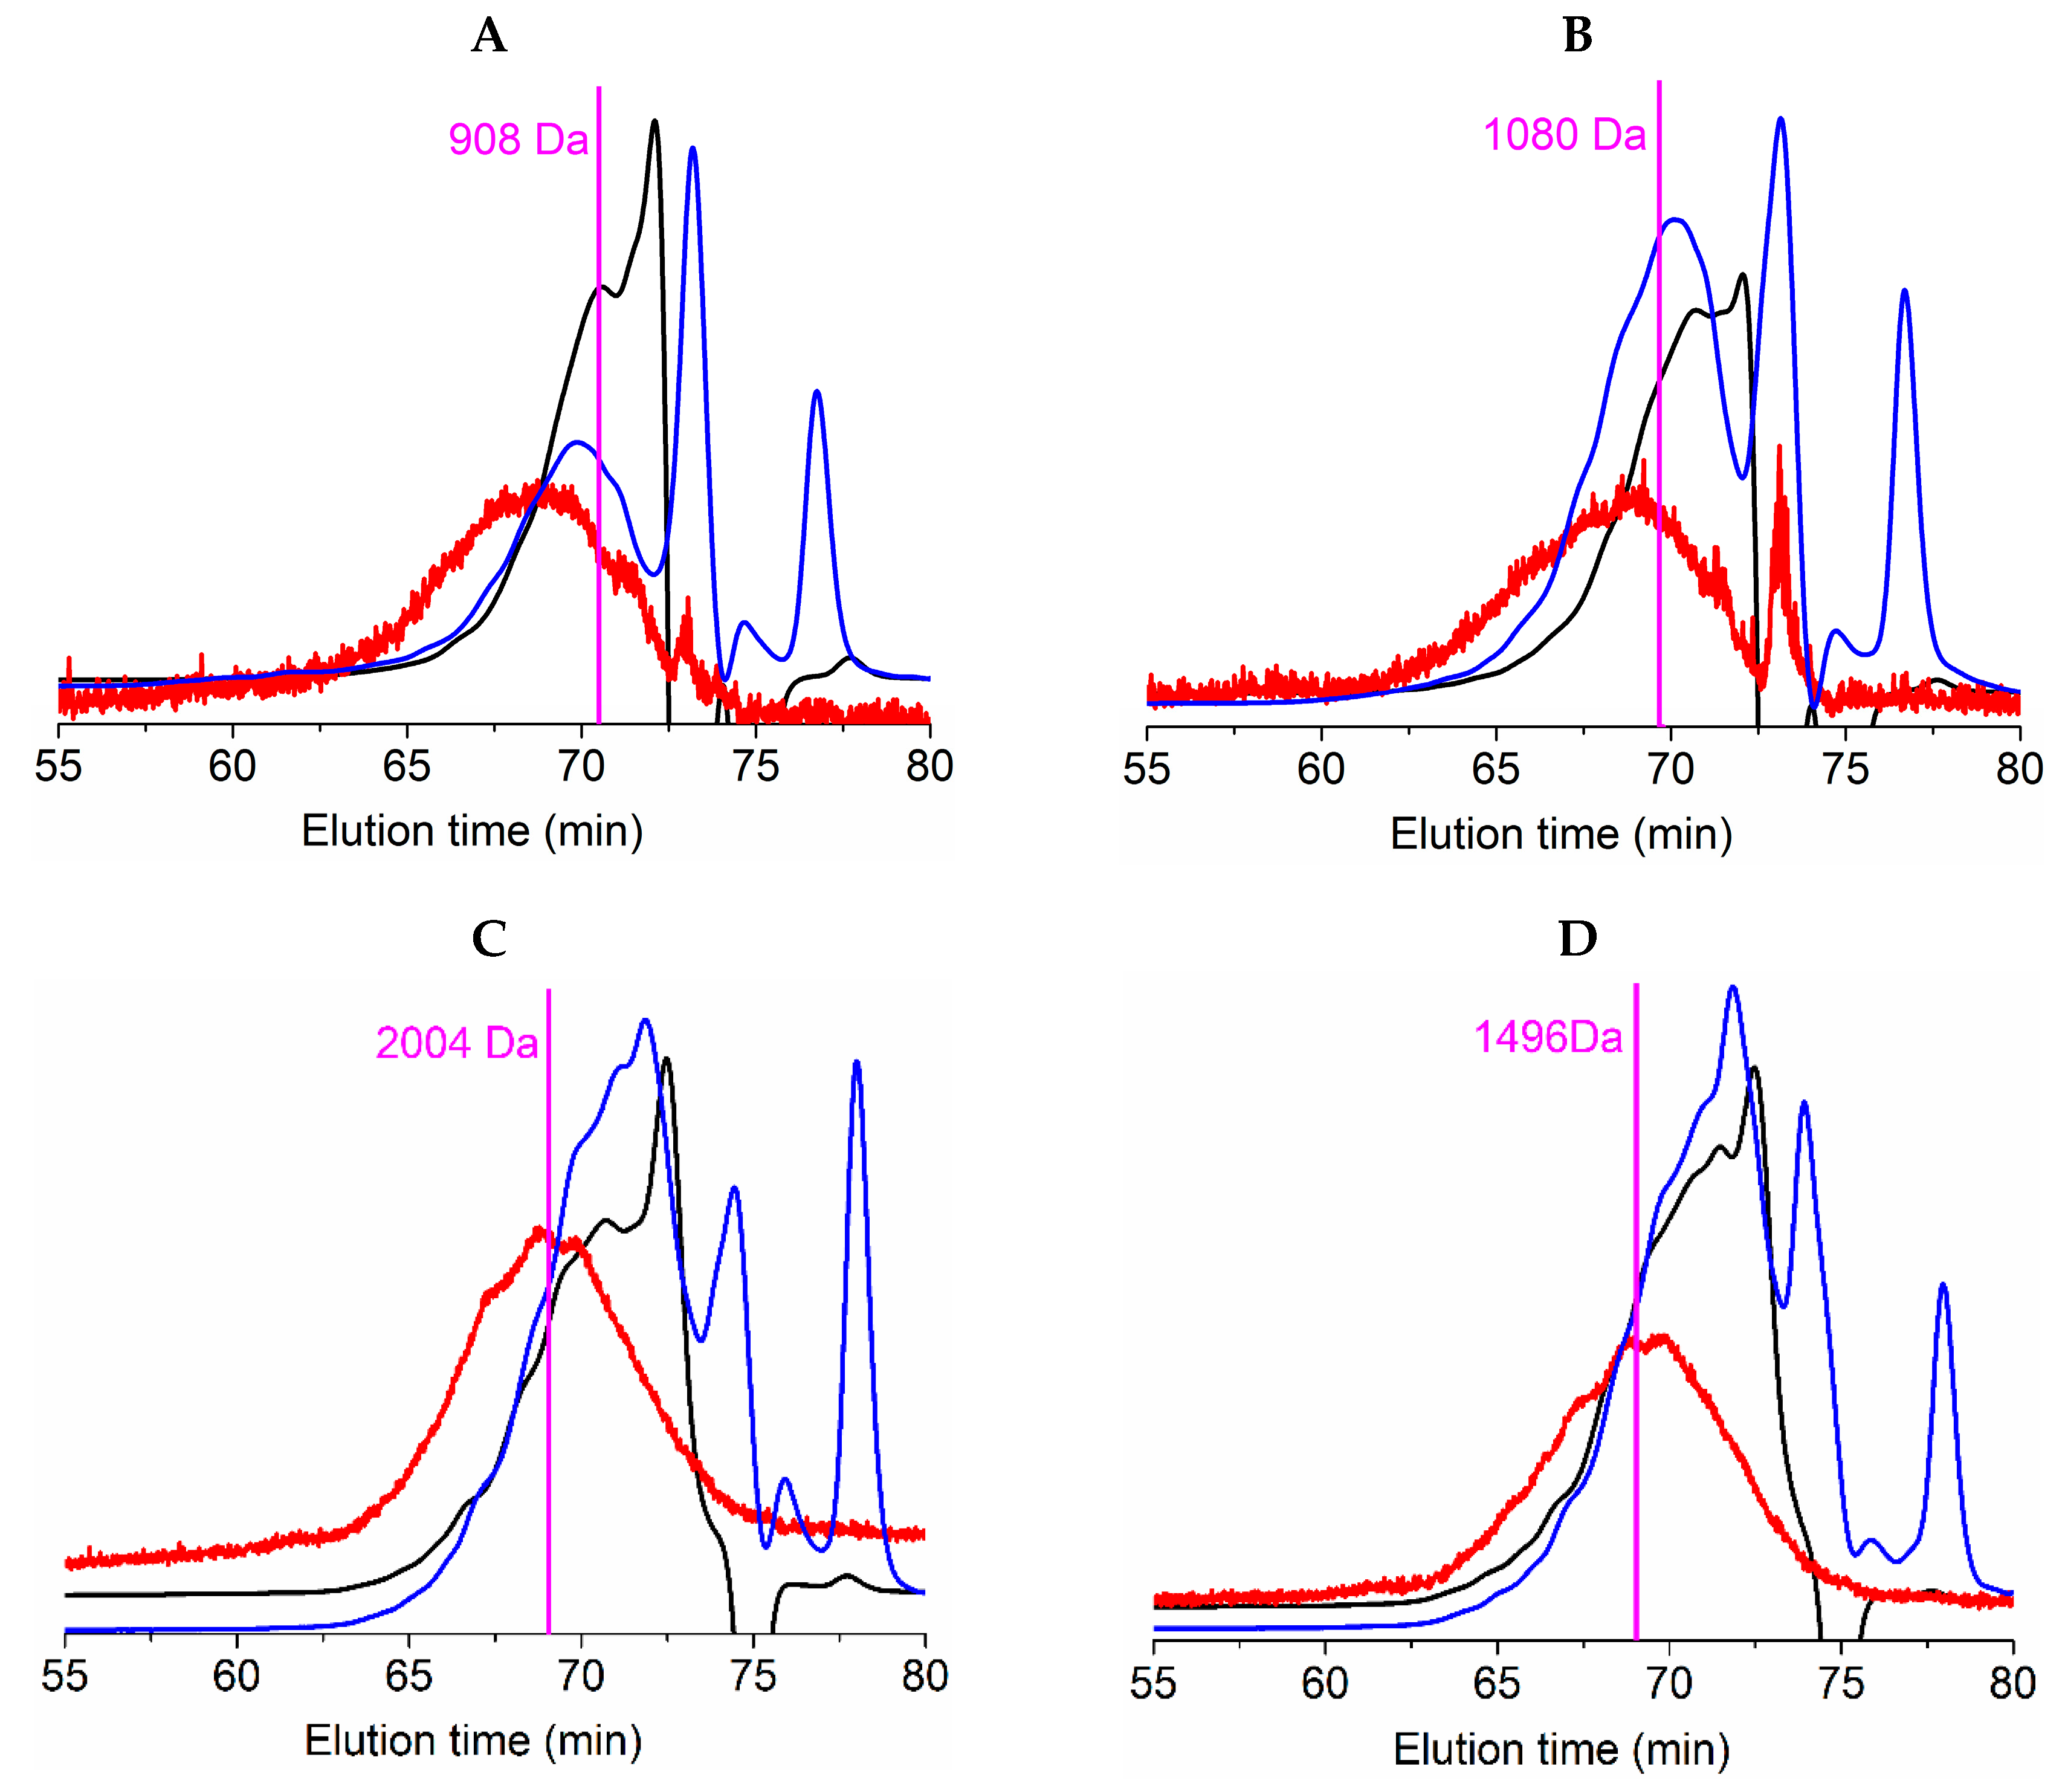
| FPHs | Mn (Da) | Mw (Da) | PD | 0–0.2 kDa (%) | 0.2–0.5 kDa (%) | 0.5–1 kDa (%) | 1–3 kDa (%) | >3 kDa (%) |
|---|---|---|---|---|---|---|---|---|
| RT_H | 920 ± 110 | 1944 ± 264 | 2.11 | 13.7 ± 1.0 | 8.4 ± 0.5 | 25.9 ± 1.4 | 38.0 ± 3.9 | 14.0 ± 0.5 |
| RT_TF | 1067 ± 152 | 1682 ± 65 | 1.58 | 8.4 ± 1.3 | 8.5 ± 0.3 | 25.1 ± 0.9 | 47.6 ± 8.1 | 10.4 ± 0.2 |
| S_H | 1235 ± 91 | 1945 ± 136 | 1.57 | 8.0 ± 2.2 | 7.8 ± 0.9 | 17.2 ± 3.6 | 52.0 ± 3.9 | 15.0 ± 0.4 |
| S_TF | 944 ± 40 | 1442 ± 51 | 1.53 | 7.8 ± 1.1 | 16.0 ± 1.3 | 24.6 ± 1.2 | 43.3 ± 2.3 | 8.3 ± 0.1 |
| FPHs | AO | AH | |||
|---|---|---|---|---|---|
| DPPH (%) | ABTS (μg BHT/mL) | Crocin (μg Trolox/mL) | IACE (%) | IC50 (μg Protein/mL) | |
| RT_H | 48.22 ± 1.34 | 14.98 ± 0.51 | 8.71 ± 0.24 | 82.1 ± 23.0 | 508.9 ± 58.6 |
| RT_TF | 53.22 ± 1.68 | 15.12 ± 0.24 | 9.02 ± 0.39 | 67.8 ± 10.7 | 975.4 ± 476.6 |
| S_H | 45.25 ± 2.89 | 13.12 ± 1.01 | 7.52 ± 0.09 | 71.9 ± 15.8 | 478.5 ± 178.6 |
| S_TF | 56.85 ± 3.10 | 16.77 ± 1.39 | 8.45 ± 0.87 | 87.0 ± 19.0 | 653.7 ± 158.3 |
© 2019 by the authors. Licensee MDPI, Basel, Switzerland. This article is an open access article distributed under the terms and conditions of the Creative Commons Attribution (CC BY) license (http://creativecommons.org/licenses/by/4.0/).
Share and Cite
Vázquez, J.A.; Sotelo, C.G.; Sanz, N.; Pérez-Martín, R.I.; Rodríguez-Amado, I.; Valcarcel, J. Valorization of Aquaculture By-Products of Salmonids to Produce Enzymatic Hydrolysates: Process Optimization, Chemical Characterization and Evaluation of Bioactives. Mar. Drugs 2019, 17, 676. https://doi.org/10.3390/md17120676
Vázquez JA, Sotelo CG, Sanz N, Pérez-Martín RI, Rodríguez-Amado I, Valcarcel J. Valorization of Aquaculture By-Products of Salmonids to Produce Enzymatic Hydrolysates: Process Optimization, Chemical Characterization and Evaluation of Bioactives. Marine Drugs. 2019; 17(12):676. https://doi.org/10.3390/md17120676
Chicago/Turabian StyleVázquez, José Antonio, Carmen G. Sotelo, Noelia Sanz, Ricardo I. Pérez-Martín, Isabel Rodríguez-Amado, and Jesus Valcarcel. 2019. "Valorization of Aquaculture By-Products of Salmonids to Produce Enzymatic Hydrolysates: Process Optimization, Chemical Characterization and Evaluation of Bioactives" Marine Drugs 17, no. 12: 676. https://doi.org/10.3390/md17120676
APA StyleVázquez, J. A., Sotelo, C. G., Sanz, N., Pérez-Martín, R. I., Rodríguez-Amado, I., & Valcarcel, J. (2019). Valorization of Aquaculture By-Products of Salmonids to Produce Enzymatic Hydrolysates: Process Optimization, Chemical Characterization and Evaluation of Bioactives. Marine Drugs, 17(12), 676. https://doi.org/10.3390/md17120676