2.1. Optimization of Salmonid By-Products Hydrolysis
Optimization of salmonid heads hydrolysis was studied according to the factorial designs summarized in
Table S1 (supplementary material) using a pH-stat system (100 mL reactor). Alcalase 2.4 L was chosen as biocatalyst due to its excellent capacity of proteolysis when it was applied to several marine substrates as squid pens, fish cartilages, crustacean shells, and other fish tissues and by-products [
19,
20,
21,
22]. A two-variable factorial design was executed in anticipation that no interactions among pH, T, r (S:L), and enzyme concentration were expected as it was reported by Liaset et al. [
3]. The effects of those last independent variables were individually studied after optimization experiments.
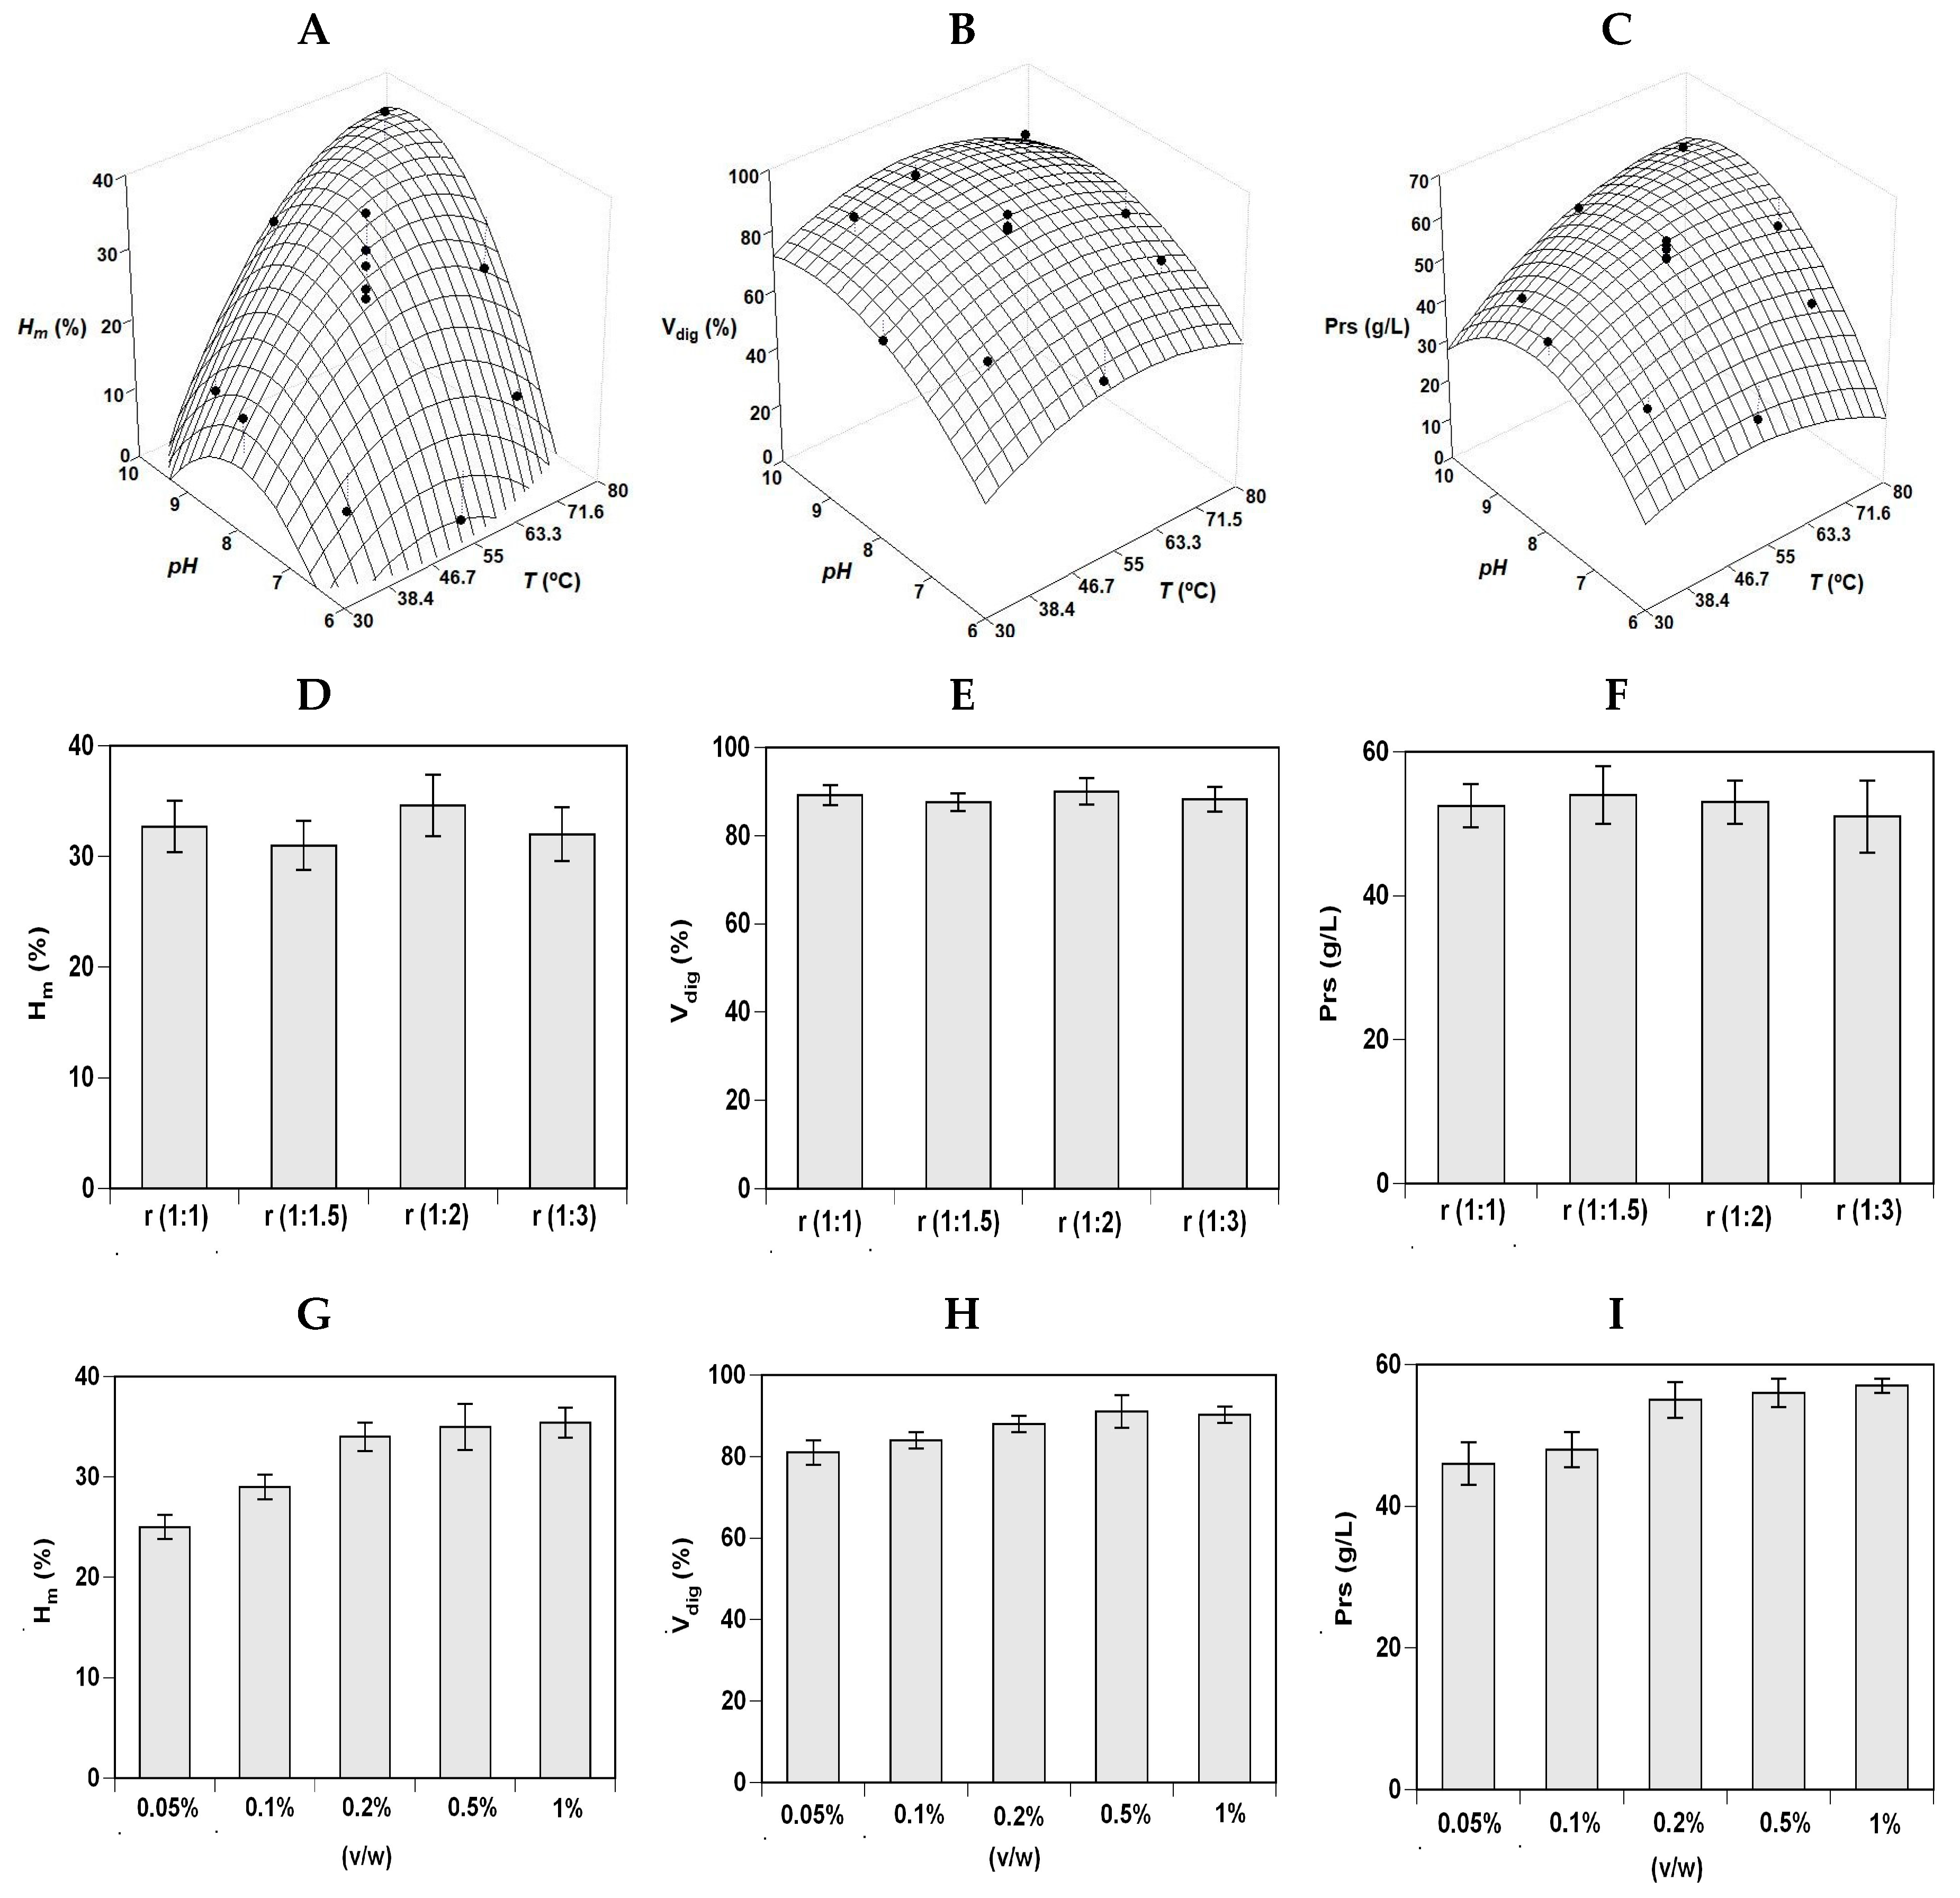
Figure 1 and
Figure 2 (A, B, and C plots) show the experimental data and the corresponding theoretical surfaces for the three responses of RT_H and S_H hydrolysis. Empirical equations were calculated from factorial data and optima values determined for each case studied (
Table 2). From a statistical point of view, the degrees of explicability of the polynomials (concordance among simulated and experimental data) were ranging from 76% to 91% for the three responses and the two substrates evaluated. The robustness of the polynomials was also statistically validated by Fisher tests (F1 and F2) (data not shown). Average data of
pHopt and
Topt were 8.27 and 56.2 °C for RT_H and 8.98 and 64.2 °C for S_H.
Based on these conditions, the concentration of protease and the S:L ratio that maximizes the production of FPHs was subsequently evaluated in one-factor-at-a-time method (
Figure 1D–I). For RT_H, the values of
Hm increased at higher (S:L) but no significant differences were found among ratios for the responses V
dig and Prs (
p > 0.05). The effect of Alcalase concentration followed a similar trend: higher
Hm value at larger enzyme added but similar response for V
dig and Prs results. Thus, (1:1) ratio and 0.1% (v/w) of commercial protease were selected as the most adequate conditions to digest the trout by-products, therefore, reducing the costs of the hydrolysis stage.
In a similar way, the single effect of solid:liquid ratio and Alcalase concentration on S_H hydrolysis were tested maintaining constant the average values of pH
opt and T
opt previously defined. The three responses are displayed in
Figure 2 (D–I plots) indicating the lack of significant differences between the ratios studied. All responses from hydrolysis (H
m, V
dig and Prs) rose with the increase in the protease used up to an Alcalase concentration of 0.2% v/w. Thus, ratio of (1:1) and 0.2% of enzyme were the conditions chosen for carrying out the hydrolysis of salmon wastes to produce aquaculture feed ingredients.
In summary, the optimal conditions obtained for salmonids hydrolysis were (pH and T calculated as the average of the values indicated in
Table 2): 1) Alcalase 0.1%, pH 8.27, 56.2 °C, 200 rpm, 3 h of hydrolysis, and S:L = 1:1 for RT_H and RT_TF; 2) Alcalase 0.2%, pH 8.98, 64.2 °C, 200 rpm, 3 h of hydrolysis, and S:L = 1:1 for S_H and S_TF. Optimal conditions for RT were similar to those found for skin salmon treated with Alcalase (55.3 °C and pH 8.39) but needing much less concentration of enzyme (0.1%
vs. 2.5%) [
23].
2.2. Production and Chemical Composition of FPHs
The next step was to validate these optimized conditions in a high-scale performance. Thus, hydrolysates (among 18–20 independent batches) were run in a 5L-pH-stat reactor with 2 kg of ground raw material. In all cases, the kinetics of hydrolysis (
H) were accurately described by Weibull equation (
Table 3,
Figure 3). The agreement between experimental and simulated data was total (R
2>0.999) and the statistical feasibility of equation was also confirmed by F-Fisher test (
p<0.005). The maximum degrees of hydrolysis (
Hm) were slightly greater in salmon by-products, whereas the maximum rates of hydrolysis were slower on trout wastes. In addition, these numerical values of parameters were similar to those obtained in 100 mL-reactor and reported in
Table 3 and
Figure 1 and
Figure 2. In all reports about the production of salmonid FPHs, the mathematical modeling of proteolytic kinetics was unexplored. Taking into account the published data of H (%) at the end of Alcalase treatment, our values of
Hm (
Table 3) were always higher or slightly higher than those obtained for hydrolysates of salmon head (17%), salmon frames (27%), and trout roe (28%) [
9,
24,
25]. Using soluble proteins extracted by CaCl
2-citric treatment of a mixture of RT by-products (heads, frames, and viscera) as substrate, the value of H was of 42% for a 3-h Alcalase hydrolysate [
26]. In addition to the type of starting material, the concentration of enzyme in that work was 50 times higher than that used in the present experiments.
The processing of salmonid hydrolysates was performed using the protocol shown in
Supplementary material (Figure S1).
Figure S2 (Supplementary material) presents different photographs related to the production of FPHs and other resulting products. For example, one by-product of the hydrolysates production is bones, the percentage recovered in filters after hydrolysis was around 9–12% (w/w of initial substrate) and the yield is higher in salmon than in trout (
Table 4). These results are lower than the amount of bones recovered from heads of different fish discards (red scorpionfish, blue whiting, mackerel, megrim, boardfish, etc.) after enzymatic digestion [
10,
27]. Besides, the recovered bones did not present a significant amount of residual muscle or organic material.
Oil was also separated from FPHs; in this case, the yield was around 9–11% (v/w of initial substrate) and the highest volume of fish oil was found in S_H. In this context, heads from red salmon yielded the same volume of oil (10.6%) after Alcalase hydrolysis and mechanical separation [
4]. The composition in fatty acids of the oils was summarized in
Table S2 (Supplementary material). Oleic acid (>50%) and linoleic acid (>12%) were the main fatty acids present in oils and the amount of docosahexaenoic acid (DHA) and eicosapentaenoic acid (EPA), the most relevant from their biological properties, did not exceed 3%. This percentage contrasts with the levels of these omega-3 (more than 26%) in oils recovered from salmon frames hydrolysates in an article published several years ago [
3]. This huge difference could be attributed to the current salmon diets, in which vegetal oils and meals have largely replaced the more expensive oils and meals from fish origin. Blanchet et al. [
28] studied the differences between fatty acids composition in wild and farmed salmonids (salmon and trout). In all cases, omega-3 content in oils present here were lower than reported in the mentioned publication. In addition, our omega-3/omega-6 ratios for salmonid oils recovered after Alcalase hydrolysis were lower than or equal to 0.5, revealing their low potential as ingredients for nutraceutical applications [
29].
The ability of Alcalase for the digestion (V
dig) of raw materials was always higher than 84% (RT_TF), with a maximum value of 90% detected in S_H. The values of V
dig were significantly superior in H than TF (
p < 0.05). The levels reported here were in agreement with those observed in the production of hydrolysates of fish discards [
10,
27]. Depending on the method used for the quantification of proteins, the levels of protein material present in farmed FPHs ranged 48–69 g/L, 53–71 g/L, and 52–73 g/L for Prs, Pr-tN, and Pr (Σaa), respectively. TF substrates led to a larger concentration of protein in comparison to heads. Regarding species, salmon FPHs showed higher protein concentration than those obtained with trout. The
In vitro digestibility (Dig) of FPHs was excellent, in all cases, it has been found values higher than 92% without significant differences between FPHs (
p > 0.05).
Regarding amino acid content in FPHs, the main ones are glutamic acid (Glu), aspartic acid (Asp), and glycine (Gly), but all the essential amino acids are included in the salmonid hydrolysates produced here (
Table S3, Supplementary material). In all cases, the essential amino acid content was higher (value of TEAA/TAA as percentage) than recommended for human adults and infants [
30,
31]. Similar percentages to our outcomes were observed for enzymatic hydrolysates of rainbow trout frames and roes generated by Alcalase [
14,
25], and salmon frames catalyzed with Protamex [
3] but inferior when Papain was applied to identical salmon wastes [
9]. Nevertheless, the data of TEAA/TAA for salmon viscera hydrolysates [
32] were higher than here reported for other by-products of salmonids (46%
vs. 33–37%). Protein, amino acid contents and digestibilities shown in
Table S3 and
Table 4 were in concordance with the chemical, functional, and nutritional properties necessary for their utilization in animal feed [
15,
16,
18]. Additionally, the values of total sugars, from 1.2 to 1.5 g/L, were very similar in the four hydrolysates of salmonids.
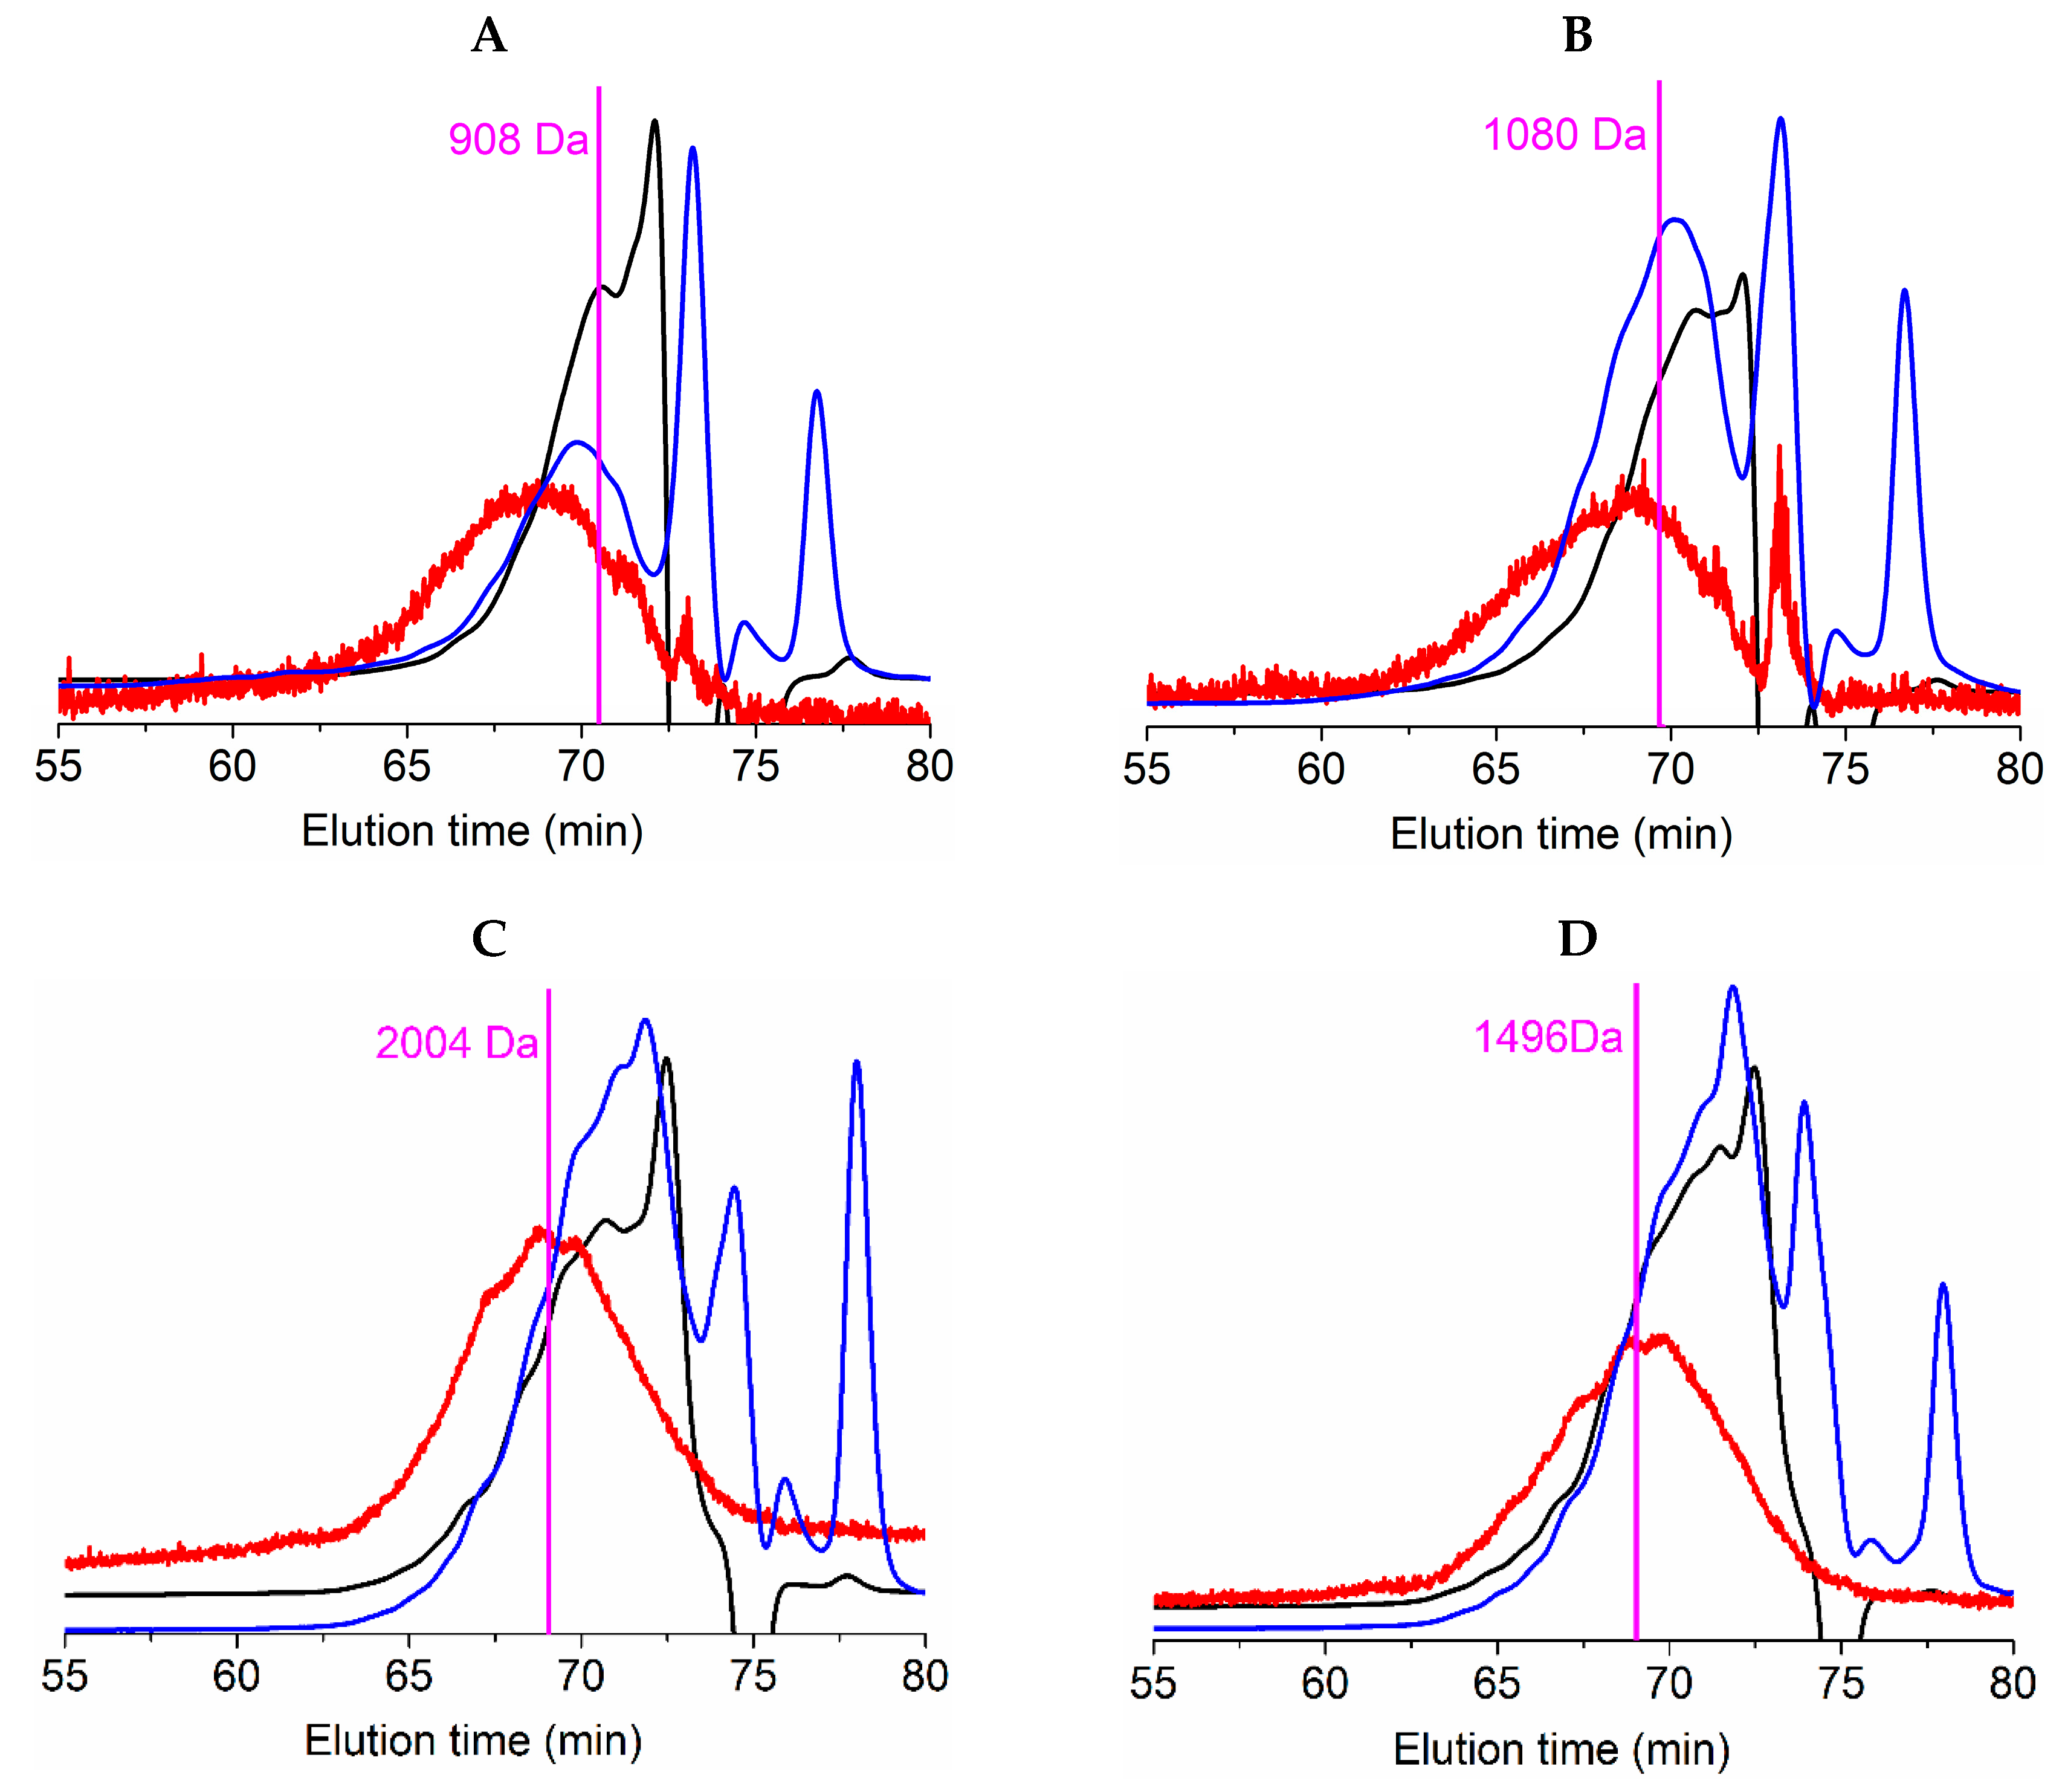
Average molecular weight (Mw) of protein fraction in salmonid FPHs were (
Table 5): 1944 ± 264 Da (index of polydispersity, PD: 2.11) for RT_H, 1682 ± 65 Da (PD: 1.58) for RT_TF, 1945 ± 136 Da (PD: 1.57) for S_H, and 1442 ± 51 Da (PD: 1.53) for S_TF. In the case of the number average molecular weight (Mn) of salmonid FPHs, the results obtained from gel permeation chromatography (GPC) were: 920 ± 110 Da for RT_H, 1067 ± 152 Da for RT_TF, 1235 ± 91 Da (PD: 1.57) for S_H, and 944 ± 40 Da (PD: 1.53) for S_TF. A representation of GPC-profiles of such peptides distribution from FPHs is displayed in
Figure 4 and is also indicated in
Table 5.
The distribution of peptide sizes (as percentage), quantified by means of two types of chromatographic procedures, are also summarized in
Table 5 and represented in
Figure S3 (Supplementary material). As described for Mn and Mw, S_H hydrolysates produced peptides with the highest distribution of sizes (67% of peptides > 1 kDa) followed by RT_TF (58%). The hydrolysate with the greatest percentage of small peptides (0–200 Da) was RT_H (13.7%). Nikoo and coauthors [
26] produced a FPH with greater percentage of low peptides (0–0.2 kDa: 40%, 0.2–0.5 kDa: 24% and 0.5–1 kDa: 14%) employing more amount of enzyme on protein chemically solubilized from different rainbow trout by-products. For its part, salmon head digested by Alcalase for 2 h led to a higher size distribution (100% of peptides above 1.4 kDa) and, as mentioned, a lower degree of hydrolysis (17%) [
24].
2.3. In Vitro Bioactivities of Hydrolysates from Salmonids By-Products
The data of activities (antioxidant, AO and antihypertensive, AH) for FPHs samples are included in
Table 6. The hydrolysates of TF from both fish showed significant larger 1,1-Diphenyl-2-picryhydrazyl (DPPH) activities than those recovered from salmonid heads (
p < 0.05). Nevertheless, S_H led to the significant lowest data of ABTS (2,2′-azinobis-(3-ethyl-benzothiazoline-6-sulphonic acid) and Crocin (
p < 0.05). In general, the numerical response of DPPH method, Crocin protocol was never employed to analyze salmonid samples, was not sufficiently attractive when are compared with samples of Alcalase hydrolysates from trout roe [
25] and for soluble proteins obtained by chemical solubilization of a mixture of RT by-products [
33]. However, enzymatic hydrolysates from pectoral fin and collagen skin of salmon showed similar % of DPPH than those listed in
Table 6 [
34,
35]. Based on data from FPHs of other marine wastes, our DPPH activities were greater than hydrolysates of hake [
36] and lower than samples of cuttlefish, herring, or croaker [
37,
38,
39]. In relation to ABTS determinations, Idowu et al. [
9] reported more than 10 times activity (688 μmol trolox/g) for frames of salmon digested with 3% of Alcalase for 3 h than that found in salmonid samples described here. It is important to mention that in those samples of frames more than 50% of the peptides had sizes above 3 kDa.
The antihypertensive inhibitions (
IACE) of FPHs, in terms of percentage values, were always higher than 67% (ranging from 68% to 87%), reaching the best outcome in S_TF. Nevertheless, the differences among samples were not significant (
p > 0.05). In general, our results were similar and higher than reported for FPHs of wastes from wild fish: board fish [
40], hake [
41], horse mackerel [
42], and Cape fish [
43]. The data of bioactivities (
IC50) obtained after dose–response modeling by Weibull equation [
27] were also described in
Table 6. As in the previous case, these values of angiotensin I-converting enzyme (ACE) inhibiting activity were not significantly different for each type of FPHs. Regarding literature, hydrolysates of thermally defatted salmon backbones performed by Trypsin generated lower activity (
IC50 = 0.92 mg FPH/mL) than values presented here [
44]. In this context, Carolase PP hydrolysates of salmon trimmings produced after fish mince extraction at different pHs led to similar antihypertensive activity (around 521 μg ACE/mL) [
45]. However, a hydrolysate of 300–500 Da obtained from frames of trout, assisted by microwave, showed greater activity (3.6 μg/mL) [
46].

 ,
, 


