Figure 1.
Structural diversity of the mannose-binding seaweed lectins. (A,B). Lateral (A) and front (B) views of the ribbon diagram of griffithsin monomer (protein data bank (PDB) code 1LL2) in complex with a pentamannoside (colored cyan), showing the β-prism-I organization of strands of β-sheet. Surface electrostatic potential (electronegatively and electropositively charged surfaces colored in red and blue, respectively; neutral surfaces colored grey) is shown in transparency. (C,D). Lateral (C) and front (D) views of the ribbon diagram of the modelled Agardhiella subulata lectin ASL-1, in complex with a pentamannoside (colored cyan), showing the β-barrel organization of strands of β-sheet. Surface electrostatic potential is shown in transparency. (E,F). Lateral (E) and front (F) views of the ribbon diagram of the modelled lectin from Ostreococcus tauri OtL, in complex with a dimannoside (colored cyan), showing the β-sandwich organization of strands of β-sheet. Surface electrostatic potential is shown in transparency. ASL-1 and OtL lectins were modelled with YASARA, and rendered with Chimera.
![Marinedrugs 17 00440 g001]()
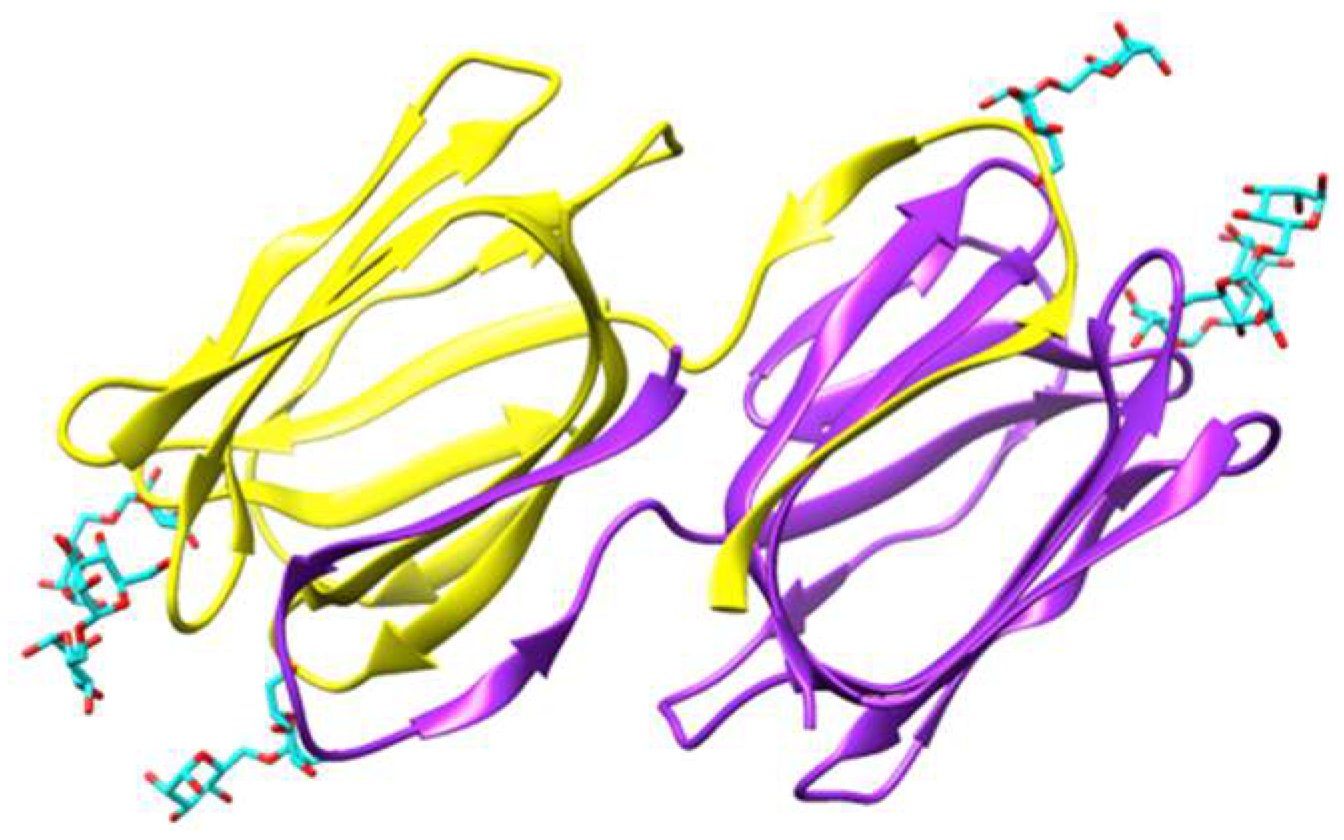
Figure 2.
Ribbon diagram showing the domain-swapped structure of griffithsin, organized in two symmetrical domains colored purple and yellow, respectively (PDB code 2HYQ), in complex with six α 1,6-mannobiose ligands (colored cyan). In each domain, the carbohydrate-binding sites (CBS) are located at the top of the β-prism structure. Molecular cartoon drawn with Chimera.
Figure 3.
Stereo view showing the conservation of the β-sandwich core between VIP36 protein (PDB code 2DUR) used as a template (A), to model the legume-like lectin HFA from Hydropuntia fisheri (B) in complex with a dimannoside (colored cyan), using YASARA. The Ca2+ ion is colored yellow green. The amino acid sequences of proteins share 27.5% identity and 72.5% similarity, and a RMSD between 176 pruned atom pairs and across all 209 atom pairs were 0.908 Å and 2.576 Å, respectively, using the Needleman–Wursch alignment algorithm and the BLOSUM 62 homology matrix. Molecular cartoon drawn with Chimera.
Figure 4.
(A,B) Ribbon diagram of the three-dimensional model built up for the Boodlea coacta lectin BCA (A), compared to GNA (PDB code 2MSA) (B) used as a template for homology modelling (15% identity and 51% similarity, RMSD between 46 atom pairs: 0.457). Surface electrostatic potential (electronegatively and electropositively charged surfaces colored in red and blue, respectively; neutral surfaces colored grey) of BCA are indicated and mannose residues anchored to the CBSs of the lectin are colored cyan. (C,D) Ribbon diagram of the modelled BPL-2 lectin from Bryopsis plumosa (C), compared to MFP2 (PDB code 2BJR) (D) used as a template for homology modelling (19.5% identity and 48% similarity, RMSD between 82 atom pairs: 0.698 Å). Surface electrostatic potential (electronegatively and electropositively charged surfaces colored in red and blue, respectively; neutral surfaces colored grey) of BCA are indicated. Molecular cartoon drawn with Chimera.
Figure 5.
(A) Ribbon diagram of the domain-swapped cyanovirin-N dimer, in complex with a trimannoside oligosaccharide (cyan colored sticks) at the CBS located at the top of the β-barrel structures (PDB code 3GXY). (B) Front view of the ribbon diagram of actinohivin complexed to a tetramannoside oligosaccharide (cyan colored sticks) at the CBS located at the edges of the β-trefoil structure (PDB code 4P6A). Molecular cartoon drawn withYASARA.
Figure 6.
Accommodation of mannose (A,B) and high-mannose type glycan (C,D) at the carbohydrate-binding sites of griffithsin (PDB codes 2GUD and 3LL2, respectively). (A) Network of hydrogen-bonds (dashed black lines) anchoring mannose to the three CBSs I, II and III, located at the top of monomer A in the dimeric structure of griffithsin (PDB code 2GUD). Stacking interactions occur between tyrosine residues Tyr28 (site I), Tyr68 (site II) and Tyr110 (site III) and the pyranose ring of mannose ligands. Water-mediated H-bonds that participate in the binding of mannose to the CBSs are not represented. (B) Coulombic charges (electronegative, electropositive and neutral regions are colored red, blue and white, respectively) at the molecular surface of griffithsin, showing the strong electronegative (acidic) character of the CBDs. (C) Network of hydrogen-bonds (dashed black lines) anchoring a high-mannose type glycan to the CBDs of griffthsin (PDB code 3LL2). Note that CBD I does not participate in the binding of the glycan. Stacking interactions occur between tyrosine residues Tyr68 (site II) and Tyr110 (site III) and the pyranose ring of the high-mannose glycan. Water-mediated H-bonds that participate in the binding of high-mannose glycan to the CBDs and the surrounding regions, are not represented. (D) Coulombic charges (electronegative, electropositive and neutral regions are colored red, blue and white, respectively) at the molecular surface of griffithsin, showing how the high-mannose glycan chain is accommodated by the strong electronegative (acidic) CBDs and the surrounding regions. Note that the acidic pocket corresponding to CBS I does not participate in the binding of the glycan.
![Marinedrugs 17 00440 g006]()
Figure 7.
Accommodation of a pentamannosyl glycan (A,B) at the carbohydrate-binding site of EDA-2, the Eucheuma denticulata lectin (modelled and docked, using the PDB code 3OBL as a template). (A) Network of hydrogen-bonds (dashed black lines) anchoring the pentamannosyl glycan to the CBS. Stacking interactions occur between tryptophan residue Trp10 and a pyranose ring of the ligand. Water-mediated H-bonds that participate in the binding of pentamannosyl glycan to the CBS are not represented. (B) Coulombic charges (electronegative, electropositive and neutral regions are colored red, blue and white, respectively) at the molecular surface of EDA-2, showing the electropositively (blue) and electronegatively (red) charged regions in contact with the pyranose rings of the ligand.
Figure 8.
Accommodation of a dimannoside (A,B) at the carbohydrate-binding site of HFA, the Hydropuntia fisheri lectin (modelled and docked, using the PDB code 2DUR as a template). (A) Network of hydrogen-bonds (dashed black lines) anchoring the dimannoside to the CBS. Stacking interactions occur between phenylalanine residue Phe114 and Phe212, and a pyranose ring of the ligand. (B) Coulombic charges (electronegative, electropositive and neutral regions are colored red, blue and white, respectively) at the molecular surface of HFA, showing the electronegatively (red) charged of the carbohydrate-binding cavity that harbors the sugar.
Figure 9.
Accommodation of mannose (A,B) at the carbohydrate-binding site II of BCA, the Boodlea coacta lectin (modelled and docked, using the PDB code 1MSA as a template). (A) Network of hydrogen-bonds (dashed black lines) anchoring mannose to the CBS. A stacking interaction occurs between tryptophane residue Trp72 and the pyranose ring of the ligand. (B) Coulombic charges (electronegative, electropositive and neutral regions are colored red, blue and white, respectively) at the molecular surface of BCA, showing the electronegatively (red) charged character of the carbohydrate-binding cavity that harbors the sugar.
Figure 10.
(
A,
B) High-mannose glycan chains displaying the higher affinity for BCA. The clusters of terminal α1,2-linked mannose units are shown in red bold letters in both oligosaccharidic structures. Symbols for man (
![Marinedrugs 17 00440 i001]()
) and GlcNAc (
![Marinedrugs 17 00440 i002]()
) were used to draw the molecular cartoons of high-mannose glycan chains.
Figure 11.
Accommodation of mannose (A,B) at the carbohydrate-binding site of BPL-2, the Bryopsis plumosa lectin (modelled and docked, using the PDB code 2BJR as a template). (A) Network of hydrogen-bonds (dashed black lines) anchoring mannose to the CBS. A stacking interaction occurs between phenylalanine residue Phe165 and the pyranose ring of the ligand. (B) Coulombic charges (electronegative, electropositive and neutral regions are colored red, blue and white, respectively) at the molecular surface of BPL-2, showing the electronegatively (red) charged character around the carbohydrate-binding cavity that harbors the sugar.
Figure 12.
Multiple amino acid sequence alignment of griffithsin and jacalin-related lectins from higher plants (jacalin and artocarpin from Artocarpus integrifolia, frutalin from Artocarpus incisa, and Morniga-M from Morus nigra). Griffithsin shares 25% identity and 70% homology with jacalin-related lectins from higher plants. Sequence alignment was performed with CLUSTAL-X.
Figure 13.
Phylogenetic tree built from the multiple amino acid sequence alignment of jacalin-related lectins from red algae (red boxes), plants (green box), fungi (orange boxes), and bacteria (blue boxes). Lectin of the green alga Volvox carteri is green boxed, and lectins from unicellular ciliates are not boxed.
Figure 14.
Ribbon diagram of the HIV-1-envelope spike built from the triangular association of three gp120 molecules (PDB code 5FYK). The gp41 molecules which are tandemly associated to the gp120 molecules, are not represented. The fully accessible high-mannose glycan chains that decorate the gp120 units are rendered as cyan colored sticks.
Figure 15.
Three-dimensional structure of gp120 complexed to a CD4 molecule (PDB code 5FYK). The high-mannose N-glycan chain decorating gp120 are rendered as cyan colored sticks. Lectins which specifically bind to the high-mannose N-glycans exposed at the surface of gp120, interfere with the recognition of gp120 by the coreceptors of the CD4+ T lymphocytes.
Table 1.
Overview of algal lectins with a mannose-specificity. OAAH— Oscillatoria agardhii agglutinin homolog; GNA—Galanthus nivalis agglutinin.
Table 1.
Overview of algal lectins with a mannose-specificity. OAAH— Oscillatoria agardhii agglutinin homolog; GNA—Galanthus nivalis agglutinin.
| Algae Phylum | Algae Family | Algae Species | Lectin | Structural Scaffold | Ref. |
|---|
| Red algae | Griffithsin | Griffithsia sp. | griffithsin | β-prism I | [3] |
| Brown algae | OAAH-like | Agardhiella subulata | ASL-1, | β-barrel | [8] |
| ASL-2 | β-barrel |
| Eucheuma amakusaensis | EAA-1 | β-barrel | [9] |
| EAA-2 | β-barrel |
| EAA-3 | β-barrel |
| Eucheuma cottonii | ECA-1 | β-barrel | [9] |
| ECA-2 | β-barrel |
| Eucheuma denticulatum | EDA-1 | β-barrel | [10] |
| EDA-2 | β-barrel |
| Eucheuma serra | ESA-1 | β-barrel | [11,12] |
| ESA-2 | β-barrel |
| Kappaphycus alvarezii | KAA-2 | β-barrel | [13] |
| Kappaphycus striatum | KSA-2 | β-barrel | [14] |
| Meristiella echinocarpa | MEL | β-barrel | [8] |
| Meristotheca papulosa | MPA-1 | β-barrel | [8] |
| MPA-2 | β-barrel |
| Solieria filiformis | SfL-1 | β-barrel | [15] |
| SfL-2 | β-barrel |
| Yellow- | Legume-like | Hydropuntia fisheri | HFA | β-sandwich | [Ac. GQ906709] |
| Nannochloropsis gaditana | NgL | β-sandwich | [16] |
| Porphyra umbilicalis | BU14 | β-sandwich | [Ac. OSX69288] |
| Ostreococcus tauri | OtL | β-sandwich | [17] |
| green algae | GNA-like | Boodlea coacta | BCA | β-prism II | [18] |
| Green algae | MFP2-like | Bryopsis plumosa | BPL-2 | MFP2-like | [Ac. BAI43482] |
| scaffold? |
| | unknown | Halimeda renschii | HRL40-1/2 | β-prism I | [19] |
Table 2.
PDB codes of lectins from seaweeds, complexed to mannose, glucose, N-acetyl-glucosamine, maltose and high-mannose glycans.
Table 2.
PDB codes of lectins from seaweeds, complexed to mannose, glucose, N-acetyl-glucosamine, maltose and high-mannose glycans.
| Algae Species | Lectin | PDB Code (Complexed Sugar) | Ref. |
|---|
| Griffithsia sp. | griffithsin | 2GUC, 2GUD (Man) | [51] |
| 2NUO (Glc) | [52] |
| 2GUE (GlcNAc), 2NU5 (GlcNAc) | [51,52] |
| 2HYQ (α 1,6-mannobiose), 2HYR (maltose) | [53] |
| 3LL2 (9ManGlcNAc2) | [54] |
Table 3.
List of the man-specific seaweed lectins inhibiting HIV infection by binding to the viral gp120 envelope protein. EC50 is in the range between 0.1 nM and 1.8 nM, depending on differences in methods used to quantify the anti-HIV activity of griffithsin in vitro. IC50 is usually less than 1.0 nM.
| Algae Phylum | Algae Family | Lectin | Ref. |
|---|
| Red algae | Griffithsin | Griffithsin (Griffithsia sp.) | [4,54,61,62,63,64,65,66,67,68,69,70,71,72,73,74,75,76,77,78,79] |
| (Rhodophyta) | | GRFN-1 or Grifonin-1 (Griffithsia sp.) | [61] |
| | OAAH-like family | KAA-2 (Kappaphycus alvarezii) | [80] |
| Green algae | GNA-like family | BCA (Boodlea coacta) | [4,18] |
| (Chlorophyta) | Legume-like family | OtL (Ostreococcus tauri) | [17] |
Table 4.
Cytotoxic effects of Man-specific lectins on cancer cells (reported during the last decade). Apopt.: apoptosis.
Table 4.
Cytotoxic effects of Man-specific lectins on cancer cells (reported during the last decade). Apopt.: apoptosis.
| Phylum | Species | Lectin | Cancer cell | Apopt. | Ref. |
|---|
| Red algae | Agardhiella tenera | ATA | mouse leukemia cell L5178Y | | [87] |
| | Bryoyhamnion seaforthii | BSL | human colon carcinoma cells L5178Y | | [88] |
| | | | oligodendroglioma, ependymona, | | [89] |
| | | | meningioma, medullo-blastoma | | |
| | Bryothamnion triquetrum | BTL | human colon carcinoma | + | [89] |
| | Eucheuma serra | ESA | Colo201, HeLa | + | [90] |
| | Solieria filiformis | SfL-1 | mouse Colon26 adenocarcinoma | + | [91] |
| | | SfL-2 | Colo201 | + | [92] |
| | | | human osteocarcinoma, murine | + | [93] |
| | | | osteocarcinoma LM8 | | |
| | | | MCF-7 | | [15] |
Table 5.
Other investigated biomedical properties of Man-specific seaweed lectins.
Table 5.
Other investigated biomedical properties of Man-specific seaweed lectins.
| Alga Phylum | Alga Species | Lectin | Biomedical Property | Ref. |
|---|
| Red algae | Eucheuma serra | ESA | Anti-bacterial | [94] |
| | Solieria filiformis | SfL | Anti-bacterial | [95] |
| | Solieria filiformis | SfL | Anti-nociceptive | [96] |
| | Solieria filiformis | SfL | Anti-depressant | [97] |
| | Bryothamnion seaforthii | BSL | Pro-healing | [98] |


 ) and GlcNAc (
  ) were used to draw the molecular cartoons of high-mannose glycan chains.


