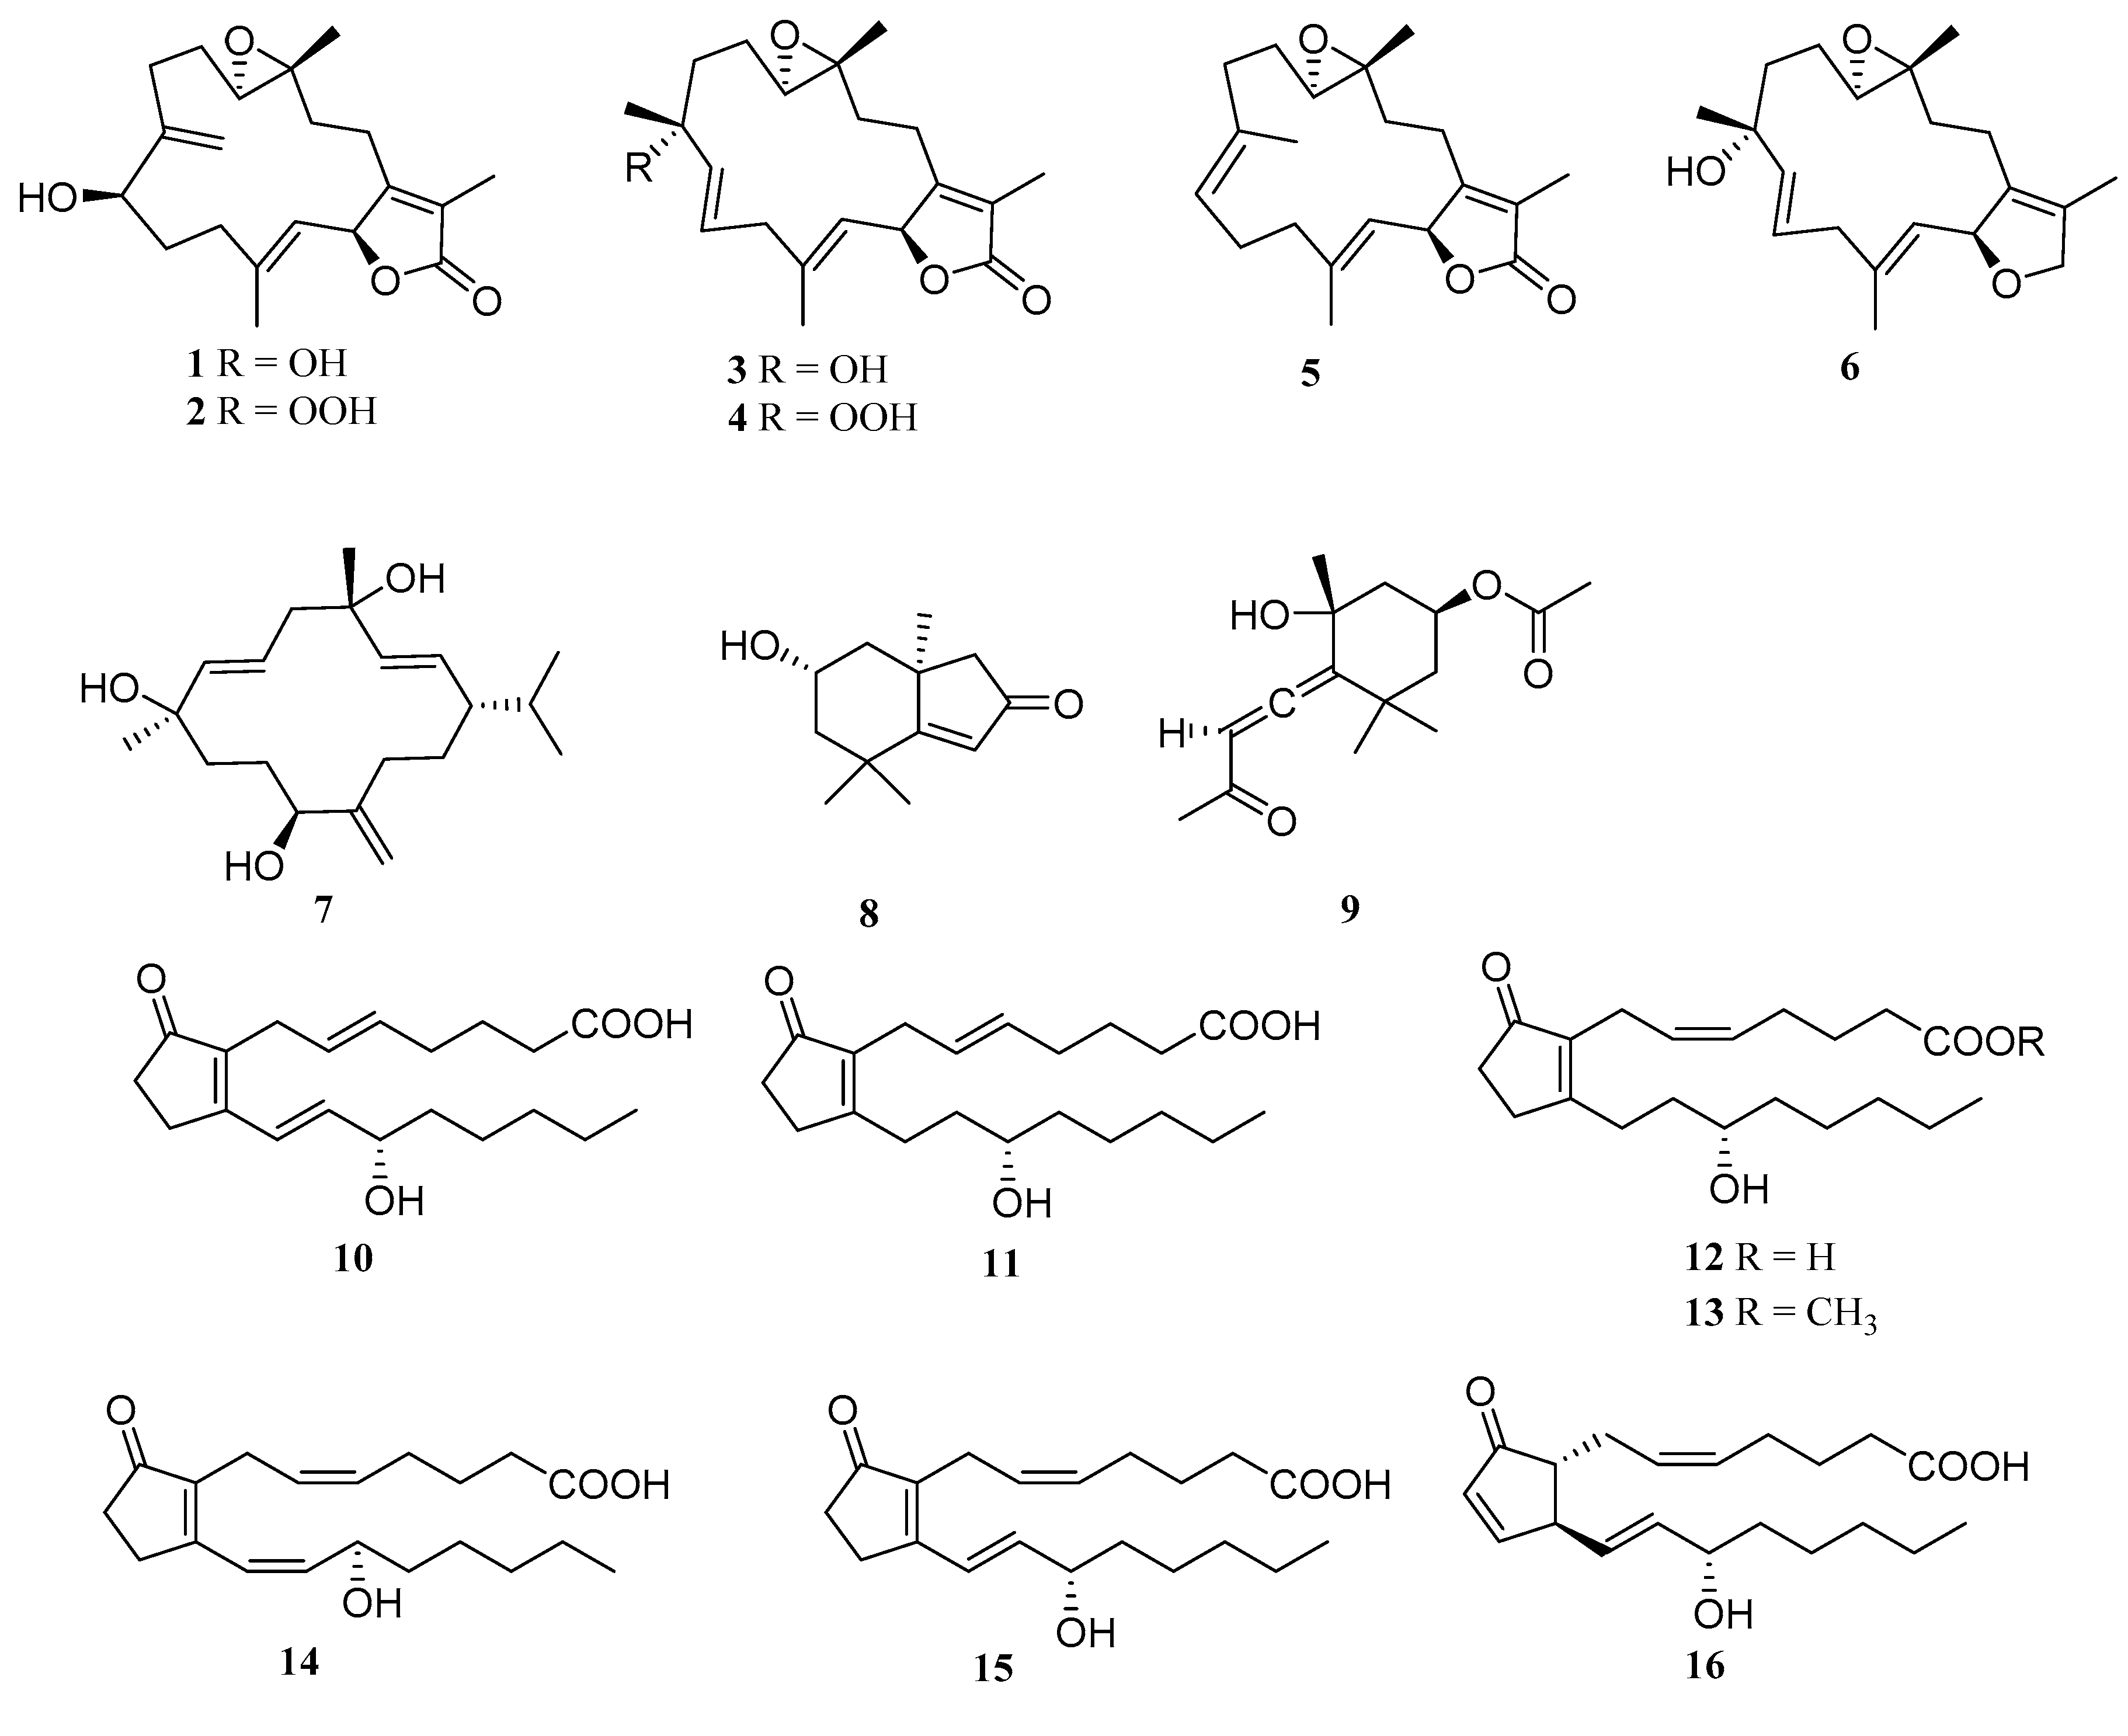
Anti-Inflammatory Cembrane-Type Diterpenoids and Prostaglandins from Soft Coral Lobophytum sarcophytoides

 ,
,  and
and
Abstract
:1. Introduction
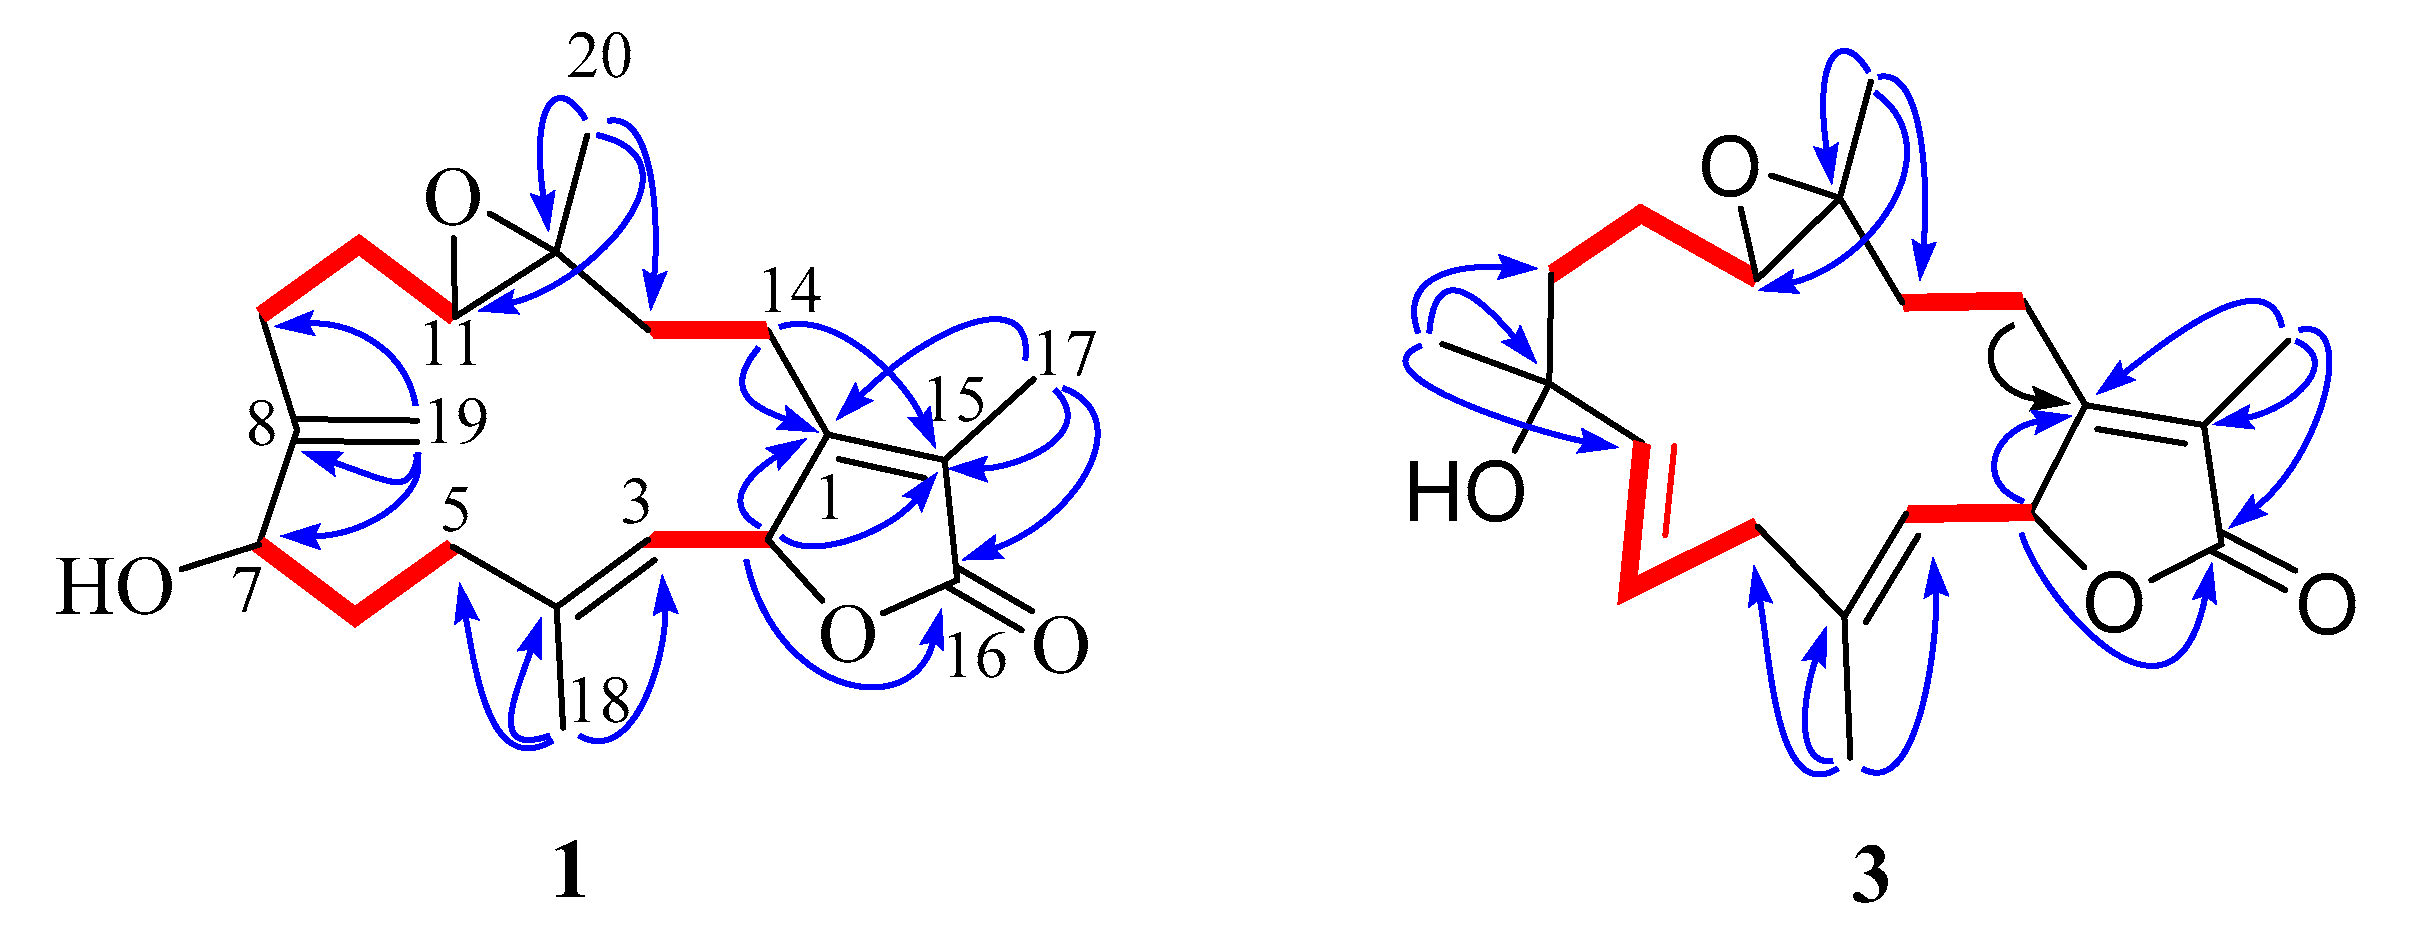
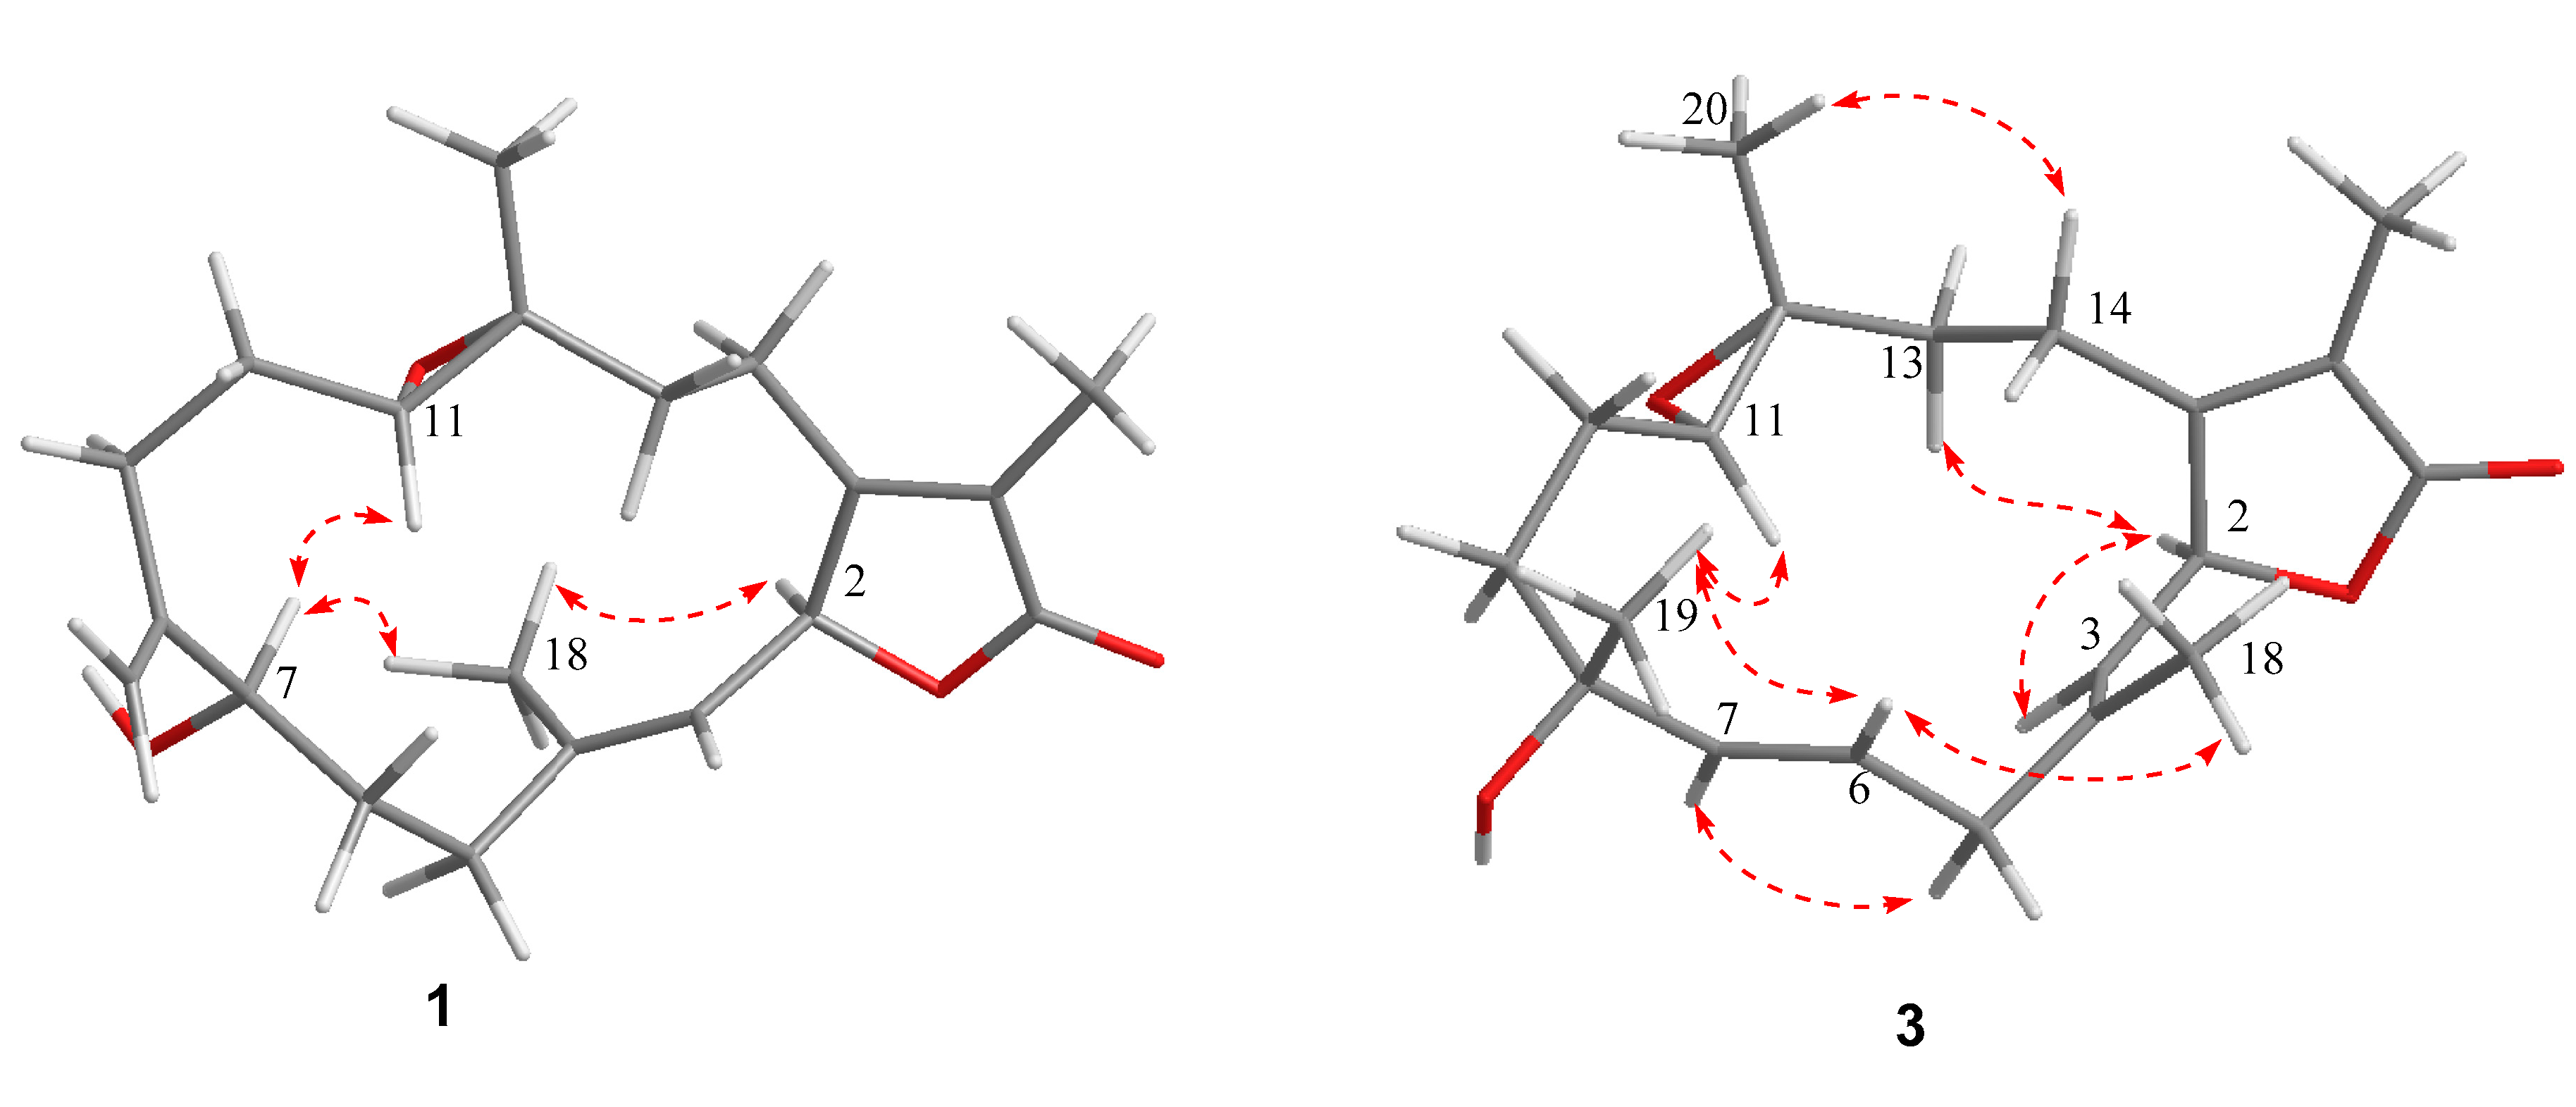
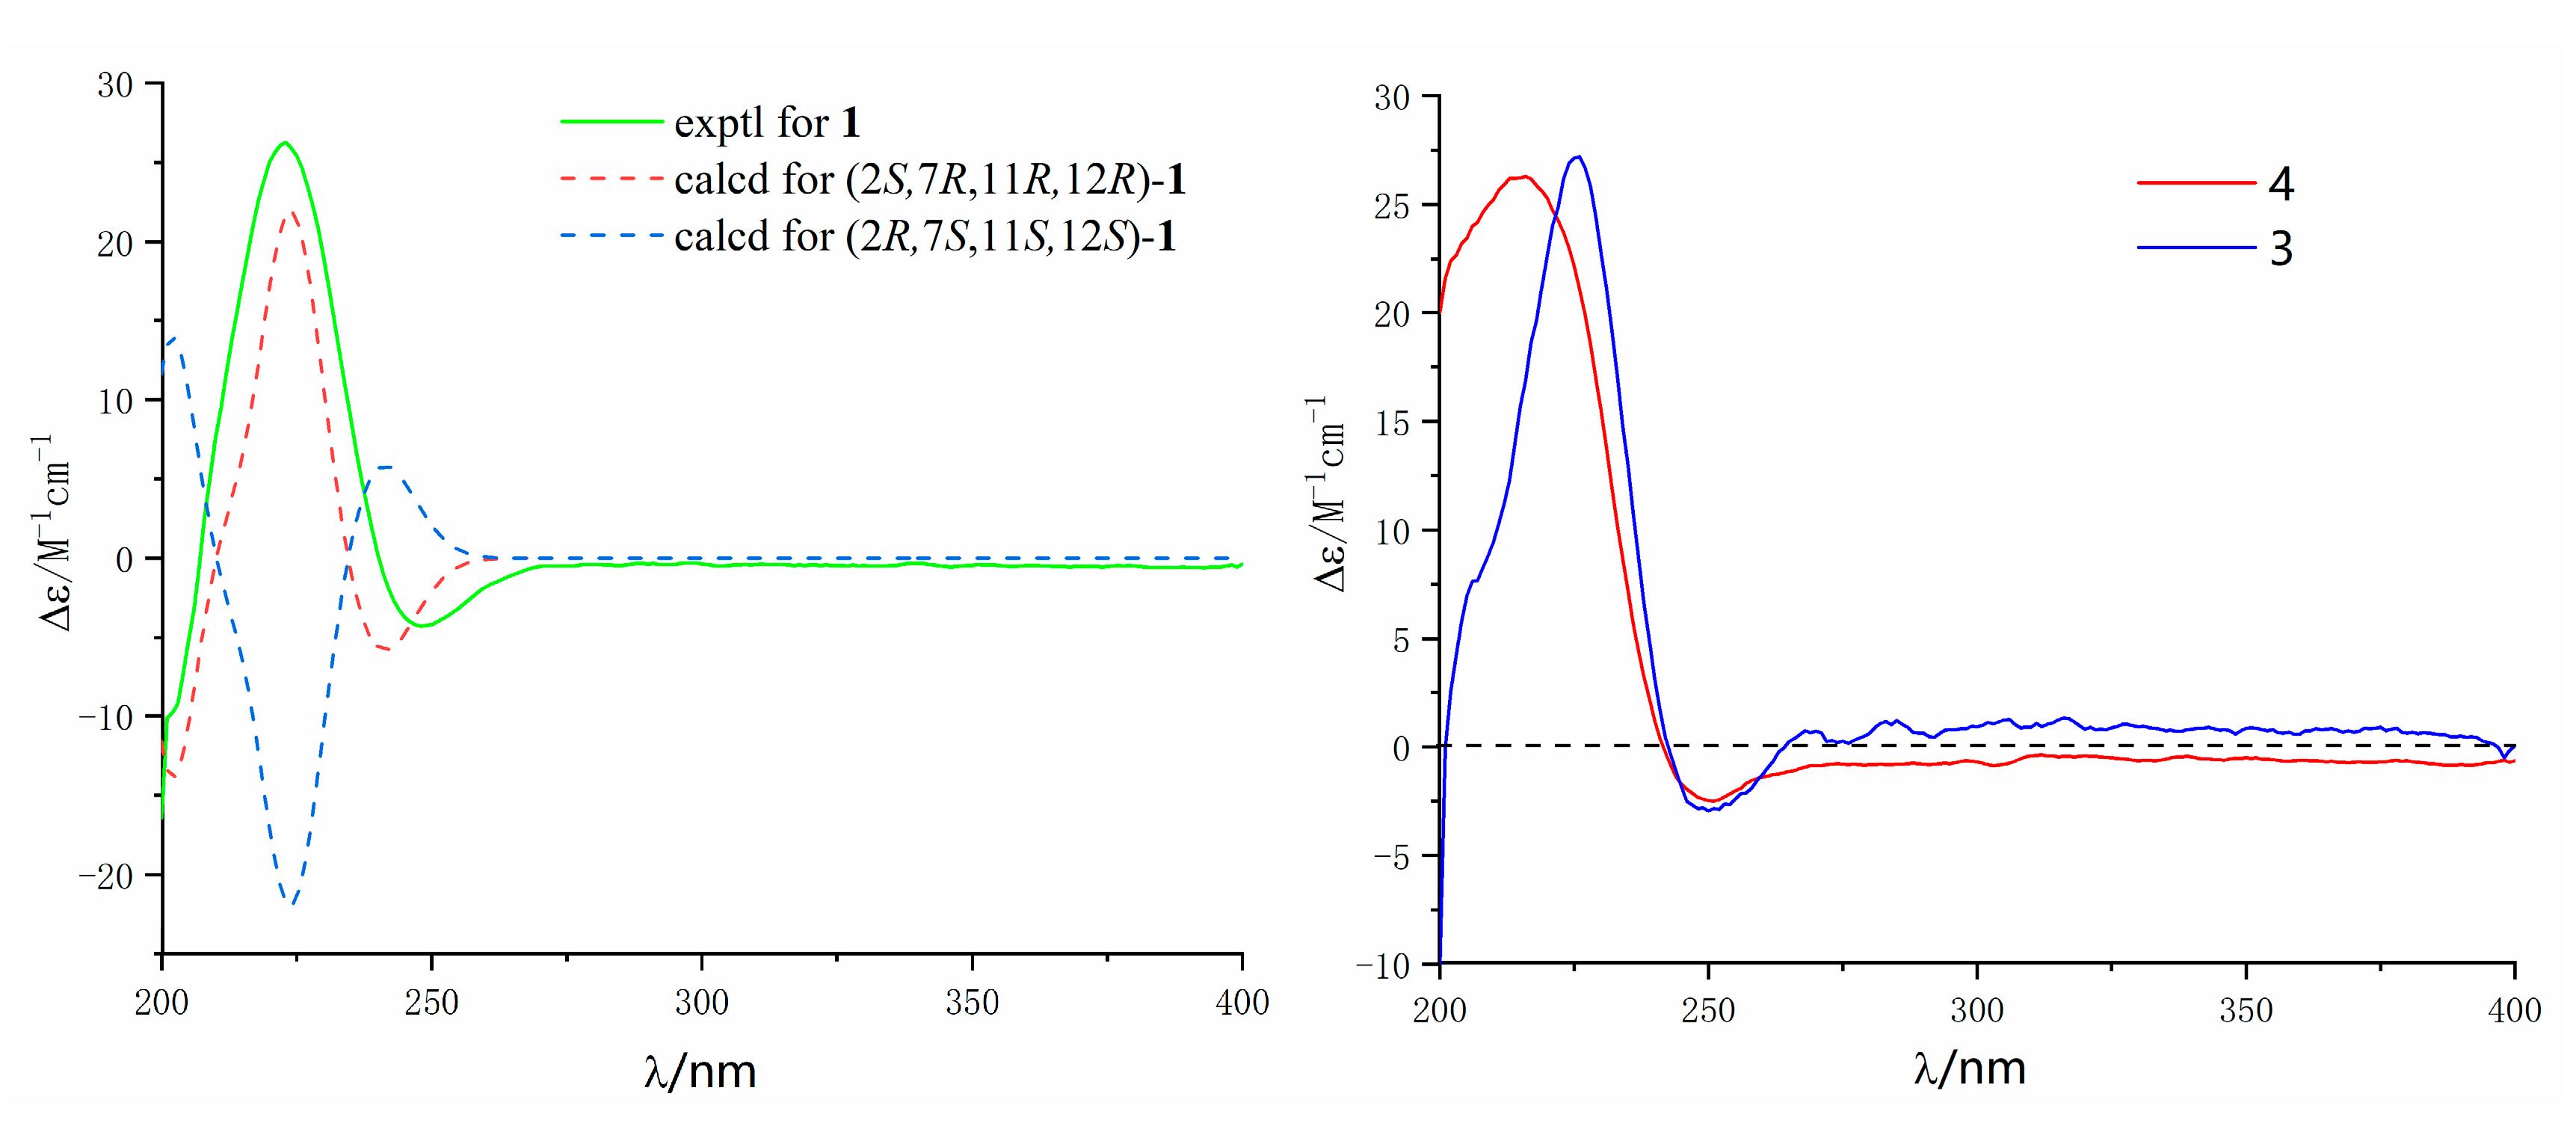
2. Results and Discussion
3. Materials and Methods
3.1. General Experimental Procedures
3.2. Biological Material
3.3. Extraction, Isolation and Characterization
3.3.1. Lobophytin A (1)
3.3.2. Lobophytin B (3)
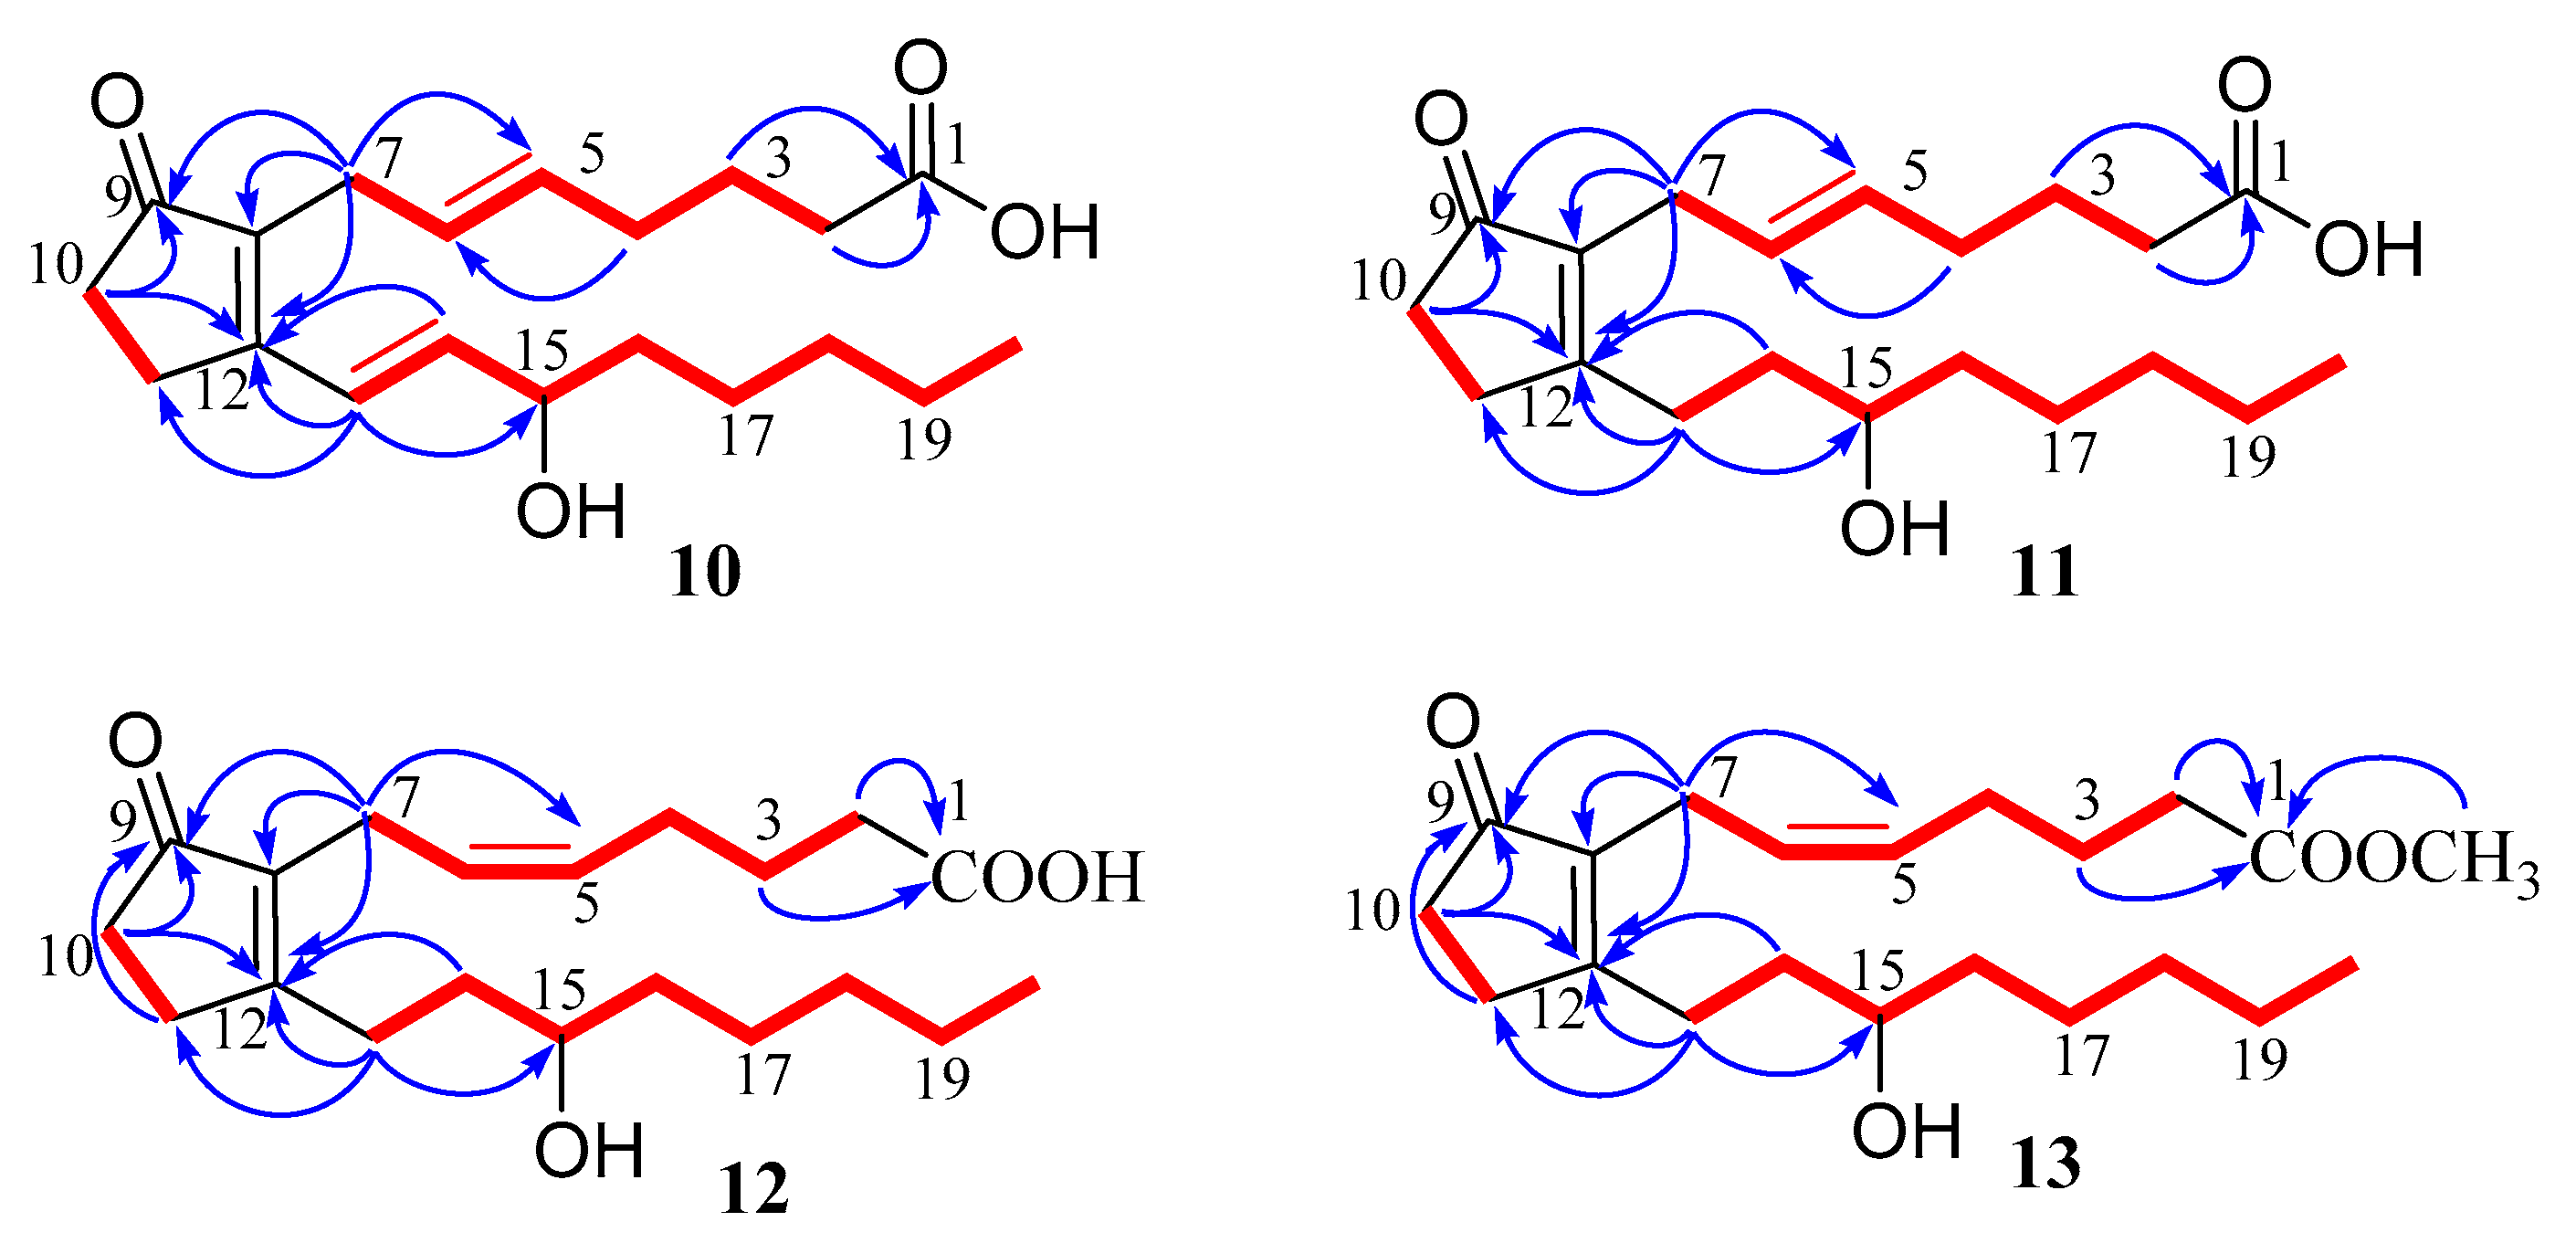
3.3.3. (5E)-PGB2 (10)
3.3.4. (5E)-13,14-dihydro-PGB2 (11)
3.3.5. 13,14-dihydro-PGB2 (12)
3.3.6. 13,14-dihydro-PGB2-Me (13)
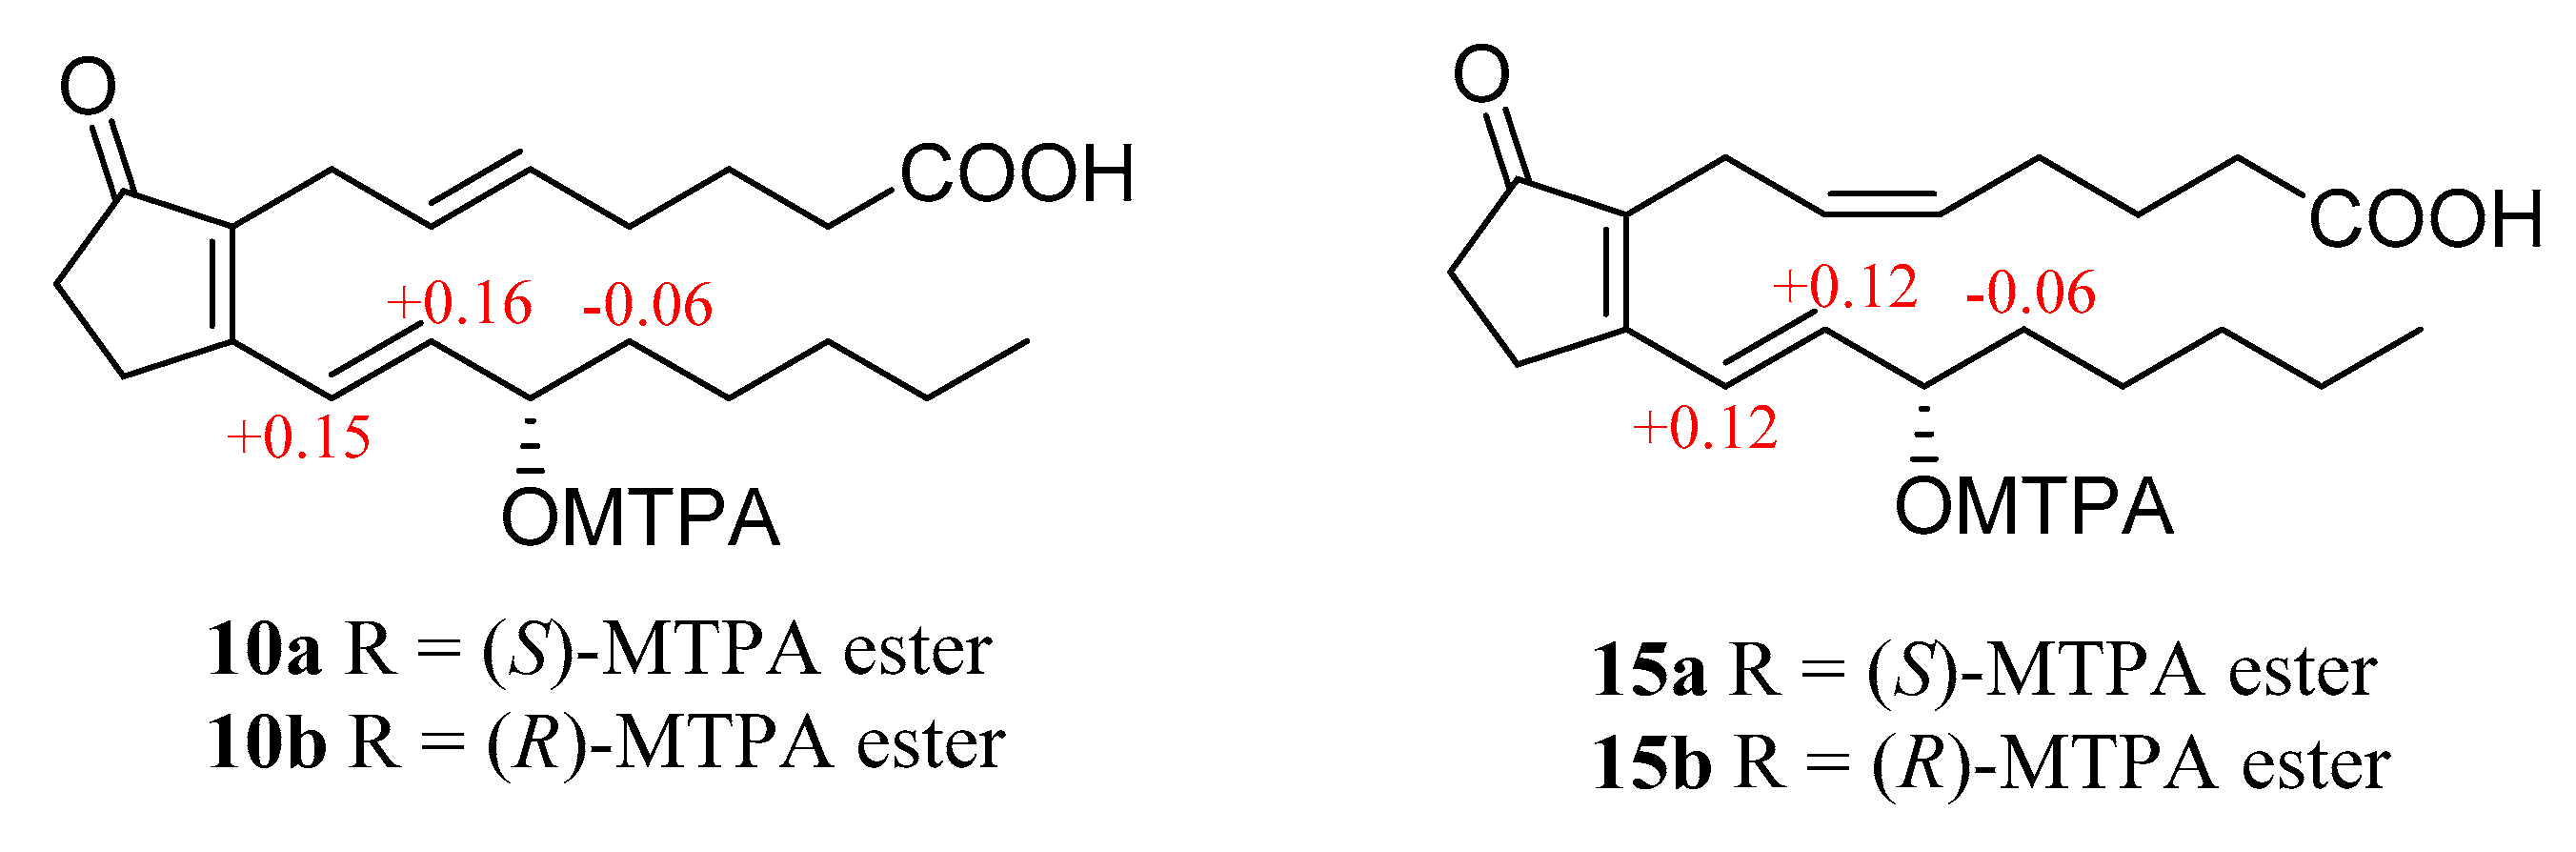
3.4. Preparation of (S)-MTPA Ester and (R)-MTPA Ester
3.4.1. (S)-MTPA Ester (15a) and (R)-MTPA Ester (15b)
3.4.2. (S)-MTPA Ester (10a) and (R)-MTPA Ester (10b)
3.5. Calculation of ECD Spectra
3.6. Cytotoxic Assay
3.7. Anti-Inflammation Bioassays
4. Conclusions
Supplementary Materials
Author Contributions
Funding
Acknowledgments
Conflicts of Interest
References
- Wen, T.; Ding, Y.; Deng, Z.; Van Ofwegen, L.; Proksch, P.; Lin, W. Sinulaflexiolides A−K, cembrane-type diterpenoids from the chinese soft coral Sinularia flexibilis. J. Nat. Prod. 2008, 71, 1133–1140. [Google Scholar] [CrossRef] [PubMed]
- Rodrigues, I.G.; Miguel, M.G.; Mnif, W. A Brief Review on New Naturally Occurring Cembranoid Diterpene Derivatives from the Soft Corals of the Genera Sarcophyton, Sinularia, and Lobophytum since 2016. Molecules 2019, 24, 781. [Google Scholar] [CrossRef] [PubMed]
- Yang, B.; Zhou, X.F.; Lin, X.P.; Liu, J.; Peng, Y.; Yang, X.W.; Liu, Y. Cembrane Diterpenes Chemistry and Biological Properties. Curr. Org. Chem. 2012, 16, 1512–1539. [Google Scholar] [CrossRef] [Green Version]
- Berrue, F.; Kerr, R.G. Diterpenes from gorgonian corals. Nat. Prod. Rep. 2009, 26, 681–710. [Google Scholar] [CrossRef] [PubMed]
- Zhang, W.; Krohn, K.; Ding, J.; Miao, Z.H.; Zhou, X.H.; Chen, S.H.; Pescitelli, G.; Salvadori, P.; Kurtan, T.; Guo, Y.W. Structural and stereochemical studies of α-methylene-γ-lactone-bearing cembrane diterpenoids from a South China Sea soft coral Lobophytum crassum. J. Nat. Prod. 2008, 71, 961–966. [Google Scholar] [CrossRef] [PubMed]
- Cheng, S.Y.; Wen, Z.H.; Wang, S.K.; Chiou, S.F.; Hsu, C.H.; Dai, C.F.; Duh, C.Y. Anti-inflammatory cembranolides from the soft coral Lobophytum durum. Bioorg. Med. Chem. 2009, 17, 3763–3769. [Google Scholar] [CrossRef] [PubMed]
- Lai, K.H.; You, W.J.; Lin, C.C.; El-Shazly, M.; Liao, Z.J.; Su, J.H. Anti-Inflammatory Dembranoids from the Soft Coral Lobophytum crassum. Mar. Drugs 2017, 15, 327. [Google Scholar] [CrossRef]
- Thao, N.P.; Luyen, B.T.; Brun, R.; Kaiser, M.; Van Kiem, P.; Van Minh, C.; Schmidt, T.J.; Kang, J.S.; Kim, Y.H. Anti-Protozoal Activities of Cembrane-Type Diterpenes from Vietnamese Soft Corals. Molecules 2015, 20, 12459–12468. [Google Scholar] [CrossRef] [Green Version]
- Zhang, J.; Tang, X.; Han, X.; Feng, D.; Luo, X.; Ofwegen, L.V.; Li, P.; Li, G. Sarcoglaucins A-I, new antifouling cembrane-type diterpenes from the South China Sea soft coral Sarcophyton glaucum. Org. Chem. Front. 2019, 6, 2004–2013. [Google Scholar] [CrossRef]
- Rashid, M.A.; Gustafson, K.R.; Boyd, M.R. HIV-inhibitory cembrane derivatives from a Philippines collection of the soft coral Lobophytum species. J. Nat. Prod. 2000, 63, 531–533. [Google Scholar] [CrossRef]
- Peng, H.; Chen, F.E. Recent advances in asymmetric total synthesis of prostaglandins. Org. Biomol. Chem. 2017, 15, 6281–6301. [Google Scholar] [CrossRef]
- Bergström, S.; Carlson, L.A.; Weeks, J.R. The prostaglandins: A family of biologically active lipids. Pharmacol. Rev. 1968, 20, 1–48. [Google Scholar]
- Li, S.; Ye, F.; Zhu, Z.; Huang, H.; Mao, S.; Guo, Y. Cembrane-type diterpenoids from the South China Sea soft coral Sarcophyton mililatensis. Acta Pharm. Sin. B 2018, 8, 944–955. [Google Scholar] [CrossRef]
- Su, B.N.; Takaishi, Y. Morinins H−K, Four Novel Phenylpropanol Ester Lipid Metabolites from Morinachinensis. J. Nat. Prod. 1999, 62, 1325–1327. [Google Scholar] [CrossRef] [PubMed]
- Kusumi, T.; Yamada, K.; Ishitsuka, M.O.; Fujita, Y.; Kakisawa, H. New cembranoids from the Okinawan soft coral Sinularia mayi. Chem. Lett. 1990, 19, 1315–1318. [Google Scholar] [CrossRef]
- Olsson, E.; Eklund, A.M.; Wahlberg, I. Tobacco Chemistry. 72. Five New Cembratrienetriols from Tobacco. Acta Chem. Scand. 1991, 45, 92–98. [Google Scholar] [CrossRef]
- Hiraga, Y.; Taino, K.; Kurokawa, M.; Takagi, R.; Ohkata, K. (−)-Loliolide and Other Germination Inhibitory Active Constituents in Equisetum Arvense. Nat. Prod. Lett. 1997, 10, 181–186. [Google Scholar] [CrossRef]
- Doi, Y.; Ishibashi, M.; Yamaguchi, N.; Kobayashi, J.I. Isolation of Apo-9′-fucoxanthinone from the Cultured Marine Dinoflagellate Amphidinium sp. J. Nat. Prod. 1995, 58, 1097–1099. [Google Scholar] [CrossRef]
- Reina, E.; Ramos, F.A.; Castellanos, L.; Aragon, M.; Ospina, L.F. Anti-inflammatory R-prostaglandins from Caribbean Colombian soft coral Plexaura homomalla. J. Pharm. Pharmacol. 2013, 65, 1643–1652. [Google Scholar] [CrossRef]
- Panosyan, A.G. Methods of analyzing prostaglandins. Chem. Nat. Comp. 1978, 14, 666–673. [Google Scholar] [CrossRef]
- Hoye, T.R.; Jeffrey, C.S.; Shao, F. Mosher ester analysis for the determination of absolute configuration of stereogenic (chiral) carbinol carbons. Nat. Protoc. 2007, 2, 2451–2458. [Google Scholar] [CrossRef]
- Chen, S.; Liu, Z.; Li, H.; Xia, G.; Lu, Y.; He, L.; Huang, S.; She, Z. β-Resorcylic acid derivatives with α-glucosidase inhibitory activity from Lasiodiplodia sp. ZJ-HQ1, an endophytic fungus in the medicinal plant Acanthus ilicifolius. Phytochem. Lett. 2015, 13, 141–146. [Google Scholar] [CrossRef]
- Chen, S.; Ding, M.; Liu, W.; Huang, X.; Liu, Z.; Lu, Y.; Liu, H.; She, Z. Anti-inflammatory meroterpenoids from the mangrove endophytic fungus Talaromyces amestolkiae YX1. Phytochemistry 2018, 146, 8–15. [Google Scholar] [CrossRef]
- Chen, S.; Chen, D.; Cai, R.; Cui, H.; Long, Y.; Lu, Y.; Li, C.; She, Z. Cytotoxic and Antibacterial Preussomerins from the Mangrove Endophytic Fungus Lasiodiplodia theobromae ZJ-HQ1. J. Nat. Prod. 2016, 79, 2397–2402. [Google Scholar] [CrossRef]
- Zhang, P.; Deng, Y.; Lin, X.; Chen, B.; Li, J.; Liu, H.; Chen, S.; Liu, L. Anti-inflammatory Mono- and Dimeric Sorbicillinoids from the Marine-Derived Fungus Trichoderma reesei 4670. J. Nat. Prod. 2019, 82, 947–957. [Google Scholar] [CrossRef]


| No. | 1 | 3 | ||
|---|---|---|---|---|
| δC | δH, Mult. | δC | δH, Mult. | |
| 1 | 162.8, C | 161.4, C | ||
| 2 | 79.8, CH | 5.64, dd (10.0, 1.7) | 79.2, CH | 5.42, d (10.2) |
| 3 | 122.9, CH | 4.99, dt (10.0, 1.0) | 120.1, CH | 4.90, d (10.2) |
| 4 | 143.5, C | 143.7, C | ||
| 5 | 36.7, CH2 | 2.19, m 2.56, ddd (13.1, 9.9, 3.3) | 41.7, CH2 | 2.73, dd (13.8, 7.2) 2.81, dd (13.8, 7.2) |
| 6 | 32.9, CH2 | 1.40, m 2.00, m | 125.2, CH | 5.83, dt (15.6, 7.2) |
| 7 | 70.1, CH | 3.83, dd (10.7, 6.3) | 140.2, CH | 5.68, d (15.6) |
| 8 | 155.1, C | 72.6, C | ||
| 9 | 31.3, CH2 | 2.13, m 2.37, (13.7, 7.9, 2.8) | 39.6, CH2 | 1.81, m |
| 10 | 31.7, CH2 | 1.41, m | 24.1, CH2 | 1.64, m 1.77, m |
| 11 | 62.1, CH | 2.69, dd (10.3, 2.6) | 62.0, CH | 2.76, m |
| 12 | 61.1, C | 60.1, C | ||
| 13 | 35.0, CH2 | 1.56, m 1.91, m | 35.7, CH2 | 1.27, m 1.9, m |
| 14 | 22.4, CH2 | 2.27, m | 23.7, CH2 | 2.20, m 2.38, m |
| 15 | 123.7, C | 123.8, C | ||
| 16 | 174.5, C | 174.7, C | ||
| 17 | 8.8, CH3 | 1.79, s | 9.1, CH3 | 1.85, s |
| 18 | 16.0, CH3 | 1.91, s | 17.4, CH3 | 1.83, s |
| 19 | 110.5, CH2 | 4.92, d (0.9) 5.19, t (1.6) | 28.5, CH3 | 1.41, s |
| 20 | 17.9, CH3 | 1.21, s | 16.7, CH3 | 1.29, s |
| No. | 10 a | 11 a | 12 a | 13 b | ||||
|---|---|---|---|---|---|---|---|---|
| δC, Type | δH, Mult (J in Hz) | δC, Type | δH, Mult (J in Hz) | δC, Type | δH, Mult (J in Hz) | δC, Type | δH, Mult (J in Hz) | |
| 1 | 177.6, C | 178.0, C | 174.1, C | 177.8, C | ||||
| 2 | 34.7, CH2 | 2.19, t (6.9) | 34.6, CH2 | 2.22, t (7.4) | 33.8, CH2 | 2.33, t (7.5) | 34.6, CH2 | 2.30, t (7.4) |
| 3 | 26.0, CH2 | 1.59, m | 25.9, CH2 | 1.61, m | 25.6, CH2 | 1.66, m | 26.1, CH2 | 1.66, m |
| 4 | 32.9, CH2 | 1.97, m | 32.9, CH2 | 1.99, m | 27.2, CH2 | 2.20, q (7.2) | 27.7, CH2 | 2.20, q (7.1) |
| 5 | 131.8, CH | 5.37, m | 131.5, CH | 5.39, m | 129.8, CH | 5.32, m | 130.6, CH | 5.34, m |
| 6 | 128.3, CH | 5.37, m | 128.4, CH | 5.39, m | 128.2, CH | 5.32, m | 128.0, CH | 5.30, m |
| 7 | 26.7, CH2 | 2.95, m | 26.8, CH2 | 2.89, m | 21.9, CH2 | 2.92, m | 22.1, CH2 | 2.94, d (6.6) |
| 8 | 139.3, C | 139.3, C | 139.1, C | 139.9, C | ||||
| 9 | 211.9, C | 212.4, C | 208.3, C | 212.3, C | ||||
| 10 | 34.7, CH2 | 2.40, m | 35.2, CH2 | 2.36, m | 34.5, CH2 | 2.25, m | 35.2, CH2 | 2.35, m |
| 11 | 26.7, CH2 | 2.71, m | 30.4, CH2 | 2.59, m | 29.6, CH2 | 2.55, m | 30.3, CH2 | 2.58, m |
| 12 | 167.5, C | 178.8, C | 174.6, C | 178.2, C | ||||
| 13 | 124.3, CH | 6.86, d (15.7) | 28.7, CH2 | 2.53, m | 28.3, CH2 | 2.55, m | 28.8, CH2 | 2.55, m |
| 2.61, m | 2.62, m | 2.61, m | ||||||
| 14 | 143.7, CH | 6.37, dd (15.7, 5.8) | 35.9, CH2 | 1.58, m | 36.0, CH2 | 1.59, m | 35.9, CH2 | 1.59, m |
| 1.67, m | 1.69, m | 1.67, m | ||||||
| 15 | 72.8, CH | 4.23, q (5.8) | 72.2, CH | 3.53 | 71.2, CH | 3.57 | 72.2, CH | 3.53, m |
| 16 | 38.1, CH2 | 1.54, m | 38.4, CH2 | 1.45, m | 38.4, CH2 | 1.45, m | 38.4, CH2 | 1.45, m |
| 17 | 26.2, CH2 | 1.32, m | 26.5, CH2 | 1.32, m | 26.2, CH2 | 1.34, m | 26.5, CH2 | 1.32, m |
| 1.41, m | 1.45, m | 1.46, m | 1.45, m | |||||
| 18 | 32.9, CH2 | 1.31, m | 33.1, CH2 | 1.31, m | 32.7, CH2 | 1.30, m | 33.1, CH2 | 1.31, m |
| 19 | 23.7, CH2 | 1.31, m | 23.7, CH2 | 1.32, m | 23.4, CH2 | 1.31, m | 23.7, CH2 | 1.32, m |
| 20 | 14.4, CH3 | 0.88, t (6.7) | 14.3, CH3 | 0.90, t (6.9) | 14.3, CH3 | 0.88 t (6.7) | 14.4, CH3 | 0.90, t (6.7) |
| OCH3 | 51.5, CH3 | 3.62, s | ||||||
© 2019 by the authors. Licensee MDPI, Basel, Switzerland. This article is an open access article distributed under the terms and conditions of the Creative Commons Attribution (CC BY) license (http://creativecommons.org/licenses/by/4.0/).
Share and Cite
Shen, H.; Liu, X.; Jiang, M.; Luo, G.; Wu, Z.; Chen, B.; Li, J.; Liu, L.; Chen, S. Anti-Inflammatory Cembrane-Type Diterpenoids and Prostaglandins from Soft Coral Lobophytum sarcophytoides. Mar. Drugs 2019, 17, 481. https://doi.org/10.3390/md17080481
Shen H, Liu X, Jiang M, Luo G, Wu Z, Chen B, Li J, Liu L, Chen S. Anti-Inflammatory Cembrane-Type Diterpenoids and Prostaglandins from Soft Coral Lobophytum sarcophytoides. Marine Drugs. 2019; 17(8):481. https://doi.org/10.3390/md17080481
Chicago/Turabian StyleShen, Hongjie, Xiaowan Liu, Minghua Jiang, Guangyuan Luo, Zhenger Wu, Bin Chen, Jing Li, Lan Liu, and Senhua Chen. 2019. "Anti-Inflammatory Cembrane-Type Diterpenoids and Prostaglandins from Soft Coral Lobophytum sarcophytoides" Marine Drugs 17, no. 8: 481. https://doi.org/10.3390/md17080481
APA StyleShen, H., Liu, X., Jiang, M., Luo, G., Wu, Z., Chen, B., Li, J., Liu, L., & Chen, S. (2019). Anti-Inflammatory Cembrane-Type Diterpenoids and Prostaglandins from Soft Coral Lobophytum sarcophytoides. Marine Drugs, 17(8), 481. https://doi.org/10.3390/md17080481