Article

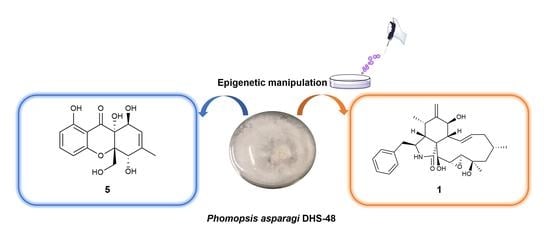
Epigenetic Manipulation Induced Production of Immunosuppressive Chromones and Cytochalasins from the Mangrove Endophytic Fungus Phomopsis asparagi DHS-48

Collaborative Innovation Center of Ecological Civilization, School of Chemical Engineering and Technology, Hainan University, Haikou 570228, China
*
Author to whom correspondence should be addressed.
These authors contributed equally to this work.
Mar. Drugs 2022, 20(10), 616; https://doi.org/10.3390/md20100616
Submission received: 9 September 2022 / Revised: 26 September 2022 / Accepted: 28 September 2022 / Published: 29 September 2022
(This article belongs to the Special Issue Bio-Active Products from Mangrove Ecosystems)

Abstract

:
A mangrove endophytic fungus Phomopsis asparagi DHS-48 was found to be particularly productive with regard to the accumulation of substantial new compounds in our previous study. In order to explore its potential to produce more unobserved secondary metabolites, epigenetic manipulation was used on this fungus to activate cryptic or silent genes by using the histone deacetylase (HDAC) inhibitor sodium butyrate and the DNA methyltransferase (DNMT) inhibitor 5-azacytidine (5-Aza). Based on colony growth, dry biomass, HPLC, and 1H NMR analyses, the fungal chemical diversity profile was significantly changed compared with the control. Two new compounds, named phaseolorin J (1) and phomoparagin D (5), along with three known chromones (24) and six known cytochalasins (611), were isolated from the culture treated with sodium butyrate. Their structures, including their absolute configurations, were elucidated using a combination of detailed HRESIMS, NMR, and ECD and 13C NMR calculations. The immunosuppressive and cytotoxic activities of all isolated compounds were evaluated. Compounds 1 and 8 moderately inhibited the proliferation of ConA (concanavalin A)-induced T and LPS (lipopolysaccharide)-induced B murine spleen lymphocytes. Compound 5 exhibited significant in vitro cytotoxicity against the tested human cancer cell lines Hela and HepG2, which was comparative to the positive control adriamycin and fluorouracil. Our finding demonstrated that epigenetic manipulation should be an efficient strategy for the induction of new metabolites from mangrove endophytic fungi.

Graphical Abstract

1. Introduction

Mangrove endophytic fungi, which adapted to extreme environmental stresses, such as high salinity, high temperature, high humidity, light, and air limitations, are considered to be a reliable source of unique metabolites [1,2,3,4]. Exploring the secondary metabolites with excellent biological activity and pharmacy value from mangrove-derived fungi has become a new hotspot in drug development [5]. Nevertheless, genome sequencing unveils that most mangrove endophytic fungi possess significantly more biosynthetic gene clusters than the number of compounds they produce under conventional culture conditions [6,7,8,9,10]. These facts inspire researchers to develop suitable strategies to stimulate these gene clusters described as ‘silent’, ‘orphan’, and ‘cryptic’ that could, therefore, provide access to an enormous reservoir of structurally novel secondary metabolites to enhance the potential pharmaceutical usage. Several approaches have been successfully used to elicit untapped metabolite profiles, such as OSMAC (One Strain of Many Compounds), which includes media composition, UV irradiation, shaking, incubation temperature, and epigenetic manipulation; and genome mining strategies, which include transcriptional regulator modulation, promoter engineering, and the heterologous expression [11,12,13,14,15]. The methods that use genetic engineering techniques require a relatively sophisticated knowledge of the biology of the producing or surrogate host organisms [16]. In contrast, epigenetic manipulation has been demonstrated to be an effective method for enhancing secondary metabolite expression without altering genes or causing the hereditable manipulation of organisms [17]. There are three main types of small molecule epigenetic regulators known to modulate secondary metabolite expression: DNA methyltransferase (DNMT) inhibitors, 5-azacytidine (5-aza) and N-phthalyl-L-tryptophan (RG108); histone deacetylase (HDAC) inhibitors, suberoylanilide hydroxamic acid (SAHA), suberoylbis hydroxamic acid (SBHA), nicotinamide, sodium butyrate, valproic acid, and octanoylhydroxamic acid, and histone acetyltransferase (HAT) inhibitor, and anacardic acid. These inhibitors have been added alone [18,19,20,21,22,23] or in combination [24,25,26] to culture media, successfully inducing or changing the metabolic pathways to enhance the production and/or accumulation of different compounds that are not detected in axenic cultures. For example, the production of cytosporones active against malaria and methicillin-resistant Staphylococcus aureus was enhanced, and a previously undescribed cytosporone R was isolated when the histone deacetylase inhibitor (HDAC) sodium butyrate and the DNA methyltransferase (DNMT) inhibitor 5-azacytidine (5-aza) were employed to activate the genes of the marine fungus Leucostoma persoonii, an endophyte of mangroves [27]. Baker’s group screened the potential of mangrove-derived endophytic fungi as a source of new antibiotics when cultured in the presence and absence of small molecule epigenetic modulators. Of 1608 extracts from 530 fungal isolates, nearly half (44%) of those fungi producing active extracts only did so following sodium butyrate and 5-aza treatment [28]. These cases might validate that chemical epigenetic manipulation is feasible to efficiently uncover cryptic secondary metabolites from mangrove endophytic fungi. However, the successful examples of epigenetic manipulation applied to mangrove endophytic fungi are limited to confirm the conclusion.
The coelomycetous genus Phomopsis belongs to the family Diaporthaceae and consists of approximately 900 fungal species from a wide range of hosts [29]. The different species belonging to the genus Phomopsis are especially known for producing a wide variety of compounds with pharmacological properties, notably cytotoxic [30,31,32], antimicrobial [33,34,35], β-site amyloid precursor protein cleaving enzyme 1 (BACE1) inhibitory [36], anti-Tobacco mosaic virus (TMV) [37] and immunosuppressive activities [38]. As part of our research on discovering structurally novel and biologically active natural products from mangrove-derived endophytic fungal strains [39,40,41,42,43,44,45,46,47,48], a strain of Phomopsis asparagi DHS-48 isolated from the fresh root of Rhizophora mangle attracted our attention for the characterization of a series of immunosuppressive chromones [46] and cytochalasins [38]. In the present study, in order to tap the metabolic potential of this titled fungal strain, epigenetic manipulation was applied to activate its cryptic secondary biosynthetic pathways. The colony growth, dry biomass, 1H NMR, and HPLC chromatogram were detected under the cultivation with small molecule epigenetic modifiers, the DNMT inhibitor 5-aza, the HDAC inhibitor sodium butyrate, and a combination of these inhibitors at various concentrations. A follow-up fermentation of an optional modifier (50 µM sodium butyrate) led to the isolation of two new compounds, phaseolorin J (1) and phomoparagin D (5), along with nine known phaseolorin D (2) [49], chaetochromone B (3) [50], pleosporalin D (4) [51], cytochalasins J, J1, J2, J3, H (610) [31] and phomopchalasin D (11) [38]. Herein, we report the epigenetic manipulation of this fungus, and the isolation, structural determination, and bioactivity evaluation of the induced products (Figure 1). A hypothetical biosynthetic pathway for the isolated metabolites is also discussed.

2. Results

2.1. Epigenetic Manipulation

The epigenetic manipulation of Phomopsis asparagi DHS-48 was conducted in both liquid medium and solid medium by using the DNMT inhibitor 5-aza, the HDAC inhibitor sodium butyrate, and the combination of these inhibitors at different concentrations (0, 10, 50, 100 µM). Cultivation without these epigenetic modifiers was used as a control. By comparing the colony growth on PDA (Figure 2a) and dry biomass (calibration graph Figure 2b) in PDA (Figure 2c) and PDB (Figure 2d), we found that the DNMT and HDAC inhibitors produced inconsistent results, and 50 µM sodium butyrate solid fermentation was preferable to induce more remarkable chemical diversity of the secondary metabolites. The HPLC analyses of the EtOAc extracts of Phomopsis asparagi DHS-48 cultivated in the presence of different epigenetic agents in all the cases further confirmed our deduction (Figure S44). Consequently, a scaled-up fermentation with 50 µM sodium butyrate was carried out.
The EtOAc extracts of the mycelia and solid rice medium incubated with 50 µM sodium butyrate were subjected to HPLC analyses. By comparing with the blank control (Figure 3 and Figure S45), the production levels of the known metabolites 68, 10, and 11 were considerably enhanced in the sodium-butyrate-inhibited fermentation at the same injection concentration. In addition, certain peaks of 15 and 9 appear to be present in the chromatograms from the 50 µM HDAC inhibitor that are absent in the control group. Continuously, these differences were also supported by the fact that the 1H NMR metabolic profile (Figure 4) of EtOAc extracts showed several additional significant hydrogen resonances between 5.5 and 8.0 ppm, compared with the control group.

2.2. Structure Elucidation of the New Compounds

Phaseolorin J (1) was isolated as a light yellow amorphous powder. Its molecular formula was determined as C15H16O7 on the basis of HRESIMS data (m/z 331.0781 [M + Na] +, calcd for C15H16O7 Na 331.0788), which clearly indicated the presence of eight indices of unsaturation. The 1H and 13C NMR data of 1 (Table 1) and its 1H-1H COSY and HSQC spectra showed the presence of a series of characteristic signals for a 1,2,3-trisubstituted benzene ring (δH 6.43 (d, J = 8.2 Hz), δC 109.3, d, CH-2; δH 7.38 (t, J = 8.2 Hz), δC 138.9, d, CH-3; δH 6.52 (d, J = 8.2 Hz), δC 108.7, d, CH-4), one olefinic methine of a trisubstituted double bond (δH 5.61 (dq, J = 4.8, 1.7 Hz); δC 122.3, d, CH-7), a tertiary methyl (δH 1.86, 3H, d, 1.7; δC 19.2, q, CH3–11), an oxygenated methylene (δH 4.12, (d, J = 13.2 Hz), δH 4.03 (d, J = 13.2 Hz); δC 64.1, t, CH2-12), and two oxygenated methines (δH 4.69, 1H, br s, δC 74.5, d, CH-5; 4.55, 1H, d, J = 4.8 Hz, δC 67.9, d, CH-8). The magnitude of the 1H-1H COSY spectrum led to the observation of long-range correlations, including the assignments of vicinal coupling with H-5 and proton H-7 on the cis-substituted double bond, as well as homoallylic couplings with H-8 and CH3-11. A comparison of the 1H and 13C NMR data of 1 with those of phaseolorin D (2) [52] revealed that both had the same chromone core, except for the presence of one trisubstituted double bond at C-6 (δ 140.5) and C-7 (δ 122.3) instead of sp3 methine (C-6) and sp3 methylene (C-7) in 2. Confirming evidence was obtained from the 1H-1H COSY correlation from olefinic proton (δH 5.61, H-7) to the oxygenated methine (δH 4.69, H-8) and HMBC correlations from H3-11 to C-5, C-6 and C-7 (Figure 5).
In the NOESY experiment of 1 (Figure 6), the correlations of H2-12/H-5 indicated the same spatial orientation. Biogenetically, the configuration of 1 was deduced to be the same as that of 2, and the calculated ECD spectrum method can be used to predict the absolute configuration of C-8a and C-10a, respectively (Figure 7). Consequently, the absolute configuration of C-5 was assigned to be S. However, neither the lack of NOE between H-5/H-8 nor the adjacent coupling constant of J7,8eq = 4.8 Hz between H-7 and H-8 supported the relative configuration between H-5 and H-8. To solve this problem, the δC values of two plausible epimers, namely 5S,5aS,8S,8aR-1 and 5S,5aS,8R,8aR-1 (8-epi-1), were performed after the optimization of the selected conformers at the B3LYP/6-31G(d) level. The results showed that the calculated 13C NMR spectrum of the truncated model 5S,5aS,8S,8aR -1 perfectly matched with the experimental one (Figure 8). Therefore, the configuration of 1 was conclusively assigned and given the tentative name phaseolorin J.
Phomoparagin D (5) was obtained as a colorless amorphous powder. The molecular formula of 5 was established as C28H37NO5 from its HRESIMS (m/z 506.2304 [M + K] +, calcd for C28H37NO5K 506.2303. The 1H NMR spectrum (Table 2) showed proton signals for a mono substituted phenyl at δH (7.22−7.31, 5H), a tertiary methyl at δH (0.92, 3H, s, H3-23), two secondary methyl groups at δH (0.80, 3H, d, J = 6.7 Hz, H3-11; 1.02, 3H, d, J = 6.8 Hz, H3-22), an exocyclic methylene group at δH (5.22 and 5.01, 2H, both s, H2-12), four oxygenated methine groups at δH (3.82, 1H, d, J = 10.8 Hz, H-7; 3.21, 1H, d, J = 2.4 Hz, H-19; 2.99, 1H, m, H-20; 3.43, 1H, s, H-21), and two olefinic methine groups at δH (5.72, 1H, d, J = 15.5 Hz, 9.5 Hz, H-13; 5.54, 1H, m, H-14). The 13C NMR and DEPT spectra (Table 1) of compound 5 displayed 28 carbons, including 3 sp3 methyls, 3 sp3 methylenes, 9 sp3 methines, 2 sp3 quaternary carbons, 1 sp2 exocyclic methylene, 7 sp2 olefinic methines, and 3 sp2 quaternary carbons (2 olefinic carbon and 1 amide carbonyl). The carbon profile and characteristic 1H NMR signals, as well as the 2D NMR spectra of 5 revealed that it has a similar indole-based cytochalasin skeleton as that of cytochalasin J (6), which was first reported in 1981 as deacetylcytochalasin H from the same Phomopsis sp. [53]. The main difference between the two compounds is the lack of the typical C19-C20 double bond (δH 5.76, δC 129.3, d, CH-19; δH 5.85, δC 137.2, d, CH-20) in the macrocycle ring of the latter that was replaced by a 19, 20-epoxide ring (δH 3.21 (d, J =2.4 Hz), δC 63.1, CH-19; δH 2.99, m, δC 57.7, CH-20) in 5. The existence of the epoxide ring was deduced by the analysis of its HRESIMS data, and the molecular weight of 5 was 16 mass units larger than that of 6. This finding was supported by the 1H-1H COSY correlations of H-7/H-8/H-13/ H-14/ H-15/ H-16/ H-17/ H-18/ H-19/H-20/H-21, along with the HMBC correlations from H3-23 (δH 0.92, 3H, s) to C-17, C-18 and C-19, and H-21 (δH 3.43, 1H, s) to C-8, C-9, C-19 and C-20 (Figure 5). The diagnostic ROESY correlations (Figure 6) positioned H-3, H3-11, H-7, H3-22, H3-23, H-20, and H-21 on the α-face and H-4, H-5, H-8, H-14, H-16, and H-19 on the β-face of 5, whereas the absolute configuration was assigned by a comparison of the experimental and simulated electronic circular dichroism (ECD) spectra generated by the time-dependent density functional theory (TDDFT) calculations at the B3LYP/6-31+G(d,p) level using the Gaussian 09 program. The experimental ECD spectrum (CH3OH) for 3S, 4R, 5S, 7S, 8R, 9R, 16R, 16R, 19R, 20S, and 21R -5 matched well with the calculated spectrum (Figure 7), which confirmed the unambiguous assignment of the absolute configuration of 5, and the trivial name phomoparagin D was assigned. The possible biogenetic pathway of phomoparagin D (5) was postulated (Scheme 1), which might arise from cytochalasin J (6) by a different set of catalyzed reactions.
A plausible biosynthesis of compounds 111 was proposed, as shown in Scheme 1 and Scheme 2. More than 4000 chromones have been isolated and structurally elucidated from natural origin until now, and they are biosynthesized by the type III polyketide synthases (PKSs) [54]. Compounds 1 and 2 isolated from P. asparagi DHS-48 are assumed to be derived from one acetyl-CoA starter and seven molecules of malonyl-CoA extender units to form an octaketide that undergoes Claisen condensation and cyclization to yield anthraquinone precursors such as emodin, even though it was not isolated in this study. Oxidative cleavage, cyclization via epoxidation, and nucleophilic attack by a hydroxyl group to give the ring-closed dihydroxanthone involved the epimerization of C-10a. The subsequent keto–enol equilibrium and redox would provide compounds 1 and 2, referring to the reports made by Rönsberg et al. [55]. Previous feeding experiments with sodium 13C-labeled acetate by Lösgen et al. [56] in 2007 revealed that a heptaketide precursor is involved in the biosynthesis of 3 and 4, which are analogues to phomochromenones D-G isolated in our previous study [46], implying some cryptic post-synthesis modification genes were stimulated by the currently adopted epigenetic manipulation for the production of those metabolites previously unobserved or merely increased sufficiently under epigenetic control to be detected. Cytochalasins 5–11 might rationally share a common biosynthetic precursor as we previously described via polyketide synthase (PKS)/nonribosomal peptide synthetase (NRPS) hybrid machinery [38]. The stimulated metabolite 5 was is likely to be also derived from 6 by epoxidation, meanwhile 9 feasibly converted through catalytic dehydration.

2.3. Biological Activity of Compounds

The immunosuppressive assay showed that compounds 1 and 8 exhibited moderate-to-weak inhibitory activity against ConA-induced T and LPS-induced B murine splenic lymphocytes in vitro, with the IC50 values of 42 and 88 µM and 15 and 110 µM (Table 3), respectively, whereas the other investigated compounds showed no apparent inhibitory effect. Additionally, compound 5 showed significant in vitro cytotoxicity against human cancer cell lines Hela, with an IC50 value of 5.8 µM, and showed moderately significant in vitro cytotoxicity against human cancer cell lines HepG2, with an IC50 value of 59 µM (Table 4), respectively, which was comparable with the positive controls adriamycin and fluorouracil. These results suggested that the 19,20-epoxide ring in compound 5 is essential for its inhibition of tumor cell proliferation compared with compounds 611.

3. Materials and Methods

3.1. General Procedures

The specific rotations were obtained on an ATR-W2 HHW5 digital Abbe refractometer (Shanghai Physico-optical Instrument Factory, Shanghai, China). The UV spectra were determined using a Shimadzu UV-2600 PC spectrophotometer (Shimadzu Corporation, Tokyo, Japan), while the ECD spectra were measured on a JASCO J-715 spectra polarimeter (Japan Spectroscopic, Tokyo, Japan). The 1H, 13C, and 2D NMR spectra were recorded on a Bruker AV 400 NMR spectrometer using TMS as an internal standard. High-resolution ESI-MS was performed on an LCMS-IT-TOF instrument (Shimadzu Corporation, Tokyo, Japan) using peak matching. TLC and column chromatography (CC) were carried out over silica gel (200–400 mesh, Qingdao Marine Chemical Inc., Qingdao, China) or Sephadex-LH-20 (18−110 µm, Merck, Darmstadt, Germany), respectively. HPLC analysis was measured on Wasters e2695 (Waters Corporation, Milford, MA, USA) using a C18 column (Waters, 5 μm, 10 × 150 mm). Semi-preparative HPLC was achieved on an Agilent Technologies 1200LC instrument with a C18 column (Agilent Technologies 10 mm × 250 mm). High-speed centrifugation was performed using a TGL-16B Anting centrifuge (Anting Scientific instrument Factory, Shanghai, China). The constant temperature water bath was in HH-2 thermostat water baths (Hervey Biotechnology Corporation, Jinan, China). Liquid fermentation was carried out in an ATL-03202 High-precision CNC shaking machine (Shanghai Kanxin Instrument and Equipment Corporation, Shanghai, China). The purity of the isolated compounds was determined via high-performance liquid chromatography (HPLC), which was performed on an Agilent 1200 instrument and a reverse-phase column (4.6 × 150 mm, 5 μm). The UV wavelength for detection was 210 nm. All the crude extracts and compounds were eluted with a flow rate of 0.8 mL·min−1 over a 50 min gradient (solvents: A, H2O; B, MeOH), as follows: 0–5min, 25% B; 5–15 min, 25–30% B; 15–30 min, 30–55% B; 30–40 min, 55–75% B; 40–50 min, 70–90% B (Figure S45).

3.2. Fungal Material

The endophytic fungi Phomopsis asparagi DHS-48 was isolated with a PDA medium from the fresh root of the mangrove plant Rhizophora mangle, collected in October 2015 in Dong Zhai Gang-Mangrove Garden on Hainan Island, China. The strain was isolated under sterile conditions from the inner tissue of the root, following an isolation protocol described previously [57], and the fungi (strain no.DHS-8) was identified using a molecular biological protocol via the DNA amplification and sequencing of the ITS region (GenBank Accession no.MT126606). A voucher strain was deposited at one of the authors’ laboratories (J.X.).

3.3. Epigenetic Manipulation and Culture Condition

For the epigenetic manipulation experiments, fungal mycelia and spores were initially inoculated onto Petri dishes containing potato dextrose agar (PDA) at 28 °C for 5 days. Then, a single colony was inoculated into a 100 mL potato dextrose broth (PDB) (in 500 mL Erlenmeyer flasks with continuous shaking for ten days at 28 °C) and the PDA plates (15 mL agar media inverted incubated for five days at 28 °C) were treated with different concentrations (0, 10, 50, and 100 µM) of the DNMT inhibitor 5-aza and the HDAC inhibitor sodium butyrate, or a combination of the two, while the control cultures were treated with vehicle only (filter-sterilized H2O). The quantity of biomass is an essential parameter in the determination of a suitable epigenetic modifier or its optimal addition. After filtering the PDB liquid medium, the mycelium precipitate was washed three times with distilled water and lyophilized to constant weight as dry biomass. For the fungi that grow on PDA, the direct measurement of fungal biomass is hampered because the fungi penetrate into and bind themselves tightly to the solid-substrate particles. The indirect method based on the nucleic acid contents was adopted according to Liu’s method [58], with some modifications. The pure mycelium of 0.05, 0.1, 0.15, 0.2, 0.25, and 0.3 g was extracted by adding 25 mL of 5% trichloroacetic acid solution in a water bath at 80 °C for 25 min with constant stirring and then cooled in an ice bath at 8000 r/min, centrifuged at 4 °C for 15 min, and diluted 5 times. The OD value was measured at 260 nm with 1% trichloroacetic acid as the blank control. Finally, dry biomass was quantified based on a standard curve between the nucleic acid content and dry biomass ranging from 0.05 to 0.3 g with y = 4.3543x − 0.0158 (R2 = 0.998). All the culture groups were prepared and measured in 3 replicates. The HPLC profiles of the EtOAc extracts of the fungi cultivated in the presence of different epigenetic agents were tested. The cultures were extracted three times with EtOAc (50 mL × 3 for each PDA plate, 250 mL × 3 for each PDB flask). The EtOAc-soluble materials were passed over organic membranes and then subjected to HPLC analysis under conditions mentioned in Section 3.1.

3.4. Extraction Isolation

The fungus was cultivated on PDA by adding 50 µM sodium butyrate at 28 °C for 7 days. Then, a single colony was inoculated in an autoclaved rice solid-substrate medium in Erlenmeyer flasks (130 × 1 L), each containing 100 g of rice, 100 mL of 0.3% of saline water, and 50 µM sodium butyrate and fermented at 28 °C for 28 days. Briefly, 130 flasks of cultures were extracted 3 times with 400 mL of EtOAc, and the filtrate was evaporated under reduced pressure to yield a crude extract of 20 g. The crude extracts were analyzed using HPLC and 1H NMR. The EtOAc extracts were chromatographed on silica gel column chromatography (CC) using a step gradient elution process with CH2Cl2-MeOH (0–100%) to provide nine fractions (Fr. 1–Fr. 9). Fr. 3 was subjected to open silica gel CC using gradient elution with CH2Cl2-EtOAc (6:1–1:2, v/v) to yield seven fractions. Fr. 3.1–Fr. 3.7. Fr. 3.4 were purified with semi-preparative reversed-phase HPLC using MeOH-H2O (70:30, v/v) to afford compound 10 (6 mg) (Figures S38–S40) and compound 7 (6 mg) (Figures S29–S31). In addition, Fr. 3.5 was separated via silica gel CC using CH2Cl2-EtOAc (3:1, v/v) and purified via semi-preparative reversed-phase HPLC using MeOH-H2O (70:30, v/v) to afford compound 11 (7 mg) (Figures S41–S43). Fr. 4 was separated via open silica gel CC using gradient elution with CH2Cl2-EtOAc (3:1–1:1, v/v) to obtain three fractions (Fr. 4.1–Fr. 4.3). Fr. 4.2 was chromatographed on a Sephadex LH-20 CC by eluting with MeOH to yield three fractions (Fr. 4.2.1–Fr. 4.2.3). Fr. 4.2.1 was purified using a silica gel flash column with CH2Cl2-EtOAc (2:1, v/v) as the eluent to obtain compound 8 (11.8 mg) (Figures S32–S34) and compound 9 (3 mg) (Figures S35–S37). Fr. 4.2.2 was subjected to Sephadex LH-20 CC using MeOH-CH2Cl2 (1:1, v/v) as an eluent to obtain compound 6 (5.9 mg) (Figures S26–S28). Fr. 5 was subjected to open silica gel CC using gradient elution with CH2Cl2-EtOAc (4:1–1:2, v/v) to yield five fractions Fr. 5.1–Fr. 5.5. Fr. 5.3 was subsequently subjected to Sephadex LH-20 CC using MeOH-CH2Cl2 (1:1, v/v) as an eluent to give six fractions Fr. 5.3.1–Fr. 5.3.6. Fr. 6 was separated through silica gel elution using CH2Cl2-EtOAc (2:1, v/v) to obtain six fractions (Fr. 6.1–Fr. 6.6). Fr. 6.3 was purified with Sephadex LH-20 CC using MeOH-CH2Cl2 (1:1, v/v) to yield compound 4 (12 mg) (Figures S23–S25). Fr. 6.4 was subjected to reversed-phase HPLC (MeOH-H2O 70:30, v/v) to obtain compound 3 (5 mg) (Figures S20–S22). Fr. 6.5 was subjected to open silica gel CC using gradient elution with CH2Cl2-EtOAc (4:1–1:2, v/v) to give five fractions (Fr. 6.5.1–Fr. 6.5.5). Additionally, promising Fr. 6.5.4 was purified with reversed-phase HPLC (MeOH-H2O, 70:30 to 100:0, v/v) to furnish compound 2 (7 mg) (Figures S17–S19) and compound 1 (6 mg) (Figures S1–S8). Fr.7 was subjected to open silica gel CC using gradient elution with CH2Cl2-EtOAc (1:1, v/v) to yield six fractions Fr. 7.1–Fr. 7.6. Fr. 7.3 was subjected to Sephadex LH-20 CC using MeOH-CH2Cl2 (1:1, v/v) as an eluent to obtain compound 5 (15 mg) (Figures S9–S16).
Phaseolorin J (1): light yellow amorphous powder (MeOH); [α]20D +160 (c 0.0001, MeOH); UV (MeOH) λmax 214 nm (the absorptions due to aromatic rings); 1H and 13C NMR data, see Table 1; HRESIMS m/z 331.0781 [M + Na]+ (calcd for C15H16O7Na 331.0788).
Phomoparagin D (5): colorless amorphous powder (MeOH); [α]20D +60 (c 0.0001, MeOH); UV (MeOH) λmax 206 nm (the absorptions due to aromatic rings); 1H and 13C NMR data, see Table 1; HRESIMS m/z 506.2304 [M + K]+ (calcd for C28H37NO5K 506.2303).

3.5. Theory and Calculation Details

Specific Monte Carlo conformational searches were run by employing Spartan’s 14 software using the Merck molecular force field (MMFF). Conformers with a Boltzmann population of over 0.4% were chosen for ECD (Tables S1–S4) and 13CNMR (Tables S5–S9) calculations. Then, the conformers were initially optimized at the B3LYP/6-31G(d) level in the gas phase using the PCM polarizable conductor calculation model. The stable conformations obtained at the B3LYP/6-31G(d) level were further used in magnetic shielding constants. The theoretical calculation of ECD was conducted in MeOH using the time-dependent density functional theory (TD-DFT) at the B3LYP/6-31+g (d, p) level for all the conformers of compounds 1 and 5. The ECD spectra were generated using the program SpecDis 1.6 (University of Würzburg, Würzburg, Germany) and GraphPad Prism 5 (University of California, San Diego, USA) from dipole-length rotational strengths by applying Gaussian band shapes with sigma = 0.3 eV.

3.6. Cytotoxicity Assay

HepG2 (liver cancer cell line) and Hela (cervical cancer cell line) were purchased from the Type Culture Collection of the Chinese Academy of Sciences, Shanghai, China. The cells were grown in an RPMI-1640 culture medium. Cytotoxicity against HepG2 cells and HeLa cells was evaluated using the 3-(4,5-dimethylthiazol-2-yl)-2,5-diphenyltetrazolium bromide (MTT) (Sigma-Aldrich, Missouri, St. Louis, MO, USA) method, as described previously [45]. In addition, 5-fluorouracil (5-FU) (Beijing Solarbio Science and Technology Co., Ltd., 99.8%) (Beijing, China) and adriamycin (Shanghai Macklin Biochemical Co., Ltd, 99.8%) (Shanghai, China) were used as positive controls, respectively.

3.7. Isolation and Culture of Spleen Lymphocytes

The BALB/c female mice were sacrificed via cervical dislocation, and their spleens were removed aseptically. The splenocytes were washed using RPMI1640 supplemented with penicillin/streptomycin (100 U/mL and 100 μg/mL, respectively) and 10% heat-inactivated FBS, and collected in a centrifuge tube. The erythrocytes were removed for 3 min with an erythrocyte lysis buffer. The cells were plated at a density of 5 × 10⁶ cells/mL or 1 × 10⁷ cells/mL. Cell numbers were performed using a hemocytometer, and cell viability was determined using the trypan-blue dye exclusion technique; cell viability showed more than 95%. The culture media were kept in a humidified atmosphere of 5% CO2 at 37 °C.

3.8. Cell Activity and Cell Proliferation

In each 96-well cell culture plate, 100 μL of lymphocyte suspension was inoculated with a concentration of 1*107 cells/mL in each well, and the culture was left overnight in a 37 °C, 5% CO2 incubator to stabilize the cells. Then, the compounds or positive control (CsA) diluted in a complete medium to different concentrations were added to each well, resulting in the final concentrations of 1, 5, 10, 15, 20, 30, and 40 μM, respectively. The final concentrations of the compounds in the anti-proliferation assay were 20 μM, 35 μM, 50 μM, 70 μM, and 100 μM. After 72 or 48 h incubation in the incubator, the effect of the compounds on the survival rate and anti-proliferation of splenocytes was analyzed using the CCK-8 method.

3.9. Statistical Analysis

All the cell data are presented as the mean standard deviation of the means (S.D.), and a one-way analysis of variance (ANOVA) test was used to evaluate the statistical significance of differences between the groups using GraphPad Prism.

4. Conclusions

Collectively, the mangrove endophytic fungus Phomopsis asparagi DHS-48 was effectively stimulated using an HDAC inhibitor (sodium butyrate) to produce two new compounds, named phaseolorin J (1) and phomoparagin D (5), along with nine known chromones (24) and cytochalasins (611). All the isolates were evaluated for their immunosuppressive and cytotoxic activities. Among them, compounds 1 and 8 showed moderately inhibitory activity against the proliferation of ConA-induced T and LPS-induced B murine spleen lymphocytes, and compound 5 exerted comparative or better in vitro cytotoxicity against the tested human cancer cell lines than the positive control. Thus, this study demonstrates that epigenetic manipulation appears to have a large potential for enhancing the production and/or accumulation of new chemodiversity from mangrove endophytic fungi.

Supplementary Materials

The following supporting information can be downloaded at: https://www.mdpi.com/article/10.3390/md20100616/s1, Figure S1: 1H-NMR of phaseolorin J (1). Figure S2: 13C-NMR of phaseolorin J (1). Figure S3: DEPT of phaseolorin J (1). Figure S4: 1H-1H COSY of phaseolorin J (1). Figure S5: HSQC of phaseolorin J (1). Figure S6: HMBC of phaseolorin J (1). Figure S7: NOSEY of phaseolorin J (1). Figure S8: HR-ESI-MS of phaseolorin J (1). Figure S9: 1H-NMR of phomoparagin D (5). Figure S10: 13C-NMR of phomoparagin D (5). Figure S11: DEPT of phomoparagin D (5). Figure S12: 1H-1H COSY of phomoparagin D (5). Figure S13: HSQC of phomoparagin D (5). Figure S14: HMBC of phomoparagin D (5). Figure S15: NOSEY of phomoparagin D (5). Figure S16: HR-ESI-MS of phomoparagin D (5). Figure S17: 1H-NMR of phaseolorin D (2). Figure S18: 13C-NMR of phaseolorin D (2). Figure S19: HR-ESI-MS of phaseolorin D (2). Figure S20: 1H-NMR of chaetochromone B (3). Figure S21: 13C-NMR of chaetochromone B (3). Figure S22: HR-ESI-MS of chaetochromone B (3). Figure S23: 1H-NMR of pleosporalin D (4). Figure S24: 13C-NMR of pleosporalin D (4). Figure S25: HR-ESI-MS of pleosporalin D (4). Figure S26: 1H-NMR of cytochalasin J (6). Figure S27: 13C-NMR of cytochalasin J (6). Figure S28: HR-ESI-MS of cytochalasin J (6). Figure S29: 1H-NMR of cytochalasin J1 (7). Figure S30: 13C-NMR of cytochalasin J1 (7). Figure S31: HR-ESI-MS of cytochalasin J1 (7). Figure S32: 1H-NMR of cytochalasin H (8). Figure S33: 13C-NMR of cytochalasin H (8). Figure S34: HR-ESI-MS of cytochalasin H (8). Figure S35: 1H-NMR of cytochalasin J2 (9). Figure S36: 13C-NMR of cytochalasin J2 (9). Figure S37: HR-ESI-MS of cytochalasin J2 (9). Figure S38: 1H-NMR of cytochalasin J3 (10). Figure S39: 13C-NMR of cytochalasin J3 (10). Figure S40: HR-ESI-MS of cytochalasin J3 (10). Figure S41: 1H-NMR of phomopchalasin D (11). Figure S42: 13C-NMR of phomopchalasin D (11). Figure S43: HR-ESI-MS of phomopchalasin D (11). Figure S44: Overlay of HPLC profiles of EtOAc extracts of Phomopsis asparagi DHS-48 cultivated in PDA treated with different epigenetic agents. Figure S45: HPLC spectrum for the purity of tested compounds. Table S1: Gibbs free energiesa and equilibrium populationsb of low-energy conformers of phaseolorin J (1). Table S2: Cartesian coordinates for the low-energy reoptimized MMFF conformers of phaseolorin J (1) at B3LYP/6-31G(d,p) level of theory in gas. Table S3: Gibbs free energiesa and equilibrium populationsb of low-energy conformers of phomoparagin D (5). Table S4: Cartesian coordinates for the low-energy reoptimized MMFF conformers of phomoparagin D (5) at B3LYP/6-31G(d,p) level of theory in gas. Table S5: The calculated 13C NMR data for isomers of phaseolorin J (1). Table S6: DFT-optimized structures and thermodynamic parameters for low-energy conformers of 1. Table S7: DFT-optimized structures and thermodynamic parameters for low-energy conformers of 8-epi-1. Table S8: Optimized Z-matrixes of 1 in the gas phase (Å) at B3LYP/6-31G(d) level. Table S9: Optimized Z-matrixes of 8-epi-1 in the gas phase (Å) at B3LYP/6-31G(d) level.

Author Contributions

J.X. designed and supervised this research, elucidated its structure, and wrote the draft and final revision of the manuscript. T.F. and C.W. performed the isolation, epigenetic manipulation, and validation of experimental data. X.D. and D.C. carried out the biological evaluation. Z.W. measured the NMR spectra. The final revision of the manuscript was revised by all the authors. All authors have read and agreed to the published version of the manuscript.

Funding

This research was funded by the National Natural Science Foundation of China (No. 82160675/81973229), the Key Science and Technology Project of Hainan Province (ZDKJ202008/ZDKJ202018), the Key Research Program of Hainan Province (ZDYF2021SHFZ108), and Guangdong Key Laboratory of Marine Materia Medica Open Fund (LMM2021-4), all of which are gratefully acknowledged.

Conflicts of Interest

The authors declare no conflict of interest.

References

  1. Xu, J. Bioactive natural products derived from mangrove-associated microbes. Rsc. Adv. 2015, 5, 841–892. [Google Scholar] [CrossRef]
  2. Xu, J. Biomolecules Produced by Mangrove-Associated Microbes. Curr. Med. Chem. 2011, 18, 5224–5266. [Google Scholar] [CrossRef] [PubMed]
  3. Bugni, T.S.; Ireland, C.M. Marine-Derived Fungi: A Chemically and Biologically Diverse Group of Microorganisms. Nat. Prod. Rep. 2004, 21, 143–163. [Google Scholar] [CrossRef]
  4. Xu, J.; Yi, M.; Ding, L.; He, S. A Review of Anti-Inflammatory Compounds from Marine Fungi, 2000–2018. Mar. Drugs 2019, 17, 636. [Google Scholar] [CrossRef] [PubMed]
  5. Wu, M.J.; Xu, B.F.; Guo, Y.W. Unusual Secondary Metabolites from the Mangrove Ecosystems: Structures, Bioactivities, Chemical, and Bio-syntheses. Mar. Drugs. 2022, 20, 535. [Google Scholar] [CrossRef] [PubMed]
  6. Choque, E.; Klopp, C.; Valiere, S.; Raynal, J.; Mathieu, F. Whole-Genome Sequencing of Aspergillus tubingensis G131 and Overview of Its Secondary Metabolism Potential. BMC Genom. 2018, 19, 200. [Google Scholar] [CrossRef]
  7. Nützmann, H.W.; Reyes-Dominguez, Y.; Scherlach, K.; Schroeckh, V.; Horn, F.; Gacek, A.; Schümann, J.; Hertweck, C.; Strauss, J.; Brakhage, A.A. Bacteria-Induced Natural Product Formation in the Fungus Aspergillus nidulans Requires Saga/Ada-Mediated Histone Acetylation. Proc. Natl. Acad. Sci. USA 2011, 108, 14282–14287. [Google Scholar] [CrossRef]
  8. Pfannenstiel, B.T.; Keller, N.P. On Top of Biosynthetic Gene Clusters: How Epigenetic Machinery Influences Secondary Metabolism in Fungi. Biotechnol. Adv. 2019, 37, 107345. [Google Scholar] [CrossRef]
  9. Rutledge, P.J.; Challis, G.L. Discovery of Microbial Natural Products by Activation of Silent Biosynthetic Gene Clusters. Nat. Rev. Microbiol. 2015, 13, 509–523. [Google Scholar] [CrossRef]
  10. Skellam, E. Strategies for Engineering Natural Product Biosynthesis in Fungi. Trends Biotechnol. 2019, 37, 916. [Google Scholar] [CrossRef] [Green Version]
  11. Bode, H.B.; Bethe, B.; Höfs, R.; Zeeck, A. Big Effects from Small Changes: Possible Ways to Explore Nature’s Chemical Diversity. Chem. BioChem. 2002, 3, 619–627. [Google Scholar] [CrossRef]
  12. Liu, Y.Z.; Lu, C.H.; Shen, Y.M. Guanacastane-Type Diterpenoids from Coprinus plicatilis. Phytochem. Lett. 2014, 7, 161–164. [Google Scholar] [CrossRef]
  13. Wang, W.J.; Li, D.Y.; Li, Y.C.; Hua, H.M.; Ma, E.L.; Li, Z.L. Caryophyllene Sesquiterpenes from the Marine-Derived Fungus Ascotricha sp. ZJ-M-5 by the One Strain–Many Compounds Strategy. J. Nat. Prod. 2014, 77, 1367–1371. [Google Scholar] [CrossRef]
  14. Keller, N.P. Fungal Secondary Metabolism: Regulation, Function and Drug Discovery. Nat. Rev. Microbiol. 2019, 17, 167–180. [Google Scholar] [CrossRef] [PubMed]
  15. Lyu, H.N.; Liu, H.W.; Keller, N.P.; Yin, W.B. Harnessing Diverse Transcriptional Regulators for Natural Product Discovery in Fungi. Nat. Prod. Rep. 2020, 37, 6–16. [Google Scholar] [CrossRef]
  16. Reyes, F.; Bills, G.F.; Durán-Patrón, R. Strategies for the Discovery of Fungal Natural Products. Front. Microbiol. 2022, 13, 897756. [Google Scholar]
  17. Berger, S.L.; Kouzarides, T.; Shiekhattar, R.; Shilatifard, A. An Operational Definition of Epigenetics. Genes Dev. 2009, 23, 781–783. [Google Scholar]
  18. Wu, J.S.; Shi, X.H.; Zhang, Y.H.; Yu, J.Y.; Fu, X.M.; Li, X.; Chen, K.X.; Guo, Y.W.; Shao, C.L.; Wang, C.Y. Co-Cultivation With 5-Azacytidine Induced New Metabolites From the Zoanthid-Derived Fungus Cochliobolus lunatus. Front. Chem. 2019, 7, 763–770. [Google Scholar]
  19. Mafezoli, J.; Xu, Y.M.; Hilário, F.; Freidhof, B.; Espinosa Artiles, P.; dos Santos, L.C.; de Oliveira, M.C.F.; Gunatilaka, A.A.L. Modulation of Polyketide Biosynthetic Pathway of the Endophytic Fungus, Anteaglonium sp. FL0768, by Copper (II) and Anacardic Acid. Phytochem. Lett. 2018, 28, 157–163. [Google Scholar]
  20. Niu, S.W.; Liu, D.; Shao, Z.Z.; Proksch, P.; Lin, W.H. Eremophilane-Type Sesquiterpenoids in a Deep-Sea Fungus Eutypella sp. Activated by Chemical Epigenetic Manipulation. Tetrahedron 2018, 74, 7310–7325. [Google Scholar]
  21. Sharma, V.; Singamaneni, V.; Sharma, N.; Kumar, A.; Arora, D.; Kushwaha, M.; Bhushan, S.; Jaglan, S.; Gupta, P. Valproic Acid Induces Three Novel Cytotoxic Secondary Metabolites in Diaporthe sp., an Endophytic Fungus from Datura inoxia Mill. Bioorgan. Med. Chem. Lett. 2018, 28, 2217–2221. [Google Scholar] [CrossRef] [PubMed]
  22. Shi, T.; Shao, C.L.; Liu, Y.; Zhao, D.L.; Cao, F.; Fu, X.M.; Yu, J.Y.; Wu, J.S.; Zhang, Z.K.; Wang, C.Y. Terpenoids From the Coral-Derived Fungus Trichoderma harzianum (XS-20090075) Induced by Chemical Epigenetic Manipulation. Front. Microbiol. 2020, 11, 572–583. [Google Scholar] [CrossRef] [PubMed]
  23. Zhang, S.X.; Fang, H.; Yin, C.P.; Wei, C.L.; Hu, J.W.; Zhang, Y.L. Antimicrobial Metabolites Produced by Penicillium mallochii CCH01 Isolated From the Gut of Ectropis oblique, Cultivated in the Presence of a Histone Deacetylase Inhibitor. Front. Microbiol. 2019, 10, 2186–2193. [Google Scholar] [CrossRef] [PubMed]
  24. Asai, T.; Chung, Y.M.; Sakurai, H.; Ozeki, T.; Chang, F.R.; Wu, Y.C.; Yamashita, K.; Oshima, Y. Highly Oxidized Ergosterols and Isariotin Analogs from an Entomopathogenic Fungus, Gibellula formosana, Cultivated in the Presence of Epigenetic Modifying Agents. Tetrahedron 2012, 68, 5817–5823. [Google Scholar] [CrossRef]
  25. Niu, S.W.; Liu, D.; Shao, Z.Z.; Liu, J.R.; Fan, A.L.; Lin, W.H. Chemical Epigenetic Manipulation Triggers the Production of Sesquiterpenes from the Deep-Sea Derived Eutypella Fungus. Phytochemistry 2021, 192, 112978. [Google Scholar] [CrossRef] [PubMed]
  26. Wu, J.S.; Yao, G.S.; Shi, X.H.; Rehman, S.U.; Xu, Y.; Fu, X.M.; Zhang, X.L.; Liu, Y.; Wang, C.Y. Epigenetic Agents Trigger the Production of Bioactive Nucleoside Derivatives and Bisabolane Sesquiterpenes From the Marine-Derived Fungus Aspergillus versicolor. Front. Microbiol. 2020, 11, 85–93. [Google Scholar] [CrossRef] [PubMed]
  27. Beau, J.; Mahid, N.; Burda, W.N.; Harrington, L.; Shaw, L.N.; Mutka, T.; Kyle, D.E.; Barisic, B.; Van Olphen, A.; Baker, B.J. Epigenetic tailoring for the production of anti-infective cytosporones from the marine fungus Leucostoma persoonia. Mar. Drugs 2012, 10, 762–774. [Google Scholar] [CrossRef]
  28. Demers, D.H.; Knestrick, M.A.; Fleeman, R.; Tawfik, R.; Azhari, A.; Souza, A.; Baker, B.J. Exploitation of mangrove endophytic fungi for infectious disease drug discovery. Mar. Drugs 2018, 16, 376. [Google Scholar] [CrossRef]
  29. Farr, D.F.; Castlebury, L.A.; Rossman, A.Y. Morphological and molecular characterization of Phomopsis vaccinii and additional isolates of Phomopsis from blueberry and cranberry in the eastern United States. Mycologia 2002, 94, 494–504. [Google Scholar] [CrossRef]
  30. Yan, B.C.; Wang, W.G.; Hu, D.B.; Sun, X.; Kong, L.M.; Li, X.N.; Du, X.; Luo, S.H.; Liu, Y.; Li, Y.; et al. Phomopchalasins A and B, two cytochalasans with polycyclic-fused skeletons from the endophytic fungus Phomopsis sp. shj2. Org. Lett. 2016, 18, 1108–1111. [Google Scholar] [CrossRef]
  31. Shang, Z.; Raju, R.; Salim, A.A.; Khalil, Z.G.; Capon, R.J. Cytochalasins from an australian marine sediment-derived Phomopsis sp. (cmb-m0042f): Acid-mediated intramolecular cycloadditions enhance chemical diversity. J. Org. Chem. 2017, 82, 9704–9709. [Google Scholar] [CrossRef] [PubMed]
  32. Wagenaar, M.M.; Clardy, J. New Antibiotic and Cytotoxic Dimers Produced by the Fungus Phomopsis longicolla Isolated from an Endangered Mint. J. Nat. Prod. 2001, 64, 1006–1009. [Google Scholar] [CrossRef] [PubMed]
  33. Li, Z.J.; Yang, H.Y.; Li, J.; Liu, X.; Ye, L.; Kong, W.S.; Tang, S.Y.; Du, G.; Liu, Z.H.; Zhou, M.; et al. Isopentylated diphenyl ether derivatives from the fermentation products of an endophytic fungus Phomopsis fukushii. J. Antibiot. 2018, 71, 359–362. [Google Scholar] [CrossRef] [PubMed]
  34. Elsässer, B.; Krohn, K.; Flörke, U.; Root, N.; Aust, H.J.; Draeger, S.; Schulz, B.; Antus, S.; Kurtán, T. X-ray Structure Determination, Absolute Configuration and Biological Activity of Phomoxanthone A. Eur. J. Org. Chem. 2005, 2005, 4563–4570. [Google Scholar] [CrossRef]
  35. Horn, W.S.; Simmonds, M.S.J.; Schwartz, R.E.; Blaney, W.M. Phomopsichalasin, a novel antimicrobial agent from an endophytic Phomopsis sp. Tetrahedron 1995, 51, 3969–3978. [Google Scholar] [CrossRef]
  36. Xie, S.; Wu, Y.; Qiao, Y.; Guo, Y.; Wang, J.; Hu, Z.; Zhang, Q.; Li, X.; Huang, J.; Zhou, Q.; et al. Protoilludane, illudalane, and botryane sesquiterpenoids from the endophytic fungus Phomopsis sp. tj507a. J. Nat. Prod. 2018, 81, 1311–1320. [Google Scholar] [CrossRef]
  37. Tan, Q.W.; Fang, P.H.; Ni, J.C.; Gao, F.; Chen, Q.J. Metabolites Produced by an Endophytic Phomopsis sp. and Their Anti-TMV Activity. Molecules 2017, 22, 2073. [Google Scholar] [CrossRef]
  38. Feng, Z.; Zhang, X.X.; Wu, J.W.; Wei, C.W.; Feng, T.; Zhou, D.D.; Wen, Z.C.; Xu, J. Immunosuppressive Cytochalasins from the Mangrove Endophytic Fungus Phomopsis asparagi DHS-48. Mar. Drugs 2022, 20, 526. [Google Scholar] [CrossRef]
  39. Xu, Z.Y.; Xiong, B.X.; Xu, J. Chemical investigation of secondary metabolites produced by mangrove endophytic fungus Phyllosticta capitalensis. Nat. Prod. Res. 2019, 35, 1561–1565. [Google Scholar] [CrossRef]
  40. Hemberger, Y.; Xu, J.; Wray, V.; Proksch, P.; Wu, J.; Bringmann, G. Pestalotiopens A and B: Stereochemically challenging flflexible sesquiterpene-cyclopaldic acid Hybrids from Pestalotiopsis sp. Chem. Eur. J. 2013, 19, 15556–15564. [Google Scholar] [CrossRef]
  41. Deng, Q.; Li, G.; Sun, M.Y.; Yang, X.; Xu, J. A new antimicrobial sesquiterpene isolated from endophytic fungus Cytospora sp. from the Chinese mangrove plant Ceriops tagal. Nat. Prod. Res. 2020, 34, 1404–1408. [Google Scholar] [CrossRef] [PubMed]
  42. Sun, M.Y.; Zhou, D.D.; Wu, J.W.; Zhou, J.; Xu, J. Sdy-1 Executes Antitumor Activity in HepG2 and HeLa Cancer Cells by Inhibiting the Wnt/β-Catenin Signaling Pathway. Mar. Drugs 2022, 20, 125. [Google Scholar] [CrossRef] [PubMed]
  43. Wei, C.W.; Deng, Q.; Sun, M.Y.; Xu, J. Cytospyrone and Cytospomarin: Two New Polyketides Isolated from Mangrove Endophytic Fungus, Cytospora sp. Molecules 2020, 25, 4224. [Google Scholar] [CrossRef] [PubMed]
  44. Xu, J.; Kjer, J.; Sendker, J.; Wray, V.; Guan, H.; Edrada, R.; Lin, W.H.; Wu, J.; Proksch, P. Chromones from the Endophytic Fungus Pestalotiopsis sp. Isolated from the Chinese Mangrove Plant Rhizophora Mucronata. J. Nat. Prod. 2009, 72, 662–665. [Google Scholar] [CrossRef] [PubMed]
  45. Zhou, J.; Li, G.; Deng, Q.; Zheng, D.Y.; Yang, X.B.; Xu, J. Cytotoxic Constituents from the Mangrove Endophytic Pestalotiopsis sp. Induce G (0)/G (1) Cell Cycle Arrest and Apoptosis in Human Cancer Cells. Nat. Prod. Res. 2018, 32, 2968–2972. [Google Scholar] [CrossRef]
  46. Wei, C.W.; Sun, C.X.; Feng, Z.; Zhang, X.X.; Xu, J. Four New Chromones from the Endophytic Fungus Phomopsis asparagi DHS-48 Isolated from the Chinese Mangrove Plant Rhizophora mangle. Mar. Drugs 2021, 19, 348. [Google Scholar] [CrossRef]
  47. Xu, Z.Y.; Wu, X.; Li, G.; Feng, Z.; Xu, J. Pestalotiopisorin B, a New Isocoumarin Derivative from the Mangrove Endophytic Fungus Pestalotiopsis sp. HHL101. Nat. Prod. Res. 2020, 34, 1002–1007. [Google Scholar] [CrossRef]
  48. Zhang, X.X.; Li, G.; Deng, Q.; Xu, Z.Y.; Cen, J.R.; Xu, J. Vomifoliol Isolated from Mangrove Plant Ceriops Tagal Inhibits the NFAT Signaling Pathway with CN as the Target Enzyme in vitro. Bioorgan. Med. Chem. Lett. 2021, 48, 128235. [Google Scholar] [CrossRef]
  49. Chen, S.H.; Guo, H.; Jiang, M.H.; Wu, Q.L.; Li, J.; Shen, H.J.; Liu, L. Mono- and Dimeric Xanthones with Anti-Glioma and Anti-Inflammatory Activities from the Ascidian-Derived Fungus Diaporthe sp. SYSU-MS4722. Mar. Drugs 2022, 20, 51. [Google Scholar] [CrossRef]
  50. Huang, M.X.; Li, J.; Liu, L.; Yin, S.; Wang, J.; Lin, Y.C. Phomopsichin A-D; four new chromone derivatives from mangrove endophytic fungus Phomopsis sp. 33. Mar. Drugs 2016, 14, 215. [Google Scholar] [CrossRef]
  51. Wijeratne, E.K.; Bashyal, B.P.; Gunatilaka, M.K.; Arnold, A.E.; Gunatilaka, A.L. Maximizing chemical diversity of fungal metabolites: Biogenetically related heptaketides of the endolichenic fungus Corynespora sp. J. Nat. Prod. 2010, 73, 1156–1159. [Google Scholar] [CrossRef] [PubMed]
  52. Guo, H.; Liu, Z.M.; Chen, Y.C.; Tan, H.B.; Li, S.N.; Li, H.H. Chromone-derived polyketides from the deep-sea fungus Diaporthe phaseolorum fs431. Mar. Drugs 2019, 17, 182. [Google Scholar] [CrossRef] [PubMed]
  53. Cole, R.J.; Wells, J.M.; Cox, R.H.; Cutler, H.G.J. Isolation and biological properties of deacetylcytochalasin H from Phomopsis sp. Agric. Food Chem. 1981, 29, 205–206. [Google Scholar] [CrossRef]
  54. Bisht, R.; Bhattacharyya, A.; Shrivastava, A.; Saxena, P. An overview of the medicinally important plant type III PKS derived polyketides. Front. Plant Sci. 2021, 12, 746908. [Google Scholar] [CrossRef]
  55. Rönsberg, D.; Debbab, A.; Mándi, A.; Vasylyeva, V.; Böhler, P.; Stork, B.; Proksch, P. Pro-apoptotic and immunostimulatory tetrahydroxanthone dimers from the endophytic fungus Phomopsis longicolla. J. Org. Chem. 2013, 78, 12409–12425. [Google Scholar] [CrossRef] [PubMed]
  56. Lösgen, S.; Schlörke, O.; Meindl, K.; Herbst-Irmer, R.; Zeeck, A. Structure and biosynthesis of chaetocyclinones, new polyketides produced by an endosymbiotic fungus. Eur. J. Org. Chem. 2010, 2007, 2191–2196. [Google Scholar] [CrossRef]
  57. Zhou, J.; Diao, X.; Wang, T.; Chen, G.; Lin, Q.; Yang, X.; Xu, J. Phylogenetic diversity and antioxidant activities of culturable fungal endophytes associated with the mangrove species Rhizophora stylosa and R. mucronata in the South China Sea. PLoS ONE 2018, 13, e0197359. [Google Scholar] [CrossRef] [Green Version]
  58. Liu, G.; Xu, Z.N.; Cen, P.L. A Morphologically Structured Model for Mycelial Growth and Secondary Metabolite Formation. Chin. J. Chem. Eng. 2000, 8, 46–51. [Google Scholar]
Figure 1. Structures of the isolated compounds 111.
Marinedrugs 20 00616 g001
Figure 2. Comparison of colony growth, dry biomass (in PDA and PDB) of Phomopsis asparagi DHS-48 in the presence of different concentrations (0, 10, 50, 100 µM) of 5-aza, sodium butyrate, and the combination of these inhibitors: (a) colony growth. In (A), 5-aza was added; in (B), sodium butyrate was added; in (C), the combination of these inhibitors was added; (b) calibration graph for calculating dry biomass based on nucleic acid contents with different epigenetic doses in PDA; (c) the dry biomass of fungi cultivated in PDA with different epigenetic doses; (d) the dry biomass of fungi cultivated in PDB with different epigenetic doses.
Marinedrugs 20 00616 g002aMarinedrugs 20 00616 g002b
Figure 3. HPLC profiles of fungal EtOAc extracts (a) obtained from rice solid-substrate medium after 50 µM sodium butyrate treatment and (b) obtained from rice solid-substrate medium without epigenetic inhibitor treatment. HPLC chromatograms: C18 column (Agilent Technologies 10 mm × 250 mm). Solvents: A, H2O; B, MeOH. Linear gradient: 0 min, 60% B; 40 min, 100% B. Temperature 25 °C. Flow rate 2 mL/min. UV detection at λ = 210 nm. Peaks 111 represent the isolated metabolites. Compounds 1 and 5 in (a) represent the new compounds stimulated by epigenetic manipulation.
Marinedrugs 20 00616 g003
Figure 4. 1H NMR spectra of EtOAc extracts of Phomopsis asparagi DHS-48 measured in CD3OD at 400 MHz, chemical shifts (δ) presented in ppm.
Marinedrugs 20 00616 g004
Figure 5. Key COSY and HMBC correlations of Compounds 1 and 5.
Marinedrugs 20 00616 g005
Figure 6. Key NOESY correlations of compounds 1 and 5.
Marinedrugs 20 00616 g006
Figure 7. Experimental and calculated electronic circular dichroism (ECD) spectra of 1 and 5.
Marinedrugs 20 00616 g007
Figure 8. 13C NMR calculation results of two plausible epimers (1 and 8-epi-1) at the B3LYP/6-31G(d) level: (a) linear correlation plots of calculated and experimental 13C values; (b) DP4+ probability of 13C values of 1.
Marinedrugs 20 00616 g008
Scheme 1. Proposed biosynthetic pathway for compounds 5 and 9 from 6.
Marinedrugs 20 00616 sch001
Scheme 2. Proposed biosynthetic pathway for compounds 14.
Marinedrugs 20 00616 sch002
Table 1. 1H (400 MHz) and 13C (100 MHz) NMR data of 1 and 2 in CD3OD.
Position12
δC TypeδH (J in Hz)δC TypeδH (J in Hz)
1163.2, C 163.4, C
2109.3, CH6.43, d, 8.2109.7, CH6.44, d, 8.2
3138.9, CH7.38, t, 8.2139.0, CH7.39, t, 8.2
4108.7, CH6.52, d, 8.2109.5, CH6.55, d, 8.2
4a160.8, C 160.3, C
574.3, CH4.69, brs74.6, CH4.29, m
6140.5, C 29.2, CH2.34, m
7122.3, CH5.61, dq, 4.8,1.732.0, CH21.57, dt, 14.8, 2.8
2.43, m
867.9, CH4.55, d, 4.868.6, CH4.44, t, 3.6
8a74.5, C 85.4, C
9197.2, C 196.2, C
9a108.4, C 108.6, C
10a86.5, C 76.4, C
1119.2, CH31.86, d, 1.718.1, CH31.32, d, 7.8
1264.1, CH2Ha 4.12, d, 13.260.5, CH2Ha 3.83, d, 13.5
Hb 4.03, d, 13.2Hb 4.28, m
Table 2. 1H (400 MHz) and 13C (100 MHz) NMR data of 5 and 6 in CD3OD.
Position56
δC TypeδH (J in Hz)δC TypeδH (J in Hz)
1178.4, C 178.7, C
355.3, CH3.37, dd, 6.1, 3.555.1, CH3.31, m
451.9, CH2.46, dd, 5.1, 3.550.8, CH2.61, m
533.8, CH2.75, m34.0, CH2.92, m
6151.7, C 151.9, C
772.7, CH3.82, d, 10.872.5, CH3.83, d, 10.7
845.8, CH2.89, d, 10.150.2, CH2.88, m
956.1, C 54.9, C
1044.8, CH2Ha 2.86, dd, 10.3, 6.2Hb 2.77, m46.6, CH2Ha 2.92, mHb 2.59, dd, 13.6, 8.2
1113.8, CH30.80, d, 6.714, CH31.11, d, 6.7
12113.1, CH2Ha 5.22, s113.1, CH2Ha 5.34, s
Hb 5.01, sHb 5.12, s
13131.2, CH5.72, dd, 15.5, 9.5129.4, CH5.73, dd, 15.5, 9.8
14135.4, CH5.54, m138.7, CH5.33, m
1543.7, CH2Ha 2.05, dd, 12.4, 5.6Hb 1.65, d, 12.445, CH2Ha 2.02, mHb 1.81, m
1628.7, CH1.87, m29.4, CH1.80, m
1748.7, CH2Ha 1.75, dd, 14.8, 3.2Hb 1.45, dd, 14.8, 3.855, CH2Ha 1.90, dd, 14.4, 3.4Hb 1.57, dd, 14.4, 3.3
1873.6, C 75.1, C
1963.1, CH3.21, d, 2.4137.5, CH5.75, dd, 16.8, 2.2
2057.7, CH2.99, m132.2, CH6.03, dd, 16.8, 2.6
2226.2, CH31.02, d, 6.826.7, CH31.04, d, 6.6
2323.5, CH30.92, s31.8, CH31.36, s
1’138.5, C 137.5, C
2’/6’131.2, CH7.22, d, 7.2131.1, CH7.15, dd, 8.0, 1.3
3’/5’129.6, CH7.31, t, 7.2129.5, CH7.32, dd, 8.0, 7.1
4’128.0, CH7.25, dt, 7.2, 3.6127.8, CH7.24, dd, 7.1, 1.3
Table 3. Immunosuppressive activities of tested compounds.
CompoundIC50 (µM) a
ConA-Induced T-Cell ProliferationLPS-Induced B-Cell Proliferation
142.35 ± 2.4988.19 ± 2.59
814.71 ± 0.47109.95 ± 5.68
27, 911--
cyclosporin A b4.39 ± 0.0225.11 ± 0.43
a Data are presented as mean ± SD from three separate experiments. b Positive control. ‘-’ stands for no inhibitory effect at 200 µM.
Table 4. Antitumor activity test of tested compounds.
CompoundIC50 (µM) a
HepG2Hela
559.14 ± 15.795.82 ± 0.82
14, 611--
Adriamycin b-0.95 ± 0.61
Fluorouracil c176 ± 28.8-
a Data are presented as mean ± SD from three separate experiments. b Hela cell positive control. c Hepg2 cell positive control. ‘-’ stands for no inhibitory effect at 200 µM.
Publisher’s Note: MDPI stays neutral with regard to jurisdictional claims in published maps and institutional affiliations.

