
Screening for New Cosmeceuticals from Brown Algae Fucus vesiculosus with Antioxidant and Photo-Protecting Properties

 , and
, and
Abstract
:1. Introduction
2. Results and Discussion
2.1. Sampling of F. vesiculosus
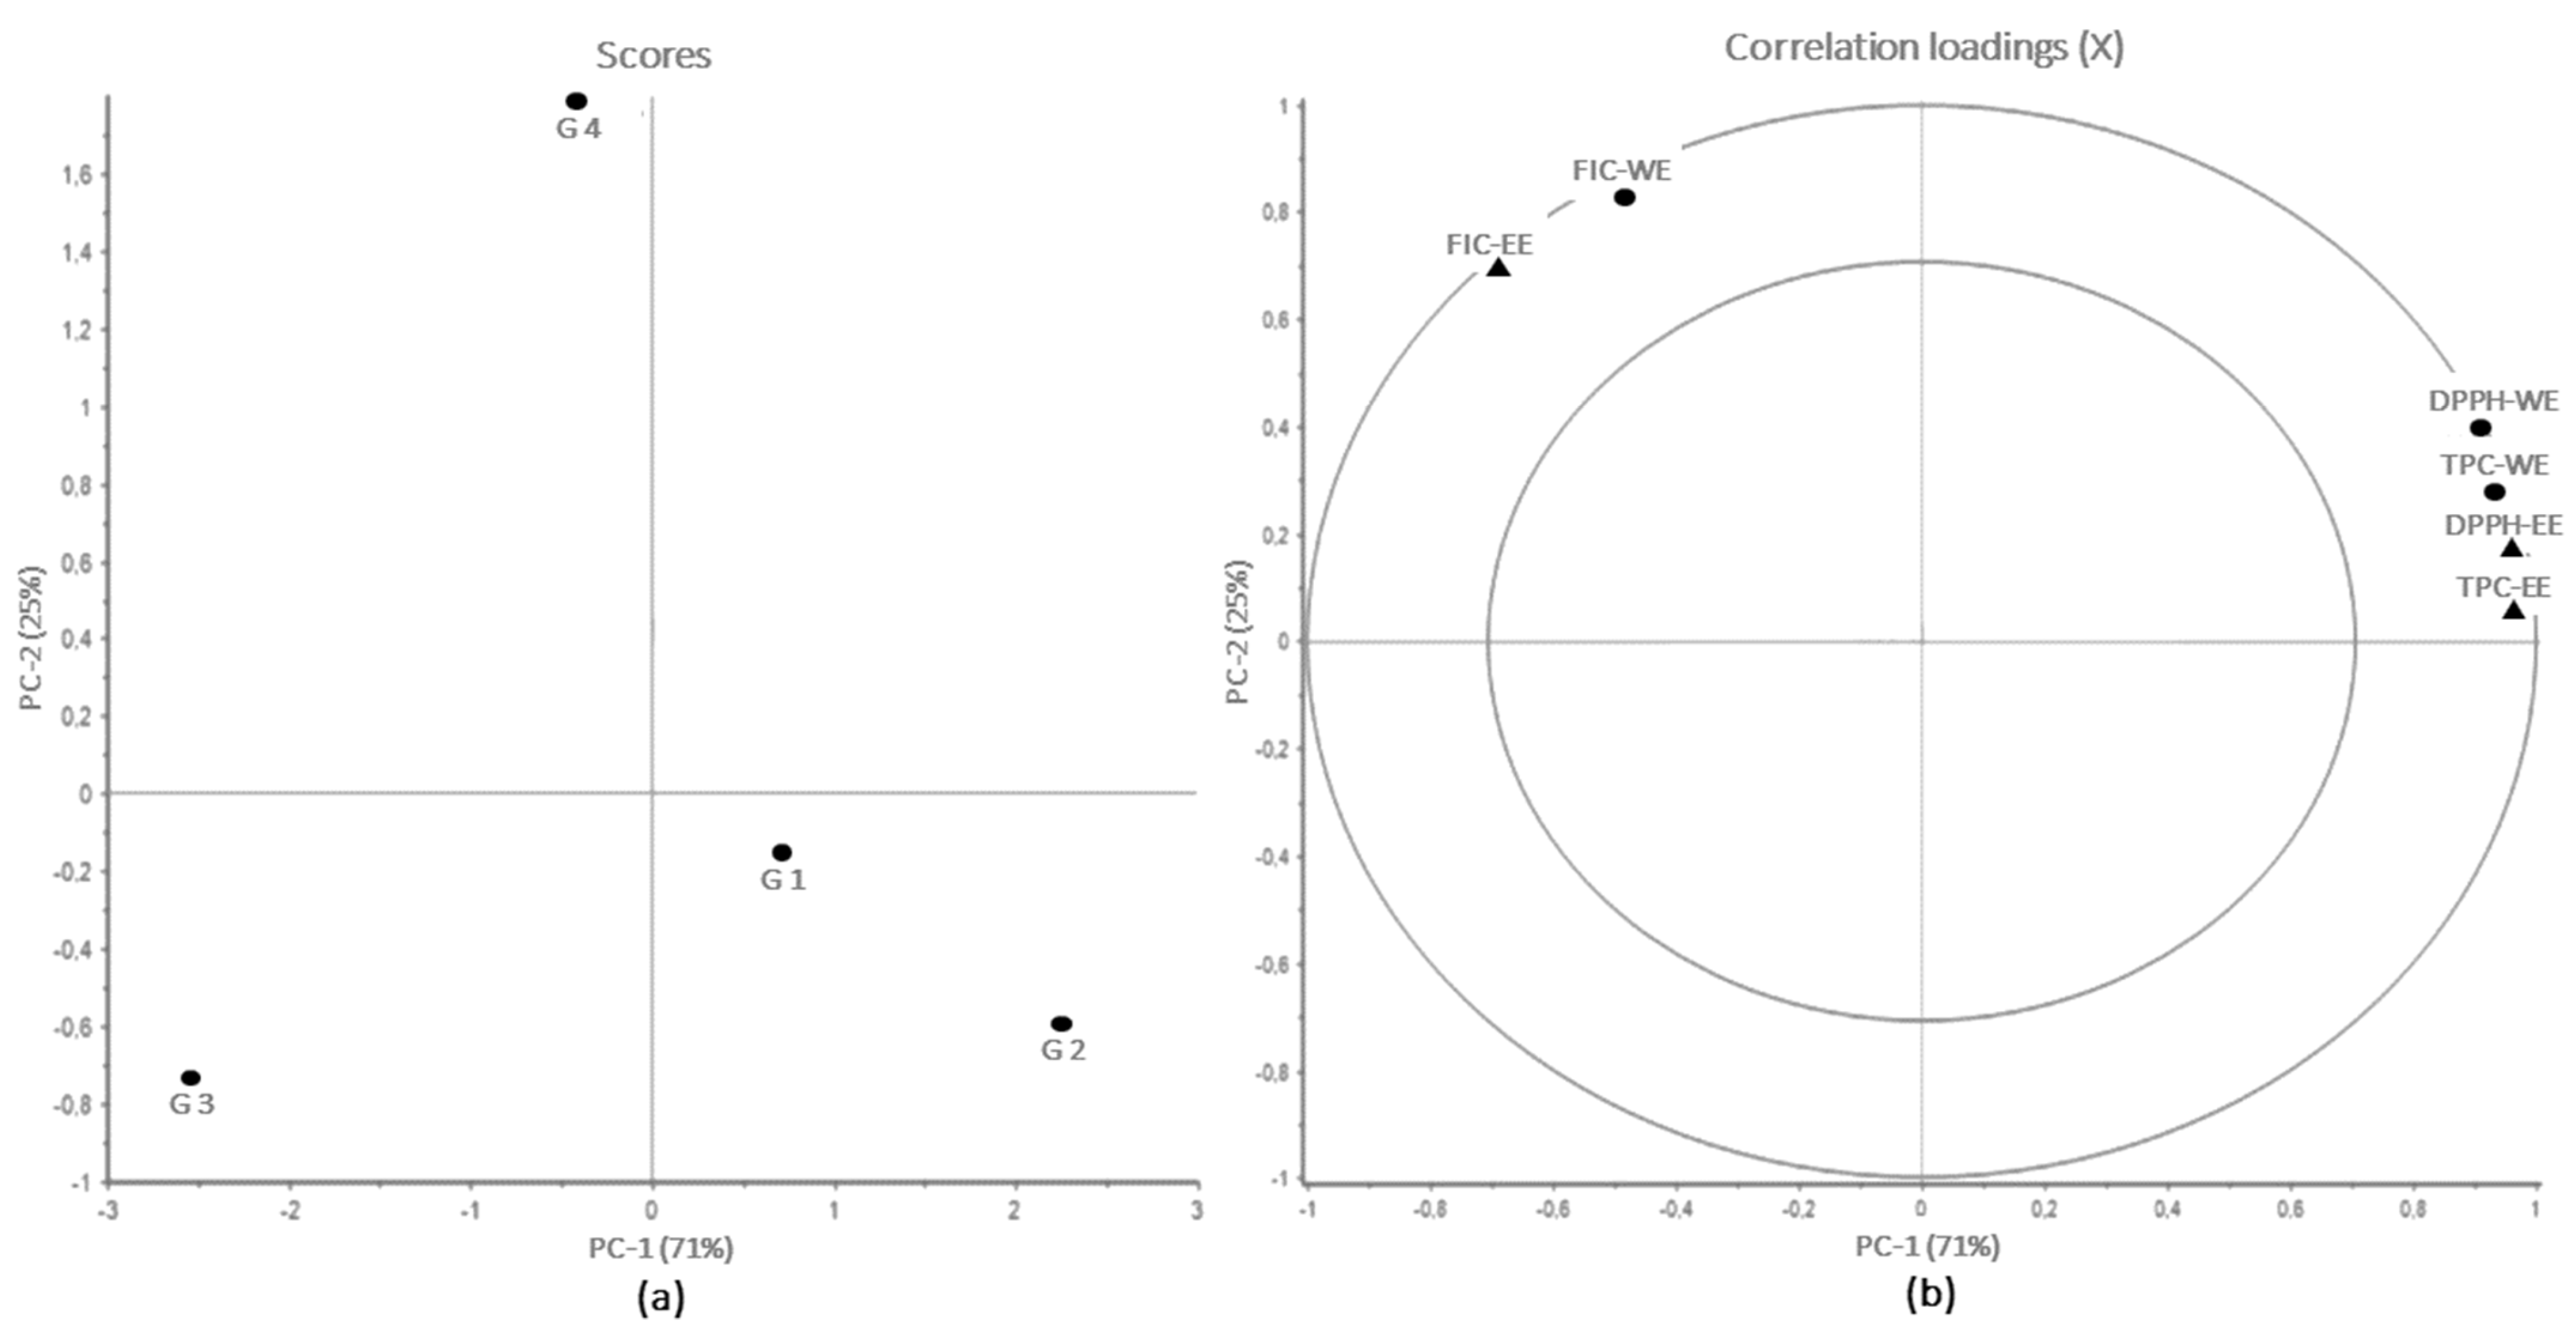
2.2. Growth Depth Dependent Antioxidant and Phlorotannin Content of F. vesiculosus Extracts
2.3. Screening for Photo-Protecting Properties of Seaweed Extracts
2.3.1. Absorption Spectra of FV-WE and FV-EE
2.3.2. SPF of Commercial Sunscreens for Testing the Mansur Method
2.3.3. Sun Protection Factor Seaweed Enriched Lotions
2.4. Determining Effective Solar Absorbed Radiation—Photo Protecting Index
3. Materials and Methods
3.1. Seaweed Material
3.2. Extraction of Phlorotannins
3.3. Characterization of Extracts
3.3.1. Phlorotannin Content
3.3.2. Antioxidant Properties
3.4. Screening of UV Protective Capacity of Natural Extracts and Sunscreen Formulations
3.4.1. Absorption Spectrum
3.4.2. Mansur Method for Determining Sun Protection Factor (SPF)
Mansur Method on Commercial Sunscreens
Mansur Method on Seaweed Enriched Lotions
3.4.3. Effective Solar Absorption Radiation (%ESAR) Ratio and Extract Photoprotection Index (EPI)
3.5. Data Treatment
4. Conclusions
Supplementary Materials
Author Contributions
Funding
Data Availability Statement
Conflicts of Interest
References
- Antoniou, C.; Kosmadaki, M.G.; Stratigos, A.J.; Katsambas, A.D. Sunscreens—What’s important to know. J. Eur. Acad. Dermatol. Venereol. 2008, 22, 1110–1118. [Google Scholar] [CrossRef] [PubMed]
- Zhang, S.; Duan, E. Fighting against Skin Aging: The Way from Bench to Bedside. Cell Transplant. 2018, 27, 729–738. [Google Scholar] [CrossRef]
- ISO 2443:2012; Determination of Sunscreen UVA Photoprotection In Vitro. International Organization for Standardization: Geneva, Switzerland, 2012.
- Tang, S.; Chen, Y.; Song, G.; Liu, X.; Shi, Y.; Xie, O.; Chen, D. A Cocktail of Industrial Chemicals in Lipstick and Nail Polish: Profiles and Health Implications. Environ. Sci. Technol. Lett. 2021, 8, 760–765. [Google Scholar] [CrossRef]
- Danovaro, R.; Bongiorni, L.; Corinaldesi, C.; Giovannelli, D.; Damiani, E.; Astolfi, P.; Greci, L.; Pusceddu, A. Sunscreens cause coral bleaching by promoting viral infections. Environ. Health Perspect. 2008, 116, 441–447. [Google Scholar] [CrossRef] [PubMed] [Green Version]
- Downs, C.A.; Kramarsky-Winter, E.; Segal, R.; Fauth, J.; Knutson, S.; Bronstein, O.; Ciner, F.R.; Jeger, R.; Lichtenfeld, Y.; Woodley, C.M.; et al. Toxicopathological Effects of the Sunscreen UV Filter, Oxybenzone (Benzophenone-3), on Coral Planulae and Cultured Primary Cells and Its Environmental Contamination in Hawaii and the U.S. Virgin Islands. Arch. Environ. Contam. Toxicol. 2016, 70, 265–288. [Google Scholar] [CrossRef]
- Farvin, S.K.H.; Jacobsen, C. Phenolic compounds and antioxidant activities of selected species of seaweeds from Danish coast. Food Chem. 2013, 138, 1670–1681. [Google Scholar] [CrossRef]
- Honold, P.J.; Jacobsen, C.; Jónsdóttir, R.; Kristinsson, H.G.; Hermund, D.B. Potential seaweed-based food ingredients to inhibit lipid oxidation in fish-oil-enriched mayonnaise. Eur. Food Res. Technol. 2016, 242, 571–584. [Google Scholar] [CrossRef]
- Hermund, D.B.; Heung, S.Y.; Thomsen, B.R.; Akoh, C.C.; Jacobsen, C. Improving Oxidative Stability of Skin-Care Emulsions with Antioxidant Extracts from Brown Alga Fucus vesiculosus. JAOCS 2018, 95, 1509–1520. [Google Scholar] [CrossRef] [Green Version]
- Pallela, R.; Na-Young, Y.; Kim, S.-K. Anti-photoaging and Photoprotective Compounds Derived from Marine Organisms. Mar. Drugs 2010, 8, 1189–1202. [Google Scholar] [CrossRef] [Green Version]
- Ácsová, A.; Hojerová, J.; Janotková, L.; Bendová, H.; Jedličková, L.; Hamranová, V.; Martiniaková, S. The real UVB photoprotective efficacy of vegetable oils: In vitro and in vivo studies. Photochem. Photobiol. Sci. 2021, 20, 139–151. [Google Scholar] [CrossRef]
- Ragan, M.A.; Glombitza, K.W. Phlorotannins, brown algal polyphenols. In Progress in Phycological Research; Round, F.E., Chapman, D.J., Eds.; Biopress Ltd.: Bristol, UK, 1986; pp. 129–241. [Google Scholar]
- Steevensz, A.J.; MacKinnon, S.L.; Hankinson, R.; Craft, C.; Connan, S.; Stengel, D.B.; Melanson, J.E. Profiling phlorotannins in brown macroalgae by liquid chromatography-high resolution mass spectrometry. Phytochem. Anal. 2012, 23, 547–553. [Google Scholar] [CrossRef] [PubMed]
- Heffernan, N.; Brunton, N.P.; FitzGerald, R.J.; Smyth, T.J. Profiling of the molecular weight and structural isomer abundance of macroalgae-derived phlorotannins. Mar. Drugs 2015, 13, 509–528. [Google Scholar] [CrossRef] [Green Version]
- Pavia, H.; Cervin, G.; Lindgren, A. Effects of UV-B radiation and simulated herbivory on phlorotannins in the brown alga Ascophyllum nodosum. Mar. Ecol. Prog. Ser. 1997, 157, 139–146. [Google Scholar] [CrossRef]
- Wang, T.; Jónsdóttir, R.; Liu, H.; Gu, L.; Kristinsson, H.G.; Raghavan, S.; Ólafsdóttir, G. Antioxidant capacities of phlorotannins extracted from the brown algae Fucus vesiculosus. J. Agric. Food Chem. 2012, 60, 5874–5883. [Google Scholar] [CrossRef] [PubMed]
- Pangestuti, R.; Siahaan, E.A.; Kim, S.K. Photoprotective substances derived from marine algae. Mar. Drugs 2018, 16, 399. [Google Scholar] [CrossRef] [PubMed] [Green Version]
- Koivikko, R.; Eränen, J.K.; Loponen, J.; Jormalainen, V. Variation of phlorotannins among three populations of Fucus vesiculosus as revealed by HPLC and colorimetric quantification. J. Chem. Ecol. 2008, 34, 57–64. [Google Scholar] [CrossRef]
- ISO 24444:2019; Cosmetics—Sun protection test methods—In vivo determination of the sun protection factor (SPF). ISO: Geneva, Switzerland, 2019.
- Pissavini, M.; Tricaud, C.; Wiener, G.; Lauer, A.; Contier, M.; Kolbe, L.; Trullás Cabanas, C.; Boyer, F.; Nollent, V.; Meredith, E.; et al. Validation of an in vitro sun protection factor (SPF) method in blinded ring-testing. Int. J. Cosmet. Sci. 2018, 40, 263–268. [Google Scholar] [CrossRef]
- Dutra, E.A.; Da Costa E Oliveira, D.A.G.; Kedor-Hackmann, E.R.M.; Miritello Santoro, M.I.R. Determination of sun protection factor (SPF) of sunscreens by ultraviolet spectrophotometry. Braz. J. Pharm. Sci. 2004, 40, 381–385. [Google Scholar] [CrossRef] [Green Version]
- Sayre, R.M.; Agin, P.P.; LeVee, G.J.; Marlowe, E. A comparison og in vivo and in vitro testing of sunscreen formulas. Photochem. Photobiol. 1979, 29, 559–566. [Google Scholar] [CrossRef]
- Lowe, N.; Breeding, J. Sunscreen predictive assays: Alternative assays that measure the ability of different sunscreens to protect against epidermal and demal effects of ultraviolet irradiation. Cosmet. Toilet. 1983, 98, 65–68. [Google Scholar]
- Mansur, J.d.S.; Breder, M.N.R.; Mansur, M.C.d.; Azulay, R.D. Determinaçäo do fator de proteçäo solar por espectrofotometria. An. Bras. Dermatol. 1986, 61, 121–124. [Google Scholar]
- Schneider, G.; Figueroa, F.L.; Vega, J.; Chaves, P.; Álvarez-Gómez, F.; Korbee, N.; Bonomi-Barufi, J. Photoprotection properties of marine photosynthetic organisms grown in high ultraviolet exposure areas: Cosmeceutical applications. Algal Res. 2020, 49, 101956. [Google Scholar] [CrossRef]
- Wang, T.; Jónsdóttir, R.; Ólafsdóttir, G. Total phenolic compounds, radical scavenging and metal chelation of extracts from Icelandic seaweeds. Food Chem. 2009, 116, 240–248. [Google Scholar] [CrossRef]
- Le Lann, K.; Ferret, C.; Vanmee, E.; Spagnol, C.; Lhuillery, M.; Payri, C.; Stiger-Pouvreau, V. Total phenolic, size-fractionated phenolics and fucoxanthin content of tropical Sargassaceae (Fucales, Phaeophyceae) from the South Pacific Ocean: Spatial and specific variability. Phycol. Res. 2012, 60, 37–50. [Google Scholar] [CrossRef]
- Hemmi, A.; Honkanen, T.; Jormalainen, V. Inducible resistance to herbivory in Fucus vesiculosus: Duration, spreading and variation with nutrient availability. Mar. Ecol. Prog. Ser. 2004, 273, 109–120. [Google Scholar] [CrossRef] [Green Version]
- Poyato, C.; Thomsen, B.R.; Hermund, D.B.; Ansorena, D.; Astiasarán, I.; Jonsdottir, R.; Kristinsson, H.G.; Jacobsen, C. Antioxidant effect of water and acetone extracts of Fucus vesiculosus on oxidative stability of skin care emulsions. Eur. J. Lipid Sci. Technol. 2017, 119, 1600072. [Google Scholar] [CrossRef] [Green Version]
- Suryawanshi, J.A.S. In-vitro determination of sun protection factor and evaluation of herbal oils. Int. J. Pharmacol. Res. 2016, 6, 37–43. [Google Scholar]
- Kasitowati, R.D.; Wahyudi, A.; Asmara, R.; Aliviyanti, D.; Iranawati, F.; Panjaitan, M.A.P.; Pratiwi, D.C.; Arsad, S. Identification photoprotective activity of marine seaweed: Eucheuma sp. IOP Conf. Ser. Earth Environ. Sci. 2021, 679, 012014. [Google Scholar] [CrossRef]
- Kaur, C.D.; Saraf, S. In vitro sun protection factor determination of herbal oils used in cosmetics. Pharmacogn. Res. 2010, 2, 22–25. [Google Scholar] [CrossRef] [Green Version]
- Osterwalder, U.; Herzog, B. The long way towards the ideal sunscreen—Where we stand and what still needs to be done. Photochem. Photobiol. Sci. 2010, 9, 470–481. [Google Scholar] [CrossRef]
- Soleimani, S.; Yousefzadi, M.; Nezhad, S.B.M.; Pozharitskaya, O.N.; Shikov, A.N. Evaluation of fractions extracted from Polycladia myrica: Biological activities, UVR protective effect, and stability of cream formulation based on it. J. Appl. Phycol. 2022, 34, 1763–1777. [Google Scholar] [CrossRef]
- Yang, J.; Guo, J.; Yuan, J. In vitro antioxidant properties of rutin. LWT Food Sci. Technol. 2008, 41, 1060–1066. [Google Scholar] [CrossRef]
- Farvin, S.K.H.; Baron, C.P.; Nielsen, N.S.; Jacobsen, C. Antioxidant activity of yoghurt peptides: Part 1-in vitro assays and evaluation in ω-3 enriched milk. Food Chem. 2010, 123, 1081–1089. [Google Scholar] [CrossRef]

| Group | Growth Depth | Harvesting Time | Quality Assessment | Color |
|---|---|---|---|---|
| G1 | 15–30 cm | 20 August 2019 | Low | Yellow/brown |
| G2 | 20–30 cm | 7 September 2019 | High | Yellow/brown |
| G3 | 30–50 cm | 7 September 2019 | High | Green |
| G4 | 50–70 cm | 7 September 2019 | High | Yellow/brown |
| Water Depth | TPC | DPPH | FIC | |||
|---|---|---|---|---|---|---|
| g GAE 100 g−1 dw | EC50 (µg dw mL−1) | EC50 (µg dw mL−1) | ||||
| Group | FV-WE | FV-EE | FV-WE | FV-EE | FV-WE | FV-EE |
| G1 (15–30 cm) | 10.4 ± 0.8 ax | 11.7 ± 0.3 ax | 33.3 ± 1.1 ax | 16.3 ± 0.5 ay | 360.0 ± 66.3 ax | 824.6 ± 70.5 ay |
| G2 (20–30 cm) | 13.7 ± 1.7 bx | 14.0 ± 0.6 bx | 31.1 ± 3.6 ax | 15.5 ± 2.4 ay | 365.1 ± 31.3 ax | 1052.4 ± 43.5 ay |
| G3 (30–50 cm) | 6.9 ± 1.1 cx | 7.8 ± 0.4 cx | 76.3 ± 2.5 bx | 30.9 ± 0.8 by | 340.4 ± 24.7 ax | 754.2 ± 29.5 ay |
| G4 (50–70 cm) | 11.9 ± 0.6 ax | 11.2 ± 0.9 ax | 35.5 ± 3.2 ax | 20.1 ± 1.3 ay | 311.2 ± 71.7 ax | 635.3 ± 38.0 ay |
| Sample | Claimed SPF | UV Filters Concentration, Sun filter (INCI Name, Filter Type and O = Organic or IO = Inorganic) | Broadband Protection |
|---|---|---|---|
| A | 15 | Non given | No |
| B | 25 | 5% Diethylamino hydroxybenyl (UVA filter) (O) 9% Ethylhexyl triazone (UVB filter) (O) | Yes |
| C | 45 | 10% Diethylamino hydroxybenyl (UVA filter) (O) 3% Ethylhexyl triazone (UVB filter) (O) 3% Diethylhexyl butamido triazone (O) | Yes |
| Sample | Claimed SPF | Measured SPF by Mansur Method | Measured vs. Claimed SPF |
|---|---|---|---|
| A | 15 | 16.3 ± 0.1 | 108% |
| B | 25 | 16.0 ± 0.0 | 64% |
| C | 45 | 21.3 ± 0.0 | 47% |
| Extract | Group | Extract Concentration (% w/w) | SPF | Color of the Lotion when 10% FV-WE or 14% FV-EE Was Added |
|---|---|---|---|---|
| Control | - | 0 | 0.2 ± 0.0 | |
| FV-WE | G1 | 10 | 0.5 ± 0.0 | 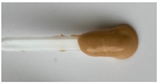 |
| 20 | 1.1 ± 0.0 | |||
| G4 | 10 | 0.6 ± 0.1 | ||
| 20 | 1.1 ± 0.0 | |||
| FV-EE | G1 | 14 | 0.2 ± 0.1 | 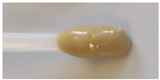 |
| 28 | 0.5 ± 0.0 | |||
| G4 | 14 | 0.2 ± 0.0 | ||
| 28 | 0.5 ± 0.1 |
| Concentration mg DE Plate−1 | Erythema | PPD | Elastosis | Photo Aging | |
|---|---|---|---|---|---|
| FV-WE G1 | 5 | 28.6 ± 2.8 | 10.3 ± 1.4 | 9.2 ± 1.3 | 10.5 ± 1.4 |
| 2.5 | 26.1 ± 2.2 | 10.1 ± 1.2 | 9.1 ± 1.1 | 10.2 ± 1.2 | |
| 1.25 | 21.7 ± 3.1 | 9.0 ± 1.4 | 8.1 ± 1.3 | 9.0 ± 1.4 | |
| FV-WE G4 | 5 | 36.7 ± 1.1 | 13.2 ± 0.6 | 11.8 ± 0.6 | 13.5 ± 0.6 |
| 2.5 | 27.4 ± 4.4 | 10.5 ± 1.8 | 9.5 ± 1.6 | 10.7 ± 1.8 | |
| 1.25 | 20.9 ± 1.5 | 8.1 ± 0.6 | 7.3 ± 0.6 | 8.2 ± 0.6 |
| Concentration mg DE Plate−1 | Erythema (SPF) | PPD (UVA-PF) | Elastosis | Photo Aging | |
|---|---|---|---|---|---|
| FV-WE G1 | 5 | 1.4 ± 0.1 | 1.3 ± 0.0 | 1.3 ± 0.0 | 1.3 ± 0.0 |
| 2.5 | 1.4 ± 0.0 | 1.2 ± 0.0 | 1.3 ± 0.0 | 1.2 ± 0.0 | |
| 1.25 | 1.3 ± 0.1 | 1.2 ± 0.0 | 1.2 ± 0.0 | 1.2 ± 0.0 | |
| FV-WE G4 | 5 | 1.6 ± 0.0 | 1.3 ± 0.0 | 1.4 ± 0.0 | 1.4 ± 0.0 |
| 2.5 | 1.4 ± 0.1 | 1.3 ± 0.1 | 1.3 ± 0.1 | 1.3 ± 0.1 | |
| 1.25 | 1.3 ± 0.0 | 1.2 ± 0.0 | 1.2 ± 0.0 | 1.2 ± 0.0 |
| Seaweed Enriched Lotion | Erythema (SPF) | PPD (UVA-PF) | Elastosis | Photo Aging | |
|---|---|---|---|---|---|
| %ESAR | 10%-FV-WE G1 | 22.3 ± 4.4 | 5.5 ± 1.5 | 4.8 ± 1.3 | 5.8 ± 1.6 |
| 10%-FV-WE G4 | 34.9 ± 5.2 | 9.8 ± 1.8 | 8.6 ± 1.6 | 10.4 ± 1.9 | |
| EPI | 10%-FV-WE G1 | 1.3 ± 0.1 | 1.1 ± 0.0 | 1.1 ± 0.0 | 1.1 ± 0.0 |
| 10%-FV-WE G4 | 1.5 ± 0.1 | 1.2 ± 0.1 | 1.3 ± 0.1 | 1.3 ± 0.1 |
Publisher’s Note: MDPI stays neutral with regard to jurisdictional claims in published maps and institutional affiliations. |
© 2022 by the authors. Licensee MDPI, Basel, Switzerland. This article is an open access article distributed under the terms and conditions of the Creative Commons Attribution (CC BY) license (https://creativecommons.org/licenses/by/4.0/).
Share and Cite
Hermund, D.B.; Torsteinsen, H.; Vega, J.; Figueroa, F.L.; Jacobsen, C. Screening for New Cosmeceuticals from Brown Algae Fucus vesiculosus with Antioxidant and Photo-Protecting Properties. Mar. Drugs 2022, 20, 687. https://doi.org/10.3390/md20110687
Hermund DB, Torsteinsen H, Vega J, Figueroa FL, Jacobsen C. Screening for New Cosmeceuticals from Brown Algae Fucus vesiculosus with Antioxidant and Photo-Protecting Properties. Marine Drugs. 2022; 20(11):687. https://doi.org/10.3390/md20110687
Chicago/Turabian StyleHermund, Ditte B., Hanna Torsteinsen, Julia Vega, Félix L. Figueroa, and Charlotte Jacobsen. 2022. "Screening for New Cosmeceuticals from Brown Algae Fucus vesiculosus with Antioxidant and Photo-Protecting Properties" Marine Drugs 20, no. 11: 687. https://doi.org/10.3390/md20110687