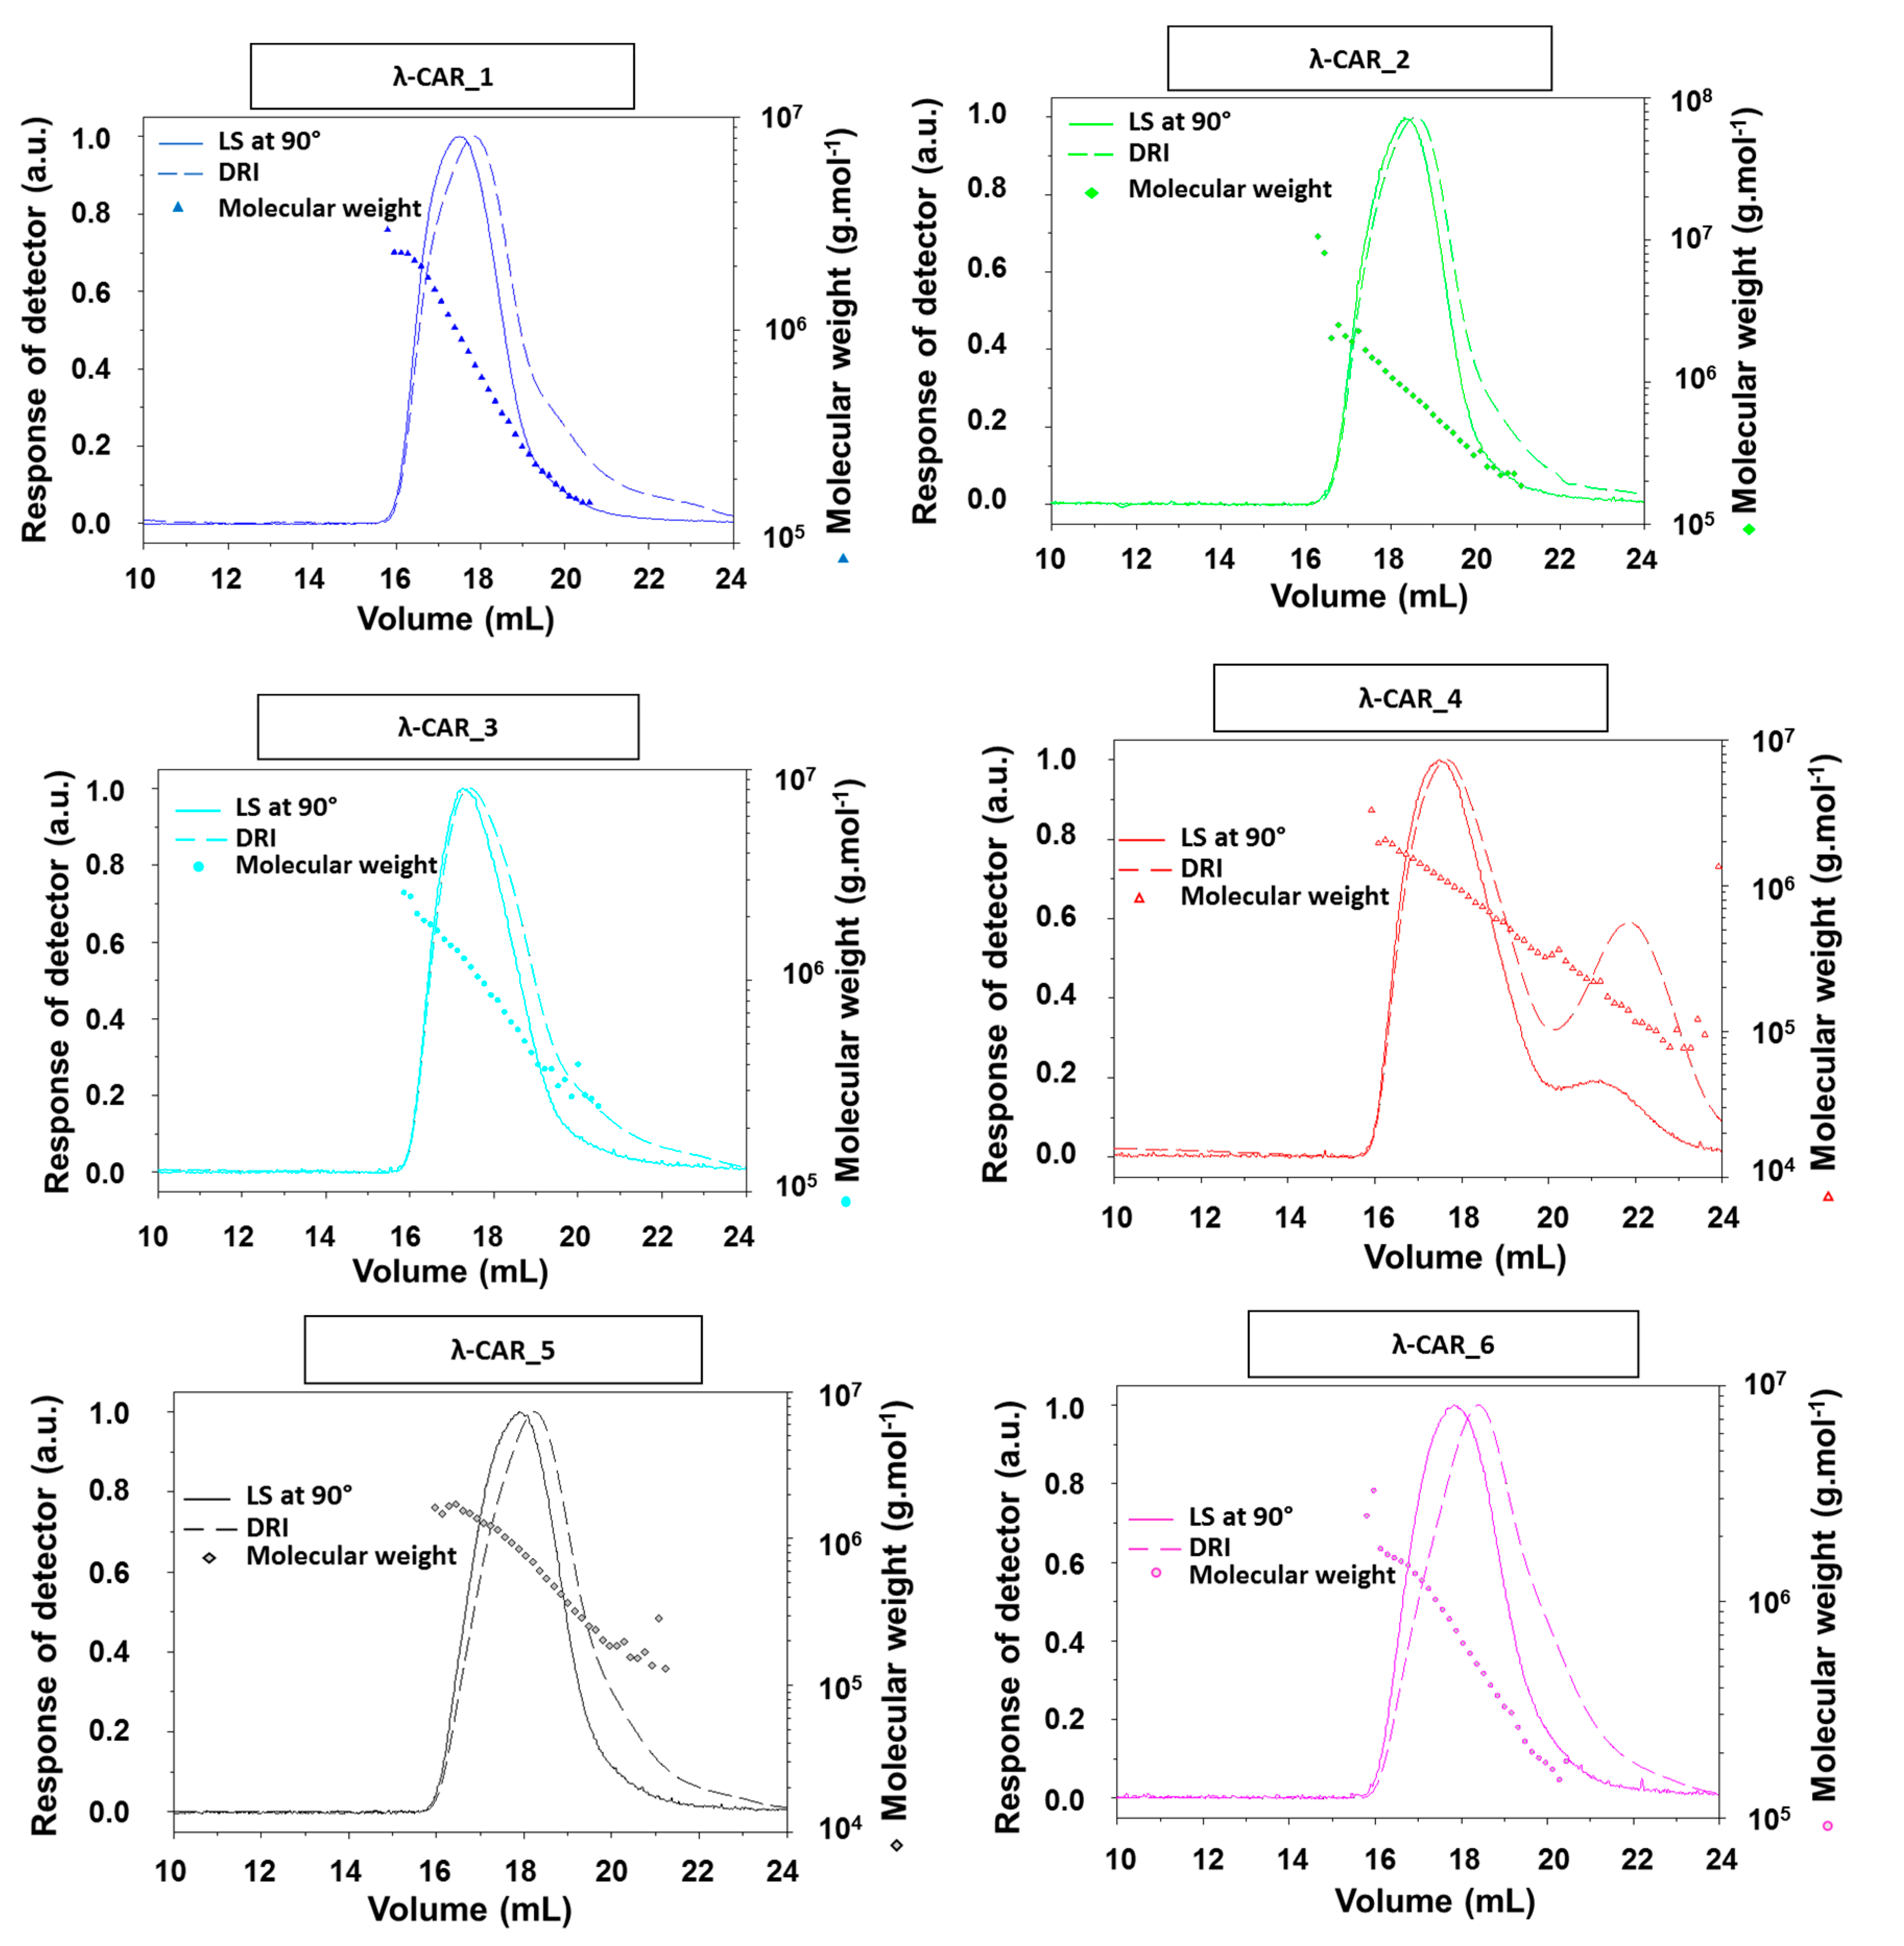
2.1. Physicochemical and Structural Characterizations of Native λ-CARs
The physicochemical properties of the six native commercial λ-CARs (randomly named from 1 to 6) were first determined based on their M
n, M
w, Ð, and DS estimations (
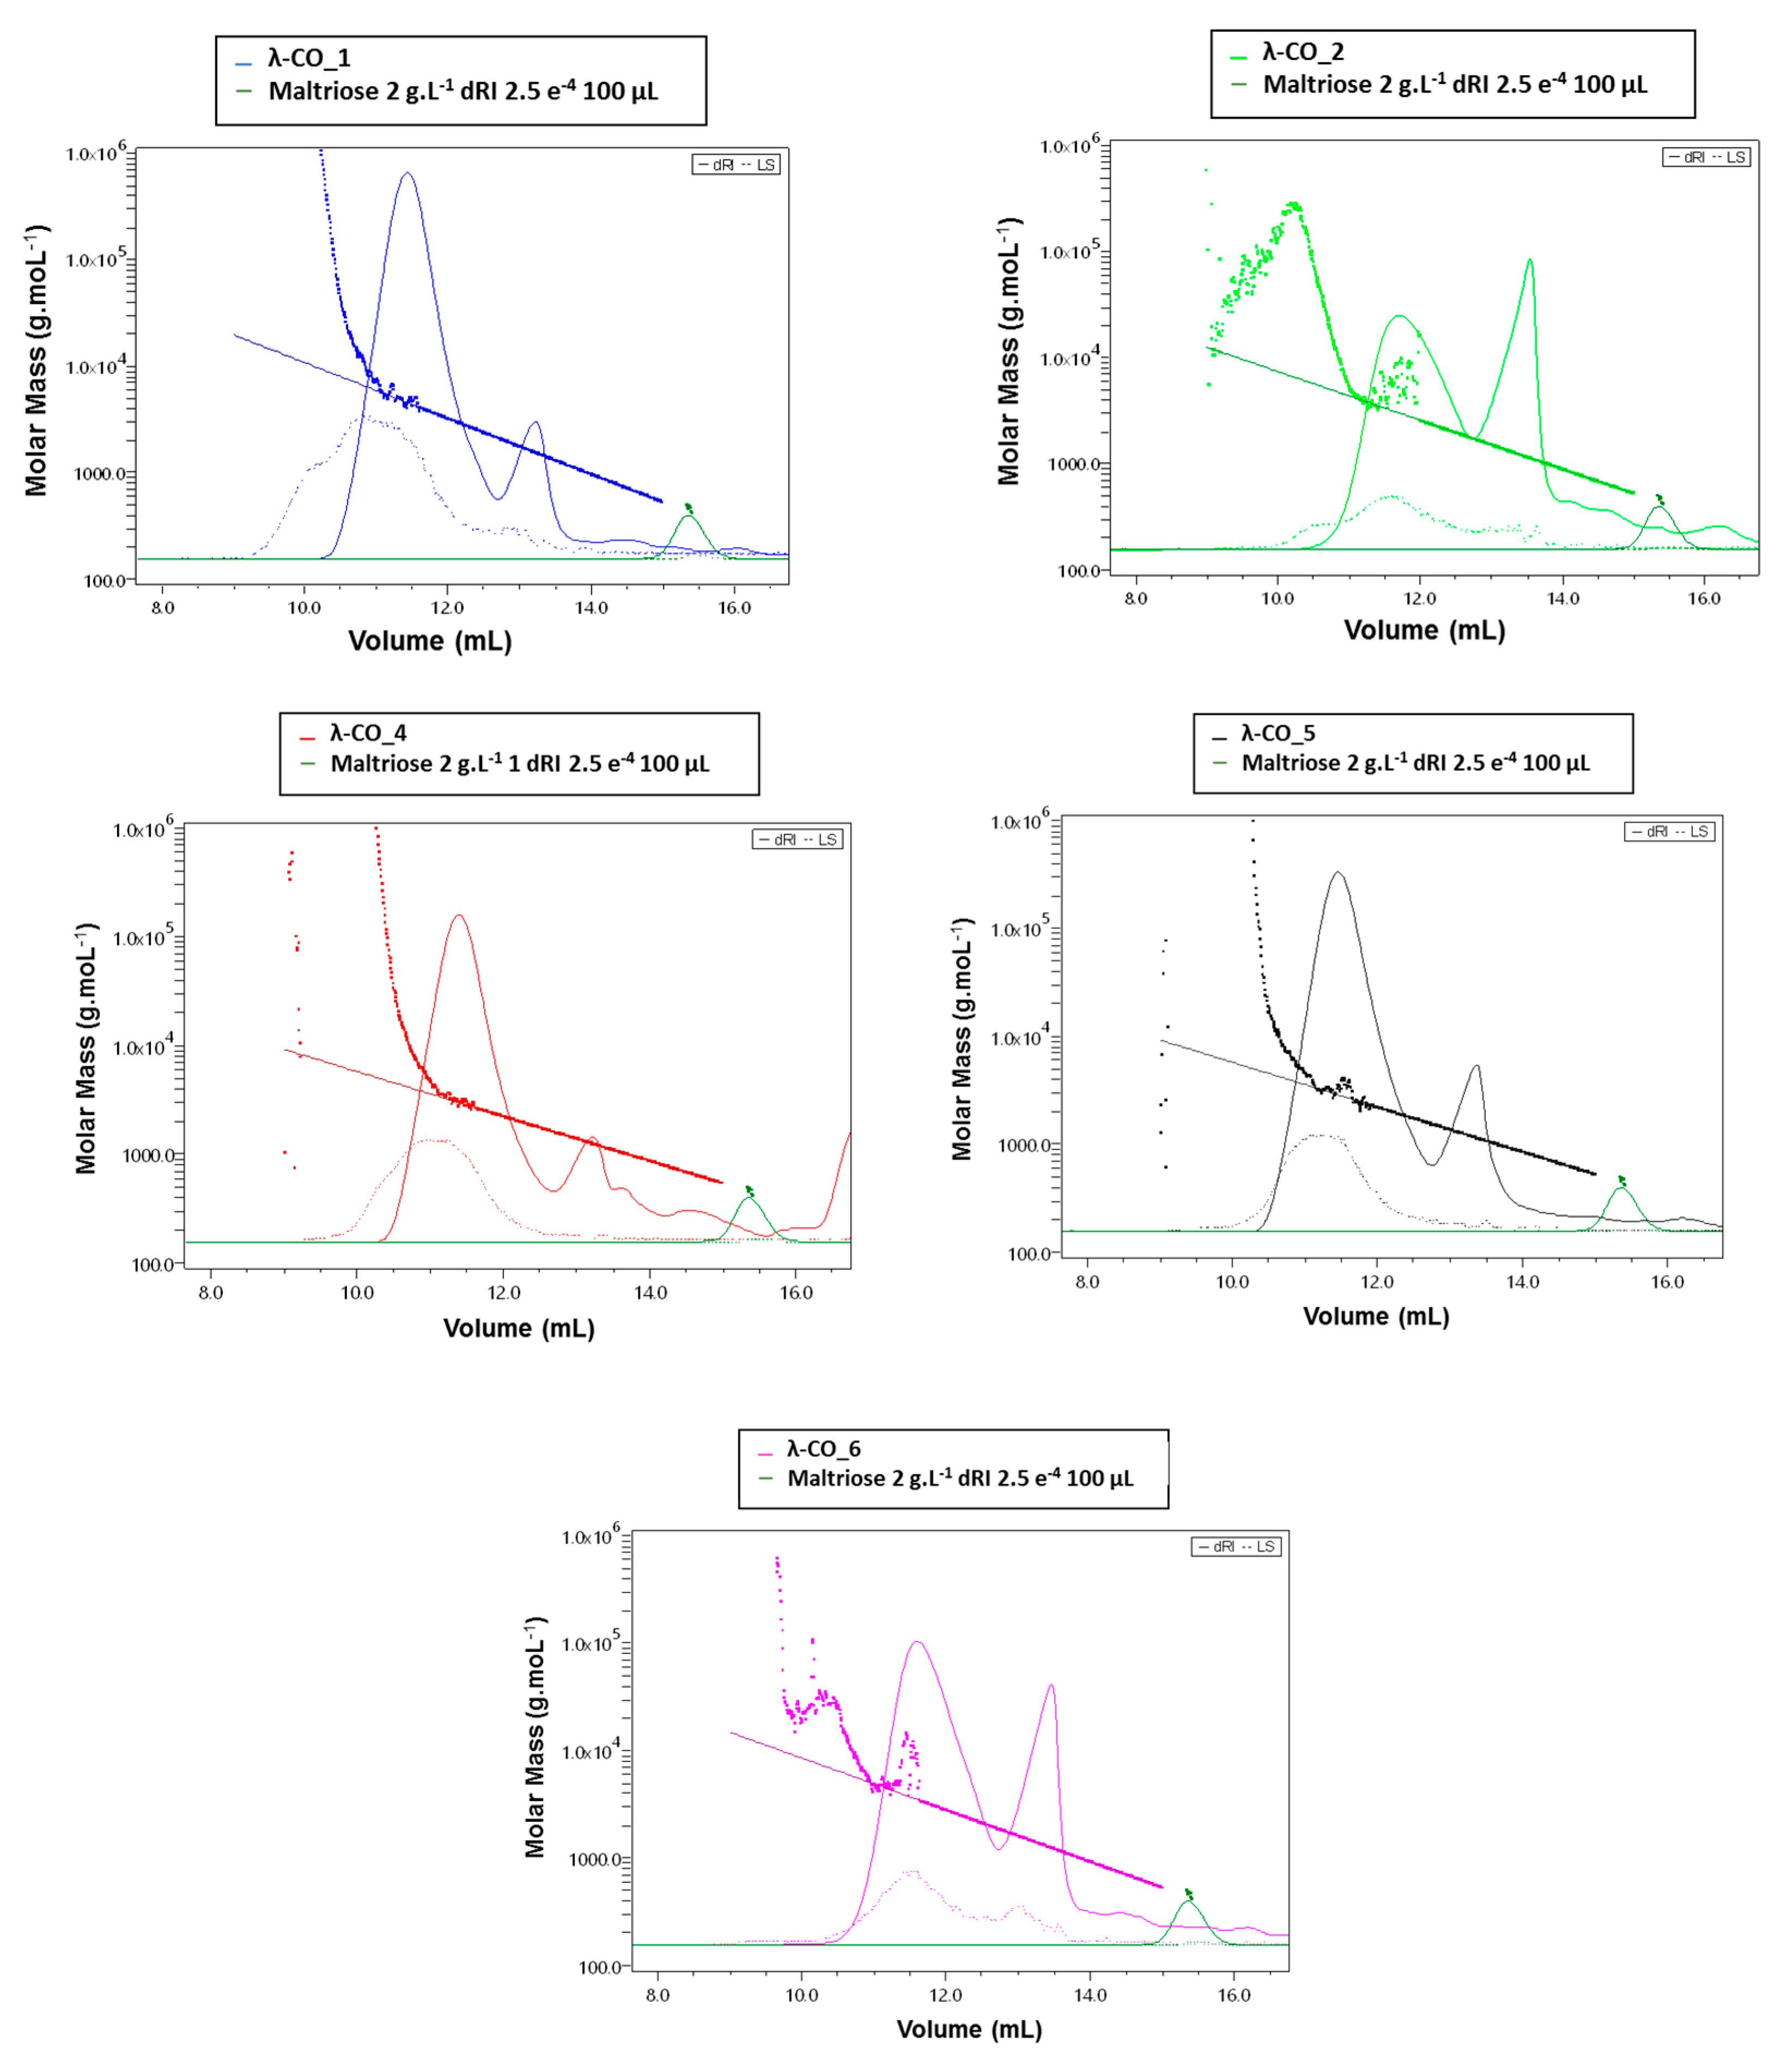
Table 1). The calculation of the absolute molar mass relying on the HPSEC-MALS analyses showed clear differences in M
n and M
w of λ-CARs, which could range, respectively, from 597 and 964 kDa for λ-CAR from supplier_3 to 215 and 762 kDa for λ-CAR from supplier_1 (
Table 1 and
Appendix A,
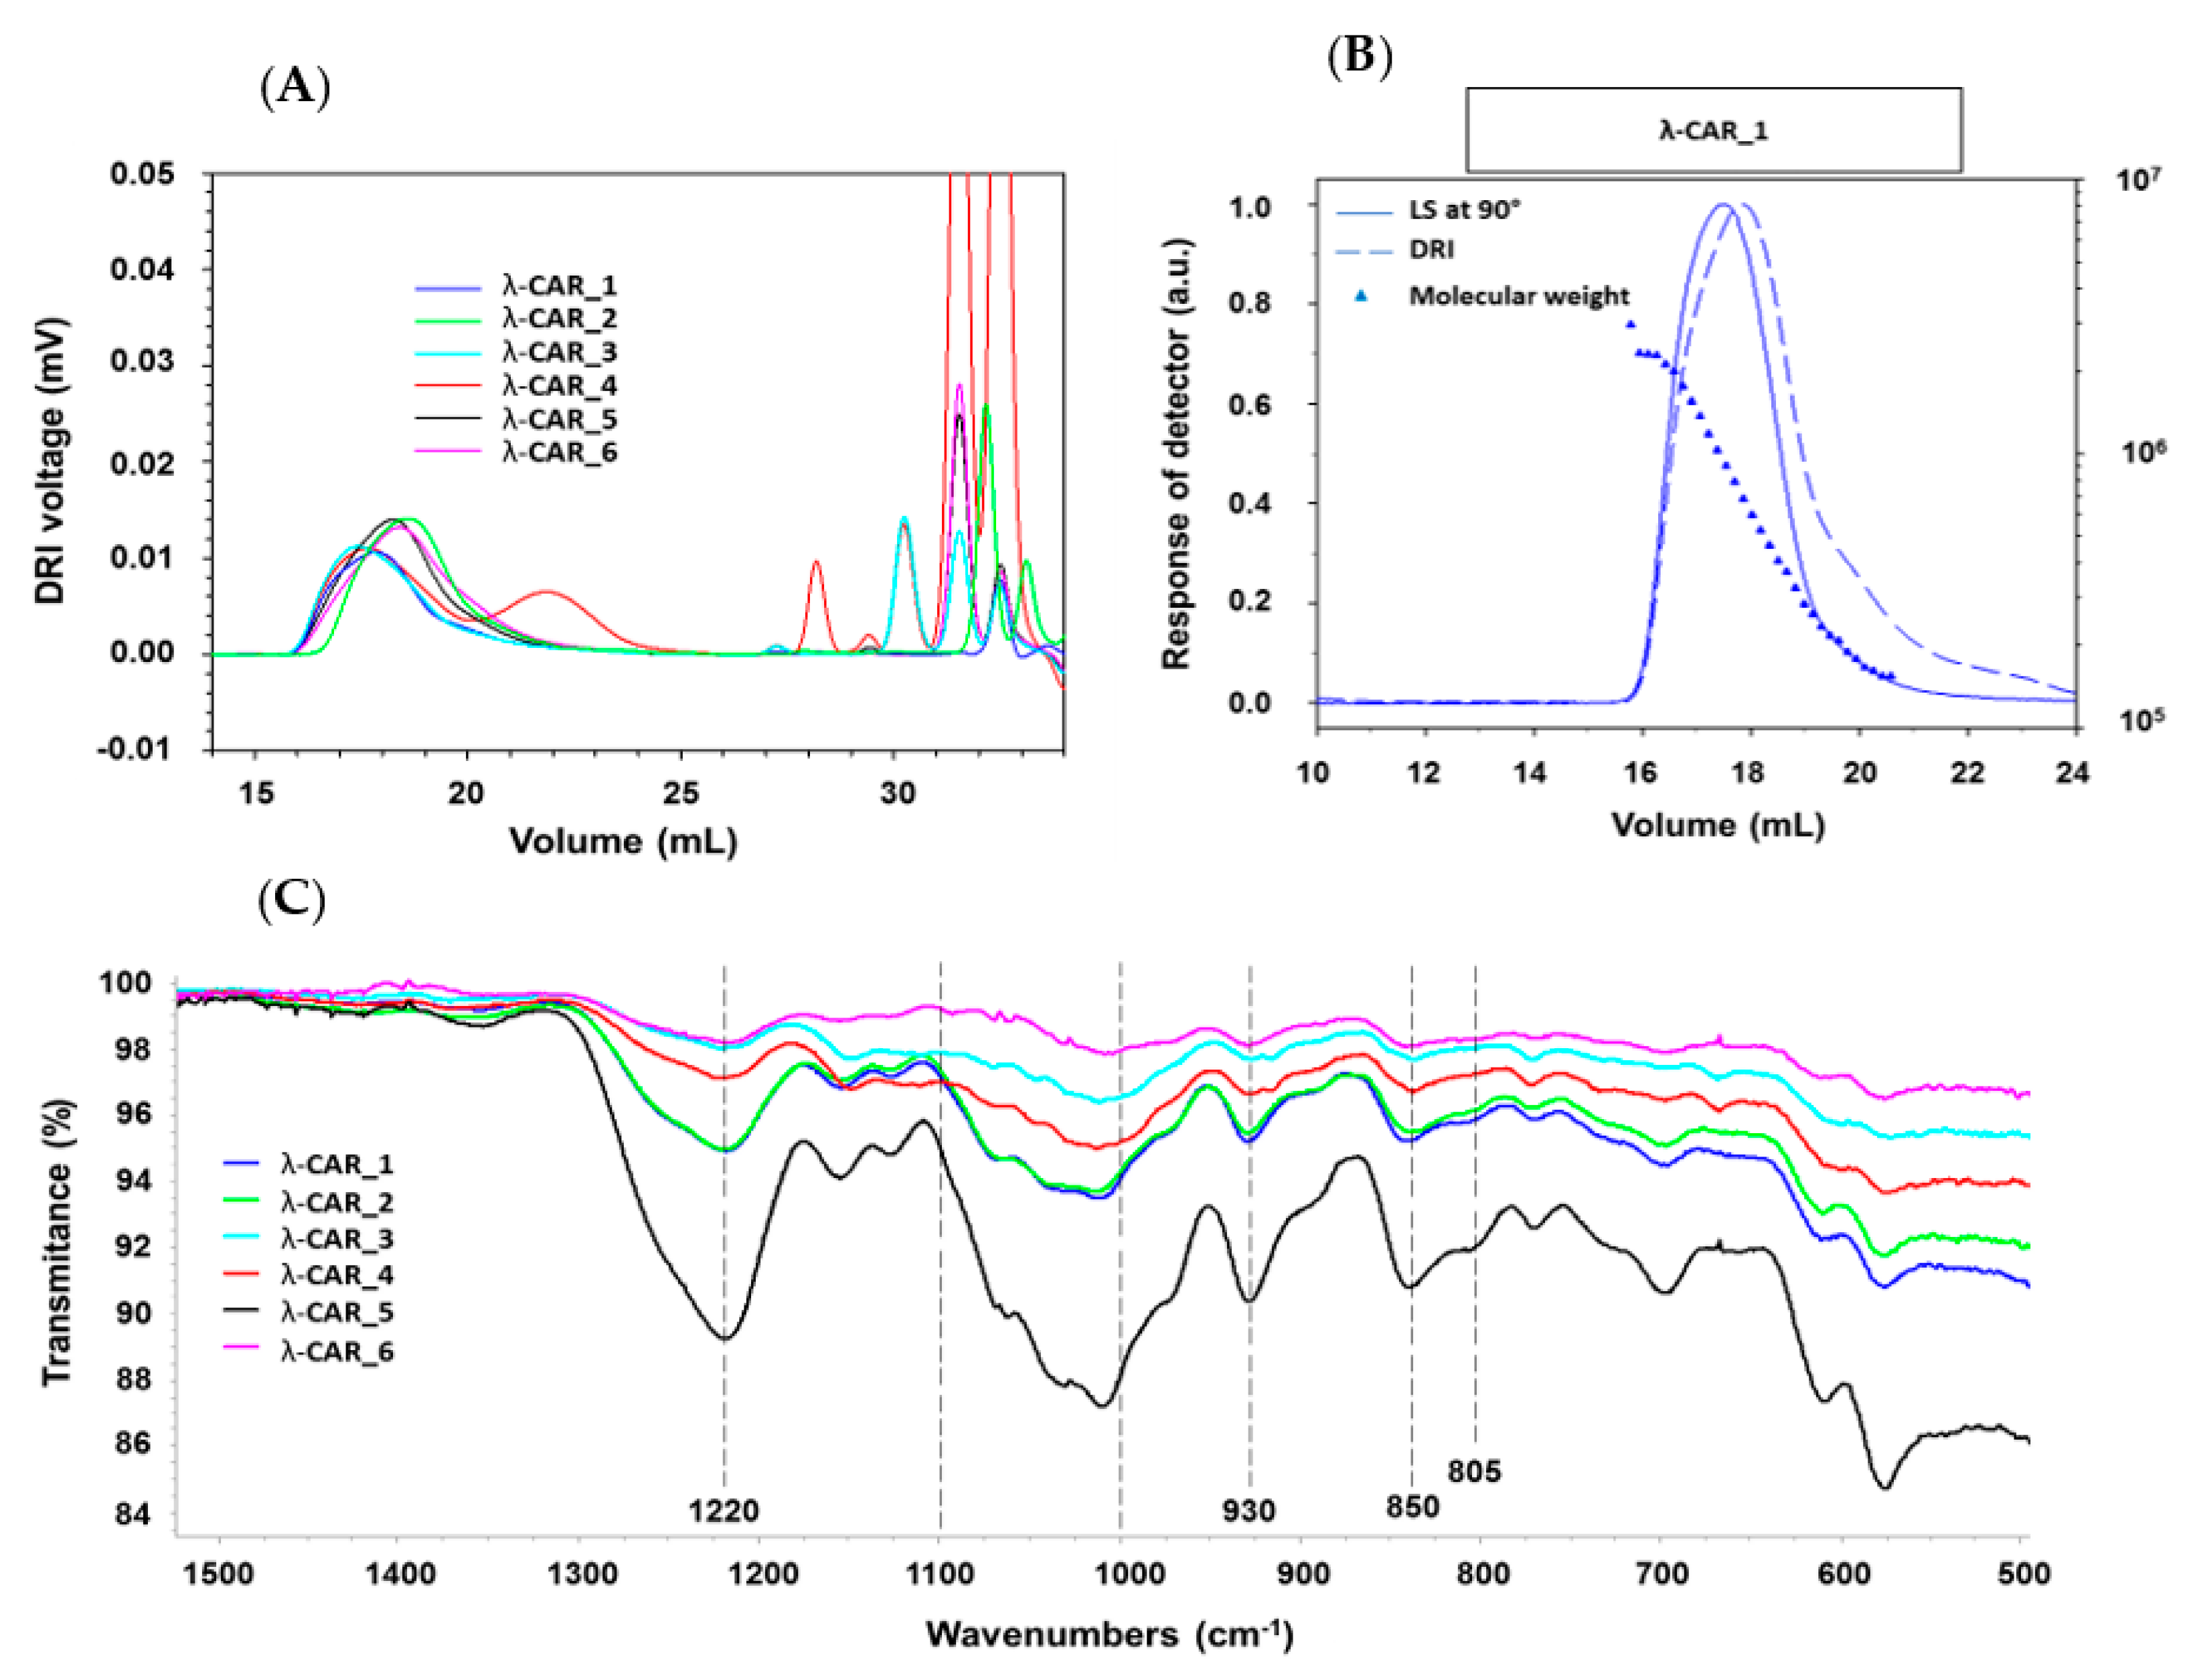
Figure A1). There were also significant differences in Ð. In particular, additional peaks were detected using a DRI in the 27–35 mL region of the chromatograms, just before the solvent peak, showing the presence of additional LMW species in the mixtures (
Figure 1A). These species were more pronounced in the λ-CAR from supplier_4, which already showed two distinct populations in the sample signal (at 18 and 22 mL). Then, the ICP-MS analyses showed that the λ-CAR from suppliers_1,2,5, and _6 were more sulfated (26.0%, 27.0%, 28.5%, and 28.9%, respectively) than the λ-CAR from supplier_3 and _4 (21.4% and 21.9%, respectively). These results confirmed the presence of dissimilarities in terms of M
n, DS, and Ð between the native λ-CARs depending on the supplier.
The ICP-MS analyses also revealed differences in the basic elemental composition of different raw materials, especially in terms of iron, magnesium, and manganese content (
Appendix A,
Table A1). Finally, a first basic overview of the structural characterization was achieved by FTIR. A typical absorption corresponding to SP was observed at about 1250 cm
−1, corresponding to the sulfate ester groups present in six commercial native λ-CARs. Marked broad-absorption bands in the 1000–1100 cm
−1 region were also observed, corresponding to representative chemical functions of these polysaccharides, as summarized by Fernàndez et al. [
55]. When analyzing more thoroughly the vibrations characterizing the CARs families, all the observed spectra presented vibrations at about 820–830 cm
−1, corresponding, respectively, to 2- and 6-sulfate galactopyranose of the λ-CAR type. However, a weak signal at about 805 cm
−1, corresponding to 3,6-anhydrogalactose-2-sulphate present in the ι-family was also detected. In addition, strong bands at 850 and 930 cm
−1 were also observed, corresponding to 3,6-anhydro-
d-galactose and 4-sulfate
d-galactose present in both κ and ι-CARs types, respectively. Therefore, FTIR analysis confirmed the presence of κ and ι-CARs sequences in the six commercial native λ-CARs.Overall, these first results confirmed that commercial λ-CARs can present differences in their physicochemical features. Such a variation is well known for polysaccharides extracted from natural resources, the features of which will depend on the algal source, growth/environmental conditions, or industrial steps required for their extraction [
52,
56,
57]. Interestingly, the FTIR analysis also confirmed the additional facet specific to the commercial λ-CARs that contain various proportions of other CAR types (κ/ι) depending on the reproductive cycle at which algae were collected [
53].
2.2. Native λ-CARs Depolymerization for λ-COs Production
λ-COs were generated from the commercial native λ-CARs using a H
2O
2-based radical hydrolysis, one of the most commonly used methods for CAR OSs production [
19]. Hydrolysis was performed at 60 °C with an H
2O
2/λ-CARs ratio (
w/w) of 1.5, two parameters previously described as suitable for λ-COs production [
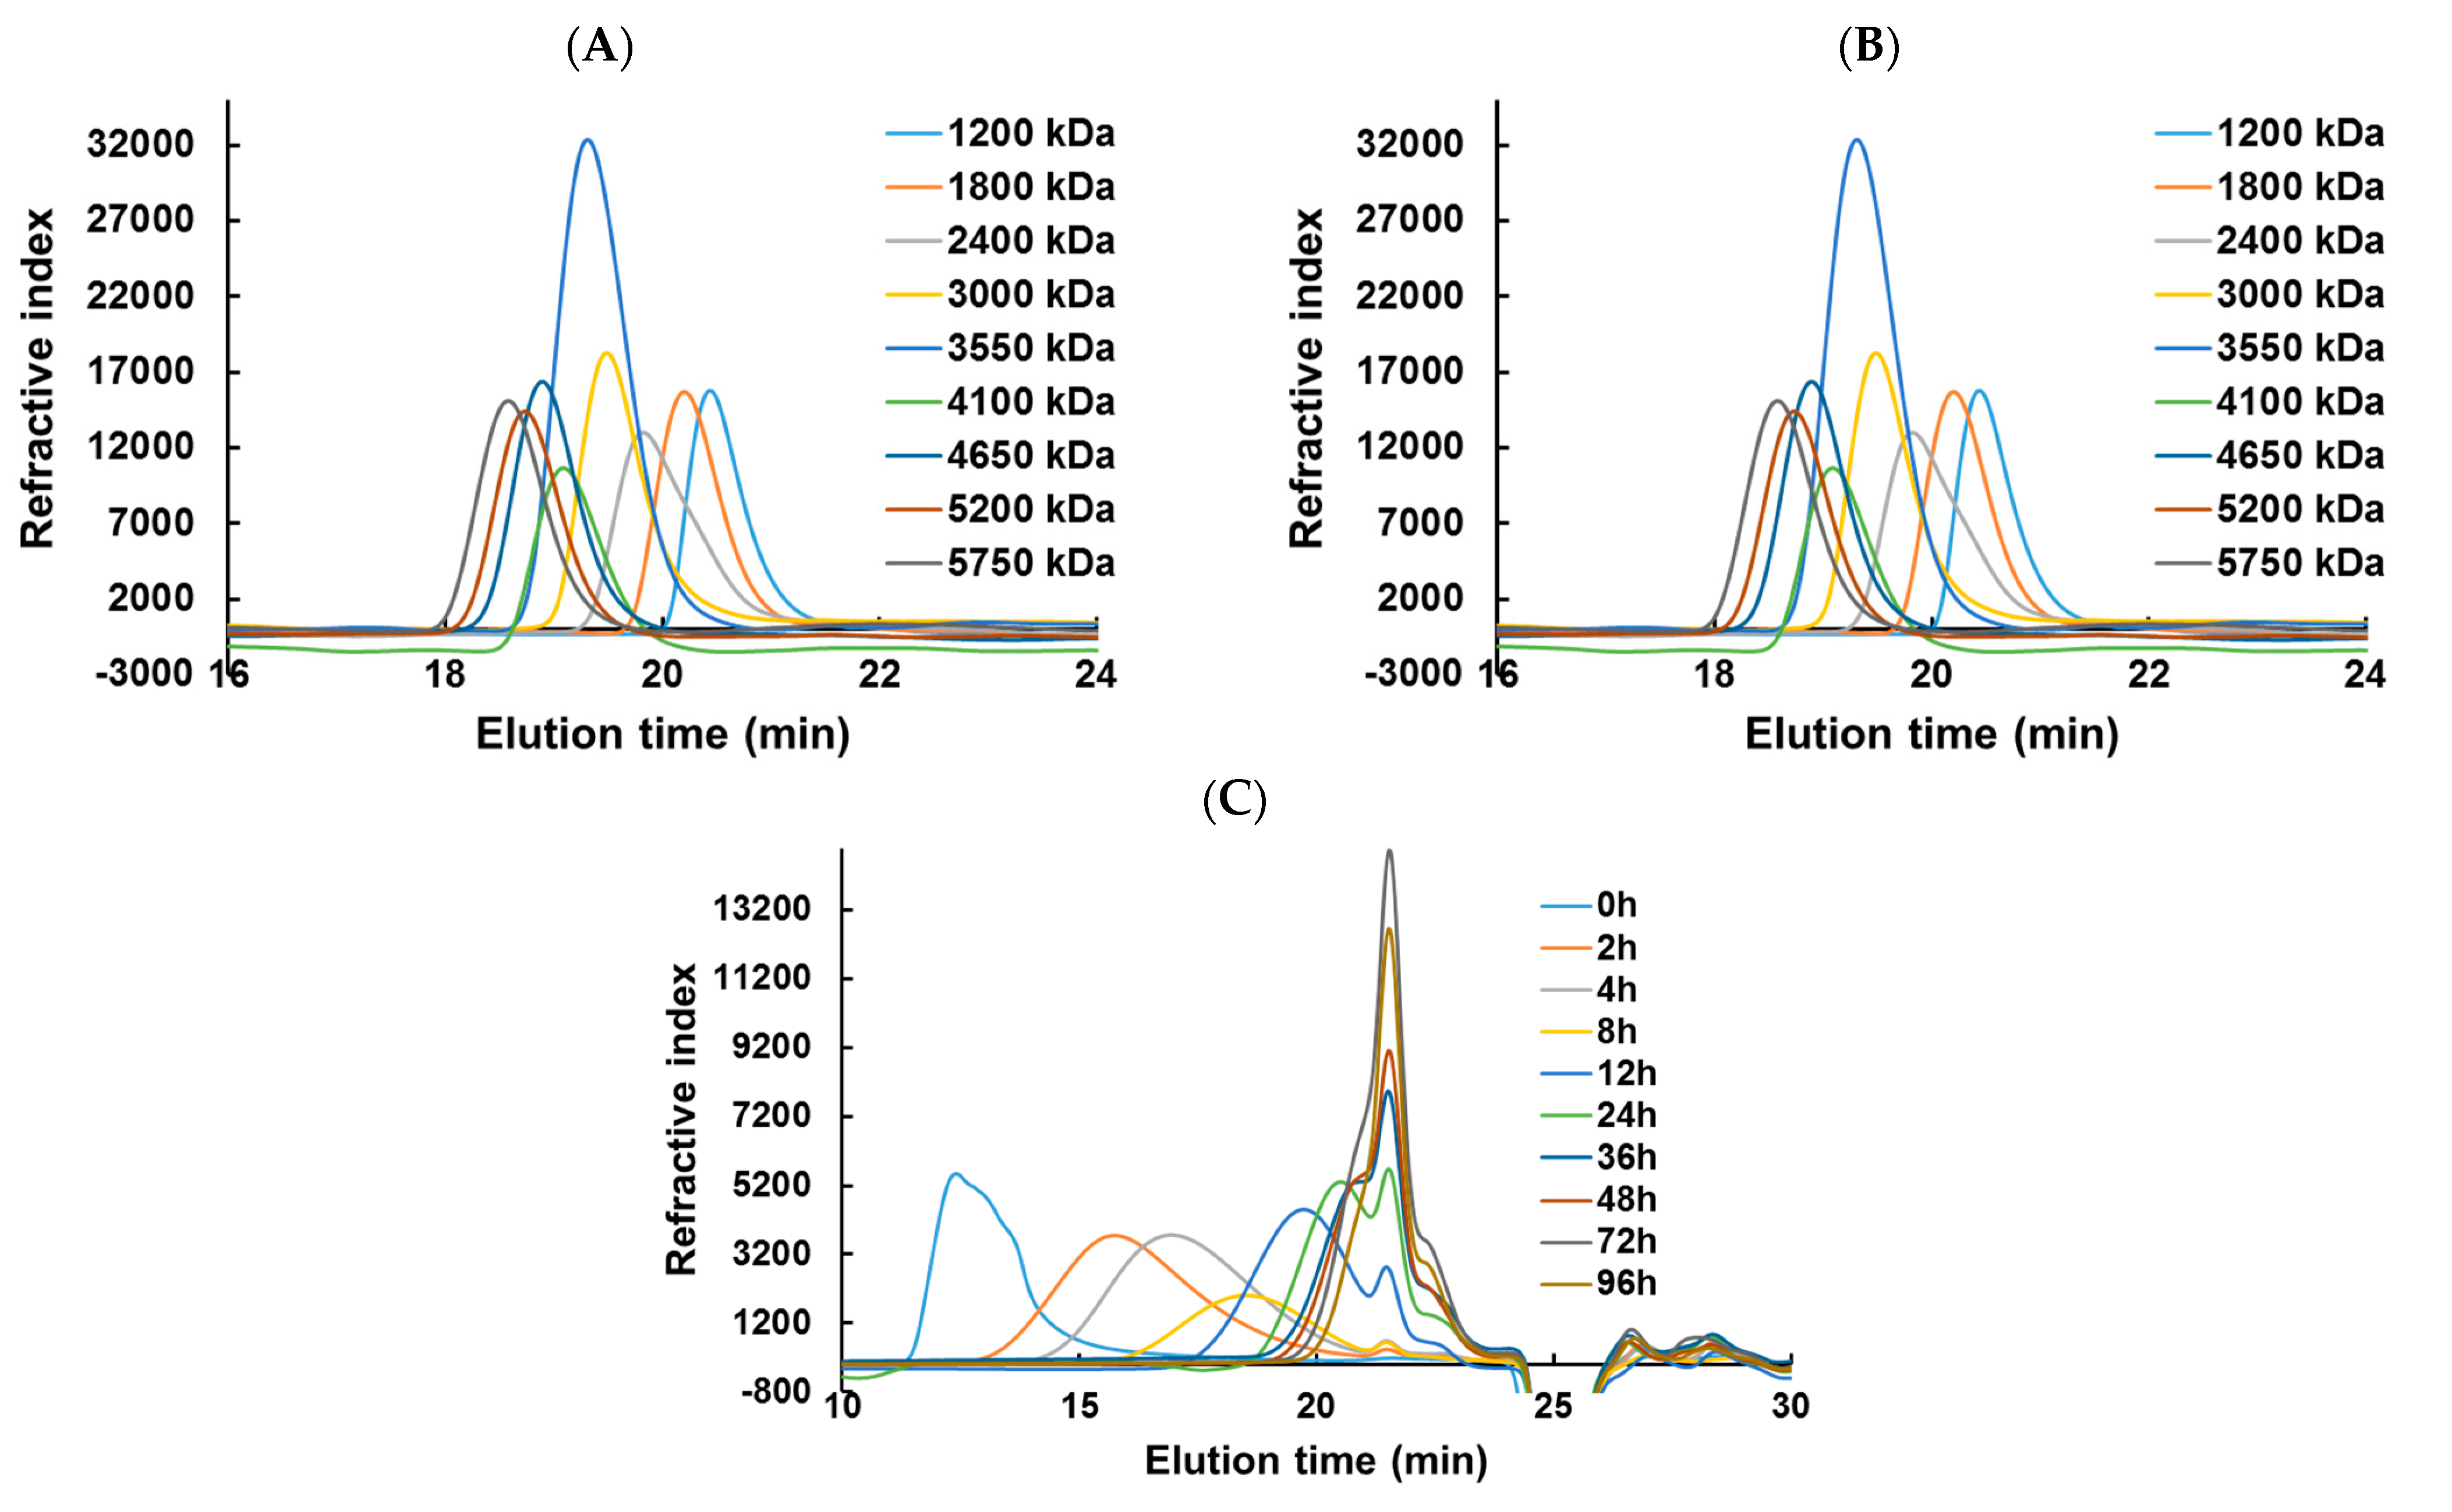
44]. HPSEC-DRI analyses allowed determining the molar masses (M
n, M
w) of the λ-COs produced using a calibration curve of pullulan standards for species above 10 kDa and a calibration curve of heparin standards for species below 10 kDa (
Table 1 and
Appendix A,
Figure A2). Moreover, the M
n of selected λ-COs was also calculated by HPSEC-MALS (
Appendix A,
Figure A5,
Table A2), and showed that the M
n values were close to those of heparin equivalent, confirming the accuracy of using heparin standards to estimate the M
n and M
w of LMW OSs. As already shown in [
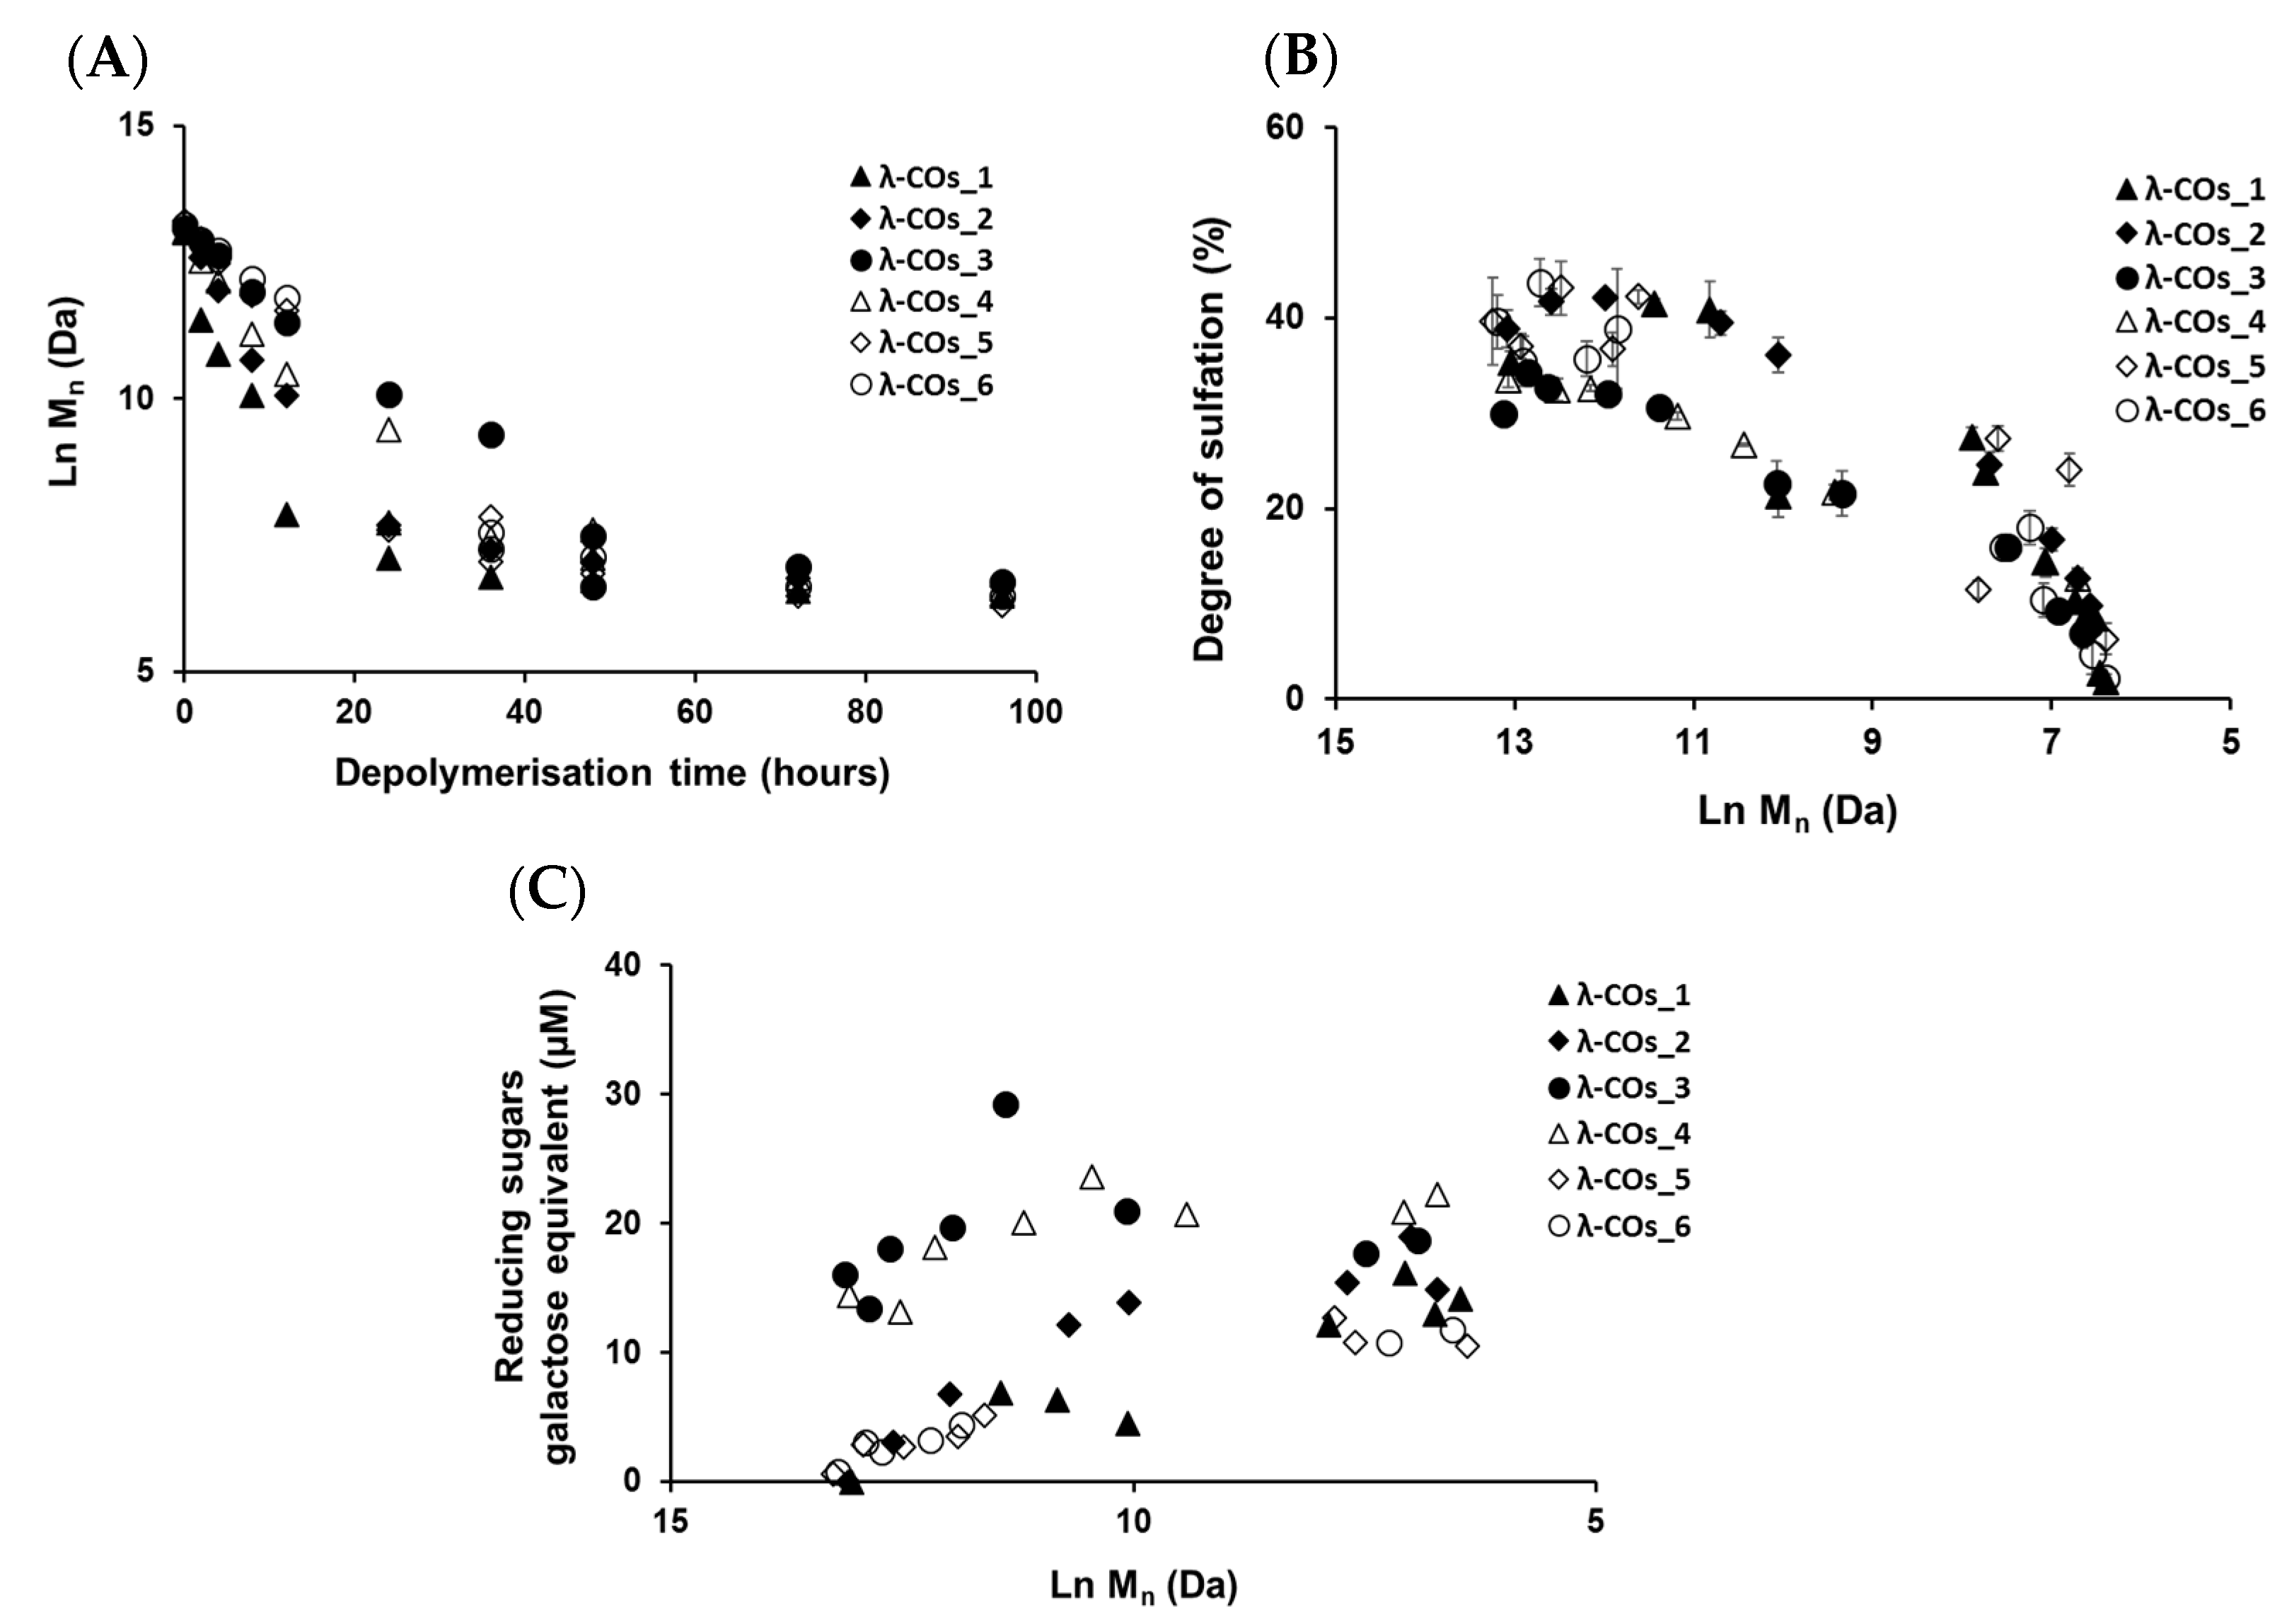
44], a decrease in M
n was observed over time, confirming the depolymerization method efficiency (
Figure 2A). Clear differences in the M
n were observed between the λ-COs of each commercial native λ-CAR before 24 h depolymerization time, which could be explained by the differences in the M
n observed between the different native λ-CARs (see above). In fact, a slower depolymerization kinetic was observed for λ-CAR from supplier_3, which showed the highest M
n of 597 kDa compared with the λ-CAR from supplier_1 that was depolymerized more rapidly than all other native λ-CARs and presented the lowest M
n of 215 kDa. However, this depolymerization kinetics of native λ-CARs was not the same for all the commercial products, suggesting the influence of other parameters, such as a structural conformation, more resistant to hydrolysis [
4]. Interestingly, after 24 h depolymerization, the M
n values of all generated λ-COs started to become closer over time, suggesting more similar structural LMW patterns, and thus a similar efficiency in the H
2O
2-based hydrolysis.
The DS of all generated λ-COs was also measured over time during depolymerization (
Figure 2B). A slow decrease was observed when the M
n was > 20 kDa, whereas it became faster after this M
n threshold, while the depolymerization reaction slowed down, as shown in
Figure 2A and in our previous work [
44]. This desulfation behavior at the beginning of the reaction could be explained by the complex tridimensional structure of native λ-CARs [
4], which could limit the exposure of sulfate groups to the H
2O
2 depolymerization agent and thus, lead to a slow desulfation at the beginning of the reaction. However, this structure was removed through depolymerization, and the sulfate groups were increasingly exposed to the H
2O
2 agent, increasing the kinetics of desulfation (
Figure 2B). It has also been previously suggested that differences in resistance to hydrolysis, depending on the position of the three sulfate groups that theoretically compose the λ-diads, could explain this observation [
44]. Important differences in DS between all the λ-COs were mainly found when the M
n was above > 10 kDa and were consistent with the variations observed between the native products: i.e., the higher the DS of the native product, the higher the DS of the resultant λ-COs compared with the other. Again, the DS appeared more similar between shorter λ-COs. These two observations indicated that even if the initial products showed differences, the generated λ-COs < 10 kDa demonstrated more homogeneous M
n and DS regardless of the origin of the native λ-CARs and provided an adjustment of the depolymerization time according to each brand (
Figure 2A,B and
Table 2).
To complete this physicochemical characterization, the levels of reducing sugars were measured in the solutions during the depolymerization process (
Figure 2C). An overall trend of increasing concentrations of reducing ends (expressed in galactose equivalent) was observed, which showed that the hydrolysis of glycosidic bonds resulting from the depolymerization reaction produced new reducing terminal galactoses over M
n reduction. However, after the reaction time corresponding approximatively to the production of 10 kDa OSs, the concentration of reducing sugars began surprisingly to decrease even though the chain length continued to be reduced. This suggested a possible change in terminal monosaccharides that will be further studied (see analyses of the selected λ-COs by MS and NMR). It is noteworthy that the level of reducing ends was especially high at the beginning of depolymerization for OSs originating from supplier_3 and supplier_4, suggesting the presence of small reducing sugars in the mixtures, such as glucose, which is often used as an adjuvant [
58].
Finally, the reproducibility of the H
2O
2-based depolymerization was assessed because of its importance for large-scale production of bioactive λ-COs. In this regard, the reaction was repeated using the same depolymerization times on all commercial λ-CARs (
Table 2, dep (1) and dep (2)). The M
n and DS were calculated and differences were observed between both depolymerization reactions (dep1 and dep2). For example, for the λ-CAR from supplier_1, a λ-CO with an M
n of 1.2 kDa and DS of 14% was obtained after a first depolymerization for 24h, whereas a λ-CO with higher M
n and DS of 2.3 kDa and 24%, respectively, was obtained after the second depolymerization. This result could be explained by the experimental setup, which was not implemented in bioreactors where the conditions are tightly controlled so that some temperature fluctuation was possible. Additionally, λ-CARs were subjected to conditions close to the solubility limit at the beginning of the reaction, resulting in a heterogeneous medium, which could also explain some variations [
4]. However, it should be noted that, with few exceptions, the M
n and DS of each OS remained correlated regardless of their origin; in other words, one given M
n is associated with a specific DS. This suggests that with a real-time adjustment of the reaction (looking “live” at M
n and DS parameters), it is possible to obtain similar formulations with identified characteristics. Such “live” controls are quite common for the preparation of LMW PS, e.g., a biological control based on anti-Xa activities is performed for the industrial production of standard batches of LMW heparins [
59].
2.3. Study of the Inhibition of Heparanase Activity by λ-Cos
Next, we achieved biofunctional monitoring across the λ-COs chemical library of different anti-HPSE activities for which λ-COs are considered promising [
38,
42,
43,
44,
45,
46]. Thus, this biomonitoring of λ-COs was assessed at a concentration of 2.5 µg·mL
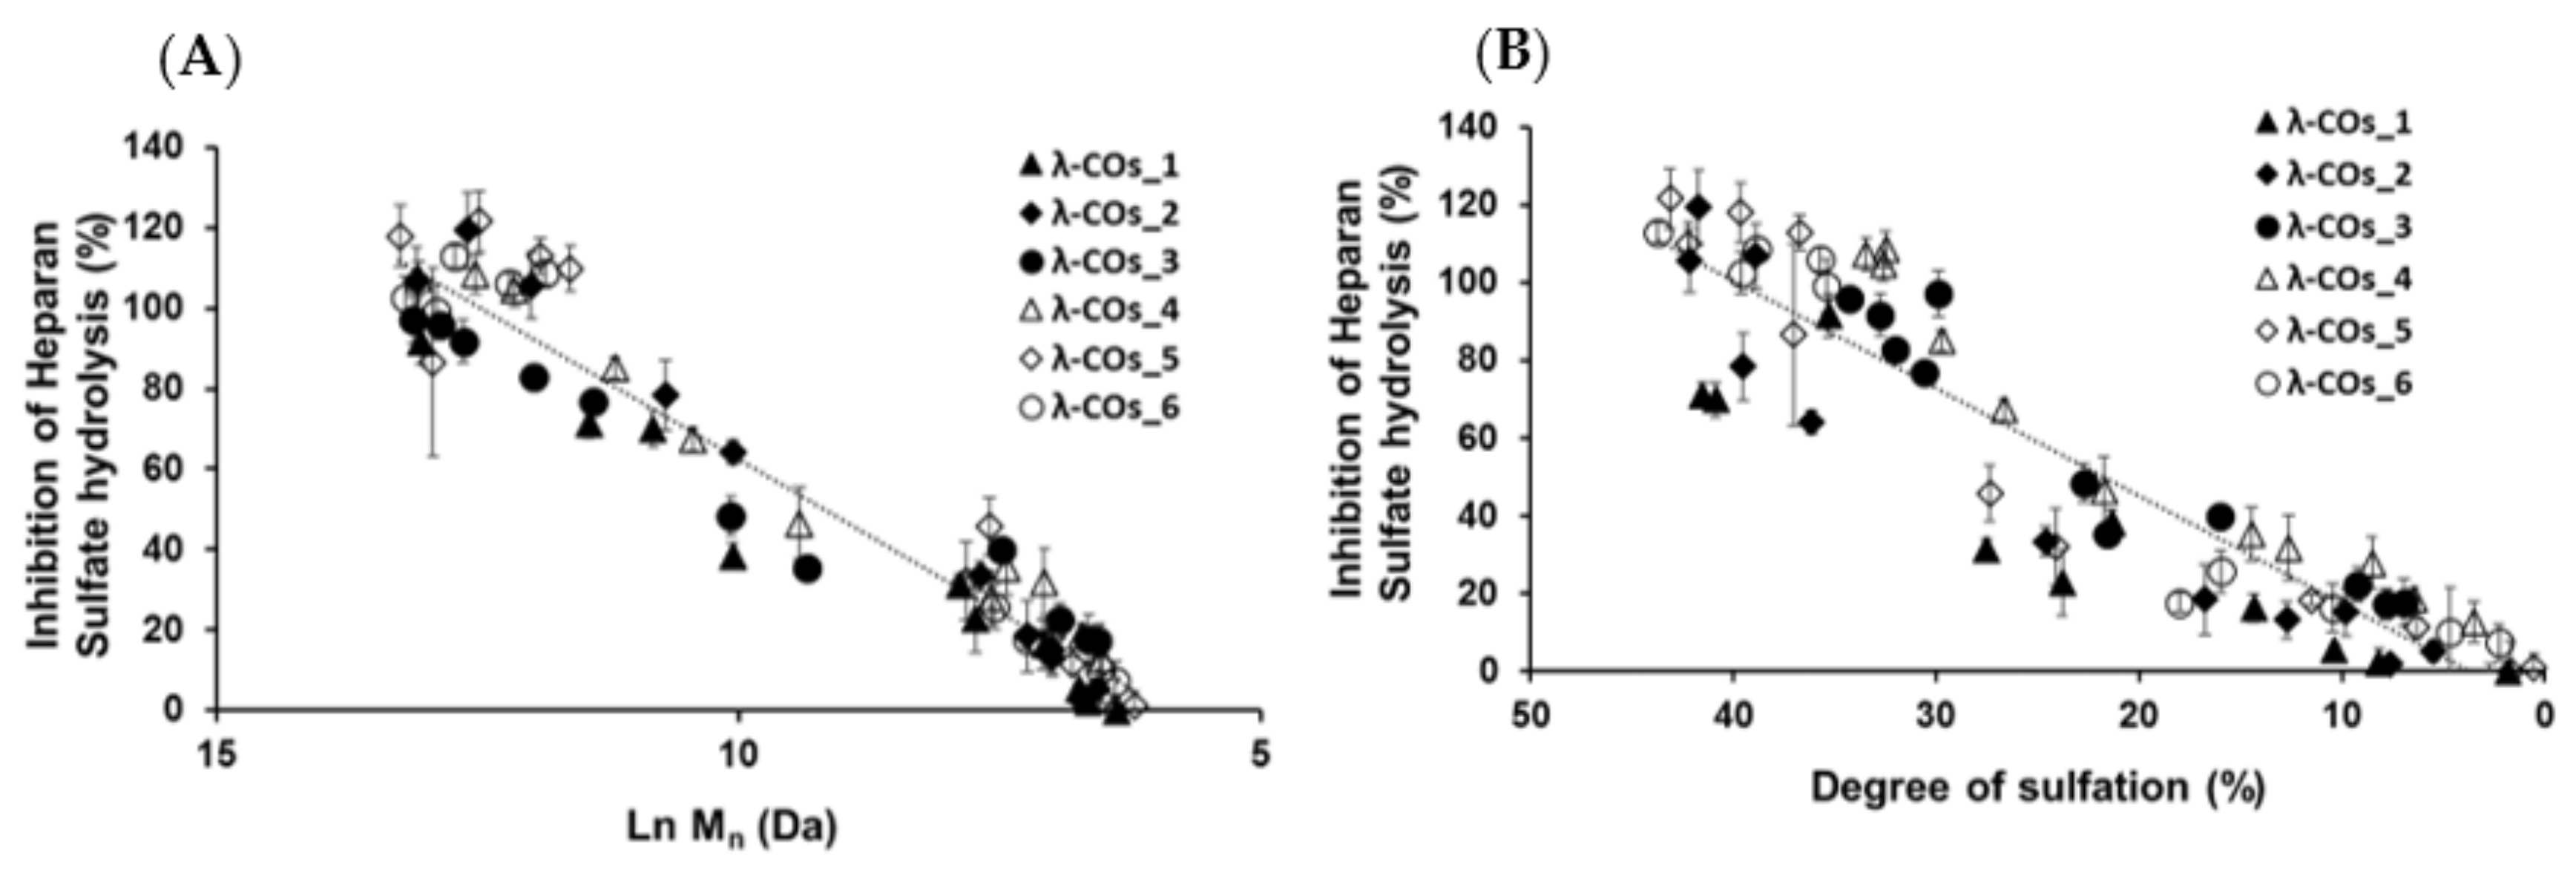
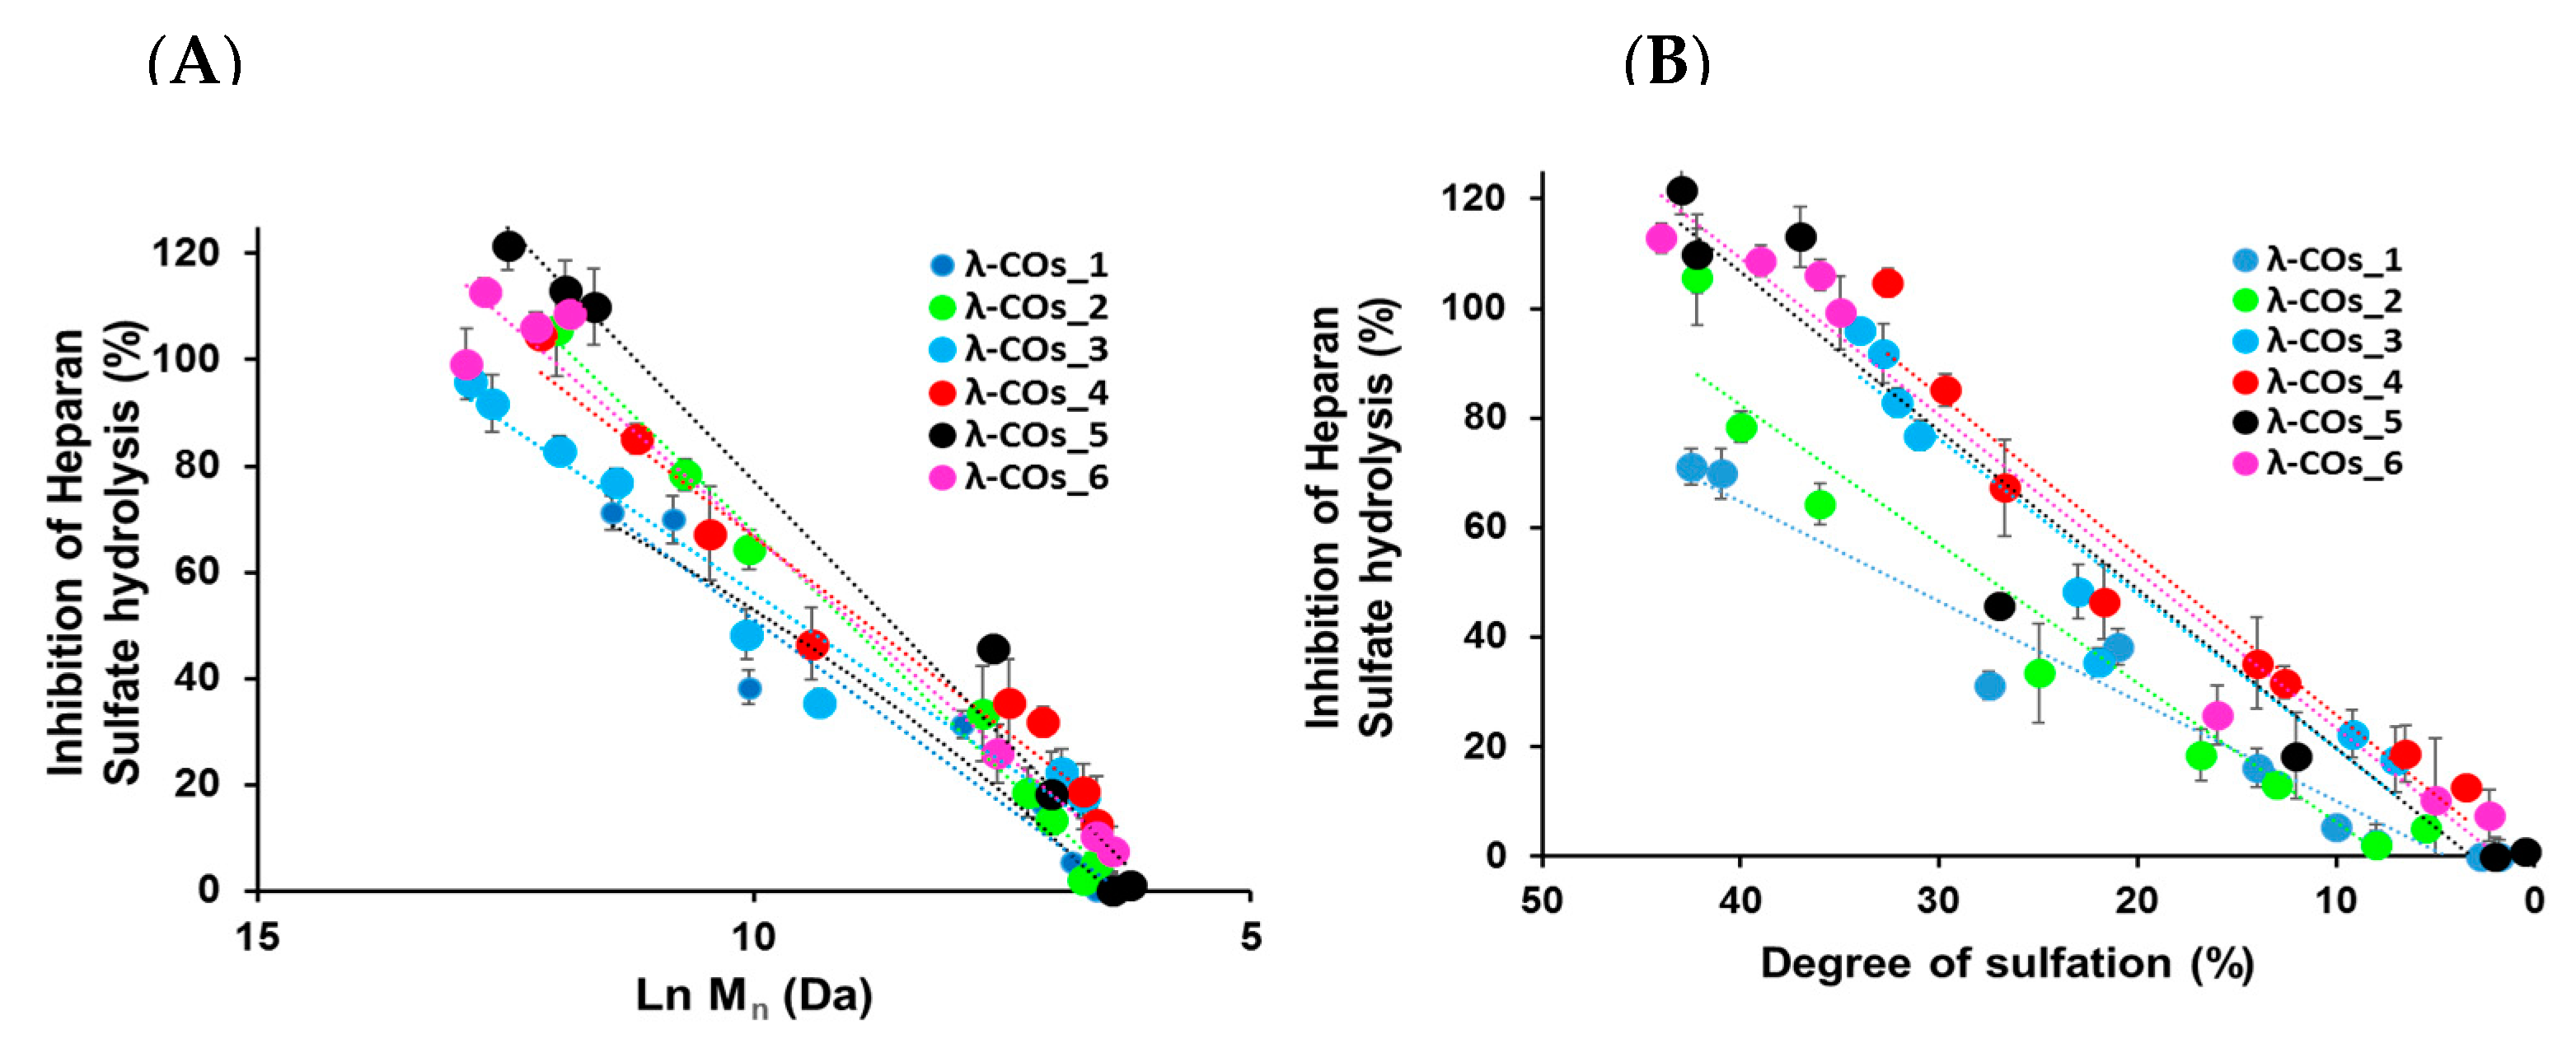
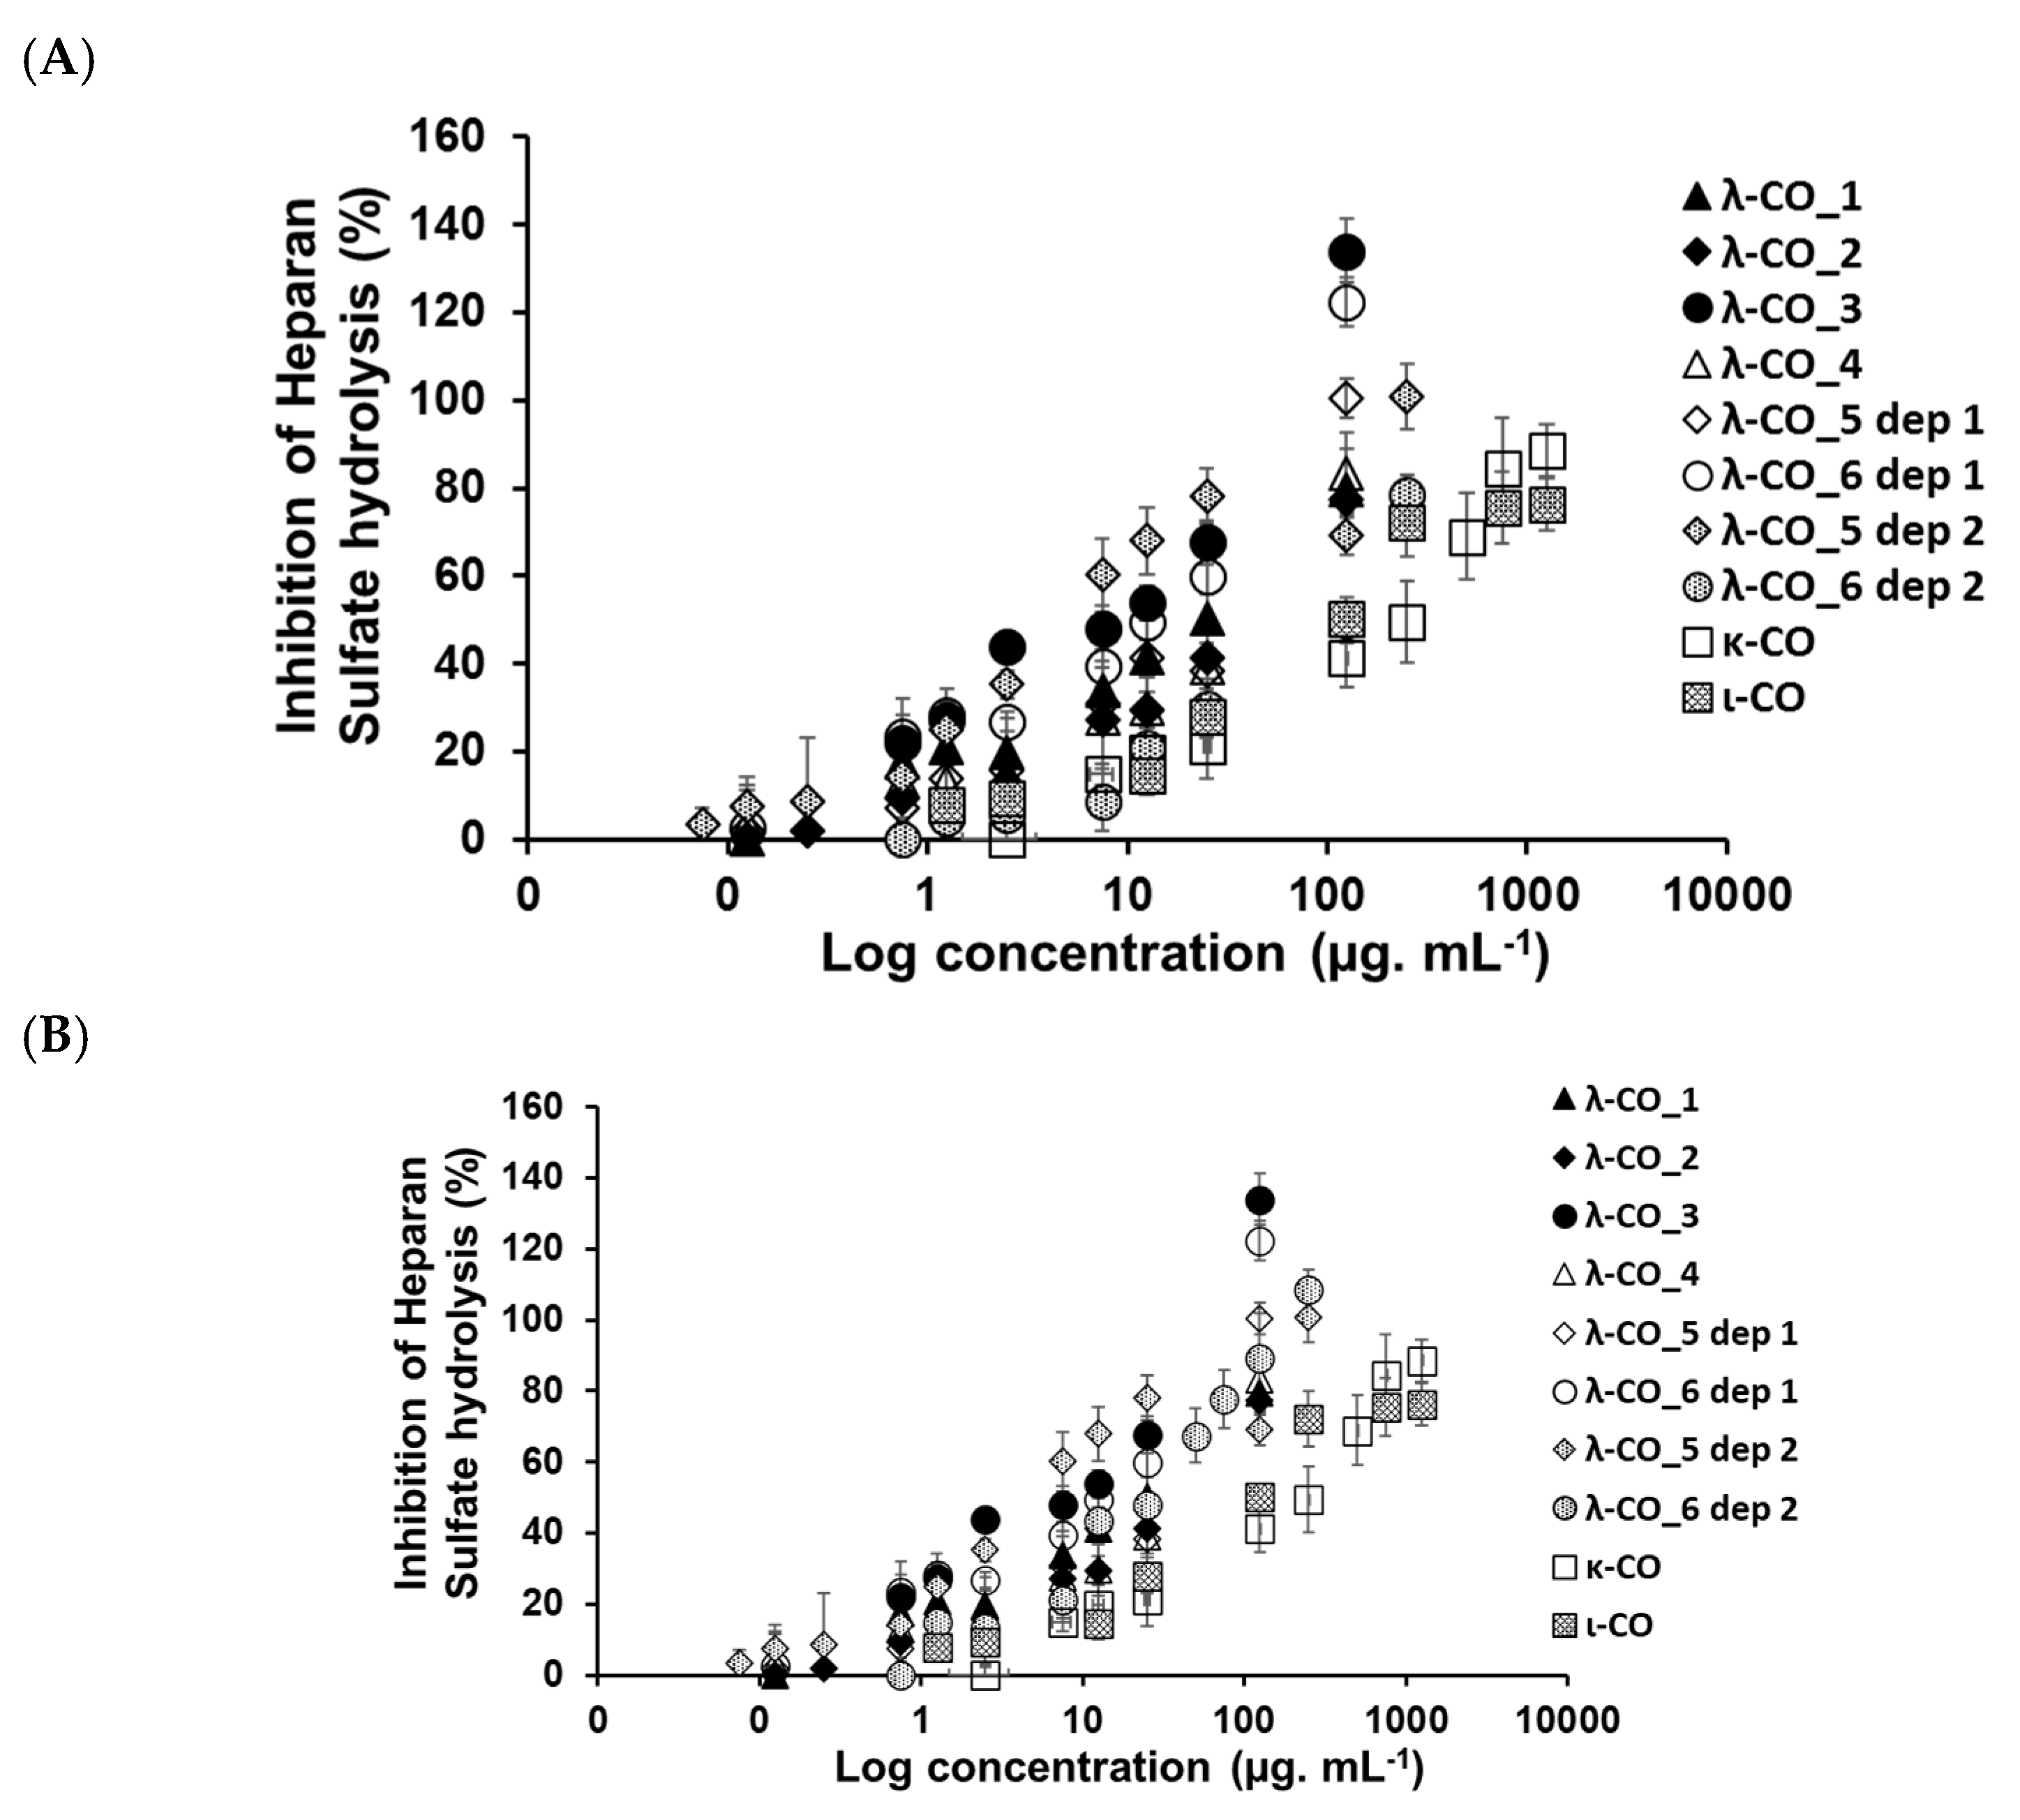
−1, suitable to encompass inhibition concentrations of all the λ-COs. As expected, anti-HPSE activity decreased according to the M
n and DS reductions throughout depolymerization (
Figure 3A,B), regardless of the starting material. Taken independently, the two variables Ln (M
n) showed a complete linear Pearson correlation with the inhibition of the HPSE activity, with
r2 of 0.962 and 0.929 (
p-values < 1 × 10
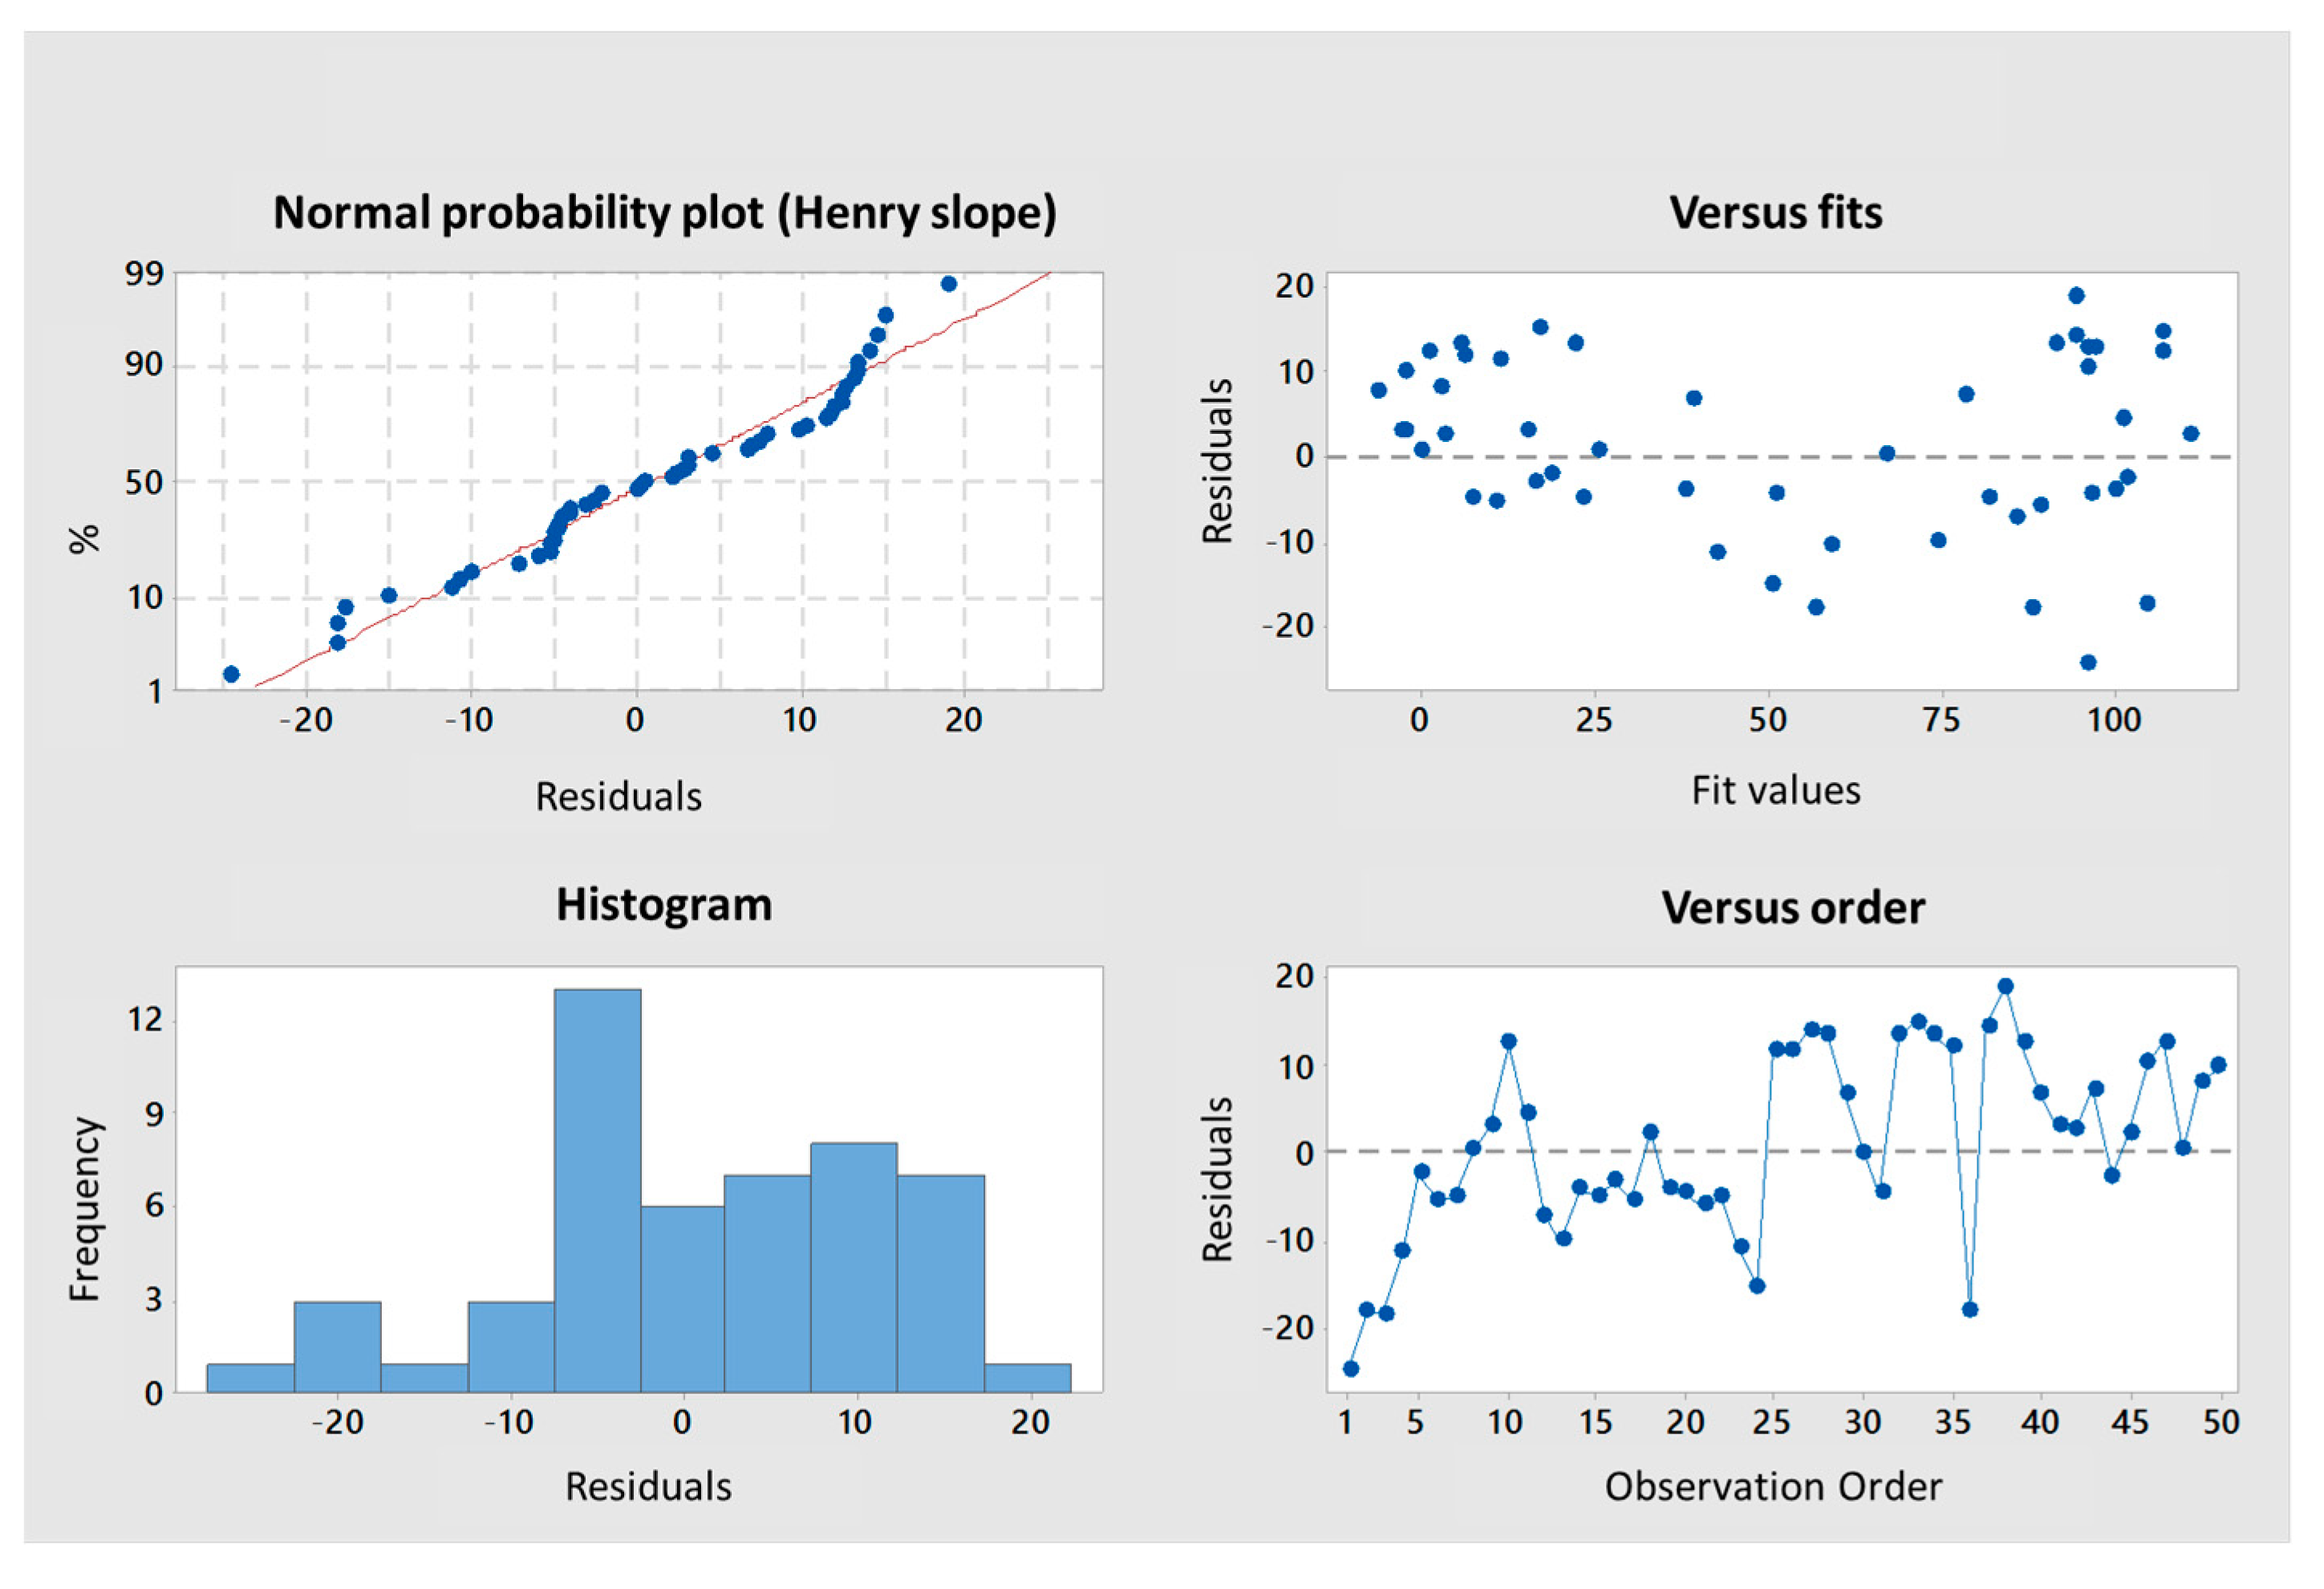
−5), respectively. A multiple linear regression based on the least squares method was then performed using the two variables together. The model obtained was consistent (
Appendix A,
Figure A3), explaining 97.6% of the variance of the system (
Table 3). Both predictors were significant with coefficients of 10.04 ± 1.26 and 1.189 ± 0.162 for M
n and DS, respectively. As already reported, because H
2O
2 both depolymerizes and causes desulfation, it is difficult to distinguish the more important parameter for the anti-HPSE activity with this method [
44]. On the one hand, standardized coded values after normalization by the averages and scales indicated that DS might be slightly more influential than the chain length. The presence of sulfate groups is commonly described as very favorable for the conception of OS-based HPSE inhibitors [
40,
41]. On the other hand, at the beginning of the depolymerization (when Ln(Mn) went from 15 to around 10 KDa), although there is only a slight decrease in DS (
Figure 2B), anti-HPSE activity still decreased substantially (
Figure 3A). In addition, a previous study already showed a general trend of reduction in HPSE inhibition along with λ-COs shortening [
45]. Broadening the discussion, many studies also described an increase in antitumor or immune-stimulating activities for LMW λ-CAR derivatives that might be partially mediated by HPSE modulation [
24,
28]. Overall, this general trend observed for all λ-CARs was expected, but we wanted to further analyze the importance of the raw material in the production of bioactive λ-COs with anti-HPSE activity, which was not yet investigated.
Similar independent and multiple linear regression analyses were performed, and the λ-COs were grouped and analyzed according to their commercial origin. The R² values, reflecting the variance in the multivariate system, were higher than the one obtained with the analysis of all the generated λ-COs, showing good agreement between the HPSE inhibition values calculated for λ-COs issued from the same supplier. Interestingly, in the independent individual analysis, differences were found between the coefficients of the Ln (M
n), which could range from 12.75 for λ-COs from supplier_3 to 18.49 for λ-COs from supplier_2, as well as between the coefficients of the DS, which could range from 1.82 for λ-COs from supplier_1 to 3.14 for λ-COs from supplier_4 (
Appendix A,
Figure A4). These data suggested that the ability to inhibit HPSE activity is not only dependent on the M
n and DS but can vary with the starting material and slightly differ in the case of λ-COs with the same M
n and DS. However, these statistical values should be interpreted with caution given the smaller populations used when separating the λ-COs library according to the commercial suppliers (as evidenced by the loss of significance of several
p-values) and the assumption of linearity across the scale, which could not be the case for the extremely small and highly desulfated OSs.
To support this hypothesis regarding the role of parameters other than M
n and DS influencing the inhibition of HPSE activity and to deepen the biological evaluation, six λ-CO from each λ-CAR supplier with close (although slightly different) M
n, M
w, and DS were selected. Instead of assessing the anti-HPSE activity at a single concentration, the half-maximal concentrations (IC
50) were calculated for each candidate (
Table 4 and
Appendix A,
Figure A6). The results were consistent and similar to those reported previously under the same experimental conditions [
43]. In this case, moderate to strong Pearson correlations but with lower significance were found between the calculated Ln (M
n), DS and IC
50 variables: −0.887 (
p-value 0.003) and −0.663 (
p-value 0.073), respectively. This reinforces the hypothesis that slight variations in M
n, M
w, and DS could not fully explain the differences in anti-HPSE activities observed for these six λ-COs. Thus, while this bioactivity is obviously related to M
n and DS, these observations imply the possibility that it could also be “supplier-dependent”, i.e., related to potential structural or composition differences (carrageenan types, salt content, and additives) between the different commercial products. When IC
50 was calculated directly for the native λ-CAR obtained from each supplier (
Table 4 and
Appendix A,
Figure A6), no significant correlations at all were found (
p-value up to 0.3 for IC
50 vs Ln (Mn) or DS)
2.4. MS and NMR Analyses of Selected λ-Cos
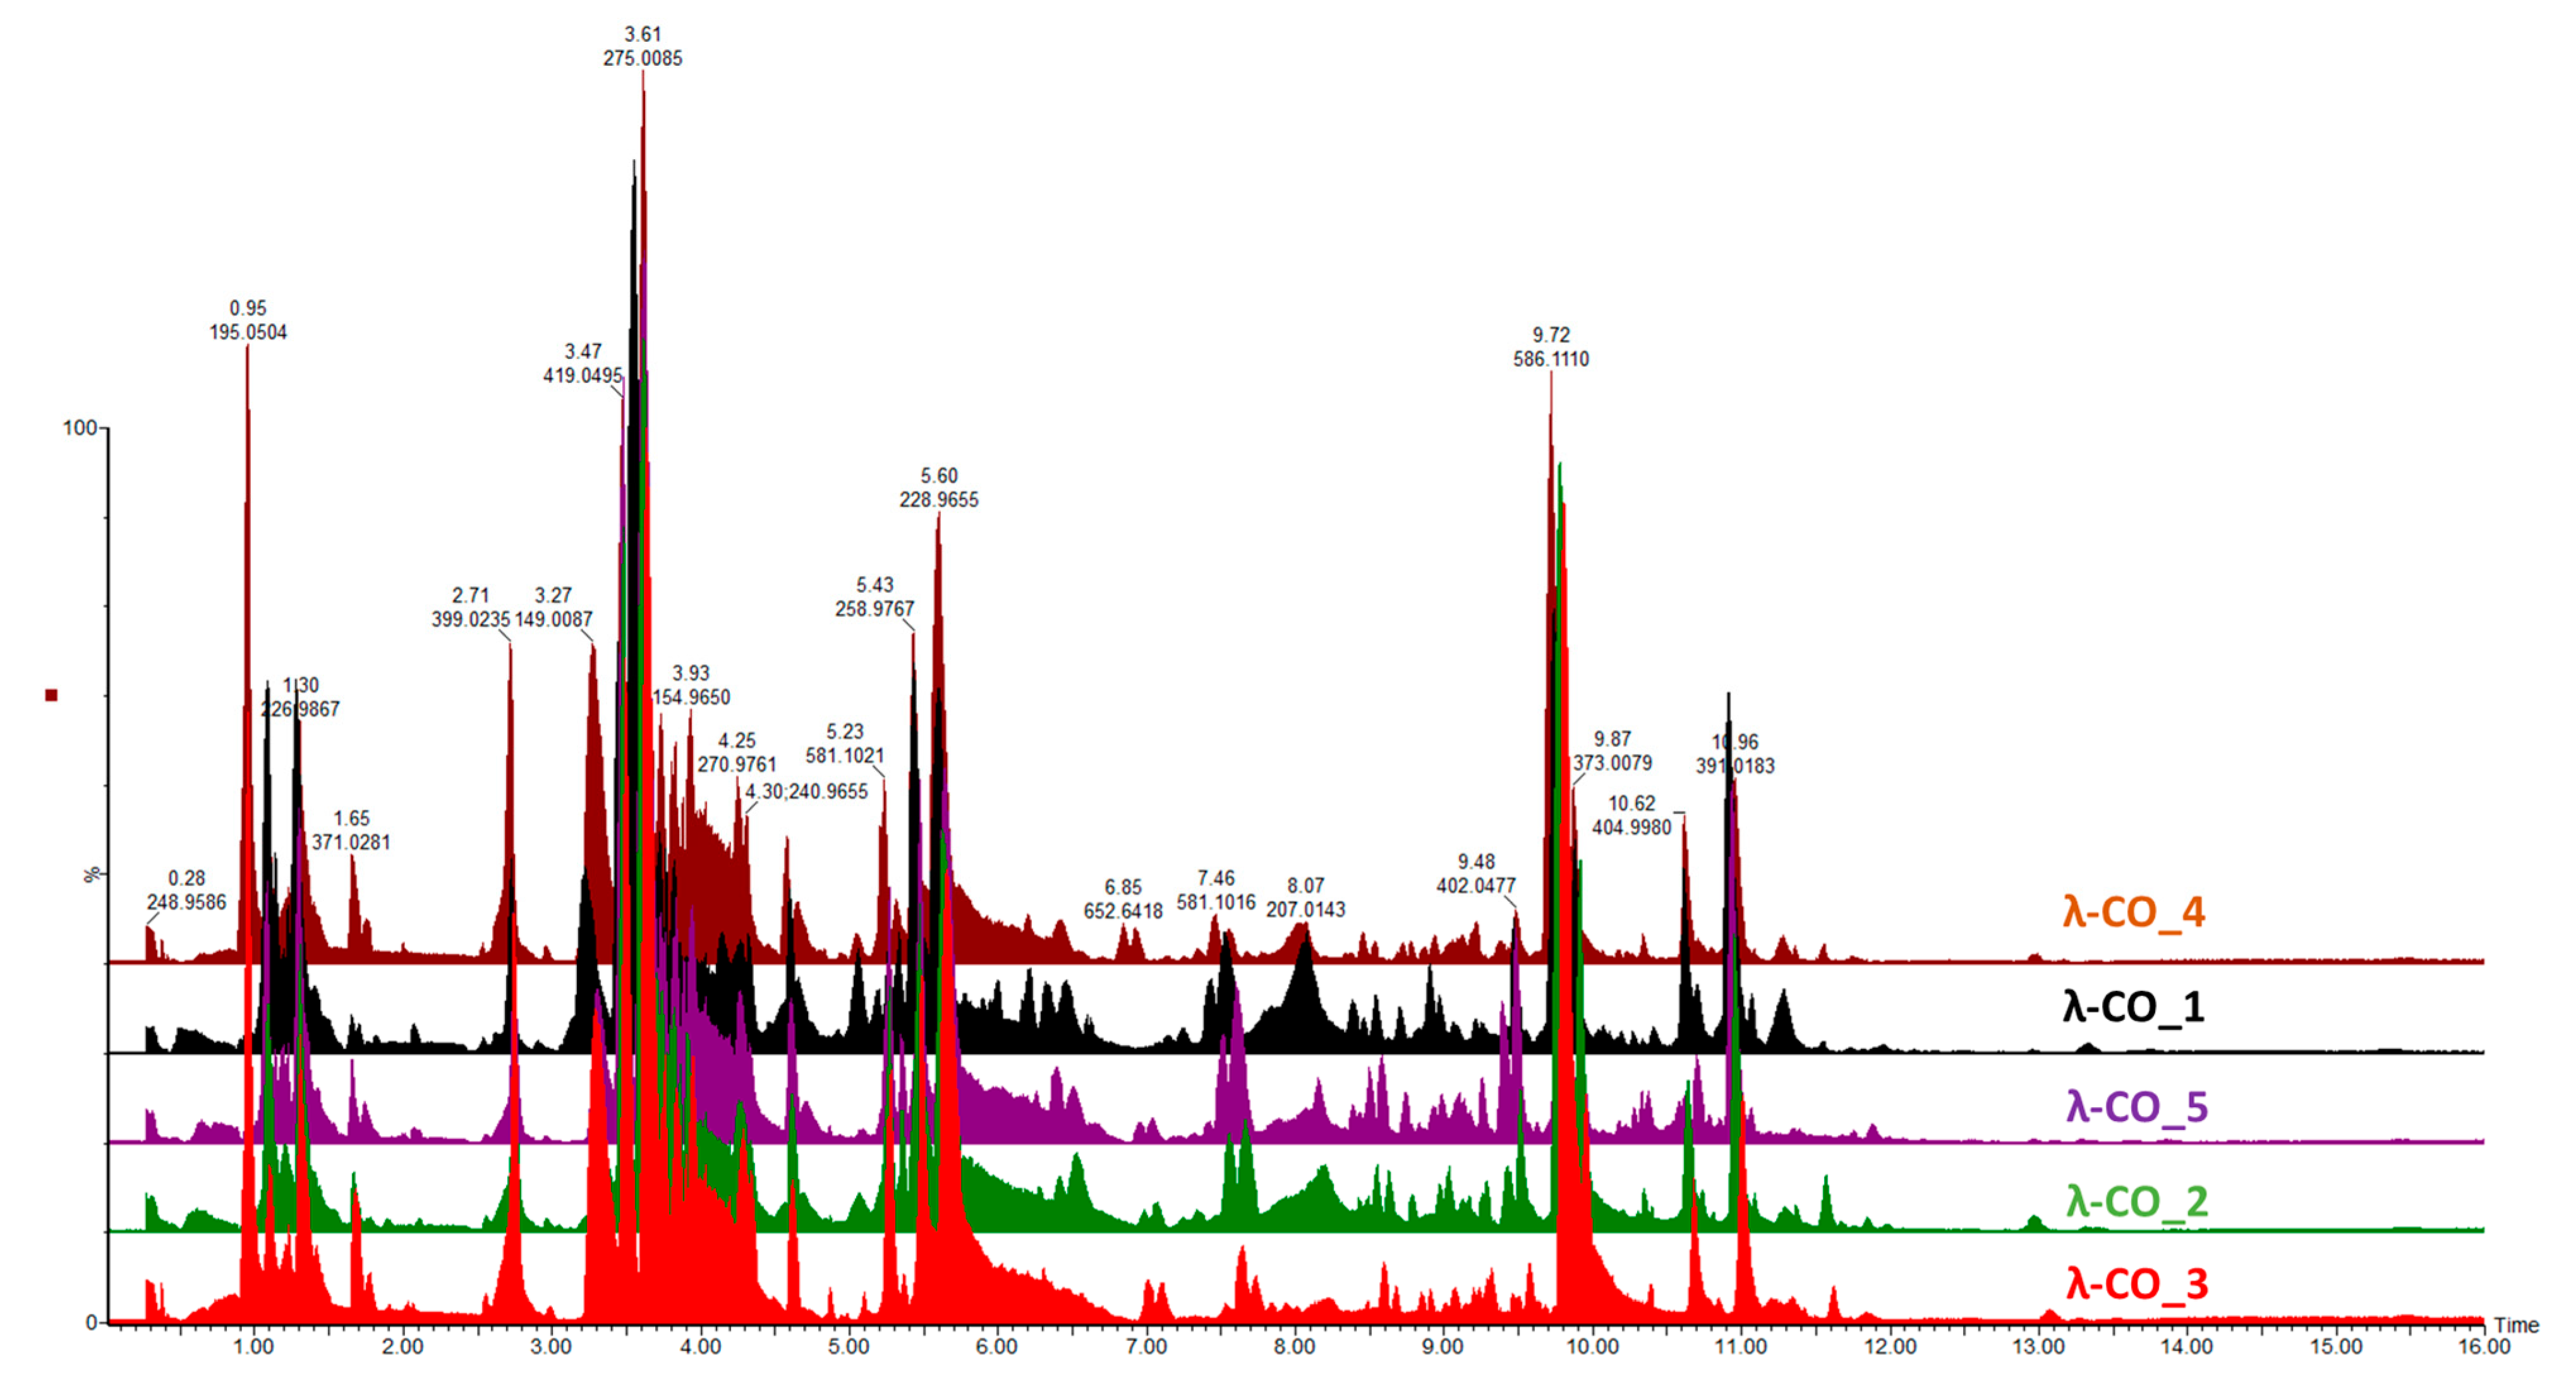
Given the previous results, it was important to go further in detecting species constituting the λ-COs formulations and to advance the understanding of their first basic structural determination. The first set of analyses performed on the commercial raw products already revealed the presence of other types of CARs (detected by FTIR) and of unknown LMW derivatives (detected by DRI signal during the HPSEC-MALS analyses). An UHPLC-MS analysis was first performed on a λ-CO from each supplier (see selected candidates,
Appendix A,
Table A3) using an ion-coupled reversed-phase C18 column (heptyl ammonium formate- RPIR) coupled to an ESI q-TOF MS in negative polarity. Qualitative differences were detected between the ionized species on the chromatograms (
Figure 4). Due to the complexity of the formulations, enhanced by the sensibility of the analysis to detect even traces of exogenous contaminations, special attention was paid to typical markers likely to be found in the composition (galactopyranose sequences, anhydro-bridge indicating different CAR types, and altered products due to the H
2O
2 reactivity,
Supplementary Materials, Table S1). By comparing up to 35 markers, the typical λ-type sulfated-based galactopyranose sequences, including Gal(OSO
3−)-Gal, Gal(OSO
3−)-Gal-Gal(OSO
3−), Gal(OSO
3−)-Gal-Gal-(OSO
3−), or Gal(OSO
3−)-Gal (
Supplementary Materials, Table S1), were found in all the selected λ-COs. These markers were substituted with sulfate groups, confirming that the depolymerization reaction did not cause a complete desulfation for these OSs. Surprisingly, some sequences with higher sulfate substitution than expected were identified (a Gal(OSO
3−)-Gal-Gal-(OSO
3−)4 marker was found). The galactopyranose sequences detected were limited to DP3, but it is difficult to know if it is related to the depolymerization reaction, the MS analysis condition (lack of ionization of species of higher DP), or the fragmentation in the source because of highly unstable moieties. The presence of other types of CARs, with the detection of markers comprising anhydrobridge—for instance, Gal(OSO
3−)-Gal-AnGal and Gal(OSO
3−)-Gal-AnGal-(OSO
3−)—was confirmed. In all the formulations, the presence of more complex, strongly oxidized, or modified species, such as lactone chemical groups or galactonic acid or destructured polyols was also detected (
Supplementary Materials, Table S1). Such by-products are often present when the H
2O
2 depolymerization method is used, due to the high reactivity of the reagent that modifies the sugar backbones [
60]. Furthermore, this confirms the previous results of the quantification of the reducing sugar ends that suggested structural changes at the reducing ends.
To support these data, a
1H NMR (500 MHz) analysis in D
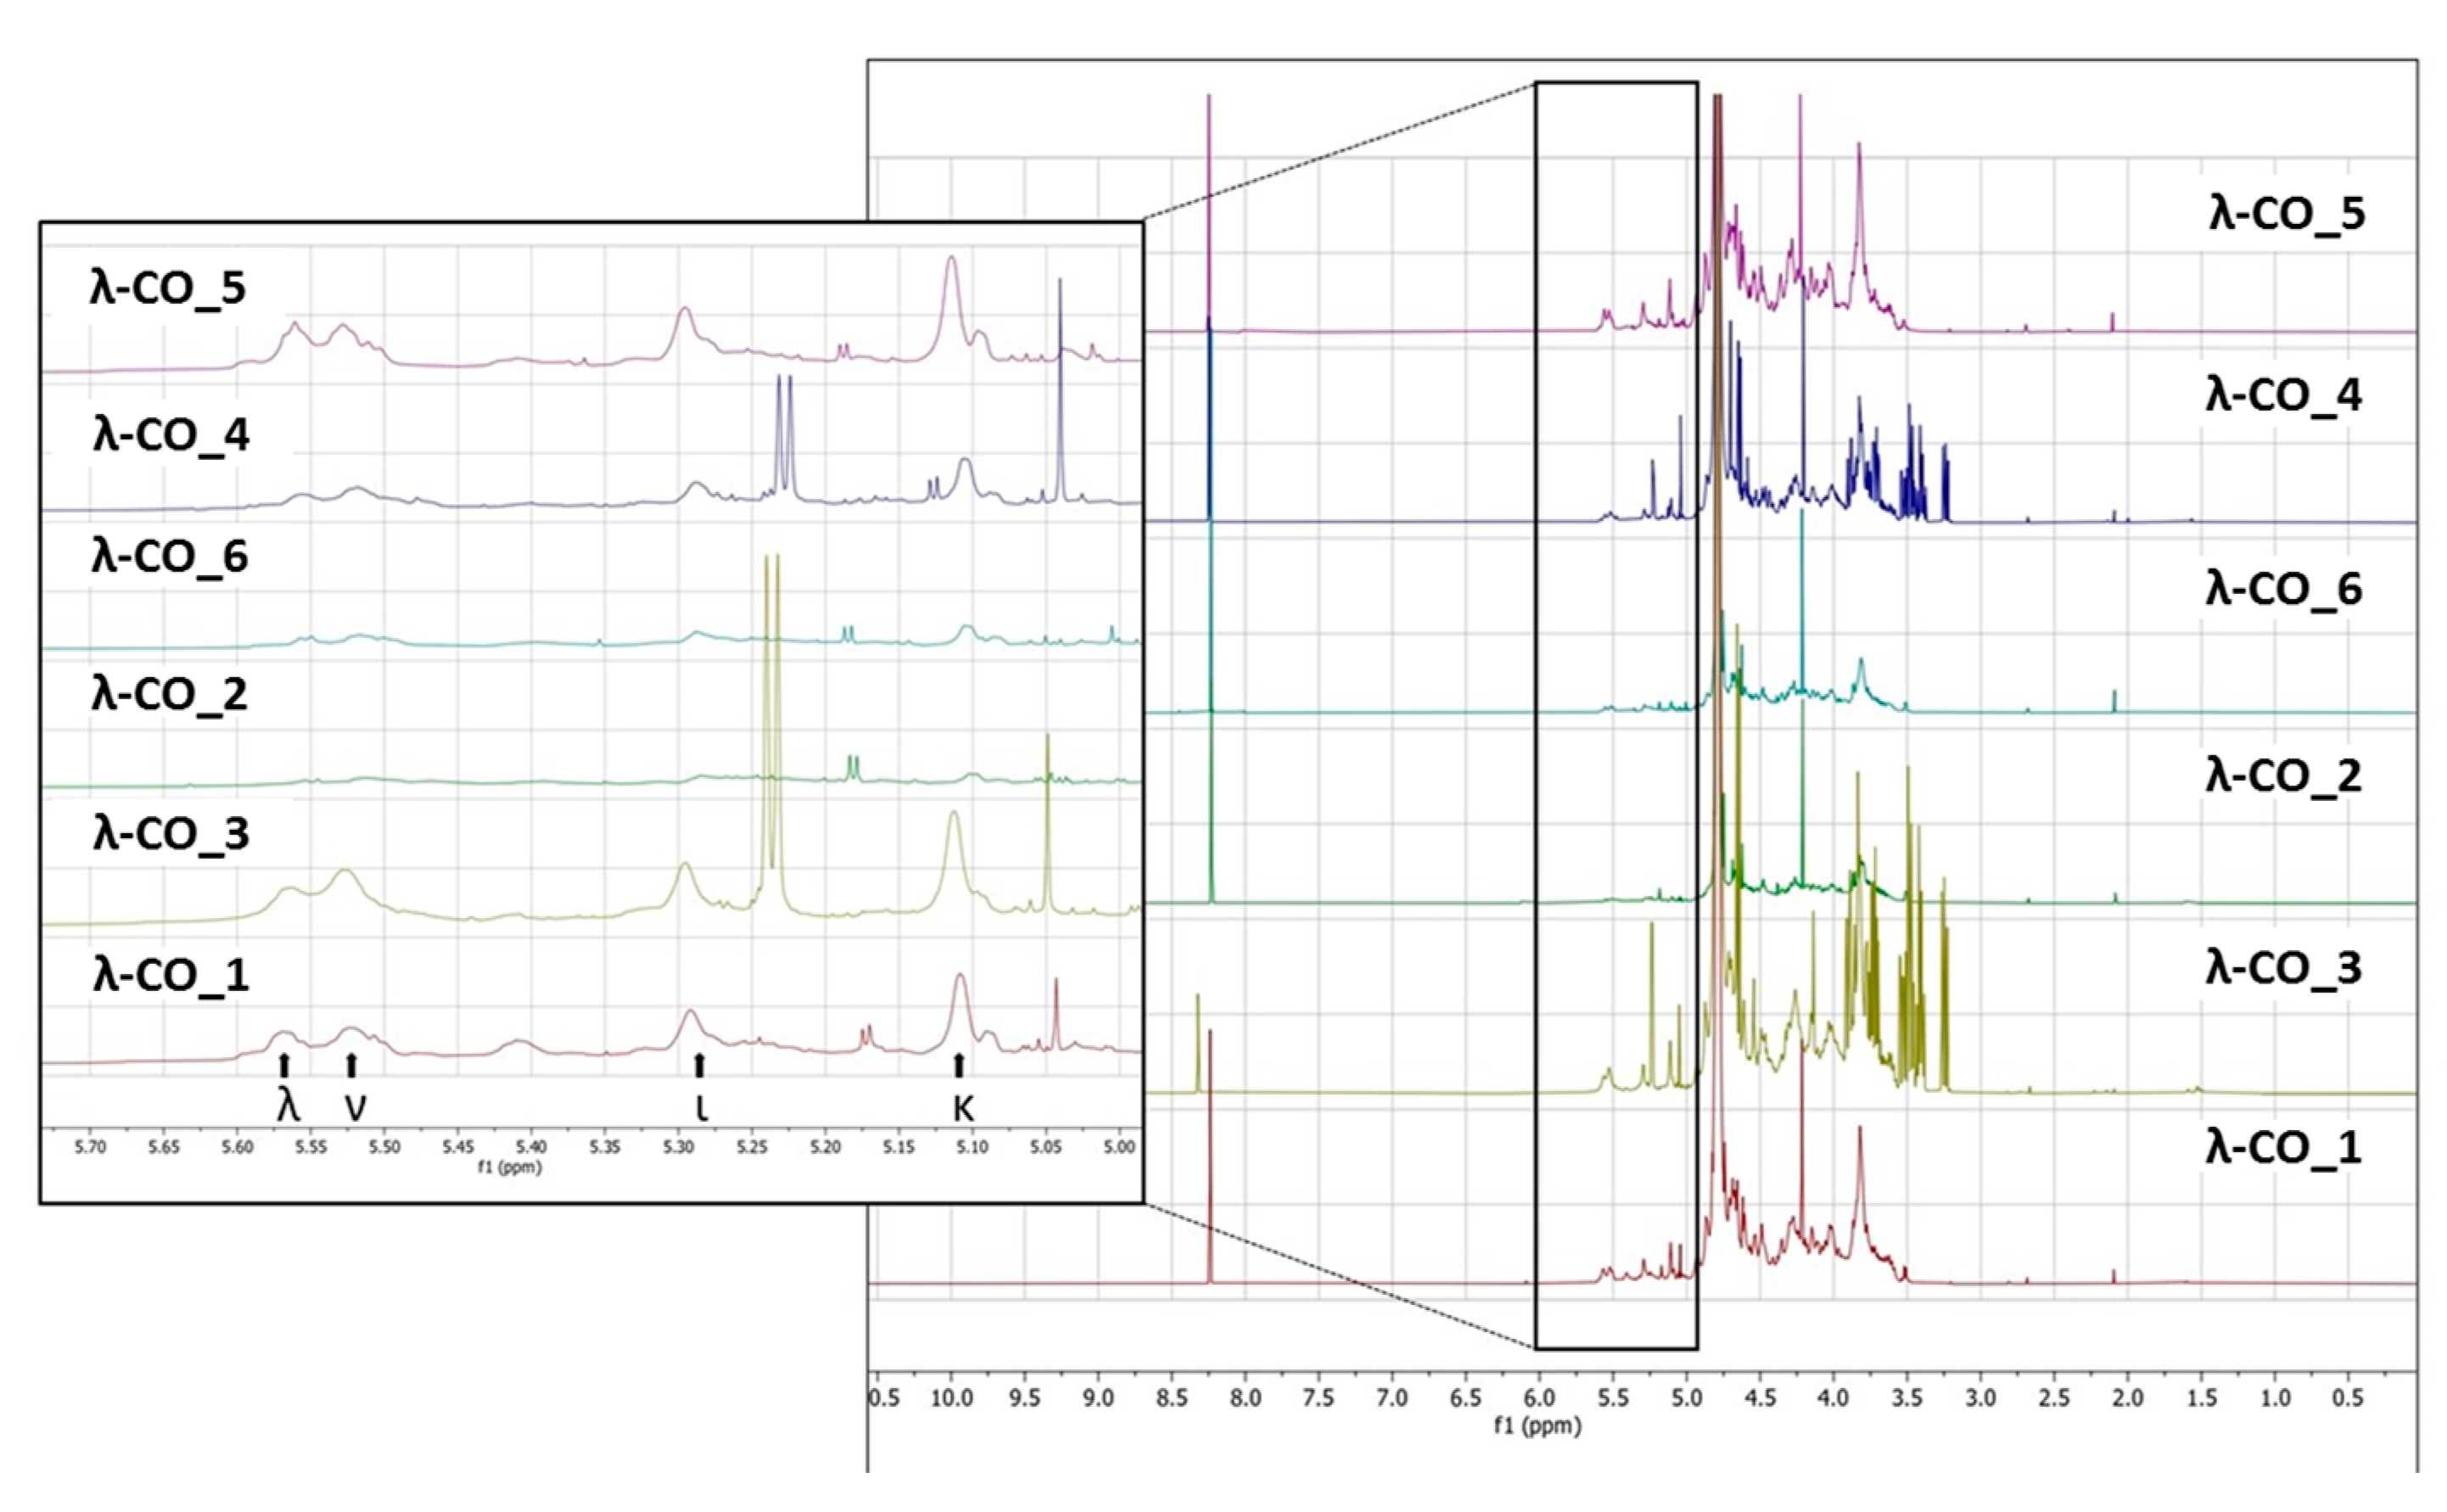
2O of a selected λ-CO from each supplier was performed. Interestingly, notable differences were detected in the different spectra (
Figure 5). In particular, it was clearly observed in the region at 3.6–3.2 ppm that the λ-CO from supplier_3 and supplier_4 contained glucose (Triplet at 3.2 ppm attributed to the H
2 of glucose). The use of this additive is common in manufacturing processes to control the final viscosity of the mixture [
58]. The ratio of glucose/CARs was estimated by semi-quantification for both suppliers, and these formulations were estimated to contain about 25% of glucose. Again, this observation reinforced several results presented before. Indeed, this can explain why these two commercial λ-CARs have a lower DS compared with the others, and the particularly strong intensities of the additional peaks that correspond to LMW species, detected by DRI on the chromatograms. It also confirmed the results obtained with the quantification of reducing ends that showed an unexpected amount of reducing sugars at the beginning of the λ-CARs depolymerization from these two suppliers. Moreover, it seems that the presence of glucose can reduce the kinetics of the depolymerization at the early stages of the reaction. This could be explained by a possible interaction with the depolymerizing agent. To confirm this, we performed a hydrolysis on λ-CARs from a supplier where we did not detect glucose, with and without the artificial addition of glucose in the solution. However, in this case, a slowdown of the reaction’s kinetics was not obtained (data not shown). A more detailed analysis revealed that all formulations contained the other various usual CAR types in addition to the λ-type, confirming the results of the FTIR analysis. The region 5.7–5.0 ppm is crucial to determine the proportion of each type of CARs by
1H NMR (inset in
Figure 5) because it corresponds to the anomeric Hα of the D unit with different shielding, depending on the sulfate substitution and anydro-bridge of each type of CARs [
58,
61,
62]. The lowest peaks at 5.55 and 5.52 ppm correspond to λ and ν CARs, respectively, due to the sulfate groups on C
2 and C
6. The peaks at 5.29 and 5.11 ppm correspond to the ι and κ CARs, respectively, which are less deshielded due to the anhydro-bridge on C
3-C
6 and, for κ, due to the presence of the OH group on C
2. A semi-quantification was then performed to determine the proportion of each type of CARs (
Table 5). The mixtures from supplier_4 and supplier_5 contained the lowest proportion of λ-type with only ~17%, while the mixture from supplier_6 contained the highest proportion with 23%. Moreover, in the products from supplier_2 and supplier_6, the ν-type, which is very close to the λ structure, was the most represented, whereas the κ type predominated in the four other products. It must be noted that the analysis does not differentiate if κ/ι types correspond to hybrid or single species.
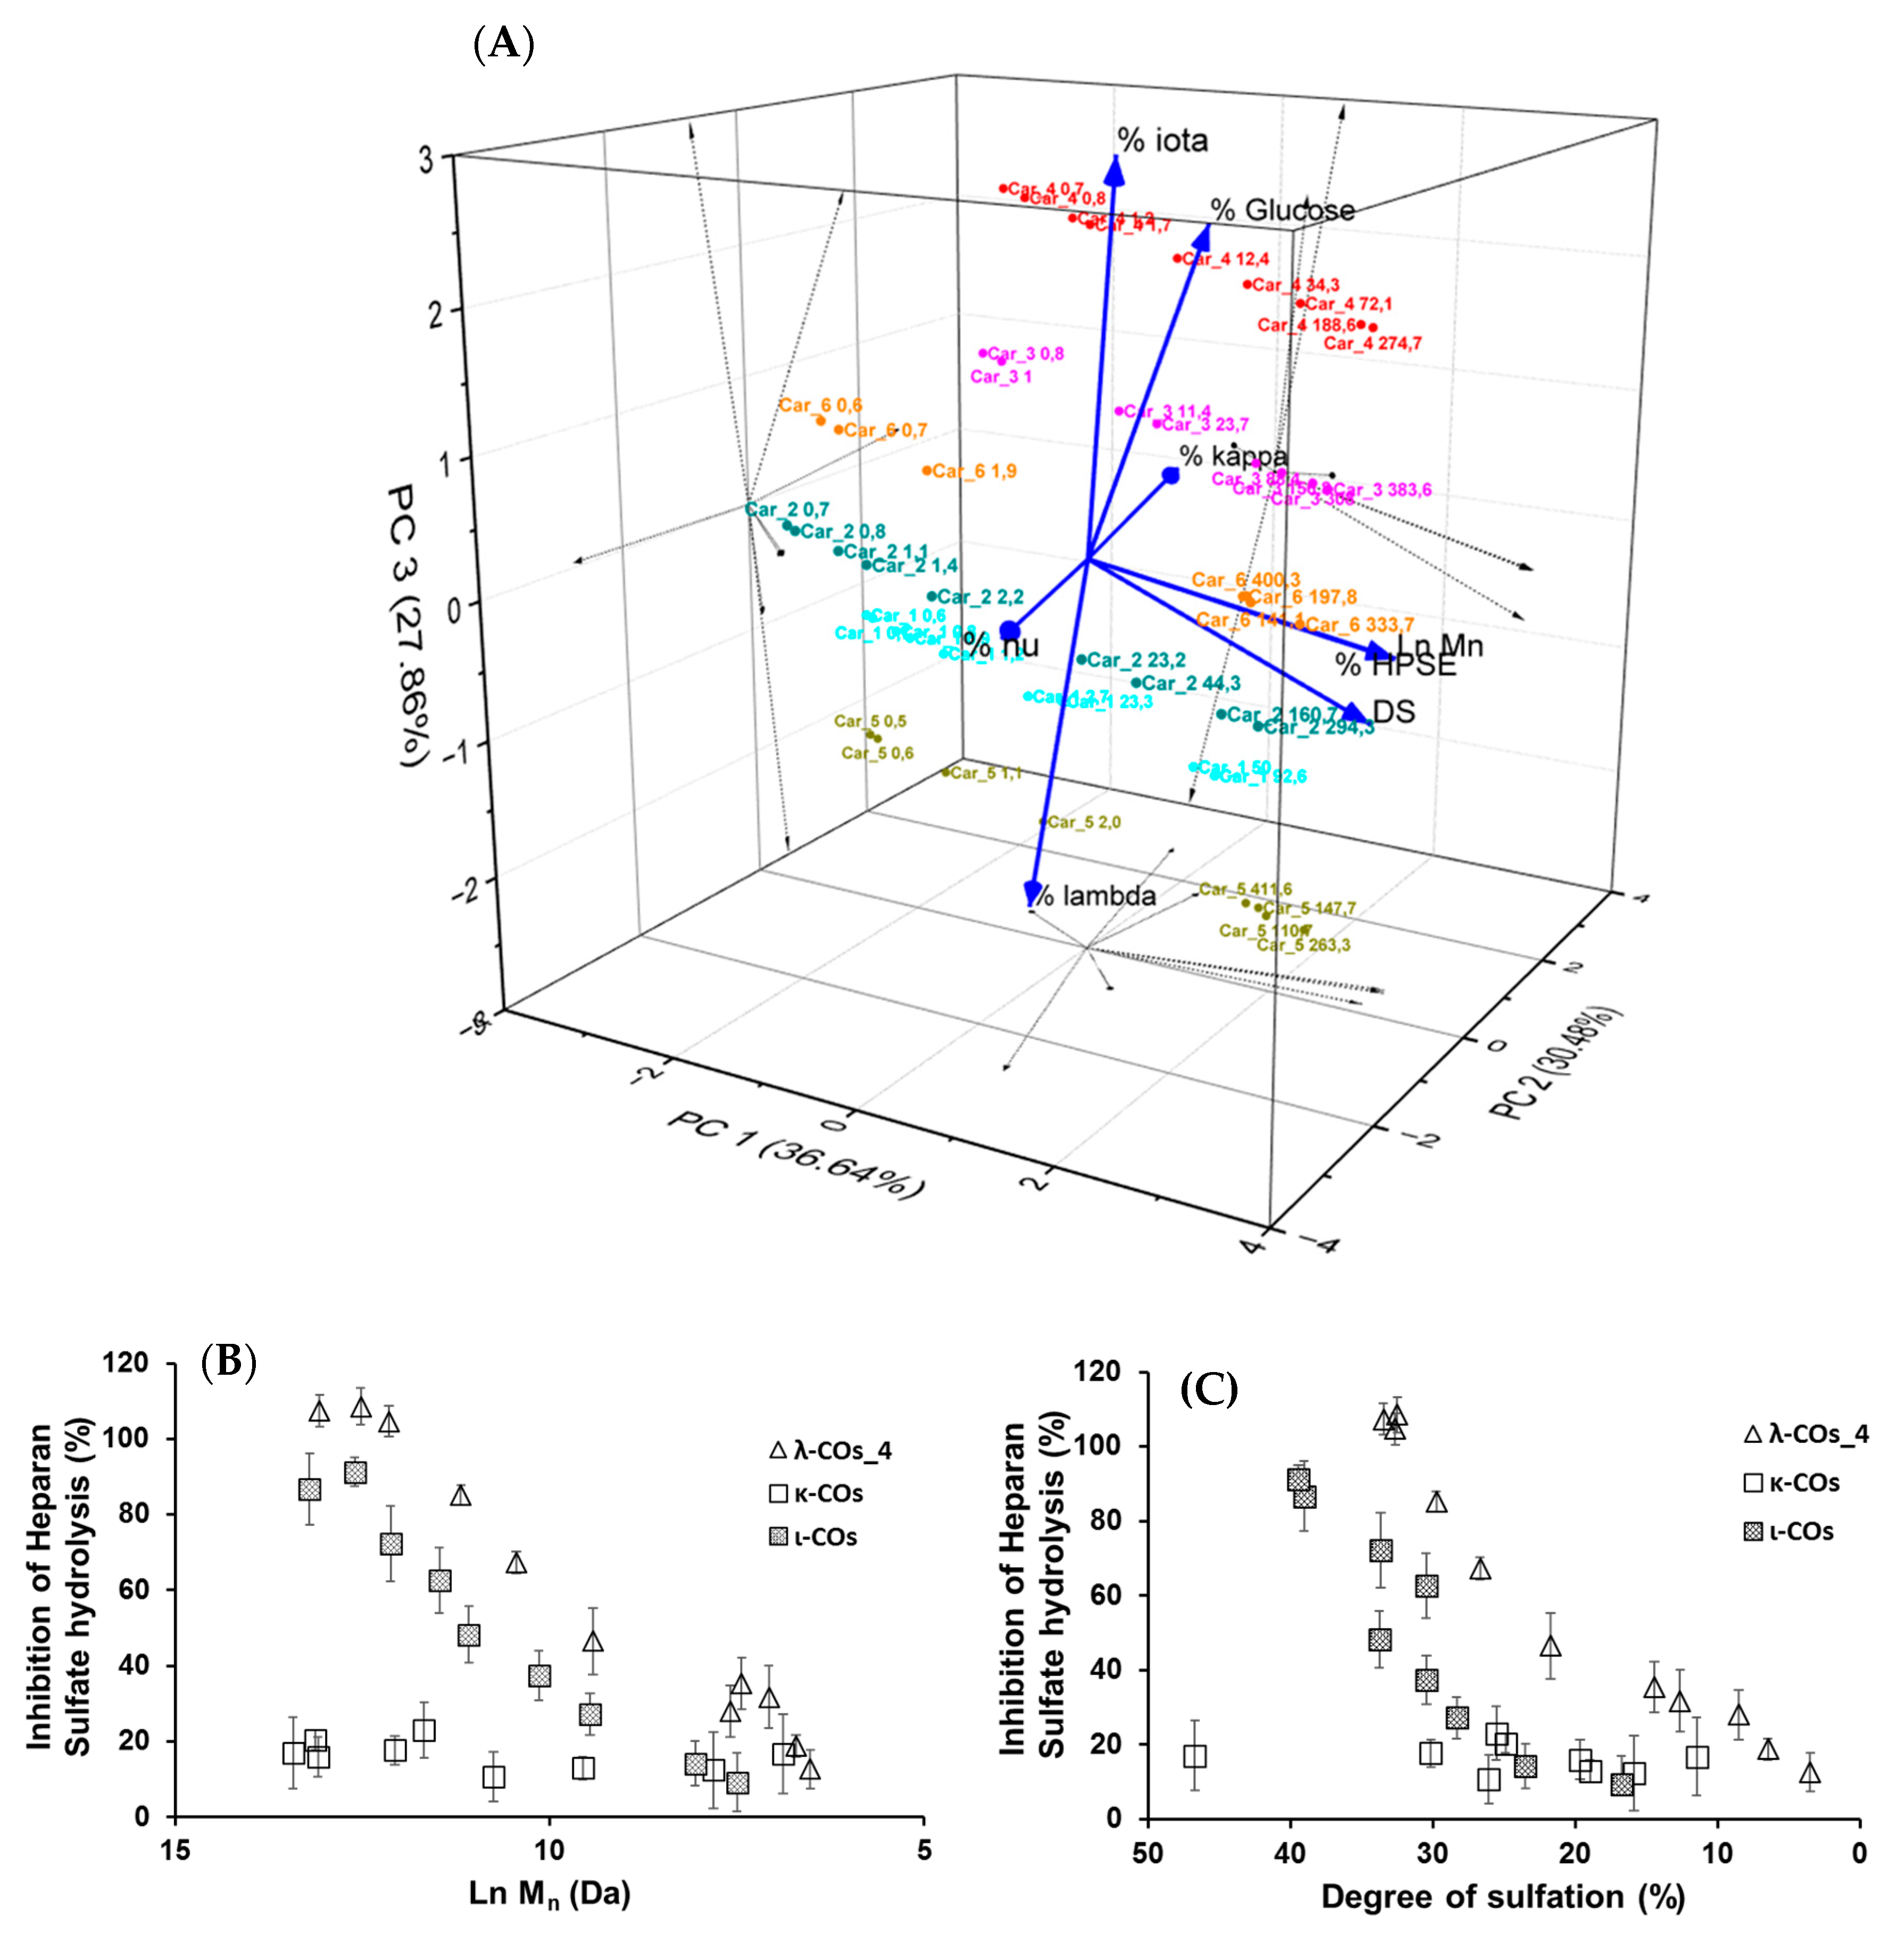
Based on these results, it was hypothesized that the presence of glucose and the proportion of the different types of CARs in the different formulations could explain the variations in HPSE activity inhibition between the products from different suppliers. In an attempt to complete the picture, a multivariate principal component analysis of all parameters was performed. Results indicated that three principal components with close Eigen-values were needed to capture 95% of the variance: PC1 (2.929, 36.6%), PC2 (2.439, 30.5%), and PC3 (2.228, 27.9%) (
Figure 6A). As expected, the M
n and DS were identified as the main drivers of HPSE activity inhibition with a very good correlation, and their variance was almost entirely integrated into PC1. Second, the λ-COs could be classified into groups corresponding to their initial supplier. The presence of glucose drew logically the λ-COs from supplier_4 and supplier_3 groups in the PC2/PC3 axis, which were further subdivided according to the proportion of ι (variance mainly in PC3) and κ (variance mainly in PC2) types, respectively. The proportion of ν-type appeared to be an important input to distinguish the λ-COs from supplier _6 and supplier_2 groups in the PC2 axis, while the variance in the proportion of λ-type was mainly included in PC3 to differentiate λ-COs from supplier_1 and supplier_5 groups. It is interesting to note these two opposites pairs of correlation, i.e., % of κ-type vs% of ν-type and% of λ-type vs% of ι-type. Indeed, strong Pearson correlations were observed (
Appendix A,
Table A4), i.e., −0.979 and −0.913 (
p-values < 1 × 10
−5). This is consistent with the fact that mu (μ) and ν-types are the precursors of κ/ι types and are converted into these types after alkaline treatment. On the other hand, the κ/ι types are also inversely correlated to the λ type, depending on the proportion of tetrasporophyte/gametophyte forms (from which they are extracted) collected to prepare the crude samples. Finally, it was also observed that glucose was added to the two samples that contained the highest level of κ/ι gelling CARs compared with non-gelling CARs (μ, ν, and λ). In fact, these additives are precisely added to balance and standardize the viscosity of the final product.
Subsequently, the impact of variation in the composition of CAR types from different suppliers on the anti-HPSE activity was considered. First, the λ-type was the only one that weakly correlated with both axes that contained the minor variance in HPSE activity, i.e., PC2 and PC3 (
Figure 6A and
Appendix A,
Table A4). However, these contributions were masked in this analysis by the predominant input of the M
n and DS. Therefore, we tried to replace these parameters with their respective coefficients (shown in
Table 3) that described the general trend for the selected λ-CO from each supplier, and then to assess a possible Pearson correlation. No conclusive results were found, although a trend indicated that higher Ln (M
n) coefficients were associated with a higher proportion of ν-type and a low proportion of κ-type (data not shown).
We still assumed that the proportion of the different types of CARs could represent a minor parameter with respect to the ability to inhibit the HPSE activity of the different formulations. Therefore, κ-CO and ι-CO were produced in the same way as λ-Cos, and their anti-HPSE activity was monitored as a function of their M
n and DS (
Figure 6B,C). Surprisingly, the κ-CO did not show any inhibition of the HPSE activity, regardless of their M
n or DS, even those produced after a short depolymerization time, as previously shown with native κ-CAR [
63]. On the other hand, the ι-CO followed a similar trend to that of the λ-COs (decrease along with M
n and DS) but with an overall lower anti-HPSE activity. To confirm this result, IC
50 was calculated for a candidate κ-CO (M
n 2.8 kDa, DS 15.9 ± 0.1%) and a ι-CO (M
n 3.2 kDa, DS 23.0 ± 1%). The values found were 206 ± 51 µg·mL
−1 and 126 ± 25 µg·mL
−1 (
Appendix A,
Figure A6), confirming the above-mentioned behaviors for these types of CARs. Overall, we could state that the proportion of true λ-CAR-diads in the formulations will clearly determine the effectiveness of the inhibition of the HPSE activity, but through a complex balance with other parameters, such as the (relatively) favorable presence of the ι-type, but also an unnecessary contribution from the proportion of κ-type included in the mixture. This may be because λ- and ι -CARs or their LMW derivatives present higher DS than κ-CARs-based products, which is a parameter widely associated with better anti-HPSE activity for OS-based inhibitors [
41]. Two previous articles already compared the efficiency of different CAR types in inhibiting HPSE [
46,
47]. Both provided preliminary evidence that λ-CARs or their LMW derivatives show higher efficiency than the ones of κ-type, which was consistent with our findings.
2.6. Anti-Migratory Activity on Huh7 Hepatocarcinoma Cells
In regard to preliminary results obtained on the ability of λ-COs to reduce the migration of breast [
43] and liver cancer cells (data not published), we chose to check this specific hallmark of cancer cells once again. For this experiment, the Huh7 hepatocarcinoma cell model has been chosen since for this model, it has been well described that overexpressed HPSE, among other biomolecular actors, participates in their invasiveness behaviors. The aim was to know whether the anti-migratory effects of λ-COs were correlated to their anti-HPSE activities or other interacting partners, such as chemokines, and to know whether the effects also differed according to the physicochemical parameters or to the different compositions depending on the suppliers studied above [
66,
67]. In addition, this allowed to investigate if the anti-migratory effects of our λ-COs were cell model dependent compared with the results previously published on MDA-MB-231 breast cancer line [
43,
44]. The anti-migratory effect of the selected λ-COs candidates based on the M
n, DS and anti-HPSE IC
50 values previously reported as suitable for in vivo anticancer applications was tested [
43,
44], and for comparison and discussion purposes, κ-CO and ι-CO were also tested (selected candidates, see
Appendix A,
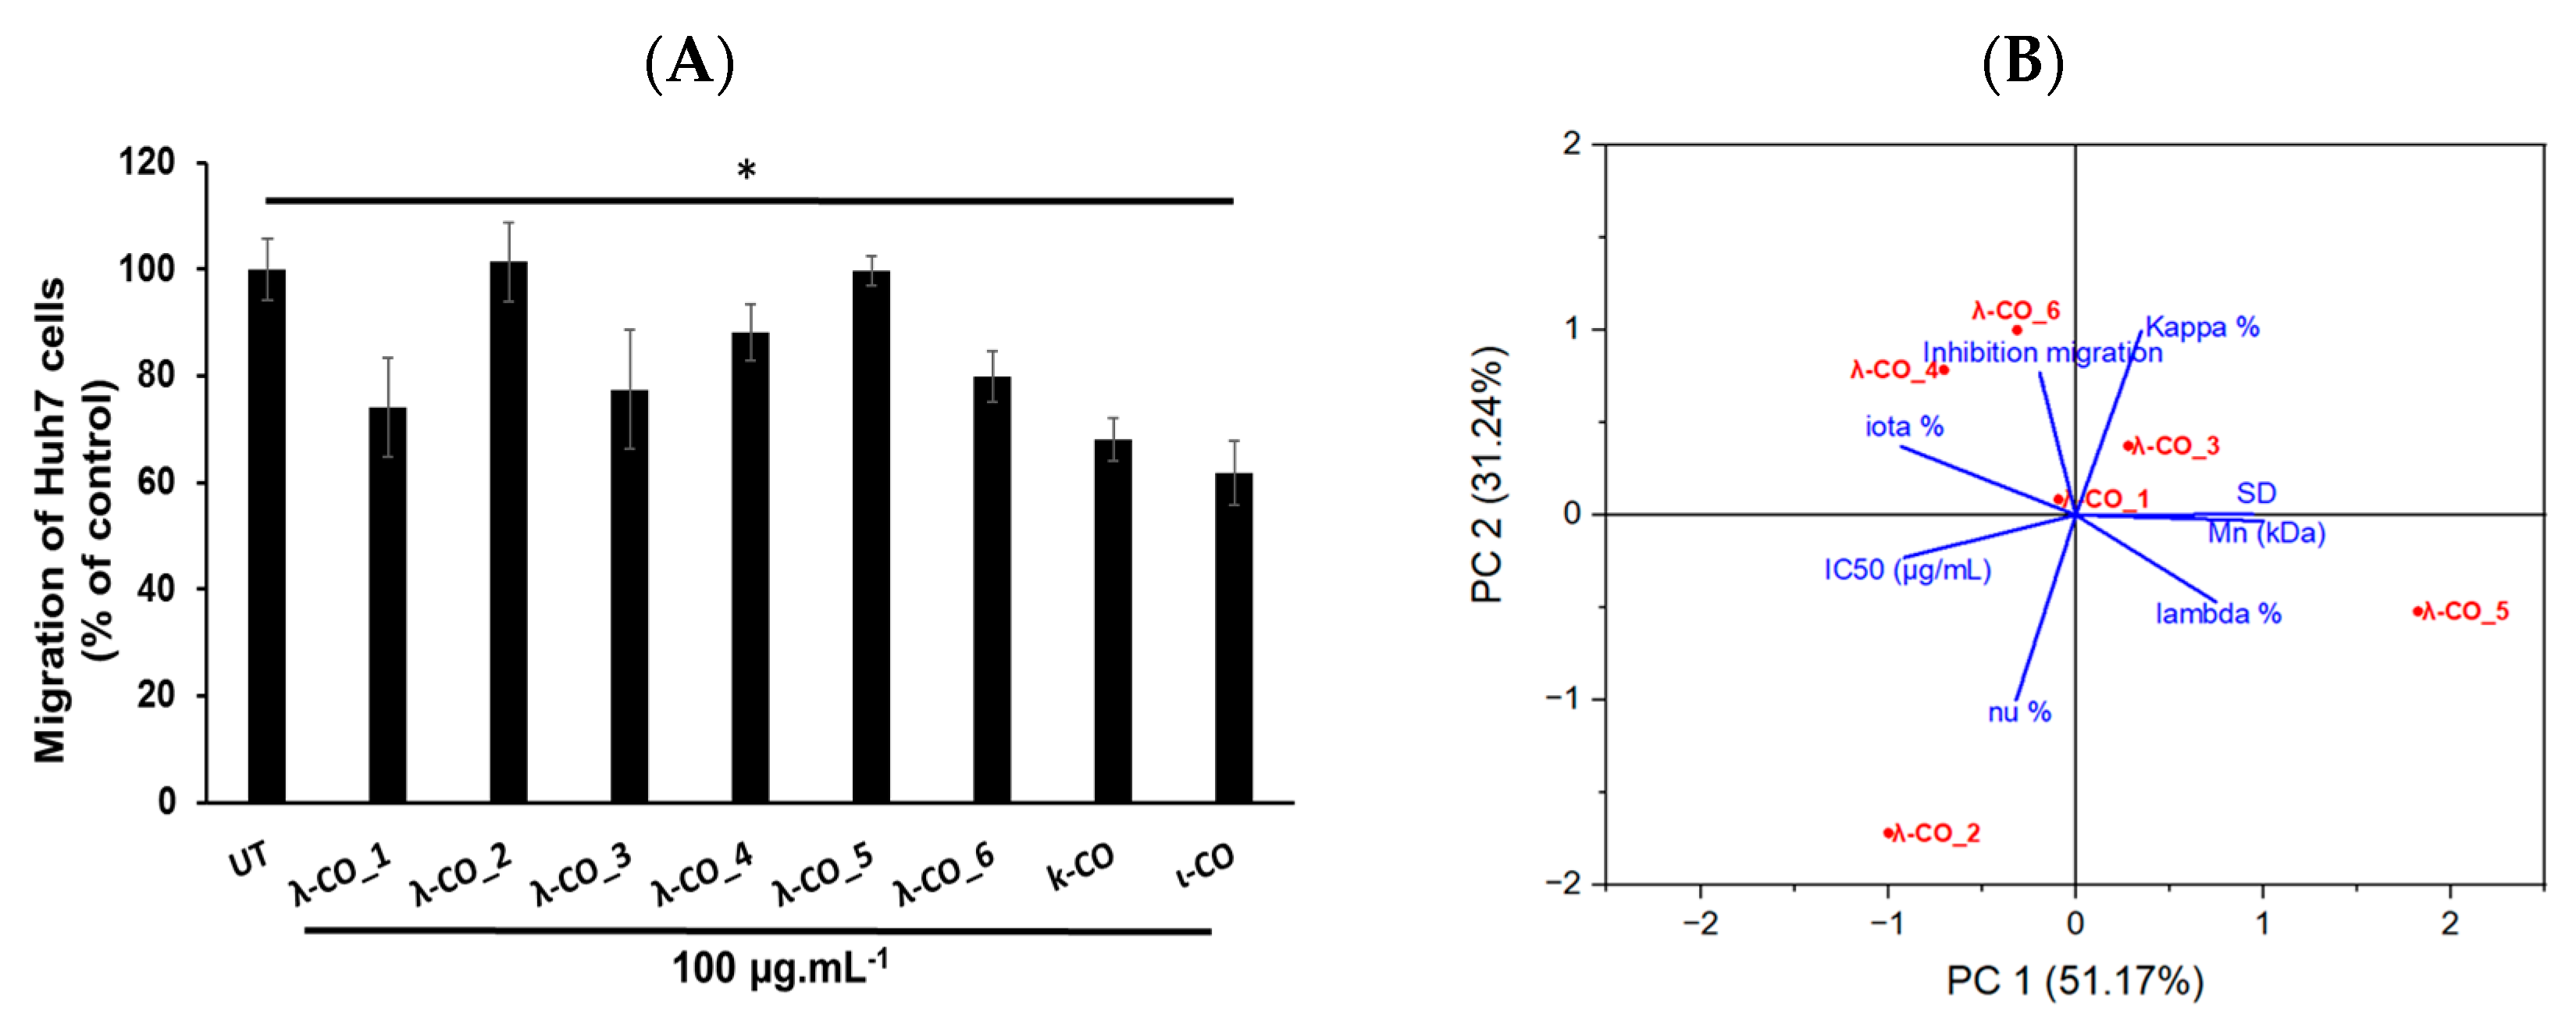
Table A3). The results showed differences in the effect of the λ-COs on Huh7 cell migration depending on their origin. The λ-CO from supplier_1 had the greatest inhibitory effect of 26%, followed by λ-CO from supplier_3 with 22%, the λ-CO from supplier_6 with 20%, and finally, the λ-CO from supplier_4 with 12%; whereas, no effect was observed when the cells were treated with the λ-COs from supplier_2 and supplier_5 (
Figure 8A).
Again, a principal component analysis to try to discriminate the parameters involved in the effective inhibition of Huh7 cells migration was performed (
Figure 8B). The two principal components accounted for 82% of the variance of the system. Interestingly, while the IC
50 of HPSE inhibition was related to an anti-migratory effect (inversely related on the graph as a small IC
50 is equivalent to strong inhibition), the presence of κ and ι types in the formulations also appeared to be an important triggering factor (
Figure 8B). Indeed, Pearson correlation between the IC
50 and the cell-migration inhibition showed only a weak relationship (data not shown). Furthermore, the strongest effects were obtained with κ-CO and ι-CO, with 32 and 38% of inhibition, respectively, confirming the previous observations. In contrast, the λ and ν types did not appear to correlate with cell migration inhibition. However, the M
n, DS, and proportion of λ-type correlated consistently with the IC
50 in PC1 (this correlation was demonstrated above), but they did not contribute to PC2, where most of the of variance regarding the migration inhibition was observed. This might be in line with other experiments made with λ-COs from supplier_1, which demonstrated that the M
n and DS did not directly correlate with the anti-migratory activity on in vitro cell models [
44]. In addition, several studies have already shown that these COs have multiple activities and could inhibit cell migration by mechanisms other than the inhibition of the HPSE activity [
30,
50]. Based on all the results, we could assume that the anti-HPSE activity of the formulations participates in the anti-migratory effect observed in cell models, although other important mechanisms of action are certainly involved, especially those related to the κ species.


 ,
, 


