

TRAF6 Inhibitors from Marine Compound Library: Pharmacophore, Virtual Screening, Fragment Replacement, ADMET, and Molecular Dynamics

Abstract
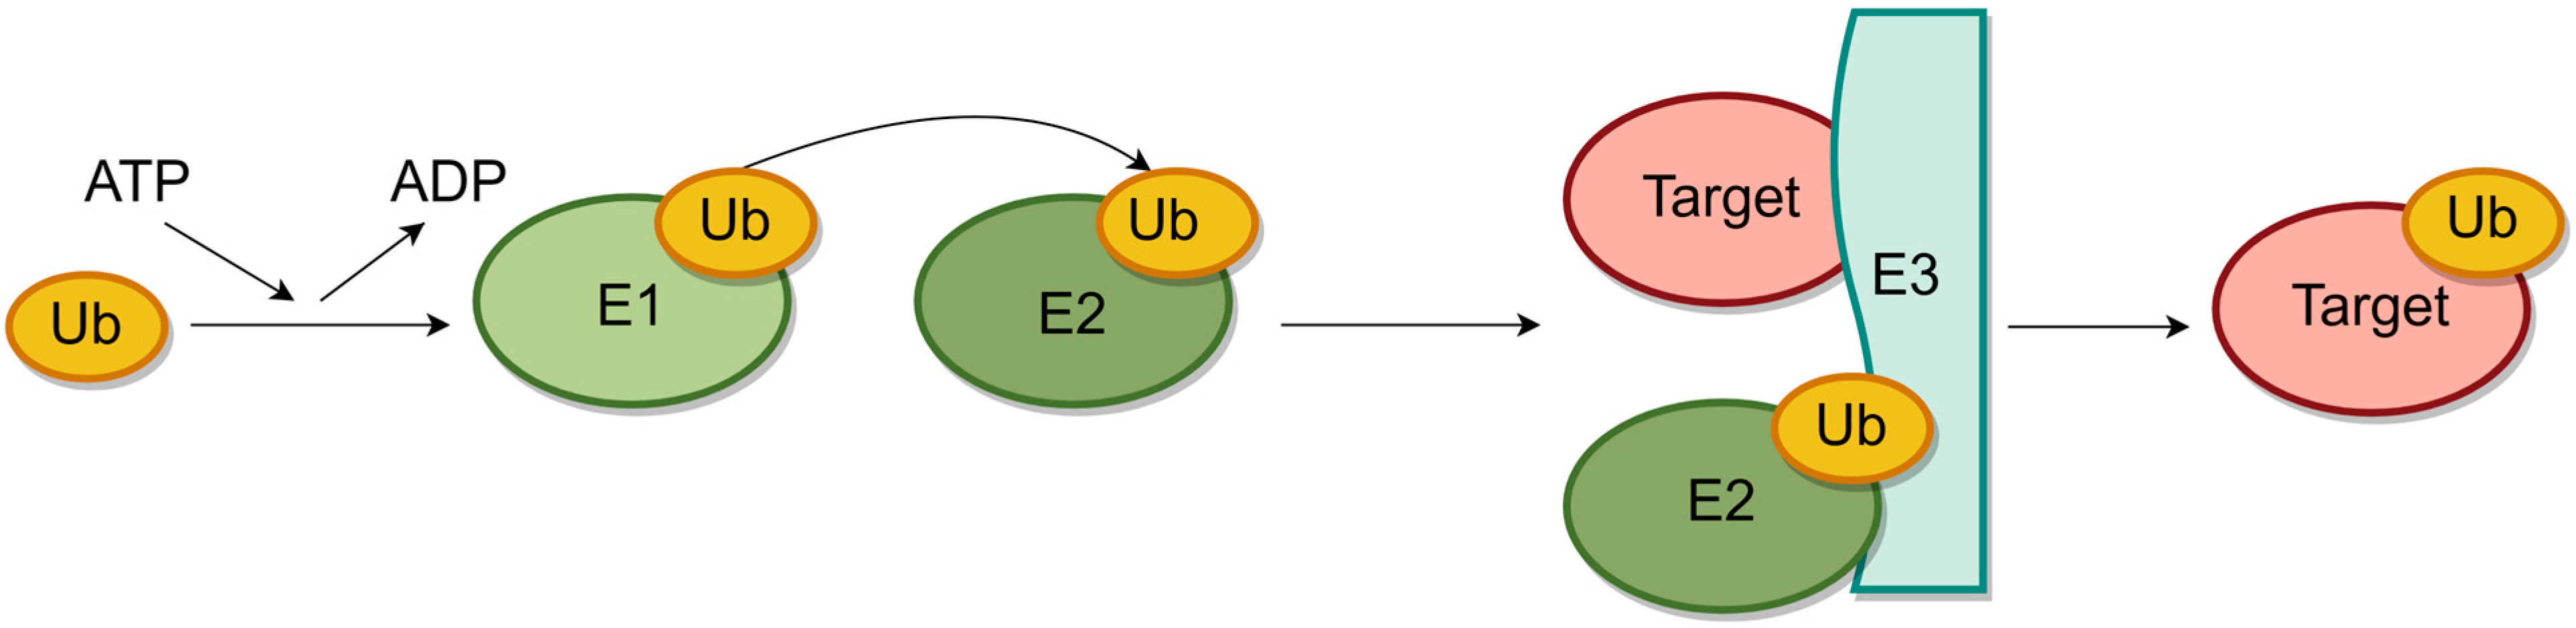
:1. Introduction
2. Results
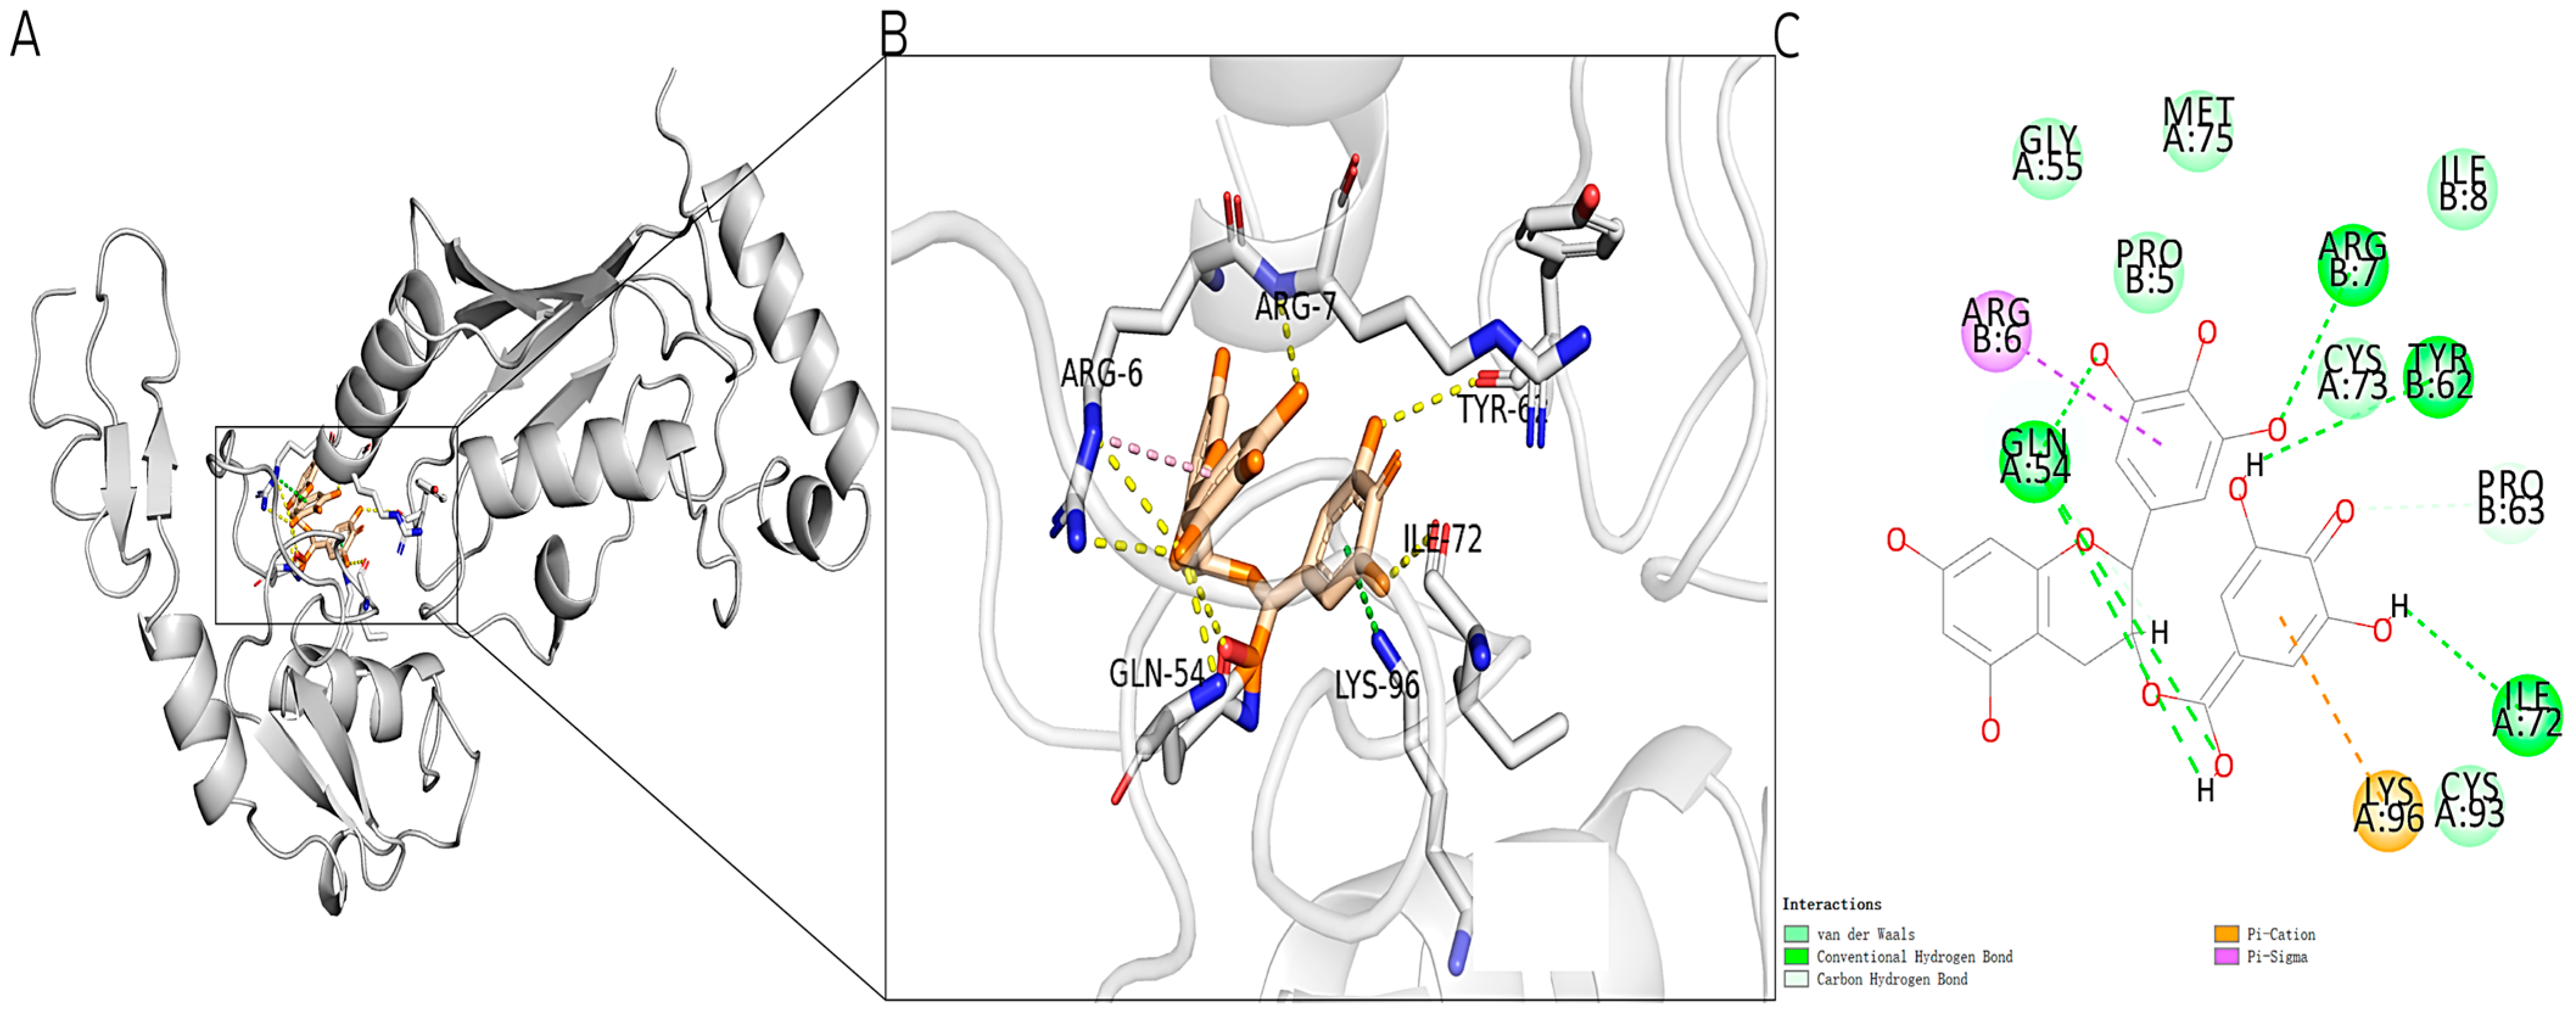
2.1. Molecular Docking of Known Inhibitors and TRAF6
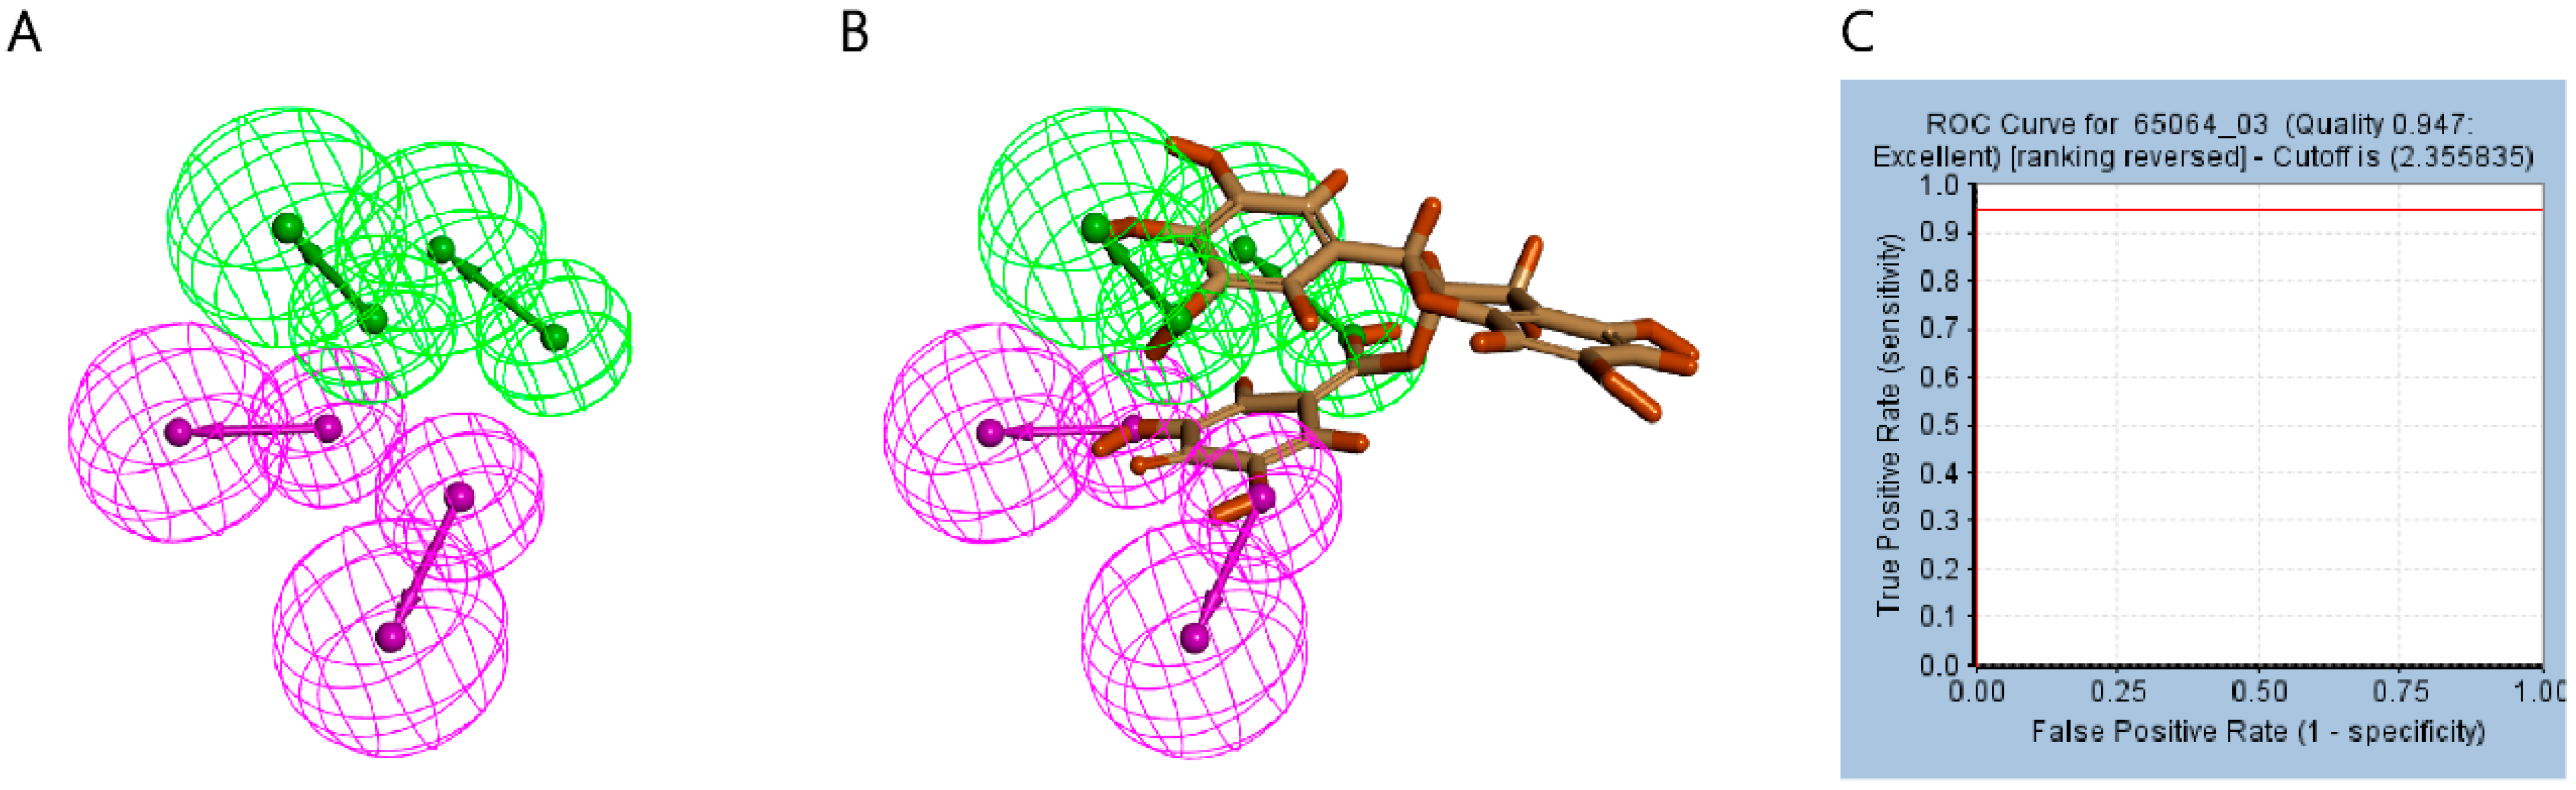
2.2. Establishment and Validation of Ligand–Receptor Complex Pharmacophore
2.3. Virtual Screening
2.4. Molecular Docking
2.5. Fragment Replacement
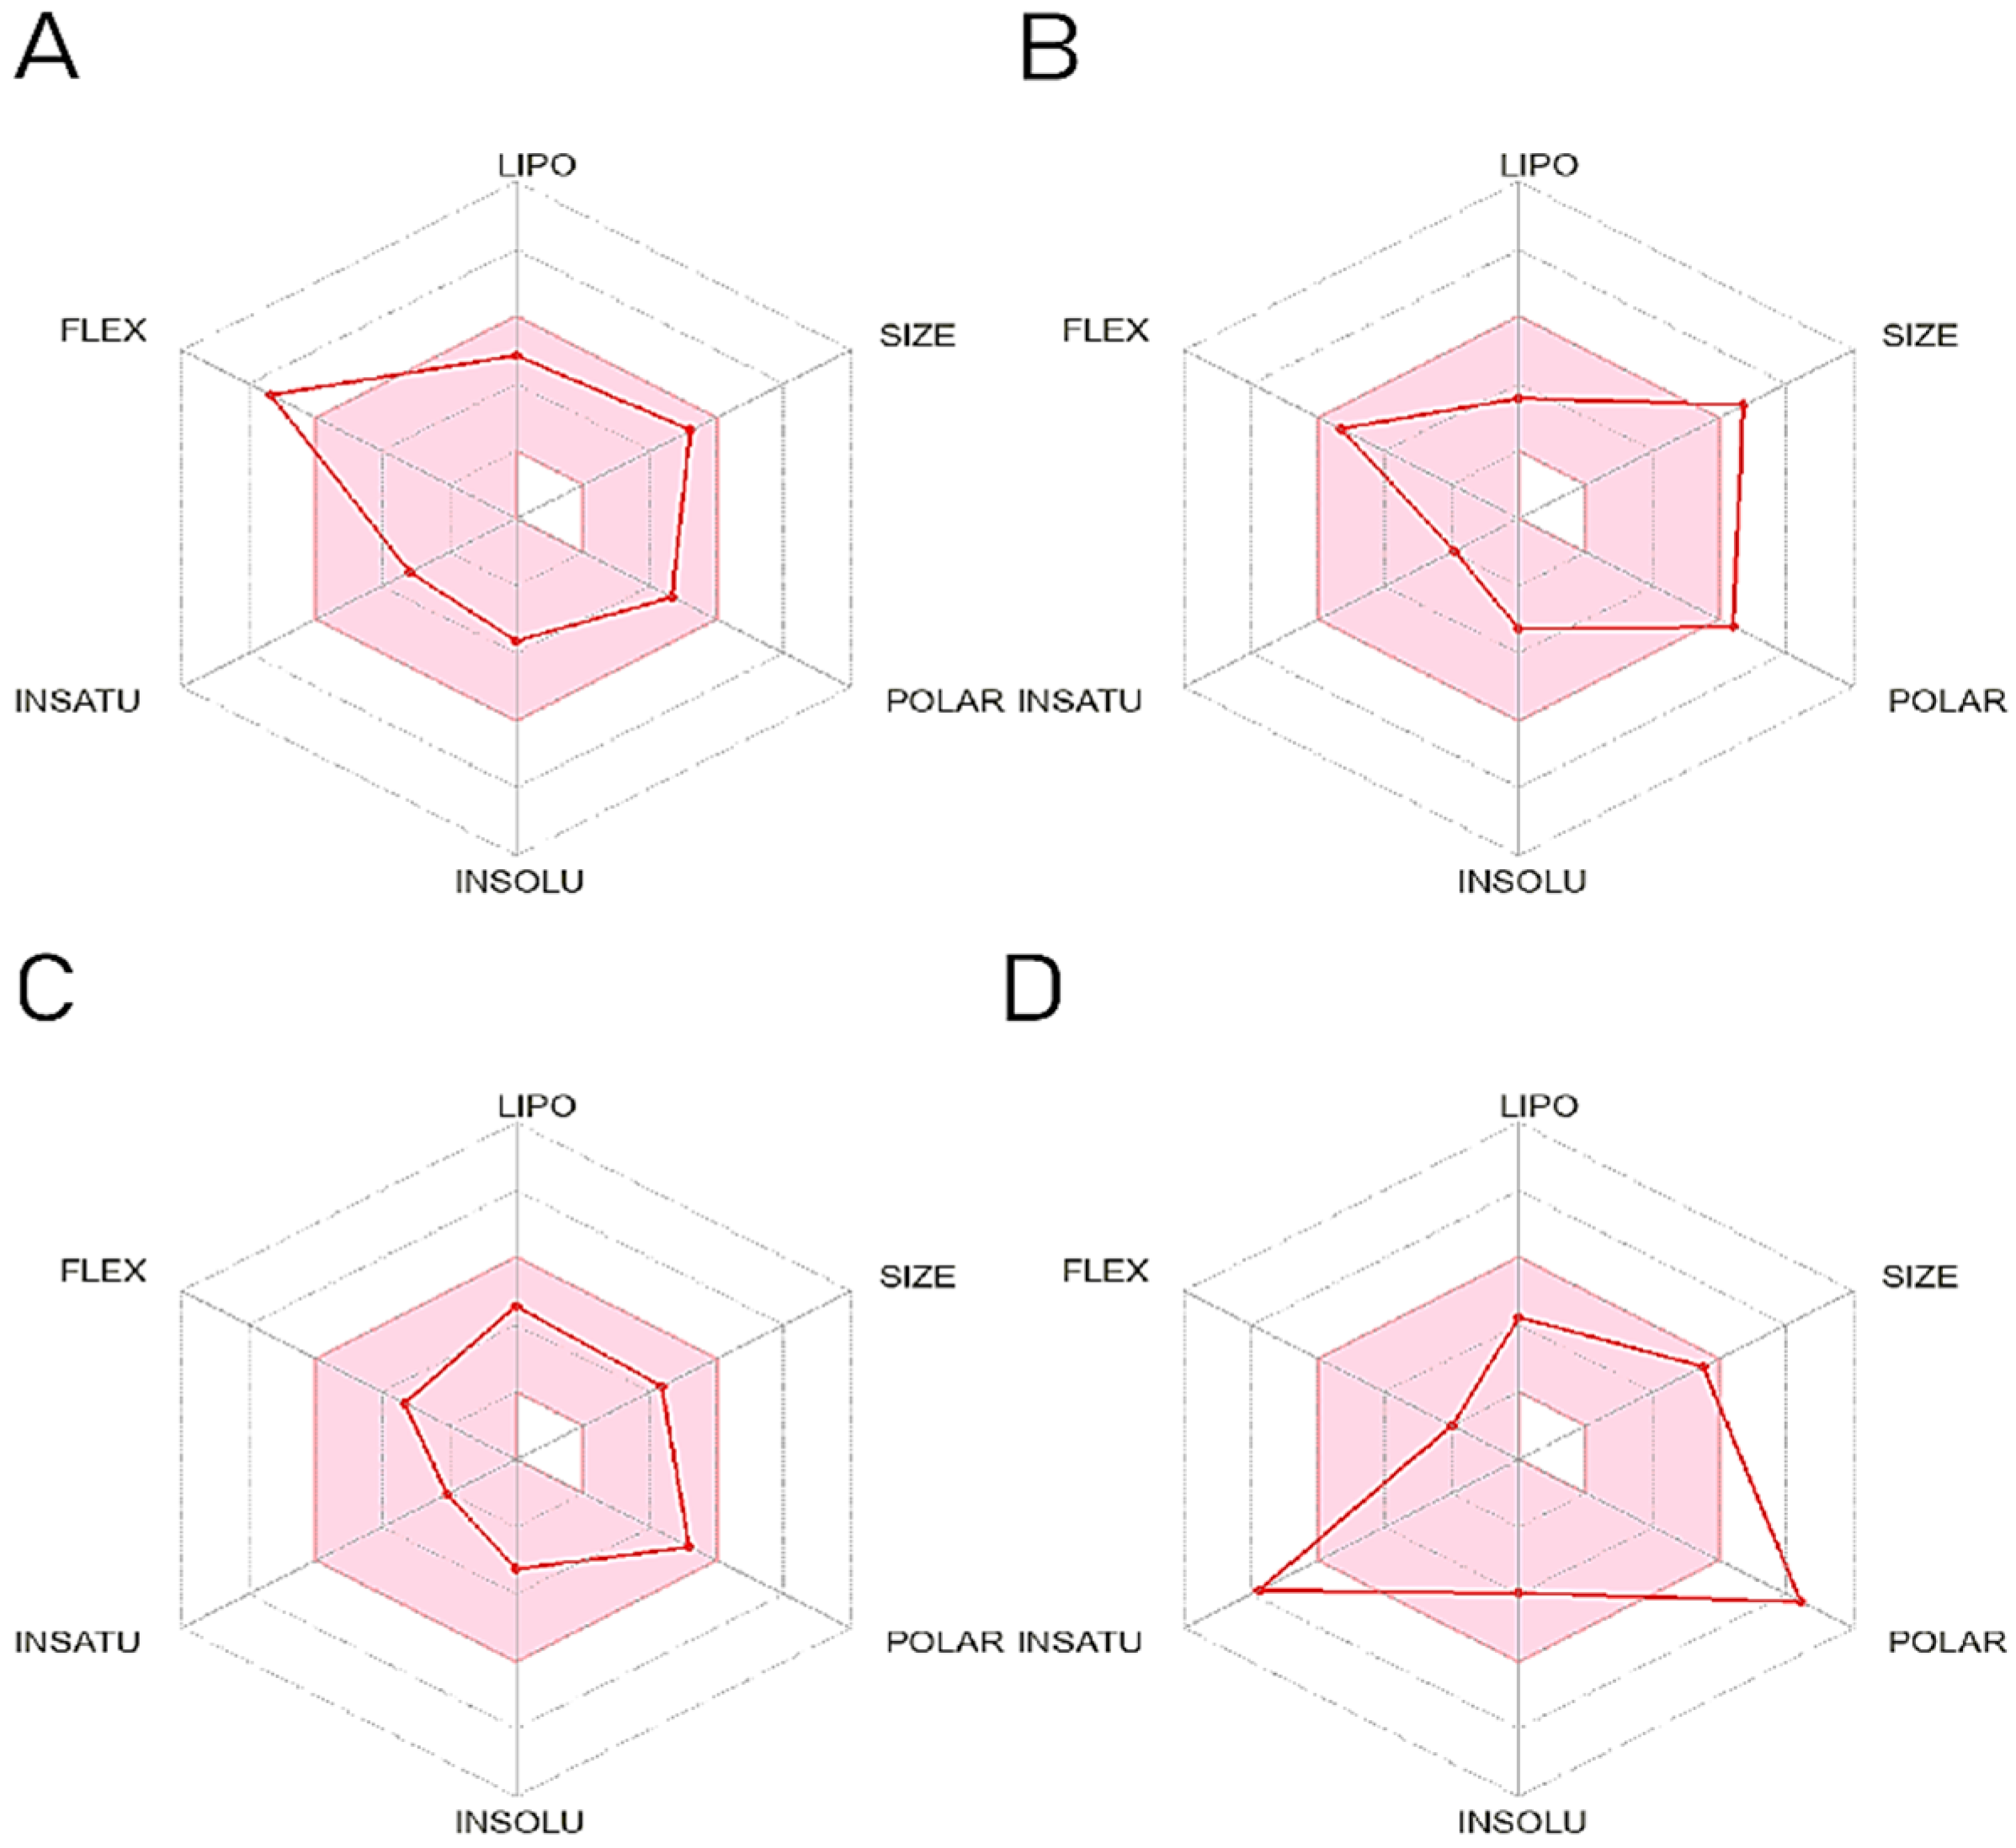
2.6. ADME Prediction
2.7. Toxicity Prediction
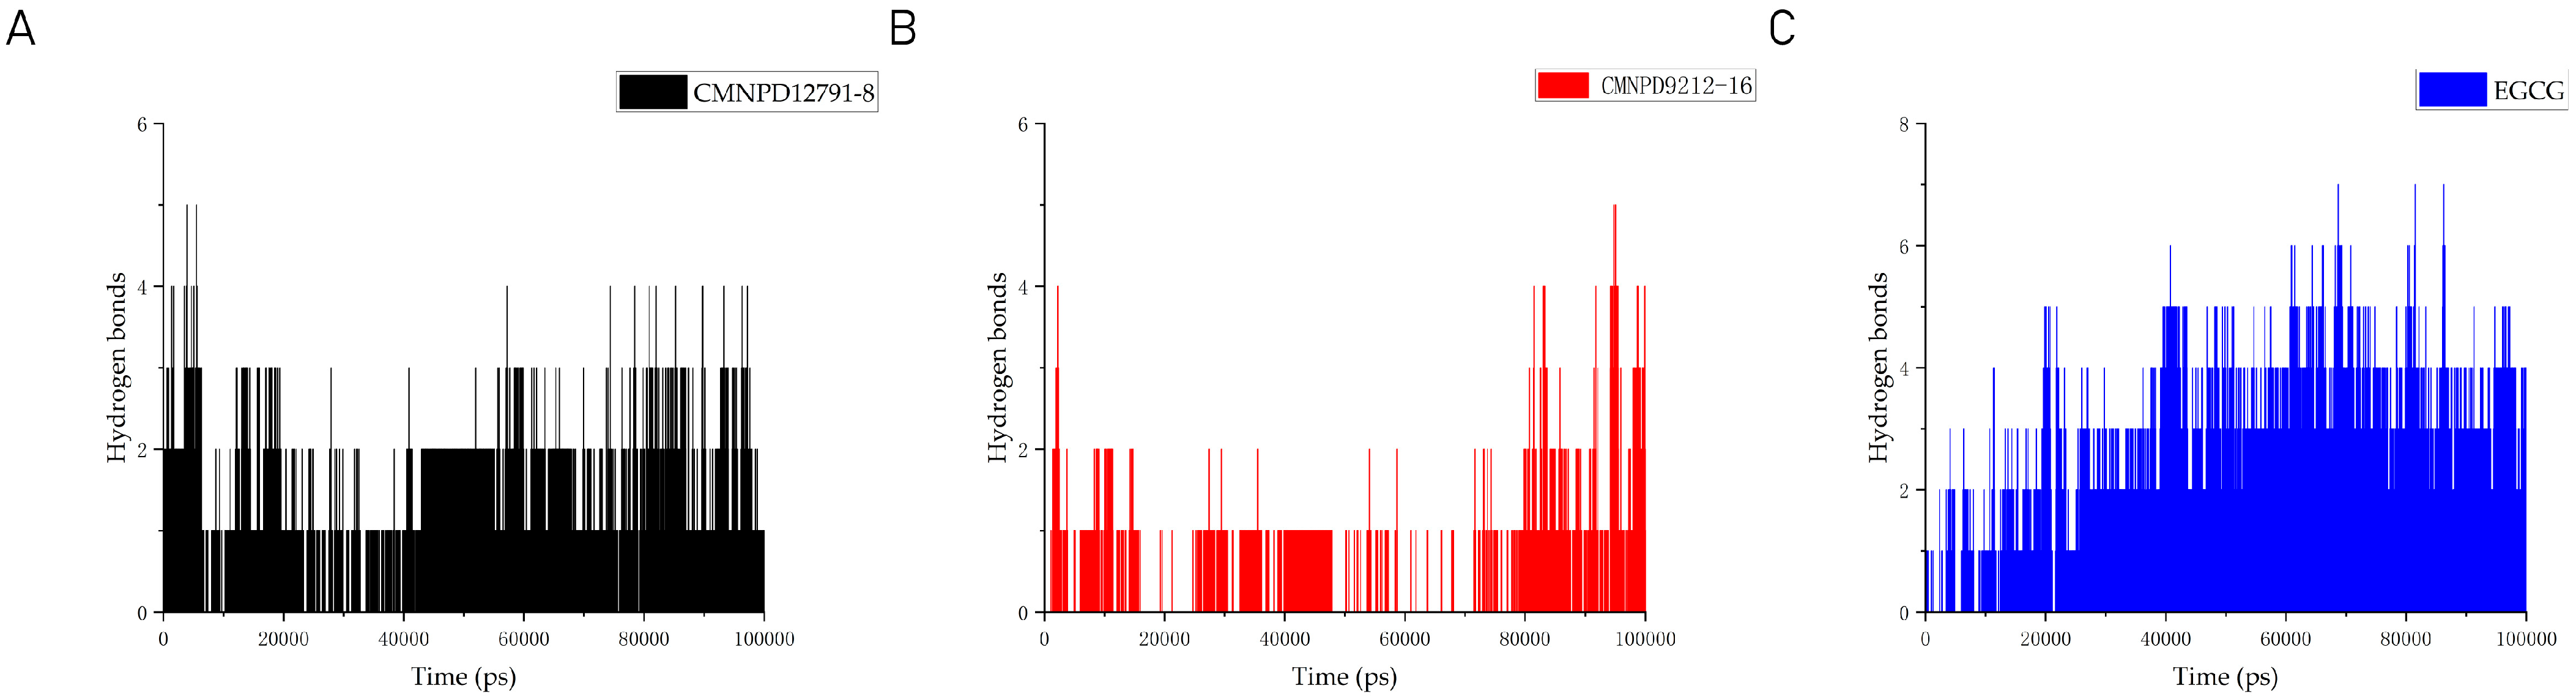
2.8. Molecular Dynamics
3. Discussion
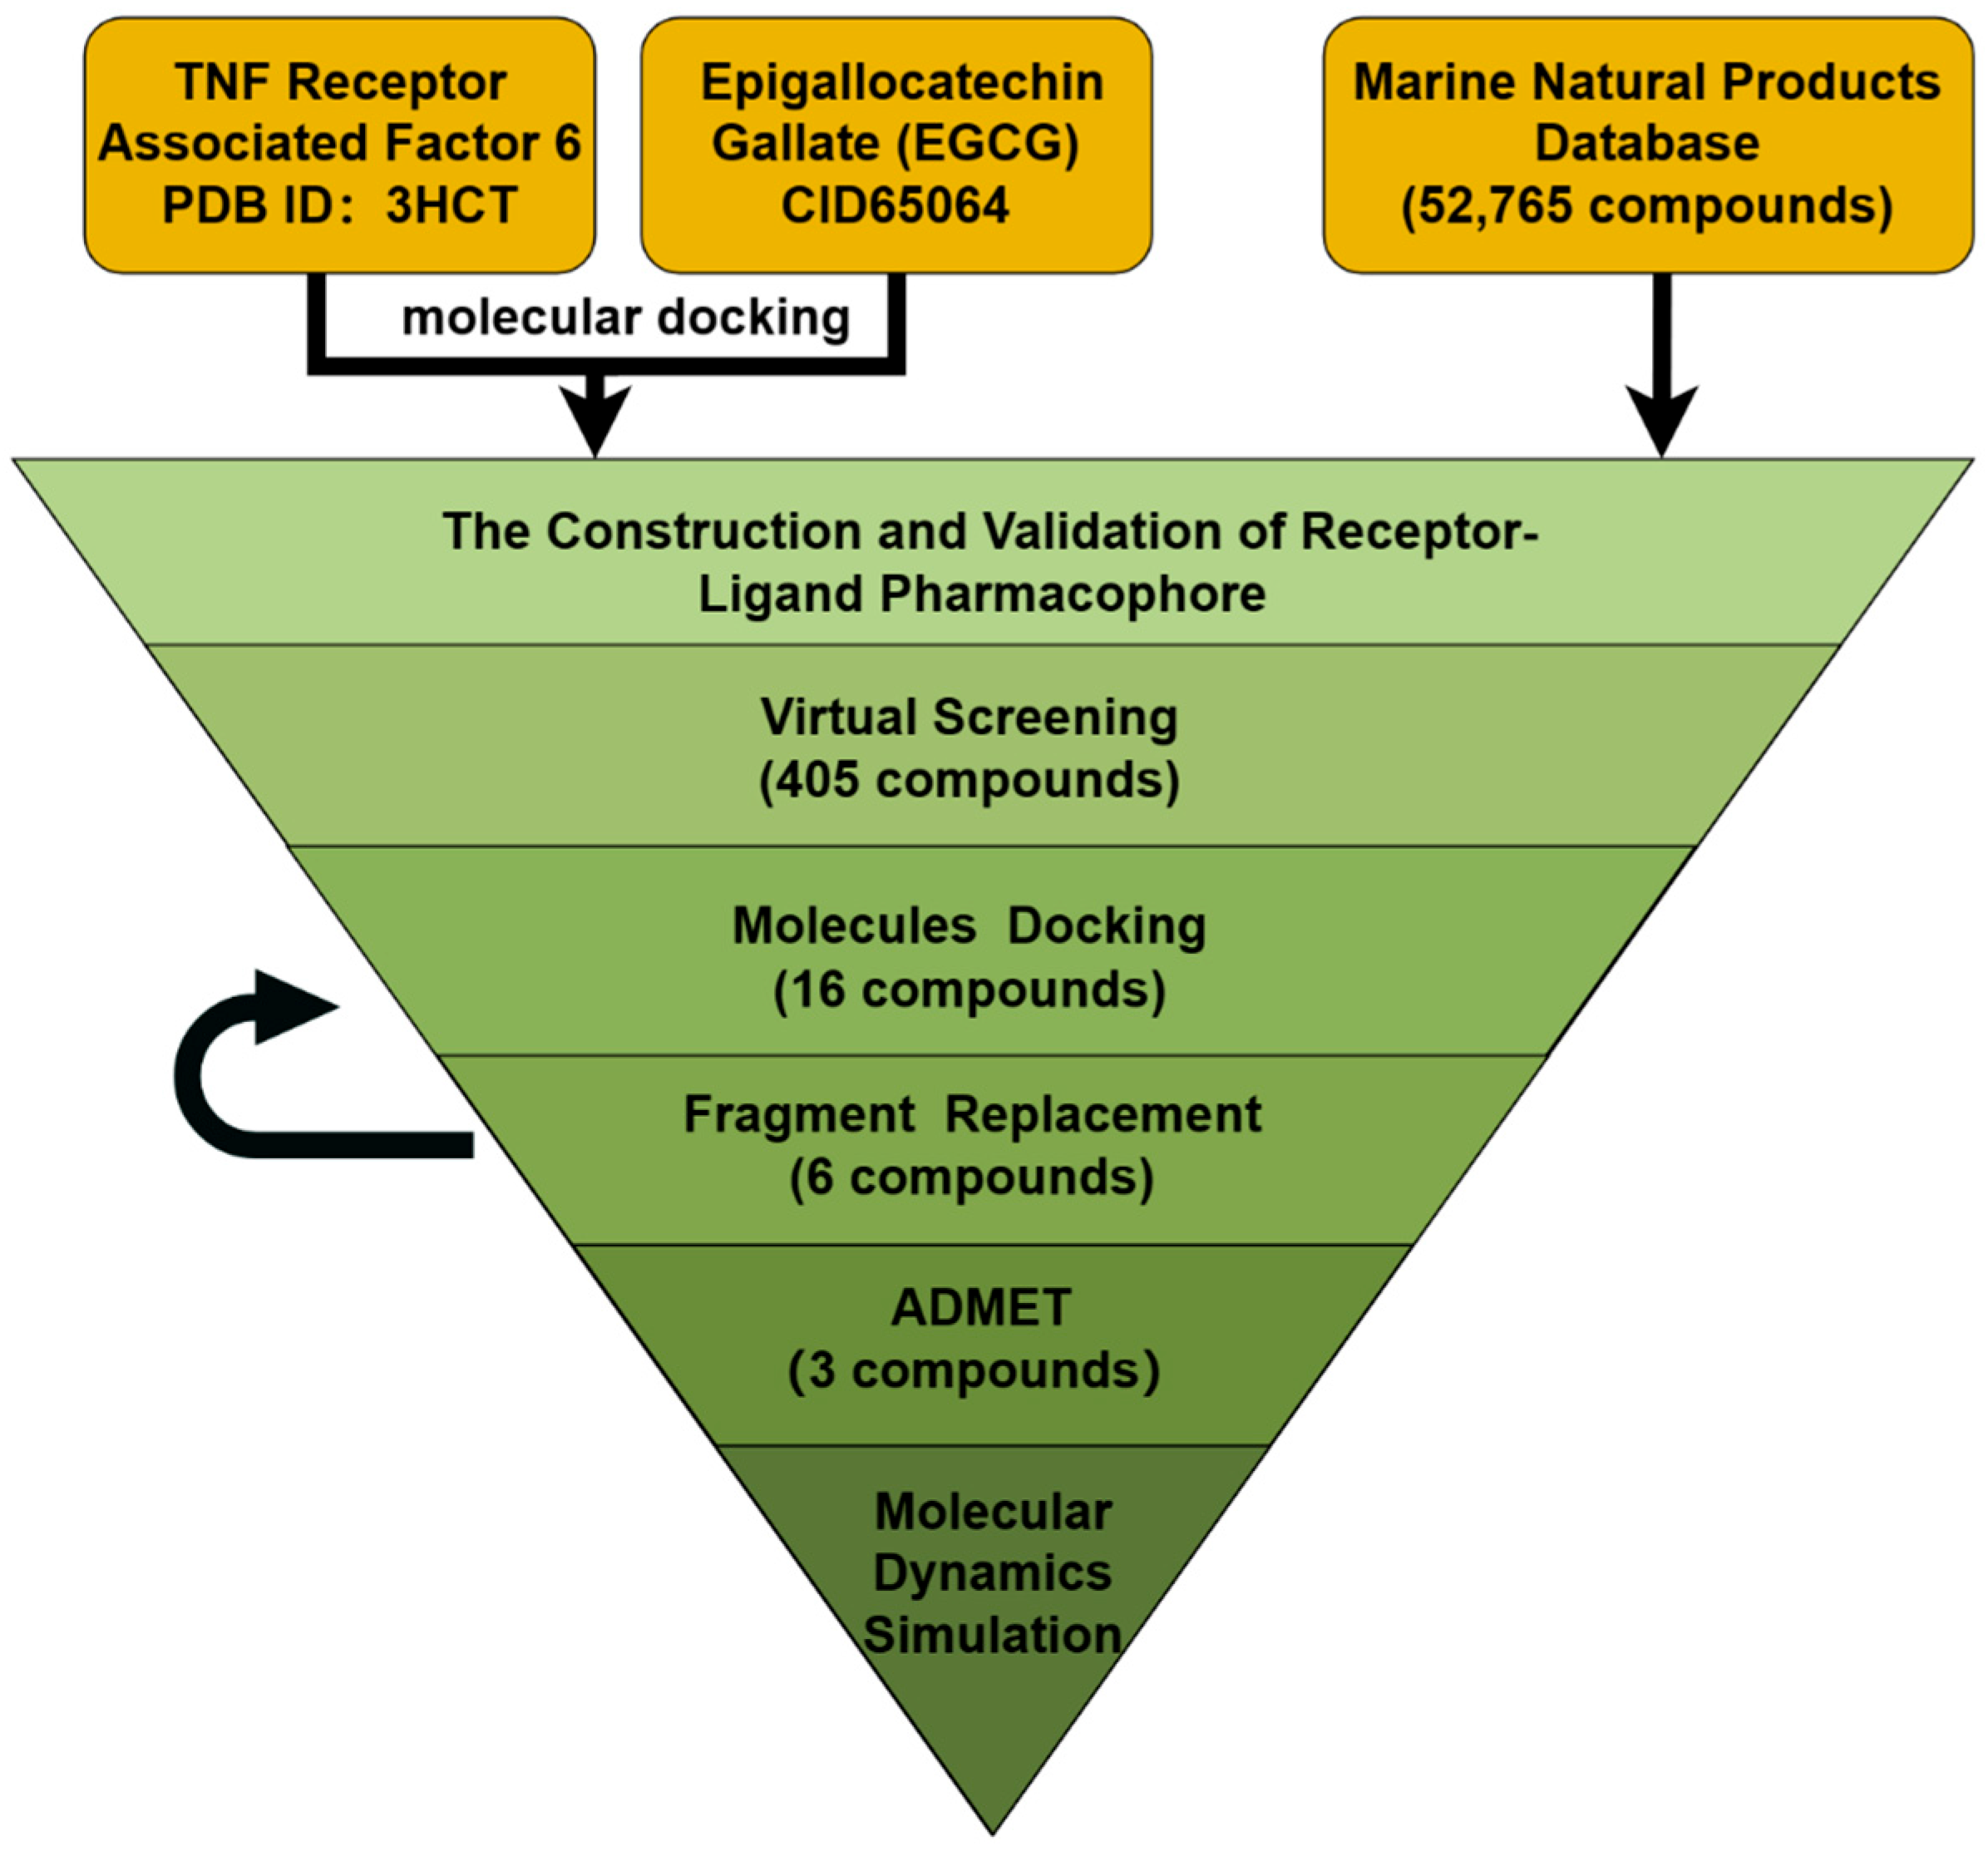
4. Materials and Methods
4.1. Preparation of the Compound Data Set
4.2. Protein Preparation and Molecular Docking
4.3. Establishment and Validation of Ligand–Receptor Complex Pharmacophore
4.4. Virtual Screening
4.5. Molecular Docking
4.6. Structural Optimization Based on Replacement of Molecular Fragments
4.6.1. Fragment Replacement
4.6.2. Molecular Docking and Binding-Free Energy Calculation after Fragment Replacement
4.7. ADME Prediction
4.8. Toxicity Prediction
4.9. Molecular Dynamics Simulations
5. Conclusions
Supplementary Materials
Author Contributions
Funding
Institutional Review Board Statement
Data Availability Statement
Acknowledgments
Conflicts of Interest
References
- Hershko, A.; Ciechanover, A. The ubiquitin system. Annu. Rev. Biochem. 1998, 67, 425–479. [Google Scholar] [CrossRef] [PubMed]
- Pickart, C.M. Mechanisms underlying ubiquitination. Annu. Rev. Biochem. 2001, 70, 503–533. [Google Scholar] [CrossRef] [PubMed]
- Pickart, C.M. Back to the future with ubiquitin. Cell 2004, 116, 181–190. [Google Scholar] [CrossRef] [PubMed]
- Hershko, A.; Heller, H.; Elias, S.; Ciechanover, A. Components of ubiquitin-protein ligase system. Resolution, affinity purification, and role in protein breakdown. J. Biol. Chem. 1983, 258, 8206–8214. [Google Scholar] [CrossRef] [PubMed]
- Schulman, B.A. Twists and turns in ubiquitin-like protein conjugation cascades. Protein Sci. 2011, 20, 1941–1954. [Google Scholar] [CrossRef] [PubMed]
- Zheng, N.; Shabek, N. Ubiquitin Ligases: Structure, Function, and Regulation. Annu. Rev. Biochem. 2017, 86, 129–157. [Google Scholar] [CrossRef] [PubMed]
- Inoue, J.; Gohda, J.; Akiyama, T. Characteristics and biological functions of TRAF6. Adv. Exp. Med. Biol. 2007, 597, 72–79. [Google Scholar] [CrossRef] [PubMed]
- Li, J.; Liu, N.; Tang, L.; Yan, B.; Chen, X.; Zhang, J.; Peng, C. The relationship between TRAF6 and tumors. Cancer Cell Int. 2020, 20, 429. [Google Scholar] [CrossRef] [PubMed]
- Arch, R.H.; Gedrich, R.W.; Thompson, C.B. Tumor necrosis factor receptor-associated factors (TRAFs)—A family of adapter proteins that regulates life and death. Genes Dev. 1998, 12, 2821–2830. [Google Scholar] [CrossRef]
- Takeuchi, M.; Rothe, M.; Goeddel, D.V. Anatomy of TRAF2. Distinct domains for nuclear factor-kappaB activation and association with tumor necrosis factor signaling proteins. J. Biol. Chem. 1996, 271, 19935–19942. [Google Scholar] [CrossRef]
- Yin, Q.; Lin, S.C.; Lamothe, B.; Lu, M.; Lo, Y.C.; Hura, G.; Zheng, L.; Rich, R.L.; Campos, A.D.; Myszka, D.G.; et al. E2 interaction and dimerization in the crystal structure of TRAF6. Nat. Struct. Mol. Biol. 2009, 16, 658–666. [Google Scholar] [CrossRef] [PubMed]
- Biswas, R.; Bagchi, A. Structural Characterization of the Trimerization of TRAF6 Protein Through Molecular Dynamics Simulations. Interdiscip. Sci. 2019, 11, 428–436. [Google Scholar] [CrossRef] [PubMed]
- Yamamoto, M.; Gohda, J.; Akiyama, T.; Inoue, J.I. TNF receptor-associated factor 6 (TRAF6) plays crucial roles in multiple biological systems through polyubiquitination-mediated NF-kappaB activation. Proc. Jpn. Acad. Ser. B Phys. Biol. Sci. 2021, 97, 145–160. [Google Scholar] [CrossRef]
- Zhang, J.; Lei, Z.; Huang, Z.; Zhang, X.; Zhou, Y.; Luo, Z.; Zeng, W.; Su, J.; Peng, C.; Chen, X. Epigallocatechin-3-gallate(EGCG) suppresses melanoma cell growth and metastasis by targeting TRAF6 activity. Oncotarget 2016, 7, 79557–79571. [Google Scholar] [CrossRef]
- Li, N.; Luo, L.; Wei, J.; Liu, Y.; Haque, N.; Huang, H.; Qi, Y.; Huang, Z. Identification of a new TRAF6 inhibitor for the treatment of hepatocellular carcinoma. Int. J. Biol. Macromol. 2021, 182, 910–920. [Google Scholar] [CrossRef] [PubMed]
- Wang, J.; Wu, X.; Jiang, M.; Tai, G. Mechanism by which TRAF6 Participates in the Immune Regulation of Autoimmune Diseases and Cancer. Biomed. Res. Int. 2020, 2020, 4607197. [Google Scholar] [CrossRef] [PubMed]
- Guo, Y.; Zhang, X.; Zeng, W.; Zhang, J.; Cai, L.; Wu, Z.; Su, J.; Xiao, Y.; Liu, N.; Tang, L.; et al. TRAF6 Activates Fibroblasts to Cancer-Associated Fibroblasts through FGF19 in Tumor Microenvironment to Benefit the Malignant Phenotype of Melanoma Cells. J. Investig. Dermatol. 2020, 140, 2268–2279.e2211. [Google Scholar] [CrossRef] [PubMed]
- Zbytek, B.; Carlson, J.A.; Granese, J.; Ross, J.; Mihm, M.C., Jr.; Slominski, A. Current concepts of metastasis in melanoma. Expert. Rev. Dermatol. 2008, 3, 569–585. [Google Scholar] [CrossRef] [PubMed]
- Villa, F.A.; Gerwick, L. Marine natural product drug discovery: Leads for treatment of inflammation, cancer, infections, and neurological disorders. Immunopharmacol. Immunotoxicol. 2010, 32, 228–237. [Google Scholar] [CrossRef]
- Zheng, L.H.; Wang, Y.J.; Sheng, J.; Wang, F.; Zheng, Y.; Lin, X.K.; Sun, M. Antitumor peptides from marine organisms. Mar. Drugs 2011, 9, 1840–1859. [Google Scholar] [CrossRef]
- Abdelmohsen, U.R.; Balasubramanian, S.; Oelschlaeger, T.A.; Grkovic, T.; Pham, N.B.; Quinn, R.J.; Hentschel, U. Potential of marine natural products against drug-resistant fungal, viral, and parasitic infections. Lancet Infect. Dis. 2017, 17, e30–e41. [Google Scholar] [CrossRef] [PubMed]
- Jimenez, C. Marine Natural Products in Medicinal Chemistry. ACS Med. Chem. Lett. 2018, 9, 959–961. [Google Scholar] [CrossRef] [PubMed]
- Blunt, J.W.; Copp, B.R.; Keyzers, R.A.; Munro, M.H.G.; Prinsep, M.R. Marine natural products. Nat. Prod. Rep. 2017, 34, 235–294. [Google Scholar] [CrossRef] [PubMed]
- Matulja, D.; Wittine, K.; Malatesti, N.; Laclef, S.; Turks, M.; Markovic, M.K.; Ambrozic, G.; Markovic, D. Marine Natural Products with High Anticancer Activities. Curr. Med. Chem. 2020, 27, 1243–1307. [Google Scholar] [CrossRef] [PubMed]
- Barreca, M.; Spano, V.; Montalbano, A.; Cueto, M.; Diaz Marrero, A.R.; Deniz, I.; Erdogan, A.; Lukic Bilela, L.; Moulin, C.; Taffin-de-Givenchy, E.; et al. Marine Anticancer Agents: An Overview with a Particular Focus on Their Chemical Classes. Mar. Drugs 2020, 18, 619. [Google Scholar] [CrossRef] [PubMed]
- Zhou, N.; Zheng, C.; Tan, H.; Luo, L. Identification of PLK1-PBD Inhibitors from the Library of Marine Natural Products: 3D QSAR Pharmacophore, ADMET, Scaffold Hopping, Molecular Docking, and Molecular Dynamics Study. Mar. Drugs 2024, 22, 83. [Google Scholar] [CrossRef] [PubMed]
- Tan, H.; Li, C.; Lai, T.; Luo, L. In Silico Analysis of USP7 Inhibitors Based on Building QSAR Models and Fragment Design for Screening Marine Compound Libraries. Mar. Drugs 2023, 22, 1. [Google Scholar] [CrossRef] [PubMed]
- Luo, L.; Zhong, A.; Wang, Q.; Zheng, T. Structure-Based Pharmacophore Modeling, Virtual Screening, Molecular Docking, ADMET, and Molecular Dynamics (MD) Simulation of Potential Inhibitors of PD-L1 from the Library of Marine Natural Products. Mar. Drugs 2021, 20, 29. [Google Scholar] [CrossRef] [PubMed]
- Luo, L.; Wang, Q.; Liao, Y. The Inhibitors of CDK4/6 from a Library of Marine Compound Database: A Pharmacophore, ADMET, Molecular Docking and Molecular Dynamics Study. Mar. Drugs 2022, 20, 319. [Google Scholar] [CrossRef] [PubMed]
- Lyu, C.; Chen, T.; Qiang, B.; Liu, N.; Wang, H.; Zhang, L.; Liu, Z. CMNPD: A comprehensive marine natural products database towards facilitating drug discovery from the ocean. Nucleic Acids Res. 2021, 49, D509–D515. [Google Scholar] [CrossRef]
- Blunt, J.W.; Copp, B.R.; Munro, M.H.; Northcote, P.T.; Prinsep, M.R. Marine natural products. Nat. Prod. Rep. 2010, 27, 165–237. [Google Scholar] [CrossRef]
- Davis, G.D.; Vasanthi, A.H. Seaweed metabolite database (SWMD): A database of natural compounds from marine algae. Bioinformation 2011, 5, 361–364. [Google Scholar] [CrossRef] [PubMed]
- Scheffner, M.; Kumar, S. Mammalian HECT ubiquitin-protein ligases: Biological and pathophysiological aspects. Biochim. Biophys. Acta 2014, 1843, 61–74. [Google Scholar] [CrossRef] [PubMed]
- Fajner, V.; Maspero, E.; Polo, S. Targeting HECT-type E3 ligases—Insights from catalysis, regulation and inhibitors. FEBS Lett. 2017, 591, 2636–2647. [Google Scholar] [CrossRef]
- Jeay, S.; Ferretti, S.; Holzer, P.; Fuchs, J.; Chapeau, E.A.; Wartmann, M.; Sterker, D.; Romanet, V.; Murakami, M.; Kerr, G.; et al. Dose and Schedule Determine Distinct Molecular Mechanisms Underlying the Efficacy of the p53-MDM2 Inhibitor HDM201. Cancer Res. 2018, 78, 6257–6267. [Google Scholar] [CrossRef]
- Chesi, M.; Mirza, N.N.; Garbitt, V.M.; Sharik, M.E.; Dueck, A.C.; Asmann, Y.W.; Akhmetzyanova, I.; Kosiorek, H.E.; Calcinotto, A.; Riggs, D.L.; et al. IAP antagonists induce anti-tumor immunity in multiple myeloma. Nat. Med. 2016, 22, 1411–1420. [Google Scholar] [CrossRef]
- Brenke, J.K.; Popowicz, G.M.; Schorpp, K.; Rothenaigner, I.; Roesner, M.; Meininger, I.; Kalinski, C.; Ringelstetter, L.; R’kyek, O.; Jurjens, G.; et al. Targeting TRAF6 E3 ligase activity with a small-molecule inhibitor combats autoimmunity. J. Biol. Chem. 2018, 293, 13191–13203. [Google Scholar] [CrossRef] [PubMed]
- Khusbu, F.Y.; Zhou, X.; Roy, M.; Chen, F.Z.; Cao, Q.; Chen, H.C. Resveratrol induces depletion of TRAF6 and suppresses prostate cancer cell proliferation and migration. Int. J. Biochem. Cell Biol. 2020, 118, 105644. [Google Scholar] [CrossRef]
- Carter, J.V.; Pan, J.; Rai, S.N.; Galandiuk, S. ROC-ing along: Evaluation and interpretation of receiver operating characteristic curves. Surgery 2016, 159, 1638–1645. [Google Scholar] [CrossRef]
- Seidel, T.; Schuetz, D.A.; Garon, A.; Langer, T. The Pharmacophore Concept and Its Applications in Computer-Aided Drug Design. Prog. Chem. Org. Nat. Prod. 2019, 110, 99–141. [Google Scholar] [CrossRef]
- Seidel, T.; Wieder, O.; Garon, A.; Langer, T. Applications of the Pharmacophore Concept in Natural Product inspired Drug Design. Mol. Inform. 2020, 39, e2000059. [Google Scholar] [CrossRef] [PubMed]
- Sousa da Silva, A.W.; Vranken, W.F. ACPYPE—AnteChamber PYthon Parser interfacE. BMC Res. Notes 2012, 5, 367. [Google Scholar] [CrossRef] [PubMed]
- Mark, P.; Nilsson, L. Structure and Dynamics of the TIP3P, SPC, and SPC/E Water Models at 298 K. J. Phys. Chem. A 2001, 105, 9954–9960. [Google Scholar] [CrossRef]
- Hosseini, F.S.; Amanlou, M. Anti-HCV and anti-malaria agent, potential candidates to repurpose for coronavirus infection: Virtual screening, molecular docking, and molecular dynamics simulation study. Life Sci. 2020, 258, 118205. [Google Scholar] [CrossRef] [PubMed]
- Van Der Spoel, D.; Lindahl, E.; Hess, B.; Groenhof, G.; Mark, A.E.; Berendsen, H.J. GROMACS: Fast, flexible, and free. J. Comput. Chem. 2005, 26, 1701–1718. [Google Scholar] [CrossRef]
- Nava, M. Implementing dimer metadynamics using gromacs. J. Comput. Chem. 2018, 39, 2126–2132. [Google Scholar] [CrossRef]


| Molecules | 2D Structure | Libdock Score | Formula |
|---|---|---|---|
| CMNPD12791 |  | 125.225 | C25H36O6 |
| CMNPD22985 |  | 113.028 | C28H50N2O6 |
| CMNPD9212 |  | 103.552 | C19H30O6 |
| CMNPD26927 | 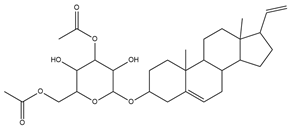 | 111.781 | C29H41NO10 |
| 24831 |  | 104.737 | C26H39NO7 |
| 24987 |  | 101.803 | C16H27NO6 |
| Molecules | Filter Criteria | Before Fragment Replacement | After Fragment Replacement |
|---|---|---|---|
| CMNPD12791-8 | Weight < 500, Alogp [−6, 5], TPSA [40, 140] |  | 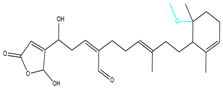 |
| CMNPD22985-57 | Weight < 600, AlogP [−6, 5], TPSA [40, 140] | 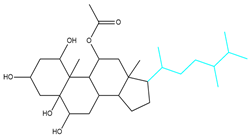 |  |
| CMNPD26927-4 | Weight < 500, AlogP [−6, 5], TPSA [40, 140] |  | 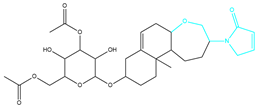 |
| CMNPD9212-16 | Weight < 500, AlogP [−6, 5], TPSA [40, 140] |  |  |
| 24831-1 | Weight < 500, AlogP [−6, 5], TPSA [40, 140] |  |  |
| 24831-4 |  |
| Molecules | Hydrogen Bond | Hydrophobic Interaction | Pi-Cation | Score | Binding Energy (kcal/mol) |
|---|---|---|---|---|---|
| EGCG | ILE72, GLN54, CYS73 | - | LYS96 | 98.882 | −228.79 |
| CMNPD12791 | GLN54, LYS96, ILE72 | - | - | 125.225 | −233.98 |
| CMNPD12791-8 | GLN54, ILE72 | - | - | 137.028 | −334.67 |
| CMNPD9212 | GLN54, ILE72 | CYS93, LYS96, ALA92 | - | 103.552 | −195.85 |
| CMNPD9212-16 | GLN54, ILE72, CYS73 | PRO63 | - | 109.351 | −235.73 |
| CMNPD26927 | GLN54, ILE72 | - | - | 111.781 | −240.92 |
| CMNPD26927-4 | GLN54, ASP57, ARG78 | ILE72, LYS96, CYS73, CYS93 | - | 133.415 | −338.23 |
| Molecules | GI Absorption | BBB Permeant | P-gp Substrate | CYP450 Inhibitor | Druglikeness | Bioavailability Score |
|---|---|---|---|---|---|---|
| CMNPD12791-8 | High | No | Yes | No | 4 | 0.55 |
| CMNPD29627-4 | High | No | No | No | 1 | 0.17 |
| CMNPD9212-16 | High | No | Yes | No | 5 | 0.55 |
| EGCG | Low | No | Yes | No | 1 | 0.17 |
| Name | Hepatotoxicity | Neurotoxicity | Mutagenicity | Immunotoxicity | Carcinogenicity |
|---|---|---|---|---|---|
| CMNPD12791-8 | No | No | No | No | No |
| CMNPD29627-4 | No | Yes | No | No | Yes |
| CMNPD9212-16 | No | No | No | No | No |
Disclaimer/Publisher’s Note: The statements, opinions and data contained in all publications are solely those of the individual author(s) and contributor(s) and not of MDPI and/or the editor(s). MDPI and/or the editor(s) disclaim responsibility for any injury to people or property resulting from any ideas, methods, instructions or products referred to in the content. |
© 2024 by the authors. Licensee MDPI, Basel, Switzerland. This article is an open access article distributed under the terms and conditions of the Creative Commons Attribution (CC BY) license (https://creativecommons.org/licenses/by/4.0/).
Share and Cite
Wu, X.; Zhong, S.; Zhou, N.; Luo, L. TRAF6 Inhibitors from Marine Compound Library: Pharmacophore, Virtual Screening, Fragment Replacement, ADMET, and Molecular Dynamics. Mar. Drugs 2024, 22, 260. https://doi.org/10.3390/md22060260
Wu X, Zhong S, Zhou N, Luo L. TRAF6 Inhibitors from Marine Compound Library: Pharmacophore, Virtual Screening, Fragment Replacement, ADMET, and Molecular Dynamics. Marine Drugs. 2024; 22(6):260. https://doi.org/10.3390/md22060260
Chicago/Turabian StyleWu, Xuexuan, Saiyi Zhong, Nan Zhou, and Lianxiang Luo. 2024. "TRAF6 Inhibitors from Marine Compound Library: Pharmacophore, Virtual Screening, Fragment Replacement, ADMET, and Molecular Dynamics" Marine Drugs 22, no. 6: 260. https://doi.org/10.3390/md22060260