
Status of Fishery Discards and By-Products in Greece and Potential Valorization Scenarios towards a National Exploitation Master Plan

 ,
, 
 ,
,  ,
,  ,
,  and
and
Abstract
1. Introduction
2. Results
2.1. The HAVBs That Can Potentially Be Produced from FBPD
2.2. Estimation of Potential Sources of Raw Material for the Production of HAVBs from FBPD
2.2.1. Catches That Are Not Ultimately Sold at the 11 Official Greek Fish Auctions (Hereafter Referred to as Landing Sites)
2.2.2. Discards
2.2.3. Category 3 Fish By-Products (FBP-3) from the Processing of Fish in the Commercial and Processing Chain
2.2.4. Total Biomass Available for Valorization
2.3. Assumptions
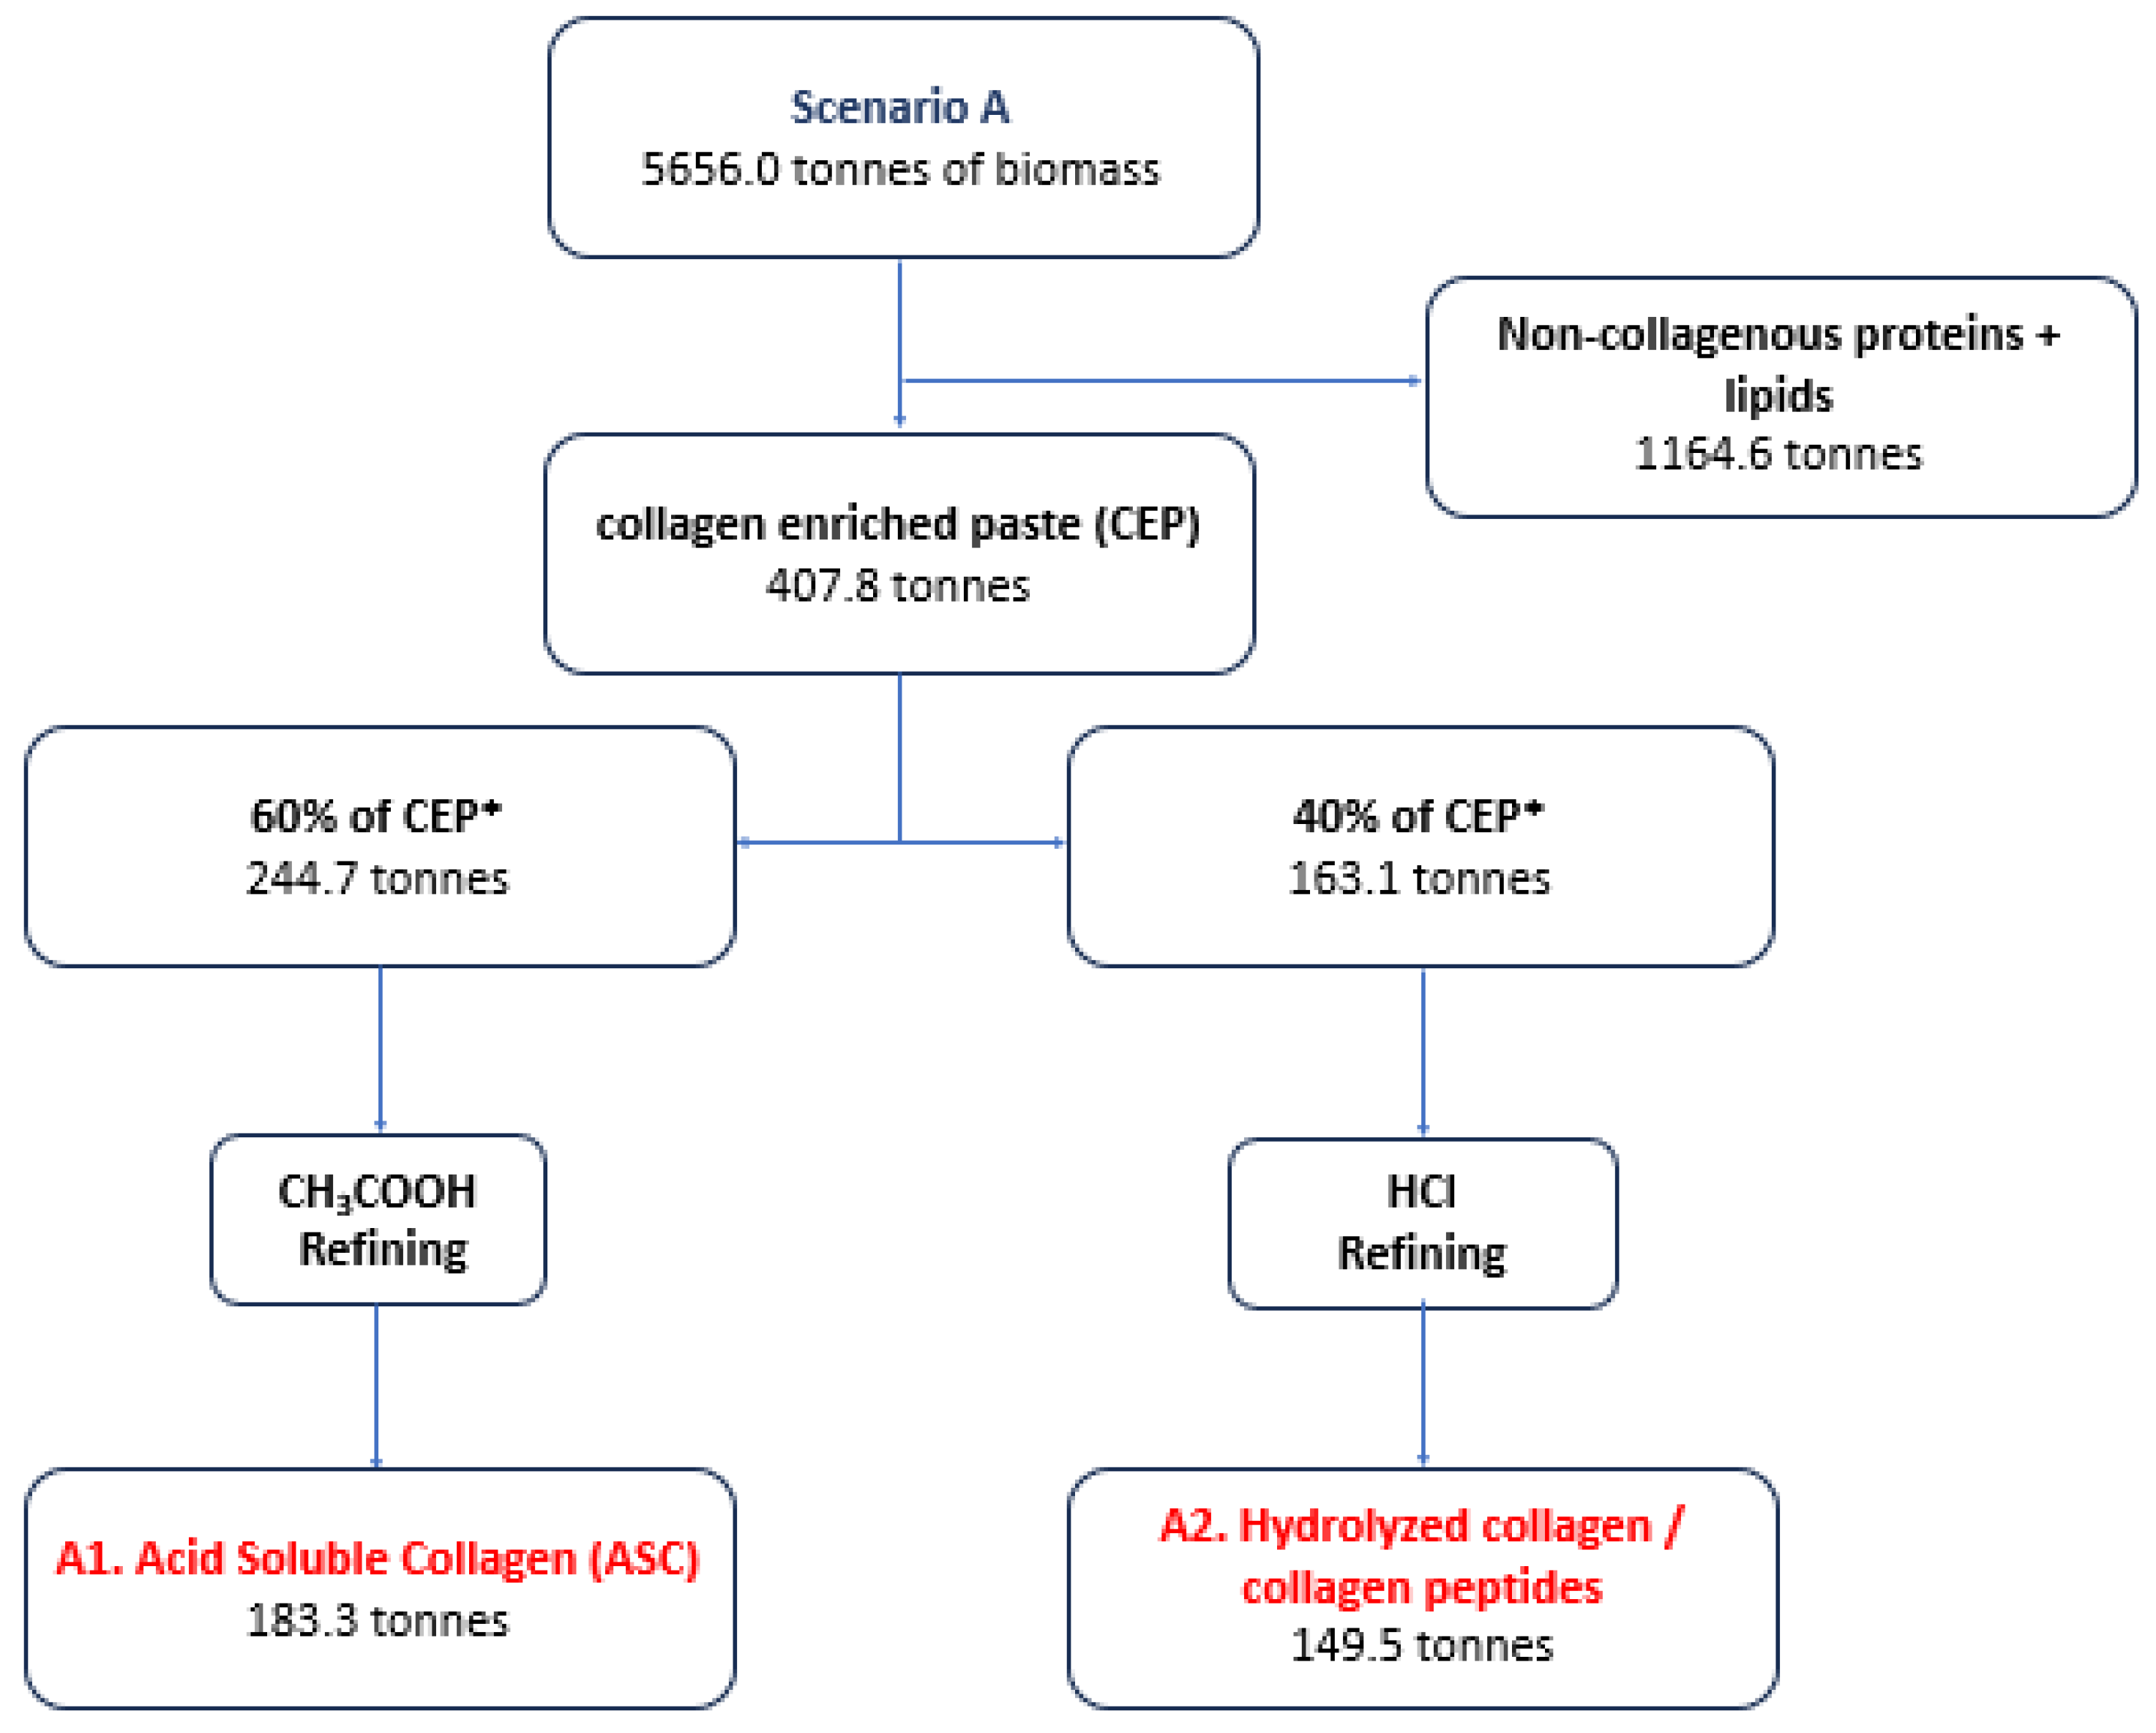
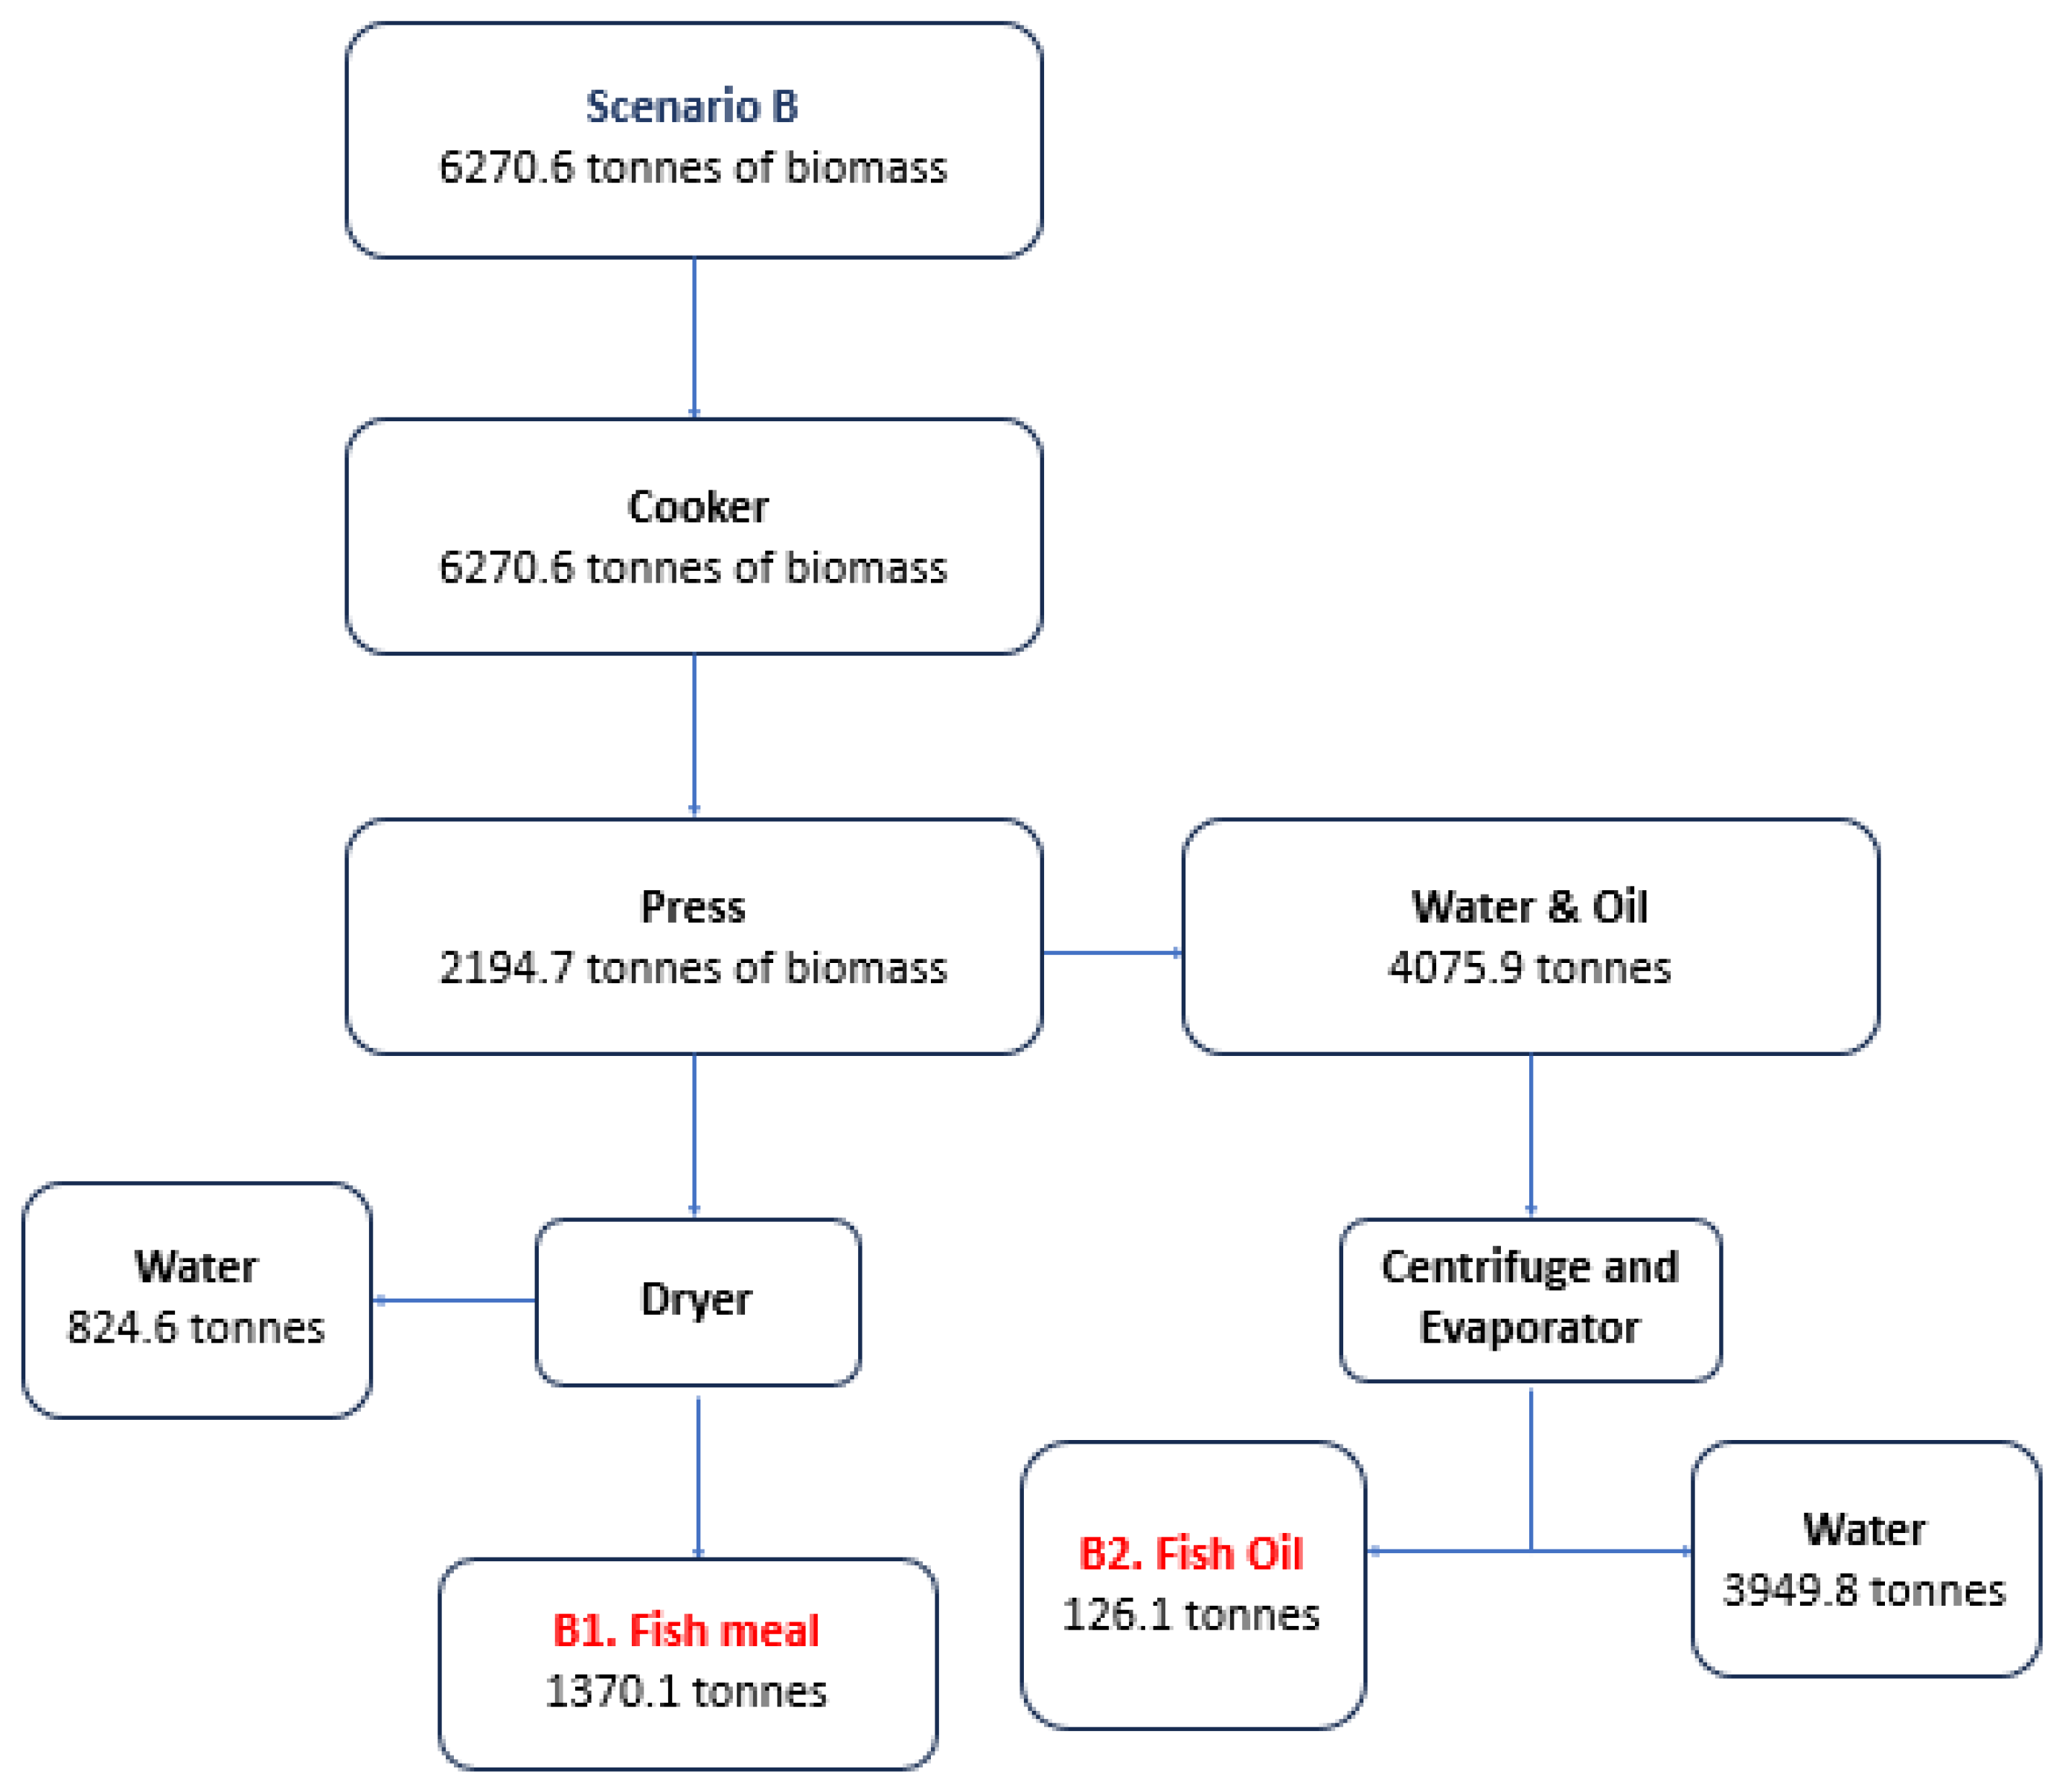
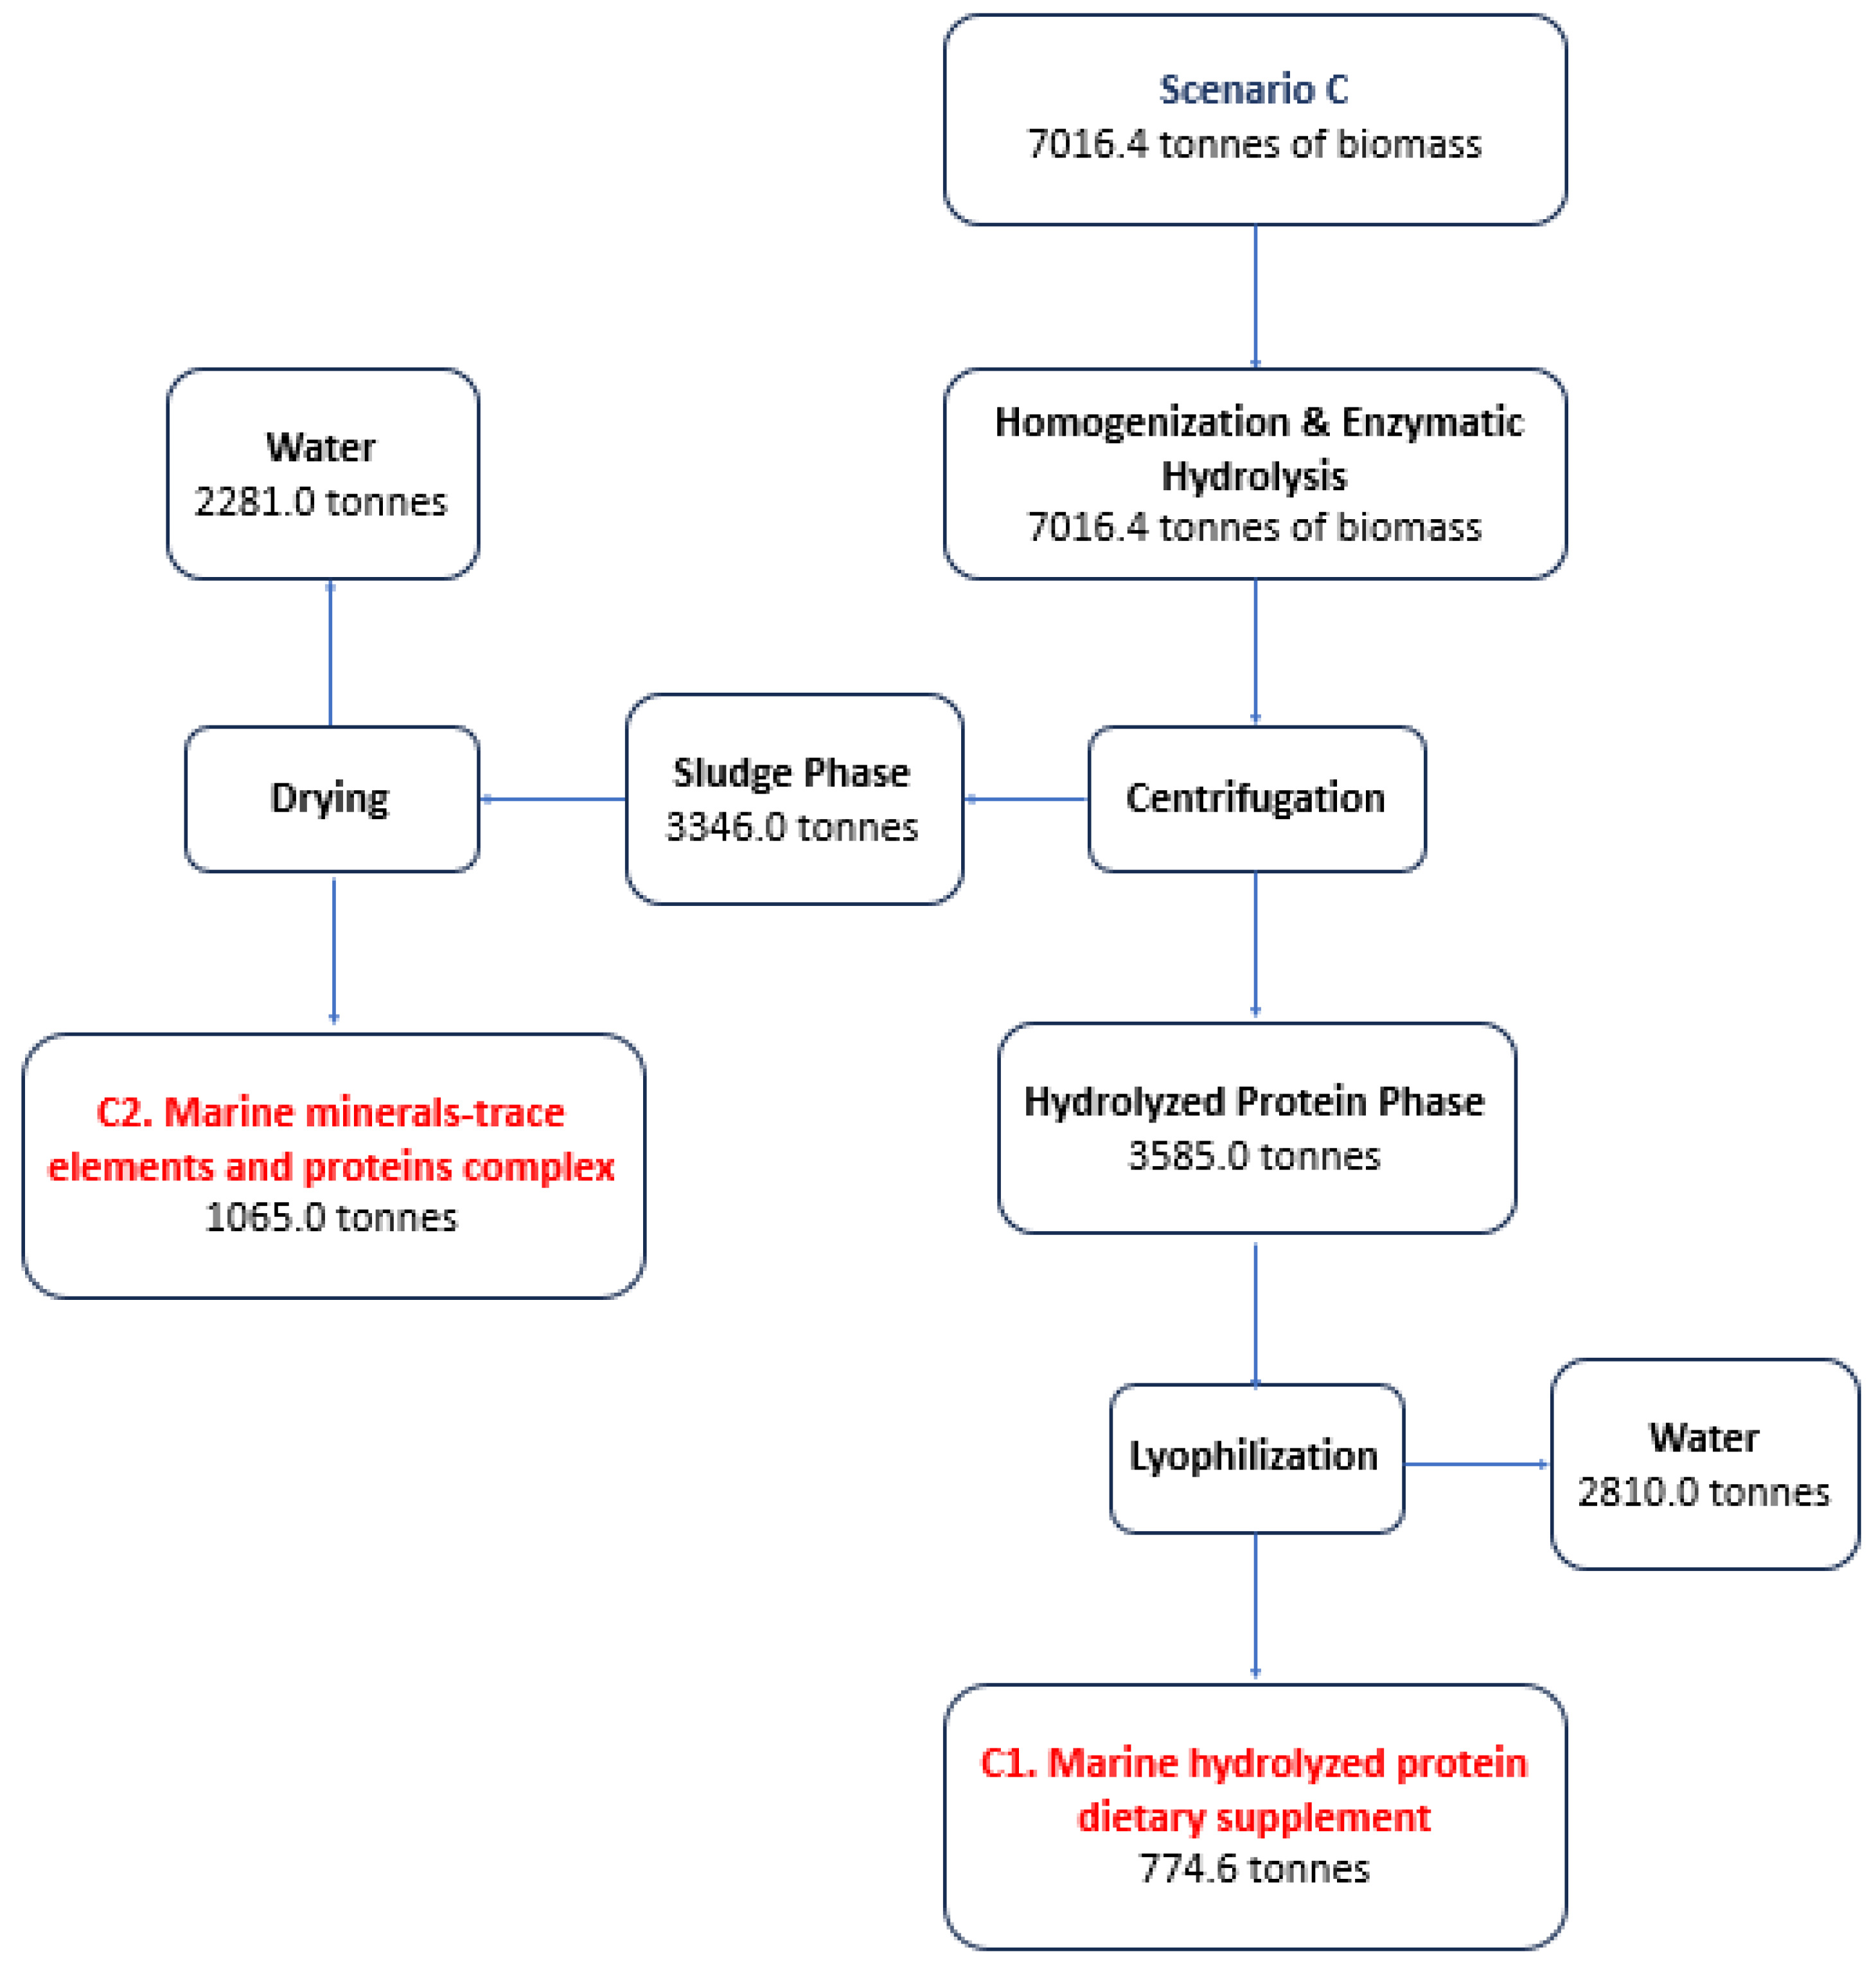
2.4. Yields per Production Line and Master Plan Scenarios
3. Discussion
4. Materials and Methods
4.1. Discards Data
4.2. Landings Data
- Estimates based on universal discard ratios for each GSA (GSA 20 Ionian, GSA 22 Aegean, and GSA 23 Crete). A single discard ratio per gear was applied using all data collected per GSA for the entire time period, regardless of species.
- Estimates based on monthly discard ratios per GSA for the entire catch. For each gear, a different discard ratio was applied for each month based on data collected in a GSA that month, regardless of species.
- Estimates based on monthly discard ratios for the entire catch by DCF-EPSAD region. For each fishing gear, a different discard ratio was applied for each month and each DCF-EPSAD area based on the data collected in that area and that month, regardless of species.
- Estimates based on discard ratios by species for each GSA. For each species, a separate discard ratio was applied and estimated using all data for that species, by GSA and by fishing gear. The final estimate is obtained by summing up the discards of each species. However, in this particular analysis, to avoid details, the intermediate calculation steps are not listed.
- Regarding fishery production, only fish was considered. Cephalopods, bivalves, and crustaceans have been removed as they are not raw materials for HAVPs considered in this study (ELSTAT data).
- In the production of aquaculture, bivalves (mussels and oysters) and crustaceans have been removed as no raw materials to be used have been considered in this study (ELSTAT data).
- As the vast majority of imports concern frozen products, canned goods, and other processed products, only the ISSCAAP Division of diadromous fishes, freshwater fishes, and marine fishes were taken into account (data from FishstatJ of the FAO Global Fishery and Aquaculture Production Statistics).
- From exports, only the ISSCAAP Division of diadromous fishes, freshwater fishes, and marine fishes were taken into account (data from FishstatJ of the FAO Global Fishery and Aquaculture Production Statistics) [61].
- After these assumptions, an average apparent consumption of 70,026.71 tons (years 2017–2021) and a per capita consumption of 6.68 kg per inhabitant per year result. If the same percentages of fishery and aquaculture products are consumed throughout the Greek territory, then based on the apparent consumption, Table 8 will be obtained, after removing a conservative percentage of approximately 15% during the ‘cleaning’ process at retail points.
4.3. Collagen-Enriched Paste
4.4. Hydrolyzed Collagen/Collagen Peptides
4.5. Acid-Soluble Collagen (ASC)
4.6. Fish Meal—Fish Oil Potential Yield Estimation
4.7. Fish Silage Separation Yields
4.8. Marine Mineral Trace Elements and Protein Complexes
4.9. Marine Hydrolyzed Protein Dietary Supplements
4.10. Omega-3 Fatty Acid Supplements
5. Conclusions
Supplementary Materials
Author Contributions
Funding
Data Availability Statement
Acknowledgments
Conflicts of Interest
References
- European Union. Regulation (EU) No 1380/2013 of the European Parliament and of the Council of 11 December 2013 on the Common Fisheries Policy, amending Council Regulations (EC) No 1954/2003 and (EC) No 1224/2009 and repealing Council Regulations (EC) No 2371/2002 and (EC) No 639/2004 and Council Decision 2004/585/EC. Off. J. Eur. Union 2013, L 354, 22–60. [Google Scholar]
- Sardà, F.; Coll, M.; Heymans, J.J.; Stergiou, K.I. Overlooked impacts and challenges of the new European discard ban. Fish Fish. 2015, 16, 175–180. [Google Scholar] [CrossRef]
- Damalas, D. Mission impossible: Discard management plans for the EU Mediterranean fisheries under the reformed Common Fisheries Policy. Fish. Res. 2015, 165, 96–99. [Google Scholar] [CrossRef]
- Hoff, A.; Frost, H.; Andersen, P.; Prellezo, R.; Rueda, L.; Triantaphyllidis, G.; Argyrou, I.; Tsikliras, A.; Motova, A.; Lehuta, S.; et al. Potential Economic Consequences of the Landing Obligation. In The European Landing Obligation: Reducing Discards in Complex, Multi-Species and Multi-Jurisdictional Fisheries; Uhlmann, S.S., Ulrich, C., Kennelly, S.J., Eds.; Springer International Publishing: Cham, Switzerland, 2019; pp. 109–128. [Google Scholar]
- Kelleher, K. Discards in the World’s Marine Fisheries. An Update; FAO Fisheries Technical Paper No. 470; FAO: Rome, Italy, 2005; 131p. [Google Scholar]
- Guillen, J.; Holmes, S.J.; Carvalho, N.; Casey, J.; Dörner, H.; Gibin, M.; Mannini, A.; Vasilakopoulos, P.; Zanzi, A. A Review of the European Union Landing Obligation Focusing on Its Implications for Fisheries and the Environment. Sustainability 2018, 10, 900. [Google Scholar] [CrossRef]
- Catchpole, T.L.; Ribeiro-Santos, A.; Mangi, S.C.; Hedley, C.; Gray, T.S. The challenges of the landing obligation in EU fisheries. Mar. Policy 2017, 82, 76–86. [Google Scholar] [CrossRef]
- Lucchetti, A.; Melli, V.; Brčić, J. Editorial: Innovations in fishing technology aimed at achieving sustainable fishing. Front. Mar. Sci. 2023, 10, 1310318. [Google Scholar] [CrossRef]
- Rudovica, V.; Rotter, A.; Gaudêncio, S.P.; Novoveská, L.; Akgül, F.; Akslen-Hoel, L.K.; Alexandrino, D.A.M.; Anne, O.; Arbidans, L.; Atanassova, M.; et al. Valorization of Marine Waste: Use of Industrial By-Products and Beach Wrack towards the Production of High Added-Value Products. Front. Mar. Sci. 2021, 8, 723333. [Google Scholar] [CrossRef]
- Liu, Z.; de Souza, T.S.P.; Holland, B.; Dunshea, F.; Barrow, C.; Suleria, H.A.R. Valorization of Food Waste to Produce Value-Added Products Based on Its Bioactive Compounds. Processes 2023, 11, 840. [Google Scholar] [CrossRef]
- European Commission; European Climate, Infrastructure and Environment Executive Agency; Heinrich, J. Synthesis of the Landing Obligation Measures and Discard Rates; Publications Office: Luxemourg, 2021. [Google Scholar]
- Cooke, S.J.; Fulton, E.A.; Sauer, W.H.H.; Lynch, A.J.; Link, J.S.; Koning, A.A.; Jena, J.; Silva, L.G.M.; King, A.J.; Kelly, R.; et al. Towards vibrant fish populations and sustainable fisheries that benefit all: Learning from the last 30 years to inform the next 30 years. Rev. Fish Biol. Fish. 2023, 33, 317–347. [Google Scholar] [CrossRef]
- Tsagarakis, K.; Zupa, W.; Ligas, A.; Musumeci, C.; Tserpes, G.; Spedicato, M.T. Factors affecting the variability of discards in Mediterranean bottom trawl fisheries. Fish. Res. 2024, 274, 106979. [Google Scholar] [CrossRef]
- Scientific, Technical and Economic Committee for Fisheries (STECF). Evaluation of Joint Recommendations on the Landing Obligation and on Technical Measures Regulation (STECF-23-04 and 23-06); JRC136341; Rihan, D., Grati, F., Ligas, A., Doerner, H., Vasilakopoulos, P., Eds.; Publications Office of the European Union: Luxembourg, 2024. [Google Scholar] [CrossRef]
- Suuronen, P.; Gilman, E. Monitoring and managing fisheries discards: New technologies and approaches. Mar. Policy 2020, 116, 103554. [Google Scholar] [CrossRef]
- Lucchetti, A.; Virgili, M.; Vasapollo, C.; Petetta, A.; Bargione, G.; VELI, D.L.; BRĈIC, J.; Sala, A. An overview of bottom trawl selectivity in the Mediterranean Sea. Mediterr. Mar. Sci. 2021, 22, 566–585. [Google Scholar] [CrossRef]
- Piroddi, C.; Colloca, F.; Tsikliras, A.C. The living marine resources in the Mediterranean Sea Large Marine Ecosystem. Environ. Dev. 2020, 36, 100555. [Google Scholar] [CrossRef] [PubMed]
- Rotter, A.; Giannakourou, A.; Argente García, J.E.; Quero, G.M.; Auregan, C.; Triantaphyllidis, G.; Venetsanopoulou, A.; De Carolis, R.; Efstratiou, C.; Aboal, M.; et al. Identification of Marine Biotechnology Value Chains with High Potential in the Northern Mediterranean Region. Mar. Drugs 2023, 21, 416. [Google Scholar] [CrossRef] [PubMed]
- Coppola, D.; Lauritano, C.; Palma Esposito, F.; Riccio, G.; Rizzo, C.; de Pascale, D. Fish Waste: From Problem to Valuable Resource. Mar. Drugs 2021, 19, 116. [Google Scholar] [CrossRef] [PubMed]
- European Union. Regulation (EC) No 1069/2009 of the European Parliament and of the Council of 21 October 2009 laying down health rules as regards animal by-products and derived products not intended for human consumption and repealing Regulation (EC) No 1774/2002 (Animal by-products Regulation). Off. J. Eur. Union 2009, L 300, 1–33. [Google Scholar]
- Carvalho, A.M.; Marques, A.P.; Silva, T.H.; Reis, R.L. Evaluation of the Potential of Collagen from Codfish Skin as a Biomaterial for Biomedical Applications. Mar. Drugs 2018, 16, 495. [Google Scholar] [CrossRef] [PubMed]
- Saranya, R.; Tamil Selvi, A.; Jayapriya, J.; Aravindhan, R. Synthesis of Fat Liquor Through Fish Waste Valorization, Characterization and Applications in Tannery Industry. Waste Biomass Valorization 2020, 11, 6637–6647. [Google Scholar] [CrossRef]
- Jafari, H.; Lista, A.; Siekapen, M.M.; Ghaffari-Bohlouli, P.; Nie, L.; Alimoradi, H.; Shavandi, A. Fish Collagen: Extraction, Characterization, and Applications for Biomaterials Engineering. Polymers 2020, 12, 2230. [Google Scholar] [CrossRef]
- Araujo, J.; Sica, P.; Costa, C.; Márquez, M. Enzymatic hydrolysis of fish waste as an alternative to produce high value-added products. Waste Biomass Valorization 2021, 12, 847–855. [Google Scholar] [CrossRef]
- Industry Analysis Report, R.O. Application Development Potential, Price Trends, Competitive Market Share & Forecast, 2020–2026. Fish Protein Hydrolysate Market Size, by Technology (Acid Hydrolysis, Enzymatic Hydrolysis), by Form (Powder, Paste, Liquid), by Source (Anchovy, Tilapia, Tuna, Sardine, Atlantic Salmon, Crustacean, Molluscs, Codfish), by Application (Animal Feed [Poultry {, 2021 #59}, Swine, Calves, Aquaculture {, 2021, Shrimps}, Equine], Pet Food [Cat, Dog], Food (Flavor Enhancers, Functional Food, Infant Formulation, Nutraceuticals, Sports Nutrition, Protein Supplements, Elderly Food Formulation, Clinicals), Cosmetics [by Protein Type {Industry Analysis Report, 2020, Proline), Elastin, Keratin}], Agriculture [Fertilizers, Protection, Elicitor], Pharmaceutical). Available online: https://www.gminsights.com/industry-analysis/fish-protein-hydrolysate-market (accessed on 10 April 2024).
- Giordano, D.; Costantini, M.; Coppola, D.; Lauritano, C.; Núñez Pons, L.; Ruocco, N.; di Prisco, G.; Ianora, A.; Verde, C. Chapter Five—Biotechnological Applications of Bioactive Peptides from Marine Sources. In Advances in Microbial Physiology; Poole, R.K., Ed.; Academic Press: Cambridge, MA, USA, 2018; Volume 73, pp. 171–220. [Google Scholar]
- Harnedy, P.A.; FitzGerald, R.J. Bioactive peptides from marine processing waste and shellfish: A review. J. Funct. Foods 2012, 4, 6–24. [Google Scholar] [CrossRef]
- Abuine, R.; Rathnayake, A.U.; Byun, H.-G. Biological activity of peptides purified from fish skin hydrolysates. Fish. Aquat. Sci. 2019, 22, 10. [Google Scholar] [CrossRef]
- Kim, S.-K.; Wijesekara, I. Development and biological activities of marine-derived bioactive peptides: A review. J. Funct. Foods 2010, 2, 1–9. [Google Scholar] [CrossRef]
- Urakova, I.N.; Pozharitskaya, O.N.; Demchenko, D.V.; Shikov, A.N.; Makarov, V.G. The biological activities of fish peptides and methods of their isolation. Russ. J. Mar. Biol. 2012, 38, 417–422. [Google Scholar] [CrossRef]
- Global Market Insights Fish Protein Hydrolysate Market for Animal Feed & Pet Food Application by Technology (Acid Hydrolysis, Autolytic hydrolysis, Enzymatic Hydrolysis), by Form (Powder, Paste, Liquid), by Source (Anchovy, Tilapia, Tuna, Sardine, Atlantic Salmon, Crustacean, Molluscs, Codfish), by Application (Animal Feed [Poultry {, 2021 #59}, Swine, Calves, Aquaculture {, 2021, Shrimps}, Equine], Pet Food [Cat, Dog], COVID-19 Impact Analysis, Regional Outlook, Growth Potential, Competitive Market Share & Forecast, 2022–2028. 2021. Available online: https://www.gminsights.com/industry-analysis/fish-protein-hydrolysate-market-for-animal-feed-and-pet-food-applications (accessed on 10 April 2024).
- Tacon, A.G.J.; Metian, M. Global overview on the use of fish meal and fish oil in industrially compounded aquafeeds: Trends and future prospects. Aquaculture 2008, 285, 146–158. [Google Scholar] [CrossRef]
- Saleh, N.E.; Wassef, E.A.; Abdel-Mohsen, H.H. Chapter nine—Sustainable Fish and Seafood Production and Processing. In Sustainable Fish Production and Processing; Galanakis, C.M., Ed.; Academic Press: Cambridge, MA, USA, 2022; pp. 259–291. [Google Scholar]
- Khiari, Z. Sustainable Upcycling of Fisheries and Aquaculture Wastes Using Fish-Derived Cold-Adapted Proteases. Front. Nutr. 2022, 9, 875697. [Google Scholar] [CrossRef] [PubMed]
- Bendiksen, E.Å.; Johnsen, C.A.; Olsen, H.J.; Jobling, M. Sustainable aquafeeds: Progress towards reduced reliance upon marine ingredients in diets for farmed Atlantic salmon (Salmo salar L.). Aquaculture 2011, 314, 132–139. [Google Scholar] [CrossRef]
- Hardy, R.W.; Sealey, W.M.; Gatlin III, D.M. Fisheries By-Catch and By-Product Meals as Protein Sources for Rainbow Trout Oncorhynchus mykiss. J. World Aquac. Soc. 2005, 36, 393–400. [Google Scholar] [CrossRef]
- Roncarati, A.; Meligrana, M.; Magi, G.; Mariotti, F.; Iaffaldano, N. Growth performances of rainbow trout (Oncorhynchus mykiss) juveniles fed on a diet containing processed fish as a partial substitute for fish meal. Ital. J. Anim. Sci. 2019. Available online: https://iris.unimol.it/handle/11695/113636 (accessed on 29 May 2024).
- Li, P.; Wang, X.; Hardy, R.W.; Gatlin, D.M. Nutritional value of fisheries by-catch and by-product meals in the diet of red drum (Sciaenops ocellatus). Aquaculture 2004, 236, 485–496. [Google Scholar] [CrossRef]
- Whiteman, K.W.; Gatlin III, D.M. Evaluation of fisheries by-catch and by-product meals in diets for red drum Sciaenops ocellatus L. Aquac. Res. 2005, 36, 1572–1580. [Google Scholar] [CrossRef]
- Kim, H.S.; Jung, W.-G.; Myung, S.H.; Cho, S.H.; Kim, D.S. Substitution effects of fishmeal with tuna byproduct meal in the diet on growth, body composition, plasma chemistry and amino acid profiles of juvenile olive flounder (Paralichthys olivaceus). Aquaculture 2014, 431, 92–98. [Google Scholar] [CrossRef]
- AbouelFadl, K.Y.; Badrey, A.E.; Mohammed-AbdAllah, E.; Eloraby, O.G.; Henish, S. Effects of Fish Discards as a Substitute for Fish Meal on the Growth Rates and Health Status of Oreochromis niloticus. Egypt. J. Aquat. Biol. Fish. 2024, 28, 195–205. [Google Scholar] [CrossRef]
- Ragni, M.; Colonna, M.A.; Di Turi, L.; Carbonara, C.; Giannico, F.; Cariglia, M.; Palma, G.; Tarricone, S. Partial Replacement of Fishmeal with Seafood Discards for Juvenile Penaeus japonicus: Effects on Growth, Flesh Quality, Chemical and Fatty Acid Composition. Fishes 2024, 9, 195. [Google Scholar] [CrossRef]
- Hoerterer, C.; Petereit, J.; Lannig, G.; Johansen, J.; Pereira, G.V.; Conceição, L.E.C.; Pastres, R.; Buck, B.H. Sustainable fish feeds: Potential of emerging protein sources in diets for juvenile turbot (Scophthalmus maximus) in RAS. Aquac. Int. 2022, 30, 1481–1504. [Google Scholar] [CrossRef]
- Baek, S.I.; Cho, S.H. Dietary Replacement Effect of Fish Meal by Tuna By-Product Meal on Growth and Feed Availability of Red Sea Bream (Pagrus major). Animals 2024, 14, 688. [Google Scholar] [CrossRef] [PubMed]
- Biswas, A.; Takahashi, Y.; Isaka, K.; Takakuwa, F.; Tanaka, H.; Takii, K. Total Replacement of Fish Meal by the Combination of Fish Residue Meal and Soy Protein from Soymilk in the Diet of Red Sea Bream (Pagrus major). Animals 2022, 12, 3351. [Google Scholar] [CrossRef]
- Benitez-Hernández, A.; Jiménez-Bárcenas, S.P.L.; Sánchez-Gutiérrez, E.Y.; Pérez-Urbiola, J.C.; Tovar-Ramírez, D.; Palacios, E.; Civera-Cerecedo, R. Use of marine by-product meals in diets for juvenile longfin yellowtail Seriola rivoliana. Aquac. Nutr. 2018, 24, 562–570. [Google Scholar] [CrossRef]
- Hasan, B.; Iriani, D.; Warningsih, T.; Caipang, C.M.A.; Muchlisin, Z.A.; Suharman, I. Growth and carcass quality of on-growing river catfish Hemibagrus nemurus fed with dietary salted by-catch and fish viscera meal mixtures as fishmeal substitute. Aquac. Rep. 2022, 27, 101343. [Google Scholar] [CrossRef]
- Wassef, E.; Saleh, N.; Abde-Meguid, N.E.; Abdel-Mohsen, H.H. Utilization of fish waste biomass as a fishmeal alternative in European seabass (Dicentrarchus labrax) diets: Effects on immuno-competence and liver and intestinal histomorphology. Int. Aquat. Res. 2023, 15, 145–161. [Google Scholar] [CrossRef]
- Global Opportunity Analysis and Industry Forecast. Research and Markets Fish Oil Market by Species and Aquaculture, Animal Nutrition & Pet Food, Pharmaceuticals, Supplements & Functional Food and Others. Available online: https://www.researchandmarkets.com/reports/5141668/fish-oil-market-by-species-and-aquaculture (accessed on 10 April 2024).
- Wijesundera, C.; Kitessa, S.; Abeywardena, M.; Bignell, W.; Nichols, P.D. Long-chain omega-3 oils: Current and future supplies, food and feed applications, and stability. Lipid Technol. 2011, 23, 55–58. [Google Scholar] [CrossRef]
- Jackson, A.; Newton, R. Project to Model the Use of Fisheries By-Products in the Production of Marine Ingredients with Special Reference to Omega-3 Fatty Acids EPA and DHA; A Report by IFFO and the University of Stirling; University of Stirling: Stirling, UK, 2016; 12p. [Google Scholar]
- Karkal, S.S.; Kudre, T.G. Valorization of fish discards for the sustainable production of renewable fuels. J. Clean. Prod. 2020, 275, 122985. [Google Scholar] [CrossRef]
- Ramakrishnan, V.; Ghaly, A.; Brooks, M.; Budge, S. Extraction of oil from mackerel fish processing waste using Alcalase Enzyme. Enzym. Eng. 2013, 2, 2–10. [Google Scholar] [CrossRef]
- Kudre, T.G.; Bhaskar, N.; Sakhare, P.Z. Optimization and characterization of biodiesel production from rohu (Labeo rohita) processing waste. Renew. Energy 2017, 113, 1408–1418. [Google Scholar] [CrossRef]
- Kim, S.-K.; Mendis, E. Bioactive compounds from marine processing byproducts—A review. Food Res. Int. 2006, 39, 383–393. [Google Scholar] [CrossRef]
- Ghaly, A.; Ramakrishnan, V.; Brooks, M.; Budge, S.; Dave, D. Fish processing wastes as a potential source of proteins. Amino acids and oils: A critical review. J. Microb. Biochem. Technol 2013, 5, 107–129. [Google Scholar] [CrossRef]
- Hammersmith Reports. Grain trading reports published since 1985, Section 2 Fishmeal Comments And Prices: Peruvian “Indication” Fishmeal Prices. 2024. Available online: https://hammersmithltd.blogspot.com/2024/04/ (accessed on 20 April 2024).
- Kavadas, S.; Damalas, D.; Georgakarakos, C.; Maravelias, C.D.; Tserpes, G.; Papaconstantinou., C.; Bazigos, G. IMAS-Fish: Integrated Management System to support the sustainability of Greek Fishery resources. A multidisciplinary web-based database management system: Implementation, capabilities, utilization and future prospects for fisheries stakeholders. Mediterr. Mar. Sci. 2013, 14, 109–118. [Google Scholar] [CrossRef]
- ELSTAT. Quantity of Fish Landed by Fishing Area and Fishing Tools. Available online: http://www.statistics.gr (accessed on 29 May 2024).
- Tzanatos, E.; Somarakis, S.; Tserpes, G.; Koutsikopoulos, C. Discarding practices in a Mediterranean small-scale fishing fleet (Patraikos Gulf, Greece). Fish. Manag. Ecol. 2007, 14, 277–285. [Google Scholar] [CrossRef]
- FAO. Fishery and Aquaculture Statistics. Global Production by Production Source 1950–2021 (FishStatJ). In FAO Fisheries and Aquaculture Division. Rome. Updated 2023. 2023. Available online: www.fao.org/fishery/en/statistics/software/fishstatj (accessed on 20 April 2024).
- de Moraes, M.C.; Cunha, R.L. Gelation property and water holding capacity of heat-treated collagen at different temperature and pH values. Food Res. Int. 2013, 50, 213–223. [Google Scholar] [CrossRef]
- Kotzamanis, Y.; Tsironi, T.; Brezas, A.; Grigorakis, K.; Ilia, V.; Vatsos, I.; Romano, N.; van Eys, J.; Kumar, V. High taurine supplementation in plant protein-based diets improves growth and organoleptic characteristics of European seabass (Dicentrarchus labrax). Sci. Rep. 2020, 10, 12294. [Google Scholar] [CrossRef]
- Commission Regulation (EU) No 142/2011 of 25 February 2011 implementing Regulation (EC) No 1069/2009 of the European Parliament and of the Council laying down health rules as regards animal by-products and derived products not intended for human consumption and implementing Council Directive 97/78/EC as regards certain samples and items exempt from veterinary checks at the border under that Directive Text with EEA relevance. Document 32011R0142 2011; pp. 1–254. Available online: http://data.europa.eu/eli/reg/2011/142/oj (accessed on 29 May 2024).
- Presidential Decree 211/2006 (A211) Supplementary measures for the implementation of Regulation 1774/2002/EC for the establishment of health rules regarding animal by-products not intended for human consumption. 2006. Available online: https://eur-lex.europa.eu/legal-content/EN/TXT/?uri=celex%3A32002R1774 (accessed on 29 May 2024).
- Regulation (EC) No 852/2004 of the European Parliament and of the Council of 29 April 2004 on the hygiene of foodstuffs. 2004. Available online: http://data.europa.eu/eli/reg/2004/852/oj (accessed on 29 May 2024).


| 1. HAVB from fresh or frozen FBPD A1. Acid-Soluble Collagen (ASC) A2. Hydrolyzed collagen/collagen peptides B1. Fish meal B2. Fish oil C1. Marine hydrolyzed protein dietary supplements (food grade) C2. Marine mineral trace elements and protein complexes (food grade) |
| 2. HAVB from ensilaged FBPD D1. Omega-3 fatty acid supplements (for animal feed) D2. Marine hydrolyzed protein dietary supplements (for animal feed) D3. Marine mineral trace elements and protein complexes (for animal feed) E1. Fish silage protein concentrate (for animal feed) |
| Area—GSA | Area Code | Area National Fisheries Data Col/on Program | CMFO Fish Landing Site | Total |
|---|---|---|---|---|
| Ionian Sea—20 | N-ION | North Ionian Sea | Preveza | 1.94 |
| C-ION | Central Ionian Sea | Patras, Messolonghi | 27.62 | |
| S-ION | South Ionian Sea | - | ||
| Aegean Sea—22 | THR-LIM | Thrace and Lemnos | Kavala, Alexandroupolis | 114.42 |
| THERM | Thermaikos | Thessaloniki | 272.66 | |
| VOL-SPOR | Volos and Sporades | Volos | - | |
| CHI-MIT | Chios and Lesbos | Chios | 3.39 | |
| EVIA | Evia | Chalkida | - | |
| ARGSAR | Argosaronikos | Piraeus | 244.64 | |
| CYCL | Cyclades | - | 41.28 | |
| DODEC | Dodecanese | Kalymnos | 0.14 | |
| Crete—23 | CRETE | Crete | Chania | 16.05 |
| Grand total | 722.14 |
| Area—GSA | Area Code | Area National Fisheries Data Collection Program | CMFO Fish Landing Site | Total |
|---|---|---|---|---|
| Ionian Sea—20 | N-ION | North Ionian Sea | Preveza | 255.3 |
| C-ION | Central Ionian Sea | Patras, Messolonghi | 523.0 | |
| S-ION | South Ionian Sea | - | 21.3 | |
| Aegean Sea—22 | THR-LIM | Thrace and Lemnos | Kavala, Alexandroupolis | 3069.7 |
| THERM | Thermaikos | Thessaloniki | 992.2 | |
| VOL-SPOR | Volos and Sporades | Volos | 266.9 | |
| CHI-MIT | Chios and Lesbos | Chios | 613.9 | |
| EVIA | Evia | Chalkida | 347.1 | |
| ARGSAR | Argosaronikos | Piraeus | 457.8 | |
| CYCL | Cyclades | - | 745.8 | |
| DODEC | Dodecanese | Kalymnos | 149.9 | |
| Crete—23 | CRETE | Crete | Chania | 210.4 |
| Grand total | 7653.3 |
| Area—GSA | Area Code | Area National Fisheries Data Collection Program | CMFO Fish Landing Site | Total |
|---|---|---|---|---|
| Ionian Sea—20 | N-ION | North Ionian Sea | Preveza | 320.59 |
| C-ION | Central Ionian Sea | Patras. Messolonghi | 649.44 | |
| S-ION | South Ionian Sea | - | 204.92 | |
| Aegean Sea—22 | THR-LIM | Thrace and Lemnos | Kavala. Alexandroupolis | 563.26 |
| THERM | Thermaikos | Thessaloniki | 2055.88 | |
| VOL-SPOR | Volos and Sporades | Volos | 689.55 | |
| CHI-MIT | Chios and Lesbos | Chios | 195.31 | |
| EVIA | Evia | Chalkida | 509.21 | |
| ARGSAR | Argosaronikos | Piraeus | 3821.26 | |
| CYCL | Cyclades | - | ||
| DODEC | Dodecanese | Kalymnos | 328.44 | |
| Crete—23 | CRETE | Crete | Chania | 625.59 |
| Peloponnese | 540.55 | |||
| Grand total | 10,504.01 |
| Area—GSA | Area Code | Area National Fisheries Data Collection Program | CMFO Fish Landing Site | Total |
|---|---|---|---|---|
| Ionian Sea—22 | N-ION | North Ionian Sea | Preveza | 577.71 |
| C-ION | Central Ionian Sea | Patras, Messolonghi | 1200.07 | |
| S-ION | South Ionian Sea | - | 226.32 | |
| Aegean Sea—22 | THR-LIM | Thrace and Lemnos | Kavala, Alexandroupolis | 3747.49 |
| THERM | Thermaikos | Thessaloniki | 3320.75 | |
| VOL-SPOR | Volos and Sporades | - | 956.35 | |
| CHI-MIT | Chios and Lesbos | Chios | 812.49 | |
| EVIA | Evia | Chalkida | 856.41 | |
| ARGSAR | Argosaronikos | Piraeus | 4523.82 | |
| CYCL | Cyclades | - | 787.09 | |
| DODEC | Dodecanese | Kalymnos | 478.39 | |
| Crete—23 | CRETE | Crete | Chania | 851.93 |
| Peloponnese | 540.55 | |||
| Grand total | 18,879.38 |
| List of Potential Products | Yield (%) |
|---|---|
| A1. Acid-Soluble Collagen (ASC) | 5.37 |
| A2. Hydrolyzed collagen/collagen peptides | 6.61 |
| B1. Fish meal | 21.85 |
| B2. Fish oil | 2.01 |
| C1. Marine hydrolyzed protein dietary supplements (food grade) | 11.04 |
| C2. Marine mineral trace elements and protein complexes (food grade) | 15.18 |
| D1. Omega-3 fatty acid supplements (for animal feed) | 2.26 |
| D2. Marine hydrolyzed protein dietary supplements (for animal feed) | 11.04 |
| D3. Marine mineral trace elements and protein complexes (for animal feed) | 15.18 |
| E1. Fish silage protein concentrate (for animal feed) | 20.72 |
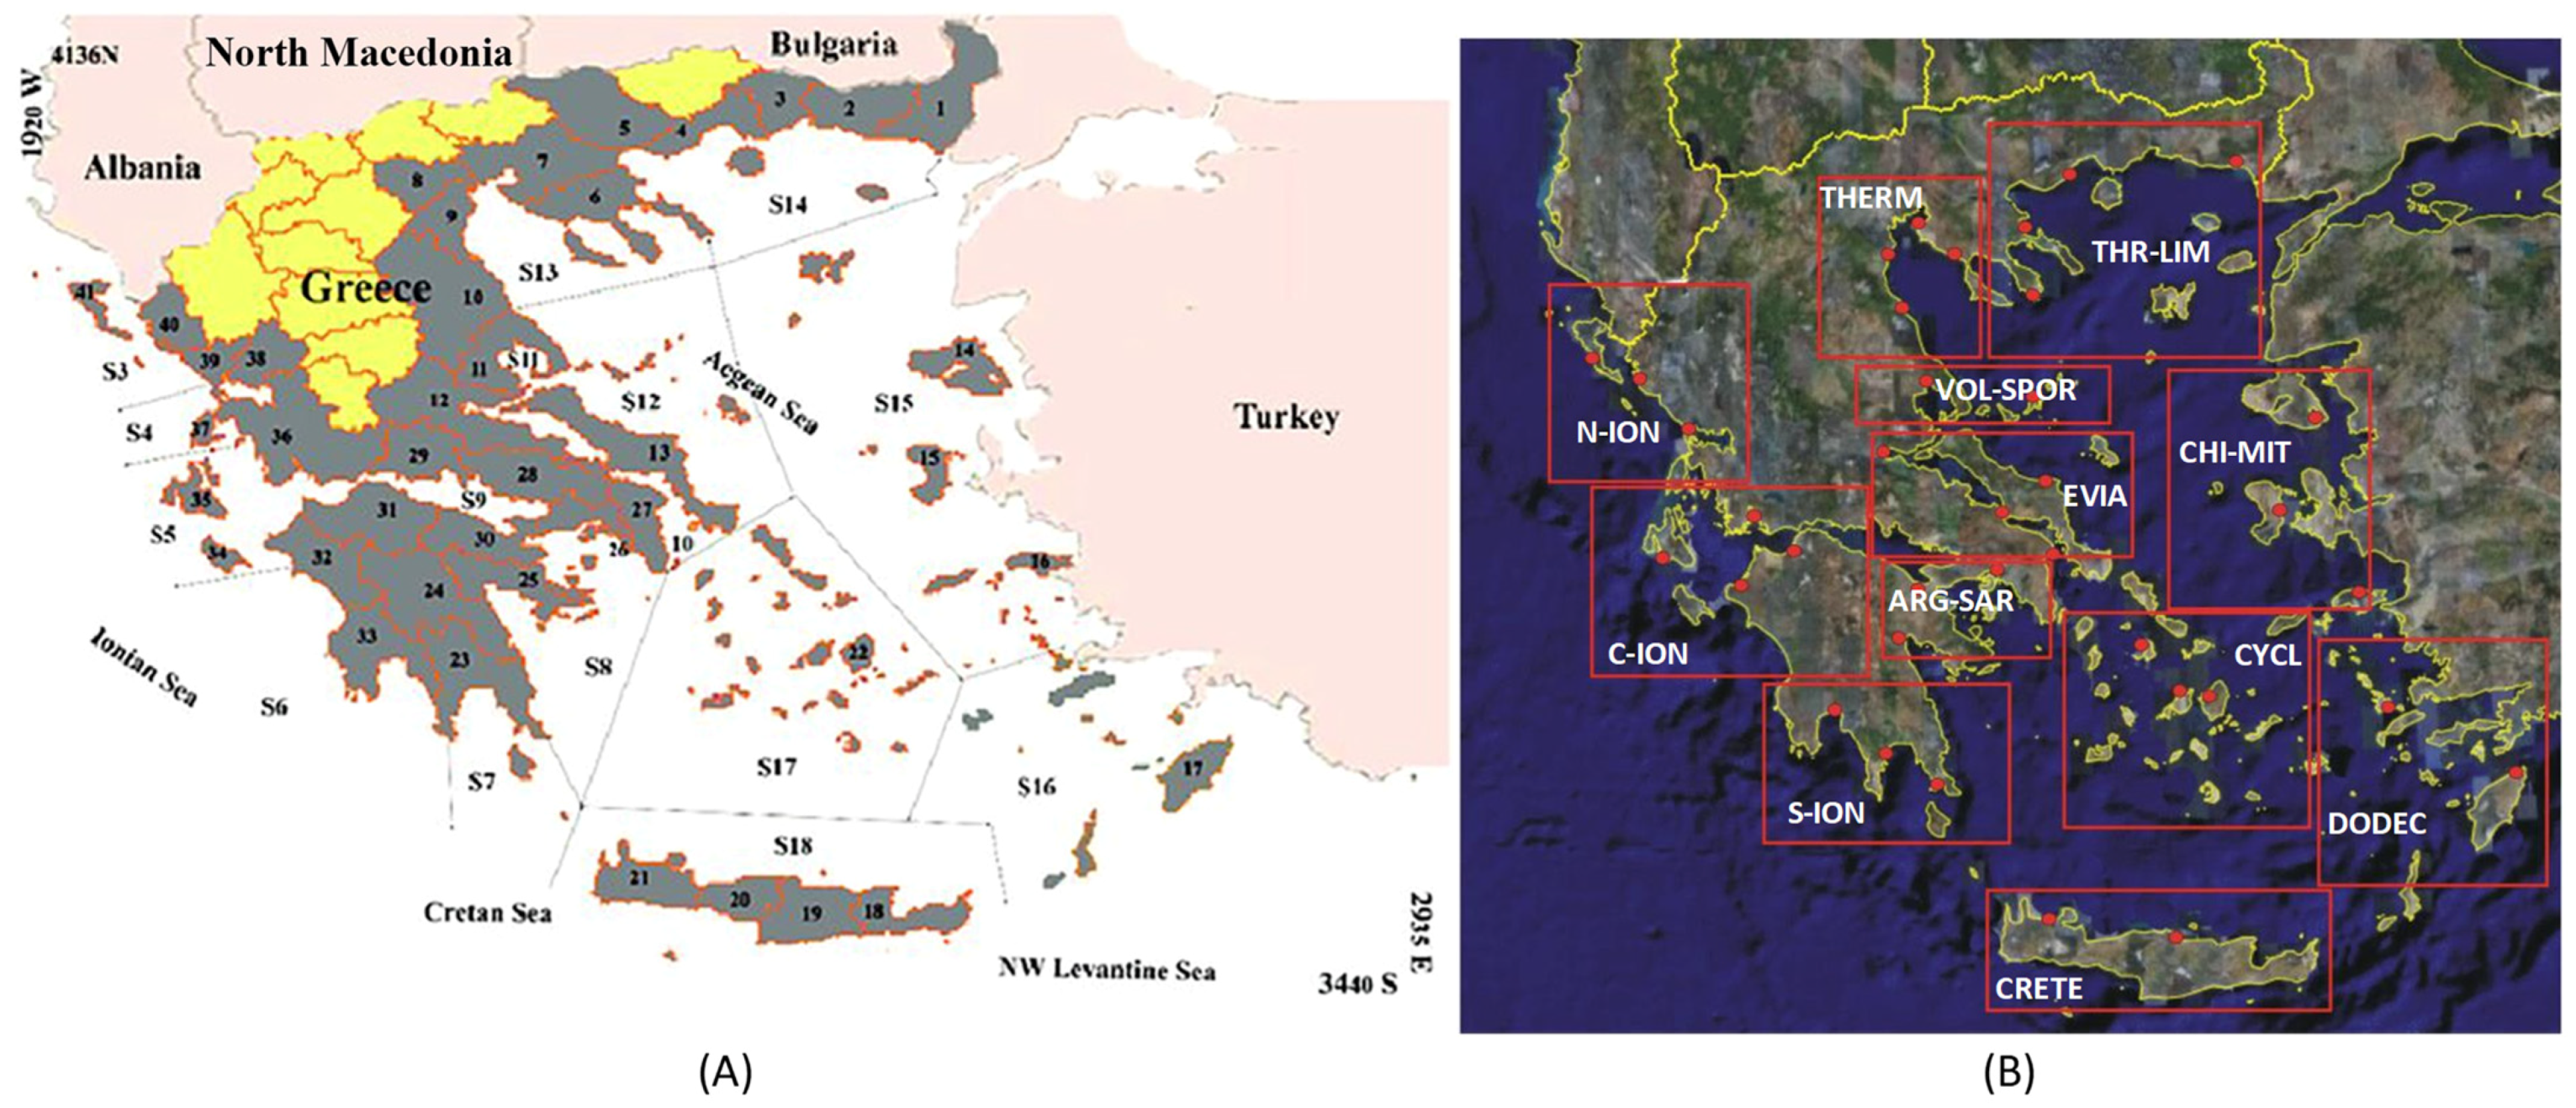
| Area—GSA | DCF—EPSAD | CMFO Fish Landing Sites | |
|---|---|---|---|
| Ionian Sea—20 | N-ION | North Ionian Sea | Preveza |
| C-ION | Central Ionian Sea | Patras, Messolonghi | |
| S-ION | South Ionian Sea | - | |
| Aegean Sea—22 | THR-LIM | Thrace and Lemnos | Kavala, Alexandroupolis |
| THERM | Thermaikos | Thessaloniki | |
| VOL-SPOR | Volos and Sporades | Volos | |
| CHI-MIT | Chios and Lesbos | Chios | |
| EVIA | Evia | Chalkida | |
| ARGSAR | Argosaronikos | Piraeus | |
| CYCL | Cyclades | - | |
| DODEC | Dodecanese | Kalimnos | |
| Crete—23 | CRETE | Crete | Chania |
| Year | Fisheries (Tonnes) | Aquaculture (Tonnes) | Imports (Tonnes) | Exports (Tonnes) | Apparent Consumption (Tonnes) | Per Capita Consumption (kg) |
|---|---|---|---|---|---|---|
| 2017 | 62,347.10 | 106,230.00 | 19,281.00 | 120,891.00 | 66,967.10 | 6.39 |
| 2018 | 62,065.20 | 110,239.60 | 26,259.00 | 122,421.00 | 76,142.80 | 7.26 |
| 2019 | 67,107.80 | 104,944.00 | 31,624.67 | 125,779.40 | 77,897.06 | 7.43 |
| 2020 | 55,884.90 | 112,914.70 | 27,709.47 | 132,542.40 | 63,966.63 | 6.10 |
| 2021 | 45,833.20 | 130,062.40 | 28,521.14 | 139,256.80 | 65,159.94 | 6.22 |
Disclaimer/Publisher’s Note: The statements, opinions and data contained in all publications are solely those of the individual author(s) and contributor(s) and not of MDPI and/or the editor(s). MDPI and/or the editor(s) disclaim responsibility for any injury to people or property resulting from any ideas, methods, instructions or products referred to in the content. |
© 2024 by the authors. Licensee MDPI, Basel, Switzerland. This article is an open access article distributed under the terms and conditions of the Creative Commons Attribution (CC BY) license (https://creativecommons.org/licenses/by/4.0/).
Share and Cite
Roussos, E.; Triantaphyllidis, G.; Ilia, V.; Tsagarakis, K.; Machias, A.; Tziveleka, L.-A.; Roussis, V.; Ioannou, E.; Kotzamanis, Y. Status of Fishery Discards and By-Products in Greece and Potential Valorization Scenarios towards a National Exploitation Master Plan. Mar. Drugs 2024, 22, 264. https://doi.org/10.3390/md22060264
Roussos E, Triantaphyllidis G, Ilia V, Tsagarakis K, Machias A, Tziveleka L-A, Roussis V, Ioannou E, Kotzamanis Y. Status of Fishery Discards and By-Products in Greece and Potential Valorization Scenarios towards a National Exploitation Master Plan. Marine Drugs. 2024; 22(6):264. https://doi.org/10.3390/md22060264
Chicago/Turabian StyleRoussos, Efstratios, George Triantaphyllidis, Vassiliki Ilia, Konstantinos Tsagarakis, Athanasios Machias, Leto-Aikaterini Tziveleka, Vassilios Roussis, Efstathia Ioannou, and Yannis Kotzamanis. 2024. "Status of Fishery Discards and By-Products in Greece and Potential Valorization Scenarios towards a National Exploitation Master Plan" Marine Drugs 22, no. 6: 264. https://doi.org/10.3390/md22060264
APA StyleRoussos, E., Triantaphyllidis, G., Ilia, V., Tsagarakis, K., Machias, A., Tziveleka, L.-A., Roussis, V., Ioannou, E., & Kotzamanis, Y. (2024). Status of Fishery Discards and By-Products in Greece and Potential Valorization Scenarios towards a National Exploitation Master Plan. Marine Drugs, 22(6), 264. https://doi.org/10.3390/md22060264