Article

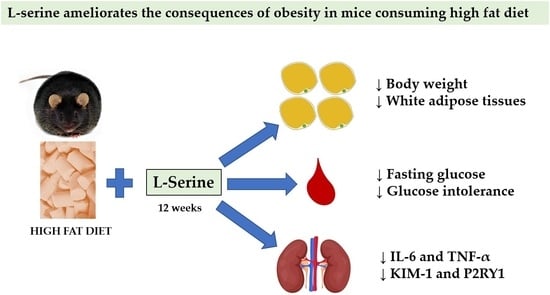
Twelve Weeks of Oral L-Serine Supplementation Improves Glucose Tolerance, Reduces Visceral Fat Pads, and Reverses the mRNA Overexpression of Renal Injury Markers KIM-1, IL-6, and TNF-α in a Mouse Model of Obesity

1
School of Pharmacy and Pharmacology, University of Tasmania, Hobart, TAS 7001, Australia
2
School of Health Sciences, University of Tasmania, Launceston, TAS 7248, Australia
3
Department of Medical, Oral and Biotechnology Sciences “G.D’Annunzio”, 66100 Chieti, Italy
4
Faculty of Health, Southern Cross University, Gold Coast, QLD 4225, Australia
5
School of Science, STEM College, RMIT University, Bundoora, VIC 3083, Australia
6
Tasmanian Institute of Agriculture, University of Tasmania, Newnham, TAS 7248, Australia
7
Istituto di Formazione e Ricerca in Scienze Algologiche (ISAL), Torre Pedrera, 47922 Rimini, Italy
*
Author to whom correspondence should be addressed.
Nutraceuticals 2023, 3(2), 262-273; https://doi.org/10.3390/nutraceuticals3020021
Submission received: 2 February 2023 / Revised: 8 May 2023 / Accepted: 17 May 2023 / Published: 24 May 2023

Abstract

:
Comorbidities associated with obesity, including diabetes and kidney diseases, greatly increase mortality rates and healthcare costs in obese patients. Studies in animal models and clinical trials have demonstrated that L-serine supplementation is a safe and effective therapeutic approach that ameliorates the consequences of obesity. However, little is known about the effects of L-Serine supplementation following high-fat diet (HFD) consumption and its role in the mRNA expression of markers of kidney injury. We provide a descriptive action by which L-serine administration ameliorated the consequences of HFD consumption in relation to weight loss, glucose homeostasis as well as renal mRNA expression of markers of kidney injury. Our results indicated that L-Serine supplementation in drinking water (1%, ad libitum for 12 weeks) in male C57BL/6J mice promoted a significant reduction in body weight, visceral adipose mass (epididymal and retroperitoneal fat pads) as well as blood glucose levels in mice consuming a HFD. In addition, the amino acid significantly reduced the mRNA expression of the Kidney Injury Marker 1 (KIM-1), P2Y purinoceptor 1 (P2RY1), as well as pro-inflammatory cytokines (IL-6 and TNFα). L-serine administration had no effect on mice consuming a standard chow diet. Collectively, our findings suggest that L-serine is an effective compound for long-term use in animal models and that it ameliorates the metabolic consequences of HFD consumption and reduces the elevated levels of renal pro-inflammatory cytokines occurring in obesity.

Graphical Abstract

1. Introduction

Over the last decade, anti-obesity drug discovery programs have increasingly aimed to identify novel drug targets as a response to the consequences of an obesogenic environment in the developed and developing world [1]. Preclinical and clinical investigations have clearly demonstrated that comorbidities associated with obesity, including cardiovascular and kidney diseases, diabetes, and some cancers, greatly increase mortality rates of obese patients as well as public healthcare costs [2,3]. Among several emerging therapeutic compounds, L-serine supplementation has produced promising anti-obesity results [4,5,6], and it is generally considered safe by the Food and Drug Administration (FDA) [7]. L-serine is an important proteinogenic amino acid, and it is classified as a nutritionally non-essential (dispensable) amino acid, which plays several metabolic roles in a broad range of cellular processes, including protein, sphingolipids, and phospholipids synthesis as well as neurotransmission [5].
Recent interest has turned to understanding the role of L-serine deficiency in patients with diabetes mellitus [8]. In children with type 1 diabetes (T1D), plasma concentrations of L-serine were decreased by 42% compared to controls [9]. Similar results were also reported in patients with type 2 diabetes (T2D) [10,11]. Interestingly, postprandial levels of L-serine were reduced in patients with T2D compared to non-diabetic controls [12]. In addition, L-serine deficiency plays a role in diabetic neuropathy [5], and recent evidence suggests that an altered L-serine metabolism could lead to the production of a-typical sphingolipids, termed 1-deoxysphingolipids (1-DSL), which are significantly elevated in patients with impaired fasting glucose and T2D [13,14]. Indeed, there is evidence that high doses of L-serine reduce 1-DSL levels in mice as well as patients with hereditary sensory autonomic neuropathy type 1, potentially slowing disease progression [15,16]. In a recent study, high L-serine concentrations have also been correlated with improved insulin secretion and sensitivity in non-diabetic men aged between 45 and 73 years and associated with improved glucose tolerance after a 2-h oral glucose tolerance test [17].
Current literature suggests there is a link between impaired metabolism of L-serine and renal functions [18,19]. For instance, plasma concentrations of L-serine decrease in patients with chronic renal disease while concentrations of its enantiomer, D-serine, increase [18]. Concurrently, there is evidence of elevated concentrations of both IL-6 and TNF-α in renal disease [20] associated with the alteration of the Kidney Injury Molecule 1 (KIM-1), a promising biomarker in preclinical kidney toxicity evaluation and in various human kidney diseases [21]. Purinergic signaling is also highly involved in renal functions, as multiple purinergic receptors are expressed in all segments of the nephron and renal cells [22]. Among those receptors, specifically, P2 receptors and its subtype P2Y1R, have been associated with endothelial dysfunction in kidney disease [23,24].
Little is known about the effects of L-serine supplementation following HFD consumption and its role in the mRNA expression of markers of kidney injury. Thus, we investigated whether L-serine supplementation would have a beneficial and preventive effect on the metabolic consequences of HFD consumption in mice. In addition, we measured the renal mRNA expression of kidney injury marker KIM-1 as well as proinflammatory cytokines, including IL-6 and TNF-α.

2. Materials and Methods

2.1. Ethics Statement

This study was approved by the Animal Ethics Committee of the University of Tasmania (A0017915) and conducted in accordance with the Tasmanian Animal Welfare Act (1993/63) and the Australian Code for the Care and Use of Animals for scientific purposes.

2.2. Animals, Diet, and L-Serine Supplementation

Male C57BL/6J mice (n = 36, 5-week-old, Animal Services, University of Tasmania) were housed at 20 ± 2 °C and maintained on a 12:12 h light/dark cycle. After one week of acclimatization, one group of mice was fed a standard chow diet (12.8 MJ/kg, 6% fat, 20% protein, 3.2% crude fiber, Barastoc, Melbourne, VIC, Australia), whilst the other group was fed a commercial high-fat pelleted diet (HFD) (19.4 MJ/kg, 23.5% fat, 23% protein, 5.4% crude fiber, Specialty Feeds, Glen Forest, Western Australia) ad libitum. After 5 weeks, within each dietary cohort, half of the mice received L-serine in their drinking water at 1% (wt/vol) ad libitum, while the control group received only water, as previously reported [25,26,27,28,29]. This yielded 4 groups: chow, chow + L-serine, HFD, and HFD + L-serine. Dietary and L-serine intervention continued for 12 weeks. During the study, body weight, energy, and drinking intake were recorded weekly. Mice were euthanized via carbon dioxide inhalation for tissue collection. After euthanasia, mice kidneys were removed, frozen in liquid nitrogen then stored at −80 °C for determination of gene expression. Epididymal white adipose tissue (WAT) and retroperitoneal WAT (Rp WAT) were dissected and weighed.

2.3. Glucose Tolerance Test

A glucose tolerance test (GTT) was performed at 3 distinct time points: prior to the start of L-serine administration, after 4 four weeks of L-serine administration, and at the end of the experiment after 12 weeks of L-serine administration. Mice were fasted for 14 hours (7:00 p.m.–9:00 a.m.) prior to GTT. A blood sample was collected from the tail tip to establish baseline glucose levels (T0) using a glucose meter (Accu-Chek Performa II handheld glucose meter (Cat# 279873, Roche, Basel, Switzerland)). Mice were then administered 2 g glucose/kg body weight (i.p.). Blood glucose levels were measured at 15, 30, 60, 90, and 120 min and expressed as glucose levels above baseline, T0, when mice were injected with glucose. The area under the curve (AUC) was calculated for each mouse.

2.4. RT-qPCR Assay

Frozen organs were used to extract and purify total RNA using the ISOLATE II RNA Mini kit (Cat# BIO-52073, Meridian Bioscience, Cincinnati, OH, USA) according to the manufacturer’s recommendations. A NanoDrop One Microvolume UV-Vis Spectrophotometer (Cat# 13400519, Thermo Scientific, Waltham, MA, USA) was used to quantify the RNA concentration and purity ratios (A260/280 and A260/230). RNA template (1 µg) from each sample was reverse transcribed into cDNA using a high-capacity cDNA reverse transcription kit (Cat# 4368814, Applied Biosystem, Waltham, MA, USA). All primers were purchased from Kicqstart SYBR Green Primers (Cat# KSPQ12012, Sigma-Aldrich, St. Louis, MO, USA). The sequence of the primers used for quantification of gene expression of IL-6, TNF-α, HAVCR1 (KIM-1), P2RY1, and GAPDH can be found in Supplementary Table S1. RT-qPCR reactions were performed using PowerUp SYBR green master mix (Cat# A25780, Applied Biosystems, Waltham, MA, USA) in a StepOnePlus real-time PCR system (Applied Biosystems, 4376599, US) following the manufacturer’s instructions. The amplification program included an initial denaturation step at 95 °C for 7 min, followed by 40 cycles of 15 s at 95 °C, 15 s at 60 °C, and 15 s at 72 °C, then 72 °C for 10 min 20 s for the holding step. Transcription levels of the genes of interest were then normalized to GAPDH as a reference housekeeping gene. The expression of the housekeeping gene across all the treatment groups was tested before embarking on the PCR analysis and showed consistent Ct values across all groups for each of the tissues studied. The PCR amplification efficiency was assessed by applying a visual assessment method [30,31,32]. An analysis for RT-qPCR was performed using the ΔΔCT method [33].

2.5. Statistical Analysis

Data analysis was performed using GraphPad Prism version 8.3.0 for Windows (GraphPad Software, San Diego, CA, USA, www.graphpad.com (accessed on 10 November 2022)), and results were expressed as mean ± SEM. Statistical significance was determined by unpaired Student’s t-test between two groups while body weight, GTT, and Insulin tolerance test (ITT) were analyzed by three-way ANOVA with animal diet, L-serine effect, and time points as factors. Visceral adipose fat, fasting glucose levels, the area under the curve from GTT and ITT, and mRNA expression levels were performed by two-way ANOVA with animal diet and L-serine treatment as factors. ANOVA results were then followed by a post hoc analysis using Fisher’s least significant difference test (LSD) as appropriate. Results were considered statistically significant when p < 0.05.

3. Results

3.1. Effects of L-Serine Supplementation on Body Weight, Energy Intake, and Adiposity

Mice consuming a HFD had higher body weight gain over the study period compared to the standard chow diet groups (chow and chow+ L-serine) vs. (HFD and HFD+ L-serine) [F(3,384) = 95.62; p < 0.05]. L-serine supplementation significantly reduced body weight gain only in mice consuming a HFD [−8.51%; p < 0.05]. The reduced body weight gain reached significance after nine weeks of L-serine treatment and was maintained until the end of the experiment (Figure 1A).
Over the experimental period, mice consuming a HFD had a higher energy intake compared to the chow group [F(3,384) = 31.19; p < 0.05; Figure 2B]; however, L-serine supplementation did not impact the cumulative energy intake in both dietary cohorts (Figure 1B).
Significant effects of L-serine supplementation were also observed across two adipose tissue depots, including visceral fat pads (epididymal and retroperitoneal fat). Overall, HFD increased epididymal and retroperitoneal fat pads (chow and chow+ L-serine) vs. (HFD and HFD+ L-serine) [F(3,21) = 15.99; p < 0.05; Figure 1C,D]; after 12 weeks of treatment, L-serine treatment reduced retroperitoneal WAT [−23.94%; F(3,30) = 20.64; p < 0.05, Figure 1C] as well as epididymal WAT [−23.12%; F(3,32) = 16.91; p < 0.05, Figure 1D] only in mice consuming a HFD. L-serine treatment did not reduce these adipose tissue depots in mice on the standard chow diet.

3.2. Effects of L-Serine Supplementation on Glucose Metabolism

Prior to the start of L-serine administration, HFD consumption significantly increased fasting glucose levels [23.93%; t = 4.838, df = 38; p < 0.05; Figure 2A], [F(3,31) = 31.73; p < 0.05; Figure 2B], [42.15%; F(3,28) = 20.60; p < 0.05; Figure 2C]).
After 4 weeks of L-serine administration, there was no significant effect of the amino acid in the treated groups (Figure 2D–F). However, after 12 weeks of serine administration, mice consuming a HFD and treated with L-serine had significantly lower blood glucose levels compared to the control [−13.9%; p < 0.05; Figure 2G]. Overall, HFD consumption increased glucose levels (chow and chow+ L-serine) vs. (HFD and HFD+ L-serine) [F(3,35) = 49.52 p < 0.05; Figure 2H]. The AUC was increased only in mice consuming a HFD (chow and chow+ L-serine) vs. (HFD and HFD+ L-serine) [F(3,34) = 46.62; p < 0.05; Figure 2I] and L-serine supplementation significantly reduced these levels after 12 weeks of treatment [−15.73%; p < 0.05; Figure 2I].

3.3. Effects of L-Serine Supplementation on Renal Gene Expression

Overall, HFD increased the renal mRNA expression of Interleukin 6 (IL-6) [n = 8; F(3,21) = 9.731; p < 0.05; Figure 3A], Tumor necrosis factor α (TNF-α) [n = 8; F(3,21) = 4.096; p < 0.05; Figure 3B], Kidney Injury Molecule-1 (KIM-1) [n = F(3,24) = 14.15; p < 0.05; Figure 3C], and P2Y purinoceptor 1 (P2RY1) [n = 10; F(3,27) = 8.926; p < 0.05; Figure 3D]. However, in mice consuming a HFD, L-serine supplementation downregulated the mRNA expression of IL-6 [−60.63%; p < 0.05, Figure 3A], TNF-α [−50.05%; p < 0.05, Figure 3B], KIM-1 [n = 6–9; −64.48%; p < 0.05, Figure 3C], and P2RY1 [n = 8; −23.21%; p < 0.05, Figure 3D].

4. Discussion

In this study, we investigated the metabolic effects of L-serine supplementation in drinking water (1% [w/v], ad libitum for 12 weeks) in male C57BL/6J mice fed either a standard chow diet or a commercial HFD. Overall, L-serine supplementation resulted in a significant reduction in body weight, visceral adipose mass (epididymal and retroperitoneal fat pads) as well as blood glucose levels in mice consuming a HFD. In addition, we performed gene expression studies of markers of kidney injury (KIM-1 and P2Y1R) as well as pro-inflammatory cytokines (IL-6 and TNFα), which demonstrated that L-serine administration reversed the detrimental impact of a HFD in the kidneys. Critically, we found that L-serine supplementation had no effect on mice consuming a standard chow diet.
Over the experimental period, L-serine administration induced a significant reduction in body weight in mice consuming a HFD (−8.50%) compared to their control group. Weight loss reached significance after 9 weeks of treatment, and it was maintained until the end of the experiment. Our results are in line with previous literature in which L-serine administration (0.5% [w/v]) for 6 months reduced food intake and body weight gain in aging mice (18 months old) [34]. These authors reported that long-term administration of 0.5% [w/v] L-serine significantly downregulated the hypothalamic expression of orexigenic markers such as NPY and AGRP, which are known to increase food intake [35,36]. However, in our study, L-serine administration did not affect the energy intake of any dietary group, though we did find it reduced adiposity in mice consuming a HFD (24% reduction in retroperitoneal WAT as well as 23% reduction in epididymal WAT). Our results suggest that the amino acid L-serine could potentially affect some of the homeostatic mechanisms related to the control of energy expenditure. Unfortunately, we were unable to measure energy expenditure in our study. However, previous literature supports our theory by providing evidence that long-term 1% L-serine supplementation was able to blunt fasting-induced body weight regain in obese mice based on elevated brown adipose tissue activity [4]. Specifically, with the use of metabolic cages, the authors reported that L-serine supplementation resulted in increased brown fat thermogenesis, which prevented body weight regain following an overnight fast. Collectively, this previous study and our current results suggest that L-serine supplementation could be used as a complementary option in new therapeutic approaches after weight-loss interventions for pre-diabetic patients [4].
A growing body of research suggests that L-serine is involved in the development of diabetes mellitus and its related complications [8]. Higher L-serine concentrations have been correlated with improved insulin secretion and sensitivity as well as improved glucose tolerance after a 2-h oral glucose tolerance test [17]. On the other hand, L-serine concentration has, in several studies, been found to be significantly decreased in children with T1D [9] as well as in patients with T2D [11]. Based on the results of this recent scientific literature, we tested the effect of oral 1% L-serine supplementation on glucose homeostasis. We performed GTTs throughout our experiment and found that at the beginning of the treatment, prior to the start of the L-serine supplementation, HFD consumption significantly increased glucose levels in comparison to the standard chow diet. After 4 weeks of L-serine supplementation, there was no significant effect of the amino acid in the treated groups, chow + L-serine nor HFD + L-serine. However, after 12 weeks of L-serine supplementation, mice consuming the HFD and treated with L-serine had significantly lower blood glucose levels compared to the control (−13.9%). Similar to our results, L-serine treatment in female non-obese diabetic (NOD) mice reduced insulitis and diabetes incidence (43%) compared to controls, and this was accompanied by an improved GTT, reduced HOMA-IR, and reduced blood glucose levels [37].
In another investigation on the long-term effects of L-serine supplementation, the L-serine supplementation protected mice from HFD-induced insulin resistance [37]. Mechanistically, the authors of this study suggested that this effect could be linked to the activation of the AMPK pathway known to regulate insulin sensitivity and glucose intake and disposal [37,38]. In support of our results, in a prospective population-based study of 5181 Finnish men, high L-serine concentrations were correlated with improved insulin secretion and sensitivity in non-diabetic men aged between 45 and 73 years, and they were also associated with improved glucose tolerance after a 2-h oral GTT [17]. Furthermore, recent evidence suggests that altering L-serine metabolism could lead to the production of a-typical sphingolipids, 1-DSL, which are significantly elevated in patients with impaired fasting glucose, metabolic syndrome (MetS), and T2D [13,14].
Previous literature has demonstrated that 1-DSL are involved in the apoptosis of pancreatic beta-cell lines and primary islets and directly compromise the functionality of skeletal muscle cells, likely to contribute to the pathophysiology of muscle dysfunction detected in diabetes mellitus [39]. In addition, 1-DSL levels are also elevated in the hereditary condition, sensory autonomic neuropathy type 1 (HSAN1), a rare neurological condition caused by genetic mutations in the enzyme serine palmitoyltransferase (SPT), which results in the increased formation of 1-DSL [40]. It has been demonstrated that high doses of L-serine reduced 1-DSL levels in mice and patients with HSAN1, potentially slowing the disease progression [15,16]. Furthermore, in a recent study, transgenic db/db mice known to develop diabetic neuropathy early in life were fed a 3% serine-enriched diet for 8 weeks [41]. Results from this investigation indicated that L-serine supplementation reduced 1-DSL levels in the plasma, slowing the progression of diabetic peripheral neuropathy, and this was associated with no change in body weight and a slight increase in circulating glucose levels [41].
Similarly, 5% and 20% oral L-serine administration in the same transgenic db/db mouse model over a 6-month period was shown to improve functional neuropathy and sensory modalities, although oxidative damage and hyperglycemia persisted despite 1-DSL reduction [42]. Collectively, these studies in transgenic mice suggest that despite L-serine supplementation reducing 1-DSL levels in plasma and other various tissues, it failed to improve the glucose metabolism within these animals [41]. In our study, whose experimental model was in line with previous investigations [4,37], we observed that L-serine supplementation in drinking water (1% [w/v], ad libitum for 12 weeks) in male C57BL/6J mice consuming a HFD led to a reduction in body weight, visceral adipose mass (epididymal and retroperitoneal fat pads) as well as blood glucose levels. Discrepancies between study findings regarding the effects of L-serine in glucose metabolism could be related to methodological differences, including drug concentration, route of administration, duration of treatment, age, and sex of test subjects [43]. In addition, macro and micronutrient components of the HFD, including carbohydrates, salt, and fiber contents, as well as refined ingredients (casein, corn starch, sucrose, cellulose) [44] might influence the phenotypic differences driven by the diet itself and the research outcomes [45,46].
Further studies are needed to fully elucidate the role of L-serine supplementation in relation to the progression of diabetes mellitus.
As diabetes mellitus is the leading cause of kidney disease, we examined the renal mRNA expression of those markers involved in kidney injury. Over the last two decades, several functional studies in animals have demonstrated that 12 weeks of HFD consumption are sufficient to induce renal functional alterations as well as structural injury to the kidney [47,48]. It is also known that plasma concentrations of L-serine decrease in patients with chronic renal disease while concentrations of its enantiomer, D-serine, increase [18]. In our study, HFD consumption doubled the mRNA levels of KIM-1, a biomarker for various forms of nephrotoxic injury and chronic kidney diseases whose mRNA and protein levels are dramatically increased after acute injury [21] and following HFD consumption [49]. Surprisingly, L-serine treatment significantly reduced the renal mRNA levels of KIM-1, suggesting a protective role of the amino acid during chronic exposure to HFD.
Similarly, we reported that HFD consumption increased the renal mRNA expression of pro-inflammatory cytokines such as IL-6 and TNFα, which are known to be elevated during the deterioration of renal function [50] as well as with HFD consumption [51]. These pro-inflammatory mediators are associated with molecular mechanisms involved in chronic kidney diseases contributing to cellular apoptosis and ultimately to organ damage [52,53]. Our results indicate that L-serine supplementation reduced the mRNA expression of IL-6 and TNF-α induced by chronic HFD consumption. Furthermore, we speculate that L-serine supplementation could assist in the reduction of some pro-inflammatory cytokine levels that might be associated with impaired renal function [5,34].
There is a consensus that purinergic signaling is highly involved in renal functions contributing to the emerging therapeutic targets in kidney diseases [24]. Multiple purinergic receptors are expressed in all segments of the nephron and renal cells [22]. Specifically, renal expression of P2 receptors is found throughout the vasculature and microvasculature and strongly influences renal vessel function [23].
Functional studies in animal models have produced exciting discoveries on the role of the purinergic receptor P2Y1R in endothelial dysfunction in kidney disease. During the inflammatory process occurring in renal disease in rodents, activation of P2Y1R has been associated with glomerular injury, while in animal models, in which the receptor was knocked-down, P2Y1R null mice were protected from acute nephrotoxic injury, showing preserved renal function and enhanced survival [54]. Similarly, in our study, while HFD consumption increased the renal mRNA P2Y1R expression, L-serine supplementation significantly reduced these levels suggesting a plausible protective role of the amino acid in renal vessels. Further studies will be needed to fully elucidate the role of L-serine supplementation in renal injury.
Overall, based on the data presented in this study, we propose a descriptive action by which L-serine supplementation ameliorated the consequences of HFD consumption in relation to weight loss, glucose homeostasis as well as renal mRNA expression of markers of kidney injury. To address the limitations of our study, high-performance liquid chromatography (HPLC) investigations would clarify the pharmacodynamic properties of L-serine administration, including changes in the concentrations of L-serine in blood and kidney as well as L-serine-related metabolites. The use of a “multi-omics” approach, including genomics, proteomics, and metabolomics, would represent a powerful adjunctive tool to increase our mechanistic breadth of understanding in relation to the action(s) of the amino acid. The current study did not decipher the contribution of specific renal cell populations with regard to the mechanisms of action of L-serine in kidney injury. It would be useful for future studies to explore the plasma levels of the amino acid and to measure the glomerular filtration rate as well as the serum creatine levels in order to provide further clarification on the role L-serine supplementation plays in renal function. In addition, quantification of 1-DSL in insulin-sensitive organs, such as skeletal muscle as well as plasma, would also offer a more comprehensive interpretation of the role of L-serine supplementation plays in the context of glucose metabolism. Further mechanistic studies are needed to dissect the interplay between 1-DSL formation and the protective effect of L-serine supplementation in the development of diabetes.
In summary, the present study attempts to provide a descriptive indication by which L-serine supplementation could be used as an integrative option in future therapeutic approaches for weight loss. Our results confirmed previous findings regarding the beneficial properties of L-serine supplementation for weight loss and the reduction of adipose mass [4,5,6,18,37]. We also provided new evidence that L-serine supplementation ameliorates the consequences of HFD consumption by improving glucose homeostasis and reducing the renal mRNA expression of pro-inflammatory cytokines, such as IL-6 and TNF-α, as well as markers of kidney injury, KIM1 and P2Y1R.

Supplementary Materials

The following supporting information can be downloaded at: https://www.mdpi.com/article/10.3390/nutraceuticals3020021/s1, Table S1. Information for genes of interest for RT-qPCR.

Author Contributions

This study was designed and coordinated by V.C., S.S. and D.C.H.; laboratory investigations and statistical analyses were performed by D.T., M.I. and T.A.; the manuscript was designed and prepared by D.T., V.C., D.C.H. and S.S.; the manuscript was revised and commented by R.E., S.M., C.M., C.Y., M.R. and M.Z. All authors have read and agreed to the published version of the manuscript.

Funding

This research received no external funding.

Institutional Review Board Statement

The study was conducted according to the guidelines of the Tasmanian Animal Welfare Act (1993/63) and the Australian Code for the Care and Use of Animals for scientific purposes and approved by the Animal Ethics Committee of the University of Tasmania (A0017915) on 16 June 2020.

Informed Consent Statement

Not applicable.

Data Availability Statement

The raw data supporting the conclusions of this article will be made available by the authors without undue reservation.

Acknowledgments

The authors would like to acknowledge the Animal Services Manager, Paul Scowen, for providing his support with animal work. The authors acknowledge the Animal Services Training Coordinator, Peta Yates, for providing animal handling training. The authors thank the Veterinarian, Alexandre Kreiss, for assistance with the animal ethics application and assistance with the animal work. The authors acknowledge Melissa Aubrey and Robyn Sewell of the University of Tasmania’s School of Pharmacy and Pharmacology and Mandhi Allen, Clare Tanton, Georgina Dalgleish, and Parisa Vahidi of the School of Health Sciences for their technical assistance. The authors appreciate the support of Monica Lu, Michael Yew, and Kenneth Wu for their enthusiastic assistance with the animal work.

Conflicts of Interest

The authors declare no conflict of interest.

References

  1. Bray, G.A.; Fruhbeck, G.; Ryan, D.H.; Wilding, J.P. Management of obesity. Lancet 2016, 387, 1947–1956. [Google Scholar] [CrossRef] [PubMed]
  2. Heymsfield, S.B.; Wadden, T.A. Mechanisms, Pathophysiology, and Management of Obesity. N. Engl. J. Med. 2017, 376, 254–266. [Google Scholar] [CrossRef]
  3. Whitlock, G.; Lewington, S.; Sherliker, P.; Clarke, R.; Emberson, J.; Halsey, J.; Qizilbash, N.; Collins, R.; Peto, R. Body-mass index and cause-specific mortality in 900,000 adults: Collaborative analyses of 57 prospective studies. Lancet 2009, 373, 1083–1096. [Google Scholar] [CrossRef] [PubMed]
  4. López-Gonzales, E.; Lehmann, L.; Ruiz-Ojeda, F.J.; Hernández-Bautista, R.; Altun, I.; Onogi, Y.; Khalil, A.E.; Liu, X.; Israel, A.; Ussar, S. L-Serine Supplementation Blunts Fasting-Induced Weight Regain by Increasing Brown Fat Thermogenesis. Nutrients 2022, 14, 1922. [Google Scholar] [CrossRef]
  5. Holeček, M. Serine Metabolism in Health and Disease and as a Conditionally Essential Amino Acid. Nutrients 2022, 14, 1987. [Google Scholar] [CrossRef]
  6. Jiang, J.; Li, B.; He, W.; Huang, C. Dietary serine supplementation: Friend or foe? Curr. Opin. Pharmacol. 2021, 61, 12–20. [Google Scholar] [CrossRef] [PubMed]
  7. Administration USFD. L-Serine GRAS 172.320. Substances Added to Food (formerly EAFUS), Food Ingredient and Packaging Inventories. 2021. Available online: https://www.cfsanappsexternal.fda.gov/scripts/fdcc/index.cfm?set=FoodSubstances&id=SERINE (accessed on 20 October 2022).
  8. Holm, L.J.; Buschard, K. L-serine: A neglected amino acid with a potential therapeutic role in diabetes. APMIS 2019, 127, 655–659. [Google Scholar] [CrossRef] [PubMed]
  9. Bervoets, L.; Massa, G.; Guedens, W.; Louis, E.; Noben, J.-P.; Adriaensens, P. Metabolic profiling of type 1 diabetes mellitus in children and adolescents: A case–control study. Diabetol. Metab. Syndr. 2017, 9, 48. [Google Scholar] [CrossRef]
  10. Bertea, M.; Rütti, M.F.; Othman, A.; Marti-Jaun, J.; Hersberger, M.; von Eckardstein, A.; Hornemann, T. Deoxysphingoid bases as plasma markers in Diabetes mellitus. Lipids Health Dis. 2010, 9, 84. [Google Scholar] [CrossRef]
  11. Drábková, P.; Šanderová, J.; Kovařík, J.; KanĎár, R. An Assay of Selected Serum Amino Acids in Patients with Type 2 Diabetes Mellitus. Adv. Clin. Exp. Med. 2015, 24, 447–451. [Google Scholar] [CrossRef]
  12. Mook-Kanamori, D.O.; de Mutsert, R.; Rensen, P.C.N.; Prehn, C.; Adamski, J.; den Heijer, M.; le Cessie, S.; Suhre, K.; Rosendaal, F.R.; van Dijk, K.W. Type 2 diabetes is associated with postprandial amino acid measures. Arch. Biochem. Biophys. 2016, 589, 138–144. [Google Scholar] [CrossRef]
  13. Mwinyi, J.; Boström, A.; Fehrer, I.; Othman, A.; Waeber, G.; Marti-Soler, H.; Vollenweider, P.; Marques-Vidal, P.; Schiöth, H.B.; von Eckardstein, A.; et al. Plasma 1-deoxysphingolipids are early predictors of incident type 2 diabetes mellitus. PLoS ONE 2017, 12, 0175776. [Google Scholar] [CrossRef]
  14. Alaa Othman, A.; Saely, C.H.; Muendlein, A.; Vonbank, A.; Drexel, H.; von Eckardstein, A.; Hornemann, T. Plasma 1-deoxysphingolipids are predictive biomarkers for type 2 diabetes mellitus. BMJ Open Diabetes Res. Care 2015, 3, 000073. [Google Scholar] [CrossRef]
  15. Garofalo, K.; Penno, A.; Schmidt, B.P.; Lee, H.-J.; Frosch, M.P.; von Eckardstein, A.; Brown, R.H.; Hornemann, T.; Eichler, F.S. Oral l-serine supplementation reduces production of neurotoxic deoxysphingolipids in mice and humans with hereditary sensory autonomic neuropathy type 1. J. Clin. Investig. 2011, 121, 4735–4745. [Google Scholar] [CrossRef] [PubMed]
  16. Fridman, V.; Suriyanarayanan, S.; Novak, P.; David, W.; Macklin, E.A.; McKenna-Yasek, D.; Walsh, K.; Aziz-Bose, R.; Oaklander, A.L.; Brown, R.; et al. Randomized trial of l-serine in patients with hereditary sensory and autonomic neuropathy type 1. Neurology 2019, 92, e359–e370. [Google Scholar] [CrossRef] [PubMed]
  17. Vangipurapu, J.; Stancáková, A.; Smith, U.; Kuusisto, J.; Laakso, M. Nine Amino Acids Are Associated With Decreased Insulin Secretion and Elevated Glucose Levels in a 7.4-Year Follow-up Study of 5181 Finnish Men. Diabetes 2019, 68, 1353–1358. [Google Scholar] [CrossRef]
  18. Kimura, T.; Hesaka, A.; Isaka, Y. D-Amino acids and kidney diseases. Clin. Exp. Nephrol. 2020, 24, 404–410. [Google Scholar] [CrossRef]
  19. Ceballos, I.; Chauveau, P.; Guerin, V.; Bardet, J.; Parvy, P.; Kamoun, P.; Jungers, P. Early alterations of plasma free amino acids in chronic renal failure. Clin. Chim. Acta 1990, 188, 101–108. [Google Scholar] [CrossRef]
  20. Stenvinkel, P.; Ketteler, M.; Johnson, R.J.; Lindholm, B.; Pecoits-Filho, R.; Riella, M.; Heimbürger, O.; Cederholm, T.; Girndt, M. IL-10, IL-6, and TNF-α: Central factors in the altered cytokine network of uremia—The good, the bad, and the ugly. Kidney Int. 2005, 67, 1216–1233. [Google Scholar] [CrossRef]
  21. Bonventre, J.V.; Yang, L. Kidney injury molecule-1. Curr. Opin. Crit. Care 2010, 16, 556–561. [Google Scholar] [CrossRef]
  22. Menzies, R.I.; Unwin, R.J.; Bailey, M.A. Renal P2 receptors and hypertension. Acta Physiol. 2015, 213, 232–241. [Google Scholar] [CrossRef] [PubMed]
  23. Inscho, E.W. ATP, P2 receptors and the renal microcirculation. Purinergic Signal 2009, 5, 447–460. [Google Scholar] [CrossRef] [PubMed]
  24. Menzies, R.I.; Tam, F.W.; Unwin, R.J.; Bailey, M.A. Purinergic signaling in kidney disease. Kidney Int. 2017, 91, 315–323. [Google Scholar] [CrossRef]
  25. Ahren, B.; Larsson, H.; Holst, J.J. Effects of glucagon-like peptide-1 on islet function and insulin sensitivity in noninsulin-dependent diabetes mellitus. J. Clin. Endocrinol. Metab. 1997, 82, 473–478. [Google Scholar] [CrossRef]
  26. Winzell, M.S.; Ahrén, B. The high-fat diet–fed mouse: A model for studying mechanisms and treatment of impaired glucose tolerance and type 2 diabetes. Diabetes 2004, 53, S215–S219. [Google Scholar] [CrossRef]
  27. Ahrén, B.; Holst, J.J.; Mårtensson, H.; Balkan, B. Improved glucose tolerance and insulin secretion by inhibition of dipeptidyl peptidase IV in mice. Eur. J. Pharmacol. 2000, 404, 239–245. [Google Scholar] [CrossRef]
  28. Lin, S.; Thomas, T.; Storlien, L.; Huang, X. Development of high fat diet-induced obesity and leptin resistance in C57Bl/6J mice. Int. J. Obes. 2000, 24, 639. [Google Scholar] [CrossRef] [PubMed]
  29. Steppan, C.M.; Bailey, S.T.; Bhat, S.; Brown, E.J.; Banerjee, R.R.; Wright, C.M.; Patel, H.R.; Ahima, R.S.; Lazar, M.A. The hormone resistin links obesity to diabetes. Nature 2001, 409, 307. [Google Scholar] [CrossRef]
  30. Ramakers, C.; Ruijter, J.M.; Deprez, R.H.L.; Moorman, A.F.M. Assumption-free analysis of quantitative real-time polymerase chain reaction (PCR) data. Neurosci. Lett. 2003, 339, 62–66. [Google Scholar] [CrossRef]
  31. Kontanis, E.J.; Reed, F.A. Evaluation of Real-Time PCR Amplification Efficiencies to Detect PCR Inhibitors. J. Forensic Sci. 2006, 51, 795–804. [Google Scholar] [CrossRef]
  32. Efficiency of Real-Time PCR. Available online: https://www.thermofisher.com/au/en/home/life-science/pcr/real-time-pcr/real-time-pcr-learning-center/real-time-pcr-basics/efficiency-real-time-pcr-qpcr.html (accessed on 14 April 2023).
  33. Livak, K.J.; Schmittgen, T.D. Analysis of relative gene expression data using real-time quantitative PCR and the 2(-Delta Delta C(T)) Method. Methods 2001, 25, 402–408. [Google Scholar] [CrossRef] [PubMed]
  34. Zhou, X.; Zhang, H.; He, L.; Wu, X.; Yin, Y. Long-Term l-Serine Administration Reduces Food Intake and Improves Oxidative Stress and Sirt1/NFκB Signaling in the Hypothalamus of Aging Mice. Front. Endocrinol. 2018, 9, 476. [Google Scholar] [CrossRef] [PubMed]
  35. Levine, A.S.; Morley, J.E. Neuropeptide Y: A potent inducer of consummatory behavior in rats. Peptides 1984, 5, 1025–1029. [Google Scholar] [CrossRef] [PubMed]
  36. Essner, R.A.; Smith, A.G.; Jamnik, A.A.; Ryba, A.R.; Trutner, Z.D.; Carter, M.E. AgRP Neurons Can Increase Food Intake during Conditions of Appetite Suppression and Inhibit Anorexigenic Parabrachial Neurons. J. Neurosci. 2017, 37, 8678–8687. [Google Scholar] [CrossRef] [PubMed]
  37. Holm, L.J.; Haupt-Jorgensen, M.; Larsen, J.; Giacobini, J.D.; Bilgin, M.; Buschard, K. L-serine supplementation lowers diabetes incidence and improves blood glucose homeostasis in NOD mice. PLoS ONE 2018, 13, e0194414. [Google Scholar] [CrossRef]
  38. Zhou, X.; He, L.; Zuo, S.; Zhang, Y.; Wan, D.; Long, C.; Huang, P.; Wu, X.; Wu, C.; Liu, G.; et al. Serine prevented high-fat diet-induced oxidative stress by activating AMPK and epigenetically modulating the expression of glutathione synthesis-related genes. Biochim. Biophys. Acta, Mol. Basis Dis 2018, 1864, 488–498. [Google Scholar] [CrossRef]
  39. Tran, D.; Myers, S.; McGowan, C.; Henstridge, D.; Eri, R.; Sonda, S.; Caruso, V. 1-Deoxysphingolipids, early predictors of type 2 diabetes, compromise the functionality of skeletal myoblasts. Front. Endocrinol. 2021, 1784. [Google Scholar] [CrossRef]
  40. Rotthier, A.; Auer-Grumbach, M.; Janssens, K.; Baets, J.; Penno, A.; Almeida-Souza, L.; Van Hoof, K.; Jacobs, A.; De Vriendt, E.; Schlotter-Weigel, B.; et al. Mutations in the SPTLC2 subunit of serine palmitoyltransferase cause hereditary sensory and autonomic neuropathy type I. Am. J. Hum. Genet. 2010, 87, 513–522. [Google Scholar] [CrossRef]
  41. Handzlik, M.K.; Gengatharan, J.M.; Frizzi, K.E.; McGregor, G.H.; Martino, C.; Rahman, G.; Gonzalez, A.; Moreno, A.M.; Green, C.R.; Guernsey, L.S.; et al. Insulin-regulated serine and lipid metabolism drive peripheral neuropathy. Nature 2023, 614, 118–124. [Google Scholar] [CrossRef]
  42. Xia, C.; Suriyanarayanan, S.; Gong, Y.; Fridman, V.; Selig, M.; Li, J.; Rutkove, S.; Hornemann, T.; Eichler, F. Long-term effects of l-serine supplementation upon a mouse model of diabetic neuropathy. J. Diabetes Complicat. 2023, 37, 108383. [Google Scholar] [CrossRef]
  43. Peers, I.S.; Ceuppens, P.R.; Harbron, C. In search of preclinical robustness. Nat. Rev. Drug Discov. 2012, 11, 733–734. [Google Scholar] [CrossRef] [PubMed]
  44. Pellizzon, M.A.; Ricci, M.R. The common use of improper control diets in diet-induced metabolic disease research confounds data interpretation: The fiber factor. Nutr. Metab. 2018, 15, 3. [Google Scholar] [CrossRef] [PubMed]
  45. Lang, P.; Hasselwander, S.; Li, H.; Xia, N. Effects of different diets used in diet-induced obesity models on insulin resistance and vascular dysfunction in C57BL/6 mice. Sci. Rep. 2019, 9, 19556. [Google Scholar] [CrossRef] [PubMed]
  46. Bortolin, R.C.; Vargas, A.R.; Gasparotto, J.; Chaves, P.R.; Schnorr, C.E.; Martinello, K.B.; Silveira, A.K.; Rabelo, T.K.; Gelain, D.P.; Moreira, J.C.F. A new animal diet based on human Western diet is a robust diet-induced obesity model: Comparison to high-fat and cafeteria diets in term of metabolic and gut microbiota disruption. Int. J. Obes. 2018, 42, 525–534. [Google Scholar] [CrossRef]
  47. Sánchez-Navarro, A.; Martínez-Rojas, M.Á.; Caldiño-Bohn, R.I.; Pérez-Villalva, R.; Zambrano, E.; Castro-Rodríguez, D.C.; Bobadilla, N.A. Early triggers of moderately high-fat diet-induced kidney damage. Physiol. Rep. 2021, 9, e14937. [Google Scholar] [CrossRef]
  48. Chowdhury, S.S.; Lecomte, V.; Erlich, J.H.; Maloney, C.A.; Morris, M.J. Paternal High Fat Diet in Rats Leads to Renal Accumulation of Lipid and Tubular Changes in Adult Offspring. Nutrients 2016, 8, 521. [Google Scholar] [CrossRef]
  49. Yu, Y.; Mo, H.; Zhuo, H.; Yu, C.; Liu, Y. High Fat Diet Induces Kidney Injury via Stimulating Wnt/β-Catenin Signaling. Front. Med. 2022, 9, 866. [Google Scholar] [CrossRef]
  50. Descamps-Latscha, B.; Herbelin, A.; Nguyen, A.T.; Roux-Lombard, P.; Zingraff, J.; Moynot, A.; Verger, C.; Dahmane, D.; de Groote, D.; Jungers, P.; et al. Balance between IL-1 beta, TNF-alpha, and their specific inhibitors in chronic renal failure and maintenance dialysis. Relationships with activation markers of T cells, B cells, and monocytes. J. Immunol. 1995, 154, 882–892. [Google Scholar] [CrossRef]
  51. Chen, X.; Gong, Q.; Wang, C.-Y.; Zhang, K.; Ji, X.; Chen, Y.X.; Yu, X.-J. High-Fat Diet Induces Distinct Metabolic Response in Interleukin-6 and Tumor Necrosis Factor-α Knockout Mice. J. Interferon Cytokine Res. 2016, 36, 580–588. [Google Scholar] [CrossRef]
  52. Yaribeygi, H.; Atkin, S.L.; Sahebkar, A. Interleukin-18 and diabetic nephropathy: A review. J. Cell. Physiol. 2019, 234, 5674–5682. [Google Scholar] [CrossRef]
  53. Barbier, L.; Ferhat, M.; Salamé, E.; Robin, A.; Herbelin, A.; Gombert, J.-M.; Silvain, C.; Barbarin, A. Interleukin-1 Family Cytokines: Keystones in Liver Inflammatory Diseases. Front. Immunol. 2019, 10, 2014. [Google Scholar] [CrossRef] [PubMed]
  54. Hohenstein, B.; Renk, S.; Lang, K.; Daniel, C.; Freund, M.; Léon, C.; Amann, K.U.; Gachet, C.; Hugo, C.P. P2Y1 gene deficiency protects from renal disease progression and capillary rarefaction during passive crescentic glomerulonephritis. J. Am. Soc. Nephrol. 2007, 18, 494–505. [Google Scholar] [CrossRef] [PubMed]
Figure 1. Effect of L-serine supplementation on body weight, energy intake, and adiposity. (A) Body weight gain expressed by percentage change from baseline. Mice consuming a standard chow diet (C) (open round, n = 9) and a chow diet with L-serine (C + S) (black round, n = 9); mice consuming a high-fat diet (H) (open square, n = 9) and high-fat diet with L-serine (H + S) (black square, n = 9). (B) Cumulative energy intake (n = 9); (C) Wet weight (gram) of retroperitoneal white adipose tissues (n = 9). (D) Wet weight (gram) of epididymal white adipose tissues (n = 9). Chow diet (C), and chow diet with L-serine (C + S), high-fat diet (H), and high-fat diet with L-serine (H + S). Data are expressed as mean ± SEM. In graph A, data were analyzed by repeated measures of three-way ANOVA with animal diet, L-serine treatment, and weeks of treatment as factors. In graphs (BD), data were analyzed by two-way ANOVA with animal diet and L-serine treatment as factors. ANOVA results were then followed by a post hoc assessment using Fisher’s least significant difference test (LSD). * Significant difference for overall diet effect (H and H + S) vs. (C and C + S) (p < 0.05); # Significant difference for L-serine effect (p < 0.05).
Nutraceuticals 03 00021 g001
Figure 2. Effects of L-serine supplementation on glucose metabolism. (A,B) Fasting glucose levels prior to L-serine supplementation. At the beginning, (C) Area under the curve prior to L-serine supplementation; (D,E) Fasting glucose levels after 4 weeks of L-serine supplementation, (F) Area under the curve after 4 weeks of L-serine supplementation. (G,H) Fasting glucose levels after 12 weeks of L-serine supplementation, (F) Area under the curve after 12 weeks of L-serine supplementation. Mice consuming a standard chow diet (C) (open round, n = 9) and chow diet with L-serine (C + S) (black round, n = 9); mice consuming a high-fat diet (H) (open square, n = 9) and high-fat diet with L-serine (H + S) (black square, n = 9). Chow diet (C) and chow diet with L-serine (C + S); high-fat diet (H) and high-fat diet with L-serine (H + S). Results are expressed as mean ± SEM. In graph (A), statistical significance was determined by unpaired Student’s t-test between two groups. In graphs (B,E,H), data were analyzed by repeated measures of three-way ANOVA with animal diet, L-serine treatment, and time points of GTT as factors. In graphs (D,F,G,I), data were analyzed by two-way ANOVA with animal diet and L-serine treatment as factors. ANOVA results were then followed by a post hoc assessment using Fisher’s least significant difference test (LSD). * Significant difference for overall diet effect (H and H + S) vs. (C and C + S) (p < 0.05); # Significant difference for L-serine effect (p < 0.05).
Nutraceuticals 03 00021 g002
Figure 3. Effects of L-serine supplementation on renal gene expression. mRNA levels of (A) Interleukin 6 (IL-6), (B) Tumor Necrosis Factor α (TNF-α), (C) Kidney Injury Molecule 1 (KIM-1), (D) Purinergic Receptor P2Y, G-Protein Coupled, 1 (P2RY1). n = 7–9. Results are expressed as mean ± SEM. Data were analyzed by two-way ANOVA with animal diet and L-serine treatment as factors. ANOVA results were then followed by a post hoc assessment using Fisher’s least significant difference test (LSD). * Significant difference for overall diet effect (H and H + S) vs. (C and C + S) (p < 0.05); # Significant difference for L-serine effect (p < 0.05).
Nutraceuticals 03 00021 g003
Disclaimer/Publisher’s Note: The statements, opinions and data contained in all publications are solely those of the individual author(s) and contributor(s) and not of MDPI and/or the editor(s). MDPI and/or the editor(s) disclaim responsibility for any injury to people or property resulting from any ideas, methods, instructions or products referred to in the content.

