Article

Crystal Structure Dynamics of RFe3(BO3)4 Single Crystals in the Temperature Range 25–500 K

by
Olga A. Alekseeva
1,*,
Ekaterina S. Smirnova
1,*,
Kirill V. Frolov
1,
Marianna V. Lyubutina
1,
Igor S. Lyubutin
1 and
Irina A. Gudim
2
1
Shubnikov Institute of Crystallography of Federal Scientific Research Centre ‘Crystallography and Photonics’, Russian Academy of Sciences, Moscow 119333, Russia
2
Kirensky Institute of Physics, Federal Research Center KSC SB RAS, Krasnoyarsk 660036, Russia
*
Authors to whom correspondence should be addressed.
Crystals 2022, 12(9), 1203; https://doi.org/10.3390/cryst12091203
Submission received: 4 August 2022 / Revised: 21 August 2022 / Accepted: 23 August 2022 / Published: 26 August 2022
(This article belongs to the Section Inorganic Crystalline Materials)

Abstract

:
The multiferroic RFe3(BO3)4 family is characterized by diverse magnetic, magnetoelectric, and magnetoelastic properties, the fundamental aspects of which are essential for modern electronics. The present research, using single-crystal X-ray diffraction (XRD) and Mössbauer spectroscopy (MS) in the temperature range of 25–500 K, aimed to analyze the influence of local atomic coordination on magnetoelectric properties and exchange and super-exchange interactions in RFe3(BO3)4. Low-temperature, single-crystal XRD data of the magnetically ordered phase of RFe3(BO3)4 at 25 K, which were obtained for the first time, were supplemented with data obtained at higher temperatures, making it possible to draw conclusions about the mechanism of the structural dynamics. It was shown that, in structures with R = Gd, Ho, and Y (low-temperature space group P3121), a shift in oxygen atoms (O2, second coordination sphere of R atoms) was accompanied by rotation of the B2O3 triangle toward R atoms at low temperatures, and by different rearrangements in iron chains of two types, in contrast to Nd and Sm iron borates (space group R32). These rearrangements in the structures of space group P3121 affected the exchange and super-exchange paths at low temperatures. The MS results confirm the influence of the distant environment of atoms on the magnetoelectric properties of rare-earth iron borates at low temperatures.

1. Introduction

Rare-earth iron borates (RFe3(BO3)4) exhibit a strong correlation between their magnetic, electric, and optical properties due to the complex exchange interactions between the iron and rare-earth magnetic subsystems, which means that they can be attributed to the multiferroic family [1,2,3,4,5,6,7,8,9]. At low temperatures, different types of magnetic structures are realized for RFe3(BO3)4 crystals with different rare-earth elements in the composition (see, for example, [10,11,12,13,14,15,16,17]), and different spin-reorientation effects [17,18], magnetoelectric effects [8,19], and incommensurate magnetic structures [20,21,22] are observed. The magnetic order that occurs in the rare-earth subsystem below the Néel temperature is induced by an f-d exchange field of iron ions [11,15,17,23,24,25], and is not limited to a purely ferromagnetic or antiferromagnetic, easy-planar or easy-axis ordering [14,17].
The majority of works on the physical properties of RFe3(BO3)4 used samples prepared from single crystals grown by the solution-in-melt technique using a bismuth trimolibdate (Bi2Mo3O12)-based flux [26,27,28]. Further structural research using energy-dispersive X-ray spectroscopy and single-crystal X-ray diffraction demonstrated that Bi impurity systematically substitutes rare-earth atoms in the composition of these crystals by about 4–9% [29,30,31,32,33]. Bi-incorporation in the structure leads to a lower structural phase transition temperature and influences the optical spectra [29,34]. However, no significant structural differences have been discovered in Bi-free crystals grown using a novel Li2WO4-based flux compared to those grown using a Bi2Mo3O12-based flux [33].
The multiferroic and optical properties of RFe3(BO3)4 could be worsened by the presence of opposite enantiomorphic twin components in the structure [28,35,36].
For RFe3(BO3)4, with a relatively small ionic radius of the rare-earth element (R = Eu, Gd, Tb, Dy, Ho, Er, and Y), a structural phase transition occurs from the high-temperature trigonal space group R32 to the low-temperature trigonal space group P3121 [2]. The temperature of the structural phase transition linearly decreases with the increased ionic radius of the rare-earth element [34,37,38]. Therefore, the structures of some RFe3(BO3)4 crystals in the magnetically ordered phase (below 30–40 K) are described by the space group R32, while others are described by the space group P3121. Based on single-crystal X-ray diffraction studies, the temperature of the structural phase transition for RFe3(BO3)4, containing bismuth impurity with R = Gd, Ho, and Y, is about 155 K [39], 365 K [29], and 370 K [32], respectively. The structural phase transition for yttrium compound is made more diffuse by the temperature.
The structure of rare-earth iron borates (Figure 1) in both the R32 (155) and P3121 (152) space groups consists of layers of R and Fe atoms, alternated with layers of BO3 groups, and is characterized by Fe–Fe helicoidal chains (FeO6 octahedra sharing edges) directed along the crystallographic axis c [29,31,40,41].
The atomic basis of RFe3(BO3)4 in space group R32 contains seven symmetrically independent atoms (Figure 1a). There is one Wycoff position of type 3a for R atoms, one position of type 9d for Fe atoms, two positions of types 3b and 9e for B atoms, and three positions of two types (one 18f and two 9e) for oxygen atoms. The number of non-equivalent positions in the structure increases with lower symmetry. In the atomic basis of RFe3(BO3)4 in space group P3121, there are 13 symmetrically independent atoms (Figure 1b): one position 3a for R atoms, two positions (3a and 6c) for Fe atoms, three positions (one 6c and two 3b) for B atoms, and seven positions (two 3b and five 6c) for O atoms.
The R atom is located in a slightly irregular trigonal prism, whose distortion increases in the P3121 space group [29,32]. The Fe atoms are located in irregular octahedra, the distortions of which are not the same in the two octahedra of the P3121 space group [29,42]. The B atoms are located in oxygen triangles, whose slope relative to the ab plane depends on the type of triangle and differs between structures in the R32 and P3121 space groups [29,31].
Despite the presence of two non-equivalent crystallographic positions of Fe atoms in RFe3(BO3)4 structures described by space group P3121, powder neutron diffraction cannot always discern the magnetic moments of Fe1 and Fe2 [15], and absorption Mössbauer spectroscopy only distinguishes between the magnetic contribution of the Fe1 and Fe2 subsystems below the Néel temperature [18,42].
Rare-earth iron borates are characterized by a variety of exchange–interaction parameters [38,41,43,44]. Due to the complex atomic structure, there are multiple paths for exchange and super-exchange interactions. Each RO6 prism connects three FeO6 chains without direct R–O–R bonds between the prisms. Exchange interactions are possible via direct Fe–Fe exchange paths (in helicoidal FeO6 chains or between them) or Fe–O–Fe, Fe–O–R–O–Fe, Fe–O–O–Fe, and Fe–O–B–O–Fe super-exchange paths [38,41,45]. An analysis of the distances between magnetic ions revealed the predominance of Fe–Fe or Fe–O–Fe interactions inside the quasi-one-dimensional chains of iron atoms [40,41]. This was proved by the close Néel temperatures for crystals with different rare-earth atoms [2,37].
The presence of atoms of the same sort in different Wycoff positions results in different distances and angles for exchange and super-exchange paths. For the RFe3(BO3)4 structures in space group P3121, the variety of distances and paths increases compared to the structures in space group R32. Furthermore, changes in distance and angle with temperature in space groups R32 are steady and uniform, whereas non-equivalent changes in distance and angle in space group P3121 occur with decreasing temperature [29,31], which additionally affects the exchange paths.
The primitive cell of the high-temperature structure R32 of RFe3(BO3)4 contains 20 atoms, which results in 57 vibrational normal modes. The primitive cell of the low-temperature structure P3121 contains 60 atoms, resulting in 177 vibrational modes [38]. The strongest bonds in the structures are B–O bonds inside planar BO3 triangles [29,33,38]. Shifts in boron ions relative to neighboring oxygen ions create local dipole moments; their triangular arrangement corresponds to antiferroelectric ordering below the temperature of the structural phase transition. The structural changes during phase transition R32 → P3121 result in the appearance of many new active vibrational Raman modes associated with the BO3 groups. The difference in energy values for the compounds with relatively large and small ions is due to the difference in interatomic distances and, hence, in force constants. The rare-earth element does not participate in lowest-frequency vibrations and the structural phase transition correlates with the rotational mode of the BO3 groups [38].
An analysis of two-magnon Raman scattering in magnetic phases of RFe3(BO3)4 [38] showed qualitatively similar scattering spectra for compounds with different rare-earth elements. This made it possible to assert that the structural differences between them did not strongly affect the magnetism and magnetic excitation spectra, which, as was later proved, is not entirely true. A strong interaction was revealed between the spin vibrations of Fe and R ions, which forms the spectrum of coupled excitations depending on the type of R ion and the anisotropy of the exchange splitting of its ground state [5].
Various values of direct Fe–Fe interactions were analyzed for Nd1−xTbxFe3(BO3)4 and TbFe3(BO3)4 [44]. The authors concluded that the studied magnetic structures were characterized by hybridized Fe and R modes. A hierarchy of different interactions was established, and the predominance of intrachain over interchain Fe–Fe interactions was confirmed.
The nature of the spin-reorientation transition of Ho, Nd, and Fe atoms in the mixed compound Ho0.5Nd0.5Fe3(BO3)4 supports the presumed existence of magnetic coupling between rare-earth atoms and iron atoms in rare-earth iron borates [46]. Low-temperature macroscopic magnetization measurements demonstrated that the magnetic sublattices of Ho and Fe are strongly coupled, and the magnetic properties, including the magnetocrystalline anisotropy in the Ho0.5Nd0.5Fe3(BO3)4 single crystal, are due to the anisotropy of the Ho sublattice. It was found that the Ho3+ ions implement the easy-axis magnetic anisotropy that result in the spin–flop transitions in the Fe3+ and Nd3+ sublattices, due to the strong magnetic coupling between holmium and iron ions. The effect of the Nd3+ magnetic subsystem was mainly manifested in its linear contribution to the macroscopic magnetization along the c-axis and the extra contribution to the magnetization in the ab-plane [46].
Therefore, an accurate structural refinement of the magnetically ordered phase of RFe3(BO3)4 at low temperatures will allow for us to follow the tendency of structural changes depending on the type of rare-earth element and the temperature. These data are important for determining the differences in interatomic distances and angles of iron borates with different types of rare-earth element. This, in turn, will enable us to reveal the differences between the exchange and super-exchange paths that implement the magnetoelectric interactions, as well as to continue further ab initio studies to describe the multiferroic effects in these compounds.
In this work, the low-temperature crystal structure of RFe3(BO3)4 (R = Nd, Sm, Gd, Ho, and Y) was determined by single-crystal X-ray diffraction (XRD) at 25 K. The results were analyzed in conjunction with XRD and Mössbauer spectroscopy (MS) data obtained in the temperature range of 25–500 K. Single crystals of rare-earth iron borates RFe3(BO3)4 with R = Nd, Sm, Gd, Ho, and Y studied in the current research were grown by the solution-in-melt technique using bismuth trimolibdate Bi2Mo3O12-based flux [29,30,31,32,33]. Detailed descriptions of the sample growth method can be found in [26,27,28]. The presence and content of Bi-atoms in the single crystals were demonstrated earlier using EDS spectroscopy and X-ray diffraction [29,30,31,32,33].

2. Materials and Methods

2.1. Single-Crystal X-ray Diffraction

X-ray intensity datasets at 25 K for R1−xBixFe3(BO3)4 with R = Nd, Sm, Gd, Ho, and Y were obtained using a Rigaku XtaLAB Synergy-DW (Rigaku Oxford Diffraction, Poland-Japan-UK) diffractometer with a rotating anode (MoKα radiation) and a Rigaku HyPix Arc 150° detector. The temperature was set by a flow of helium gas using an N-Helix temperature attachment (Oxford Cryosystems). A spherical shape was given to single crystals in the abrasive chamber using air flow, to consider absorption correction by shape. The same spherical specimens of single crystals of R1−xBixFe3(BO3)4 with R = Nd and Y were used in the diffraction experiments as those used at higher temperatures. Diffraction intensities were integrated using CrysAlisPro software (Rigaku Oxford Diffraction) [47]. The crystal structures were refined by the least-squares method using Jana2006 software [48]. The structural models previously obtained for R1−xBixFe3(BO3)4 with R = Nd, Sm, Gd, Ho, and Y at 90 K were used for refinement. Structural analysis was performed in conjunction with the data on temperature dependency of the structural parameters obtained and discussed in [29,30,31,32,33]. The refinement results are present in Table 1. Information on closest interatomic distances in R1−xBixFe3(BO3)4 with R = Nd, Sm, Gd, Ho, and Y at 25 K is given in Table A1, Table A2 and Table A3 in Appendix A. Detailed information on data collection, refinement and crystal structures is given in CIF S1–S5 in Supplementary Materials.
The least-squares refinement of the (R, Bi) occupancy factor was not stable, and fluctuated around the values obtained for R1−xBixFe3(BO3)4 at higher temperatures. Thus, the R:Bi ratio for all samples was restrained in accordance with the previously obtained high-temperature datasets (see Table 1). This was justified for different specimens prepared from the same single crystal, since the composition of R1−xBixFe3(BO3)4 was proved to be homogeneous [33]. Identical coordinates and atomic displacement parameters (ADPs) for R and Bi were used. The main maxima on the residual electron density maps (Table 1) are related to the peaks near the rare-earth atoms (at about 0.4–0.5 Å), which presumably originated from the disordering of R and Bi and could not be adequately considered.
For the comparison of interatomic distances and angles at different temperatures, the unit cell parameters obtained using the Synergy-DW were normalized to the unit cell temperature dependencies previously obtained using the Xcalibur EOS S2 (Oxford Diffraction, Poland-UK) diffractometer. For this purpose, X-ray diffraction data were obtained at room temperature using the Synergy-DW, and a matching factor [31] was calculated for room temperature datasets.
The matching factor is
k = V X C A L / V S Y N 3 = 0.9996   ( 2 )
where VXCAL and VSYN are unit cell volumes calculated using CrysAlisPro software for the Xcalibur EOS S2 and Synergy-DW datasets, respectively.
Quantitative measurements of coordination polyhedra distortions from ideal symmetry were performed using the PolyDis program [49], which minimizes the normalized displacements of given polyhedra to the ideal shape. The shape deviations of the RO6 prism from a regular trigonal one and the FeO6 polyhedra from a regular octahedron, as well as the displacement of R and Fe atoms from the center of gravity of polyhedral, were calculated (in %).

2.2. Mössbauer Spectroscopy

MS measurements were carried out using a powder sample prepared from single crystals. Mössbauer absorption spectra at 57Fe nuclei were obtained in the temperature range of 3.5–500 K using a standard MS-1104Em spectrometer (Research Institute of Physics of Southern Federal University, Russia) equipped with a closed-cycle helium cryostat RTI CryoFree-104 (RTI Cryomagnetic systems, Russia) [50] and a high-temperature resistive MRF-750 K furnace, along with a standard Wessel spectrometer equipped with a close-cycle cryostat (C2 Montana Instruments). A standard MS-1104Em spectrometer equipped with a nitrogen flow cryostat and a high-temperature resistive MRF-750 K furnace at a temperature of 90–480 K were used. The gamma-ray source, 57Co(Rh) Ritverc MCo7.114 [51], was at room temperature. The values of isomer shifts were measured relative to the reference absorber, Ritverc MRA.2.6 (30 µm α-Fe foil at room temperature) [51]. A computer analysis of the Mössbauer spectra was performed using the Univem-MS (software supplied with the MS-1104Em spectrometer), Recoil [52], and SpectrRelax [53] programs.

3. Results and Discussion

3.1. Structural Refinement

At 25 K, the crystal structures of R1−xBixFe3(BO3)4 were refined in trigonal space group R32 with R = Nd and Sm, and in trigonal space group P3121 (or enantiomorphic modification P3221) with R = Gd, Ho, and Y [54]. Detailed descriptions of the atomic arrangement of the structure of R1−xBixFe3(BO3)4 in each of the space groups can be found in [29,31,41]. No noticeable deviations from these symmetries were found.
Along with this, the structural models of samples with R = Gd, Ho, and Y when refined in the R32 space group revealed more than 70,000 reflections forbidden in R32 (systematic absences), whose intensity was higher than the error (I > 3σ(I)), whereas, in the case of R = Nd and Sm, such reflections were absent (see Table 1). Therefore, the total number of measured reflections was significantly higher for compounds in space group P3121 than for those in space group R32 (see Table 1). Therefore, the diffraction patterns clearly demonstrate the differences between the structures of compounds with R = Nd and Sm (space group R32) compared with R = Gd, Ho, and Y (space group P3121).

3.2. Temperature Dynamics of the Structures

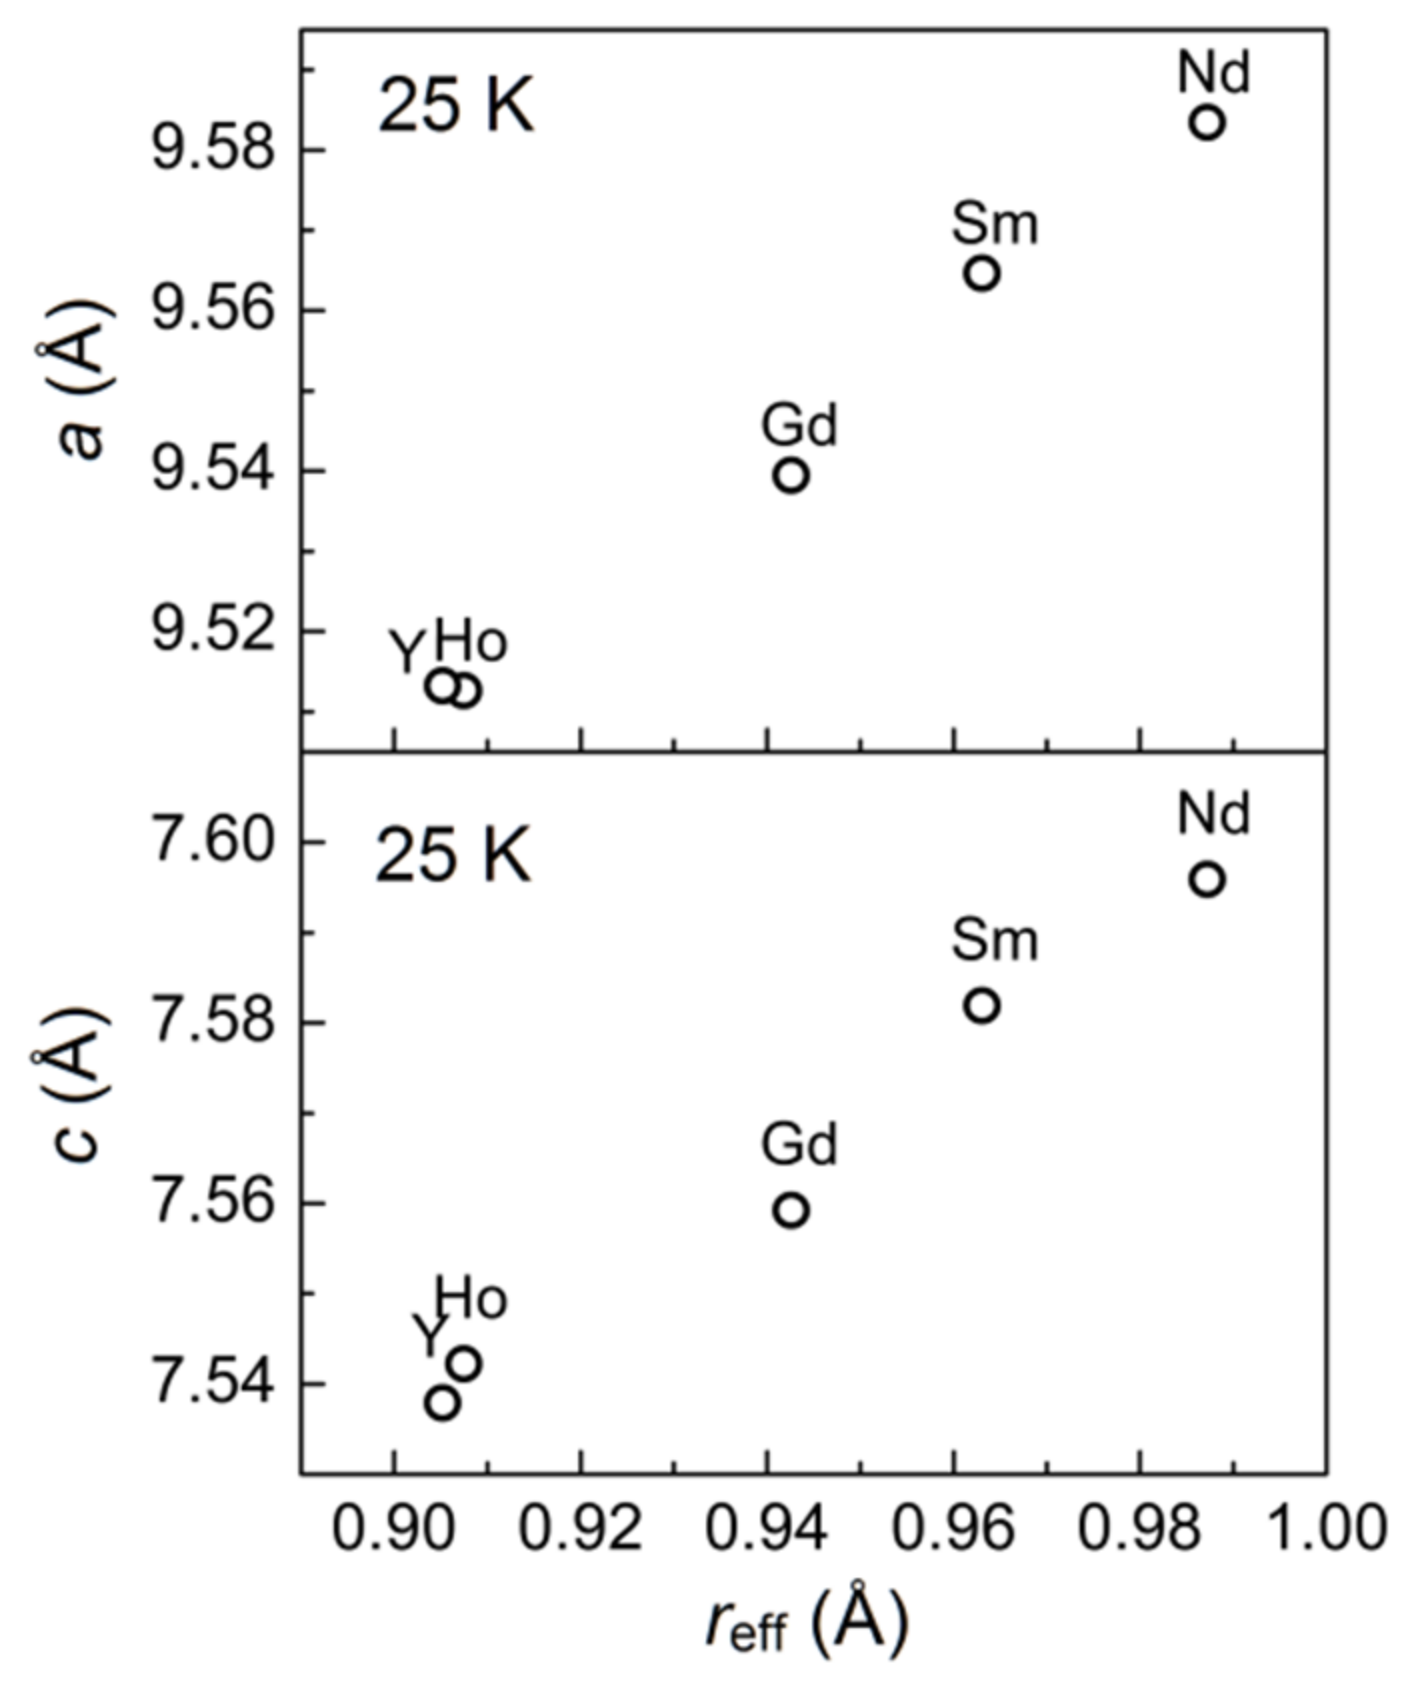
The unit cell parameters of R1−xBixFe3(BO3)4 with R = Nd, Sm, Gd, Ho, and Y at 25 K increased linearly with an increase in the ionic radius of the rare-earth element (Figure 2), as was previously shown for such a dependence at room temperature [34,37].
In the following, low temperature (LT) denotes atomic labels in space group P3121 and high temperature (HT) denotes atomic labels in space group R32. The mutual correspondence of atoms with LT and HT labels can be found in Table 2.
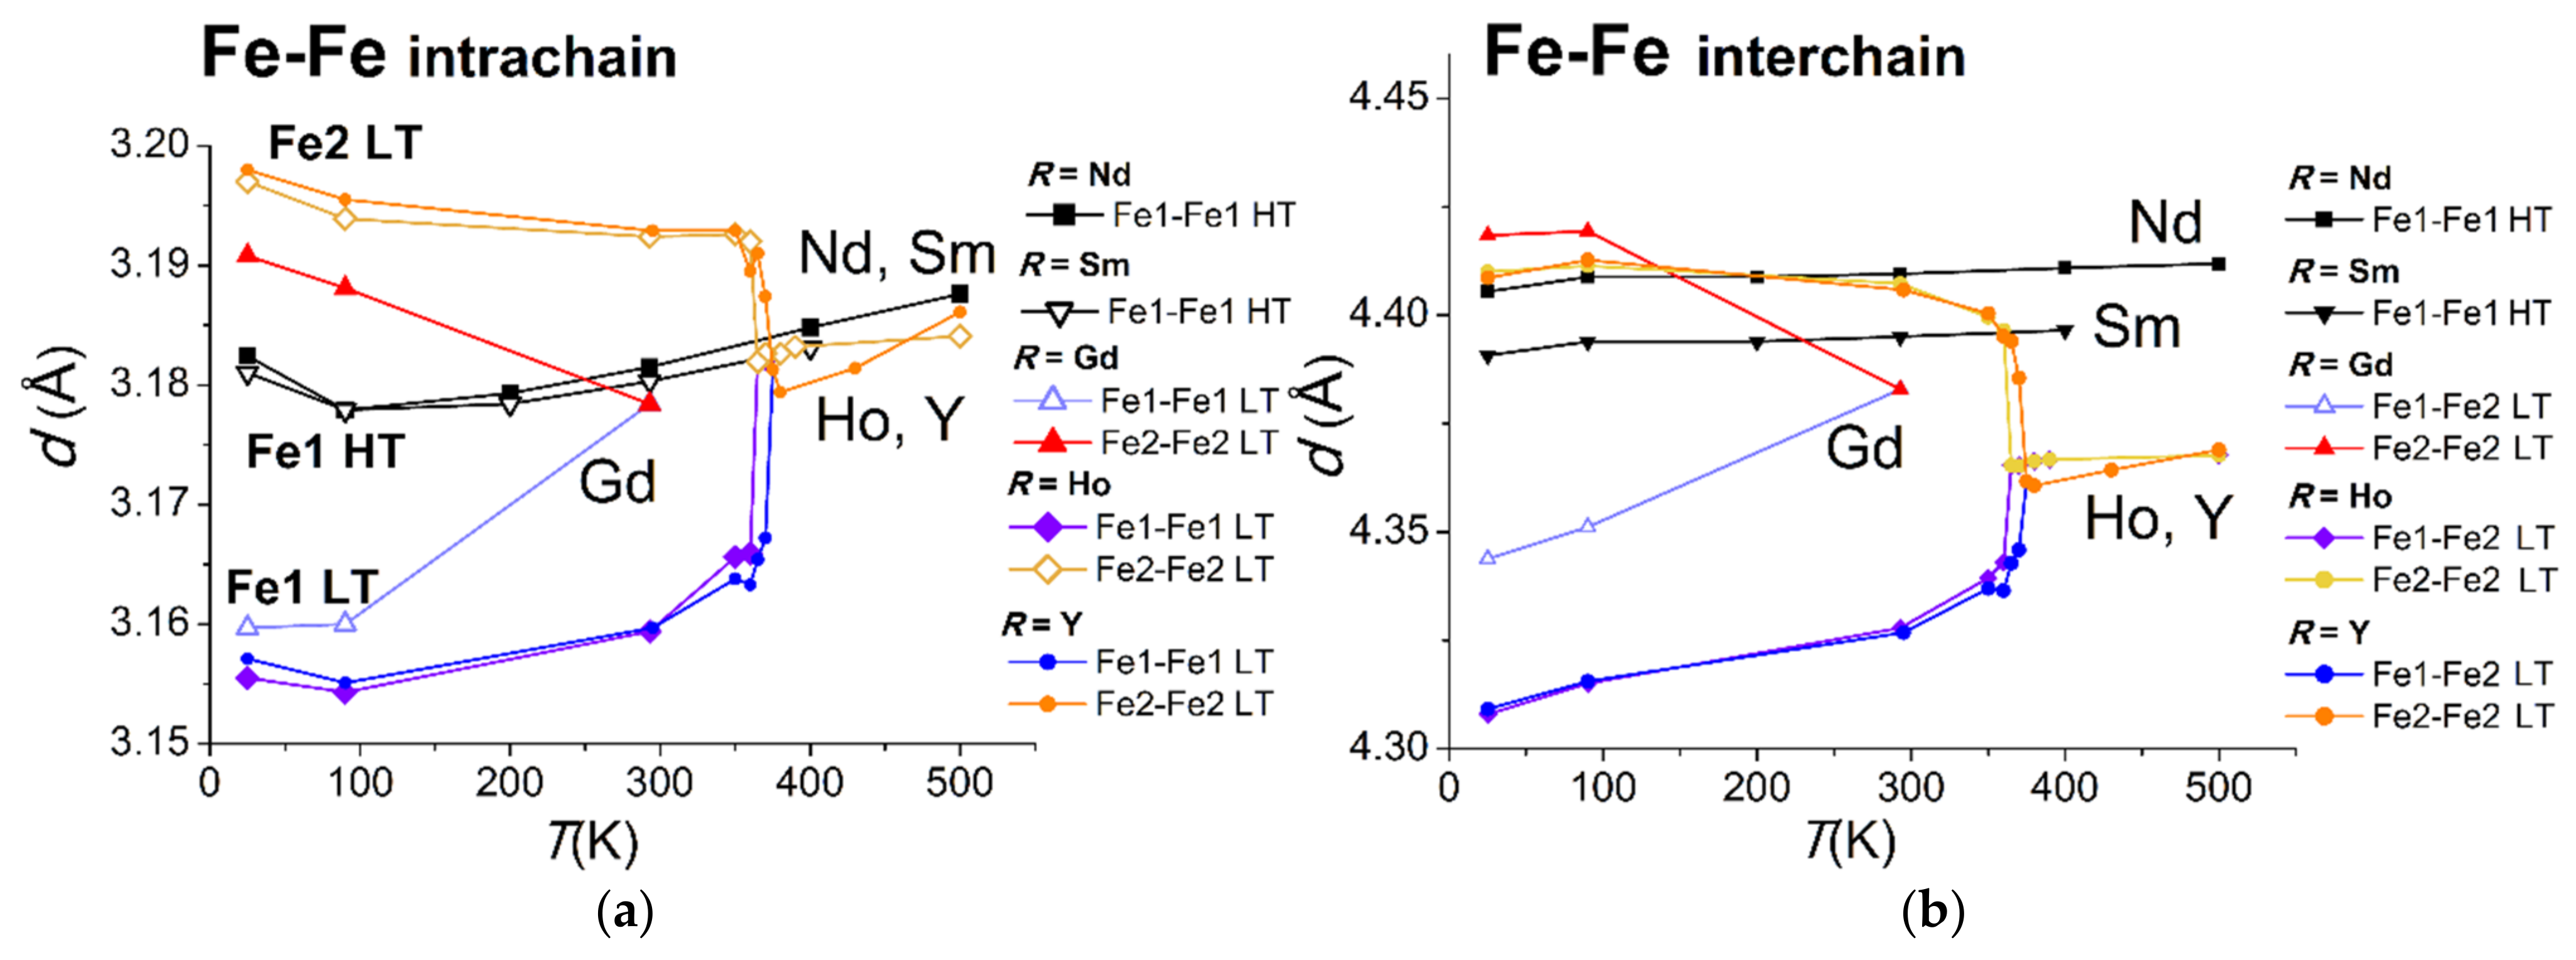
The temperature dependencies of interatomic distances and angles at 25 K were in satisfactory agreement with the data previously obtained in the temperature range of 90–500 K (Figure 3, Figure 4, Figure 5, Figure 6, Figure 7 and Figure 8). All temperature dependencies observed at higher temperatures generally tended to be maintained down to 25 K. Fe–Fe distances and Fe–O–Fe angles revealed slight deviations in these trends. All types of Fe–Fe intrachain distances in R1-xBixFe3(BO3)4 with R = Nd, Sm, Ho, and Y increased as the temperature changed from 90 to 25 K (Figure 3a). All Fe–O–Fe intrachain angles in structures with R = Nd, Sm, Ho, and Y also increased when temperature decreased from 90 to 25 K (Figure 4). The observed growth in Fe–Fe distances and Fe–O–Fe angles may explain the anomalous increase in unit cell parameter c in the low-temperature region [29,31].
The temperature dependencies of the nearest interatomic distances in R1−xBixFe3(BO3)4 structures with R = Nd, Sm, Gd, Ho, and Y did not show any noticeable distortions at 25 K, except for a slight change in the temperature dependency of the closest Fe–Fe distances (Figure 3, Figure 4, Figure 5, Figure 6, Figure 7 and Figure 8).
The R–O (Figure 5a) and Fe–Fe distances between iron chains (Figure 3b) at high temperatures were noticeably longer for the Nd compound compared to the others, which agrees with the difference in R ionic radius in the structures. The Fe1–Fe1 HT interchain distance for the compounds with R = Nd and Sm was close to the Fe2–Fe2 LT distance for R = Gd, Ho, and Y at 25 K (Figure 3b), and noticeably longer than the Fe1–Fe2 LT. This means that the interactions between iron chains in R1−xBixFe3(BO3)4 with R = Nd and Sm at 25 K were similar to those between the two Fe2 LT chains, and not the same for the different Fe1 LT and Fe2 LT chains in R1−xBixFe3(BO3)4 with R = Gd, Ho, and Y at 25 K.
In crystals with Nd and Sm, the R–B2 HT and R–Fe1 HT distances from rare-earth atoms to the second coordination sphere were close and comparable to the R–B3 LT distances (B2 HT split into B3 LT and B2 LT) and R–Fe1 LT distances (Fe1 HT split into Fe1 LT and Fe2 LT) in crystals with Gd, Ho, and Y at 25 K (Figure 5c,d). The Fe1–Fe1 HT distance in the chosen chain was also comparable for both compounds, and its value was between the Fe1–Fe1 LT and Fe2–Fe2 LT distances in two different types of chain in Gd, Ho, and Y crystals at 25 K (Figure 3a). The Fe1–Fe1 LT distances in the first chain were shorter, while the Fe2–Fe2 LT distances in the second chain were longer compared to the HT phase (Figure 3a).
The most pronounced distortions in the closest atomic coordination associated with the structural phase transition and intensifying at 25 K were those of R–O, R–B2 HT, and R–Fe1 HT distances, and Fe1–Fe1 HT interchain and intrachain distances (Figure 3, Figure 4, Figure 5, Figure 6, Figure 7 and Figure 8).
Of note, distortions at 25 K were stronger for the compounds with the smallest ionic radii (Ho, Y), which had a structural phase transition at temperature Ts ≈ 365–370 K. The nature of distortions in Gd compound (Ts ≈ 155 K) was similar, but they appear with temperature delay compared to Ho and Y compounds when the temperature was reduced (Figure 3, Figure 5 and Figure 7). This may be due to both the looser coordination packing of the smaller rare-earth atoms and the presence of diamagnetic bismuth atoms with larger ionic radii in the structures, leading to local distortions that increased with the difference in the R and Bi ionic radii from Nd to Ho and Y.

3.2.1. Rigid Boron Triangles

In the R1−xBixFe3(BO3)4 structures with R = Nd, Sm, Gd, Ho, and Y, the oxygen coordination of boron atoms (Figure 9) was more stable than the oxygen coordination of other cations, depending on the type of R atom in the structure and the temperature (Figure 6), as could be predicted from studies of the crystal chemistry of borates [55] and the structure of rare-earth iron borates [29,31,33,41].
The least pronounced changes were observed for B1 coordination (B1 LT is B1 HT). The B1O3 triangles were located above and below the R atom in the c direction and connected three Fe–Fe chains (Figure 1 and Figure 9a). The B1O3 triangle stayed almost equilateral even in space group P3121, where the threefold axis, passing through this triangle and the R atom in space group R32, was absent (Figure 6a). The oxygen triangles of B2 LT and B3 LT, which were connected with both Fe–Fe chains and RO6 octahedra (Figure 1 and Figure 9b), were slightly more distorted (Figure 6b,c).
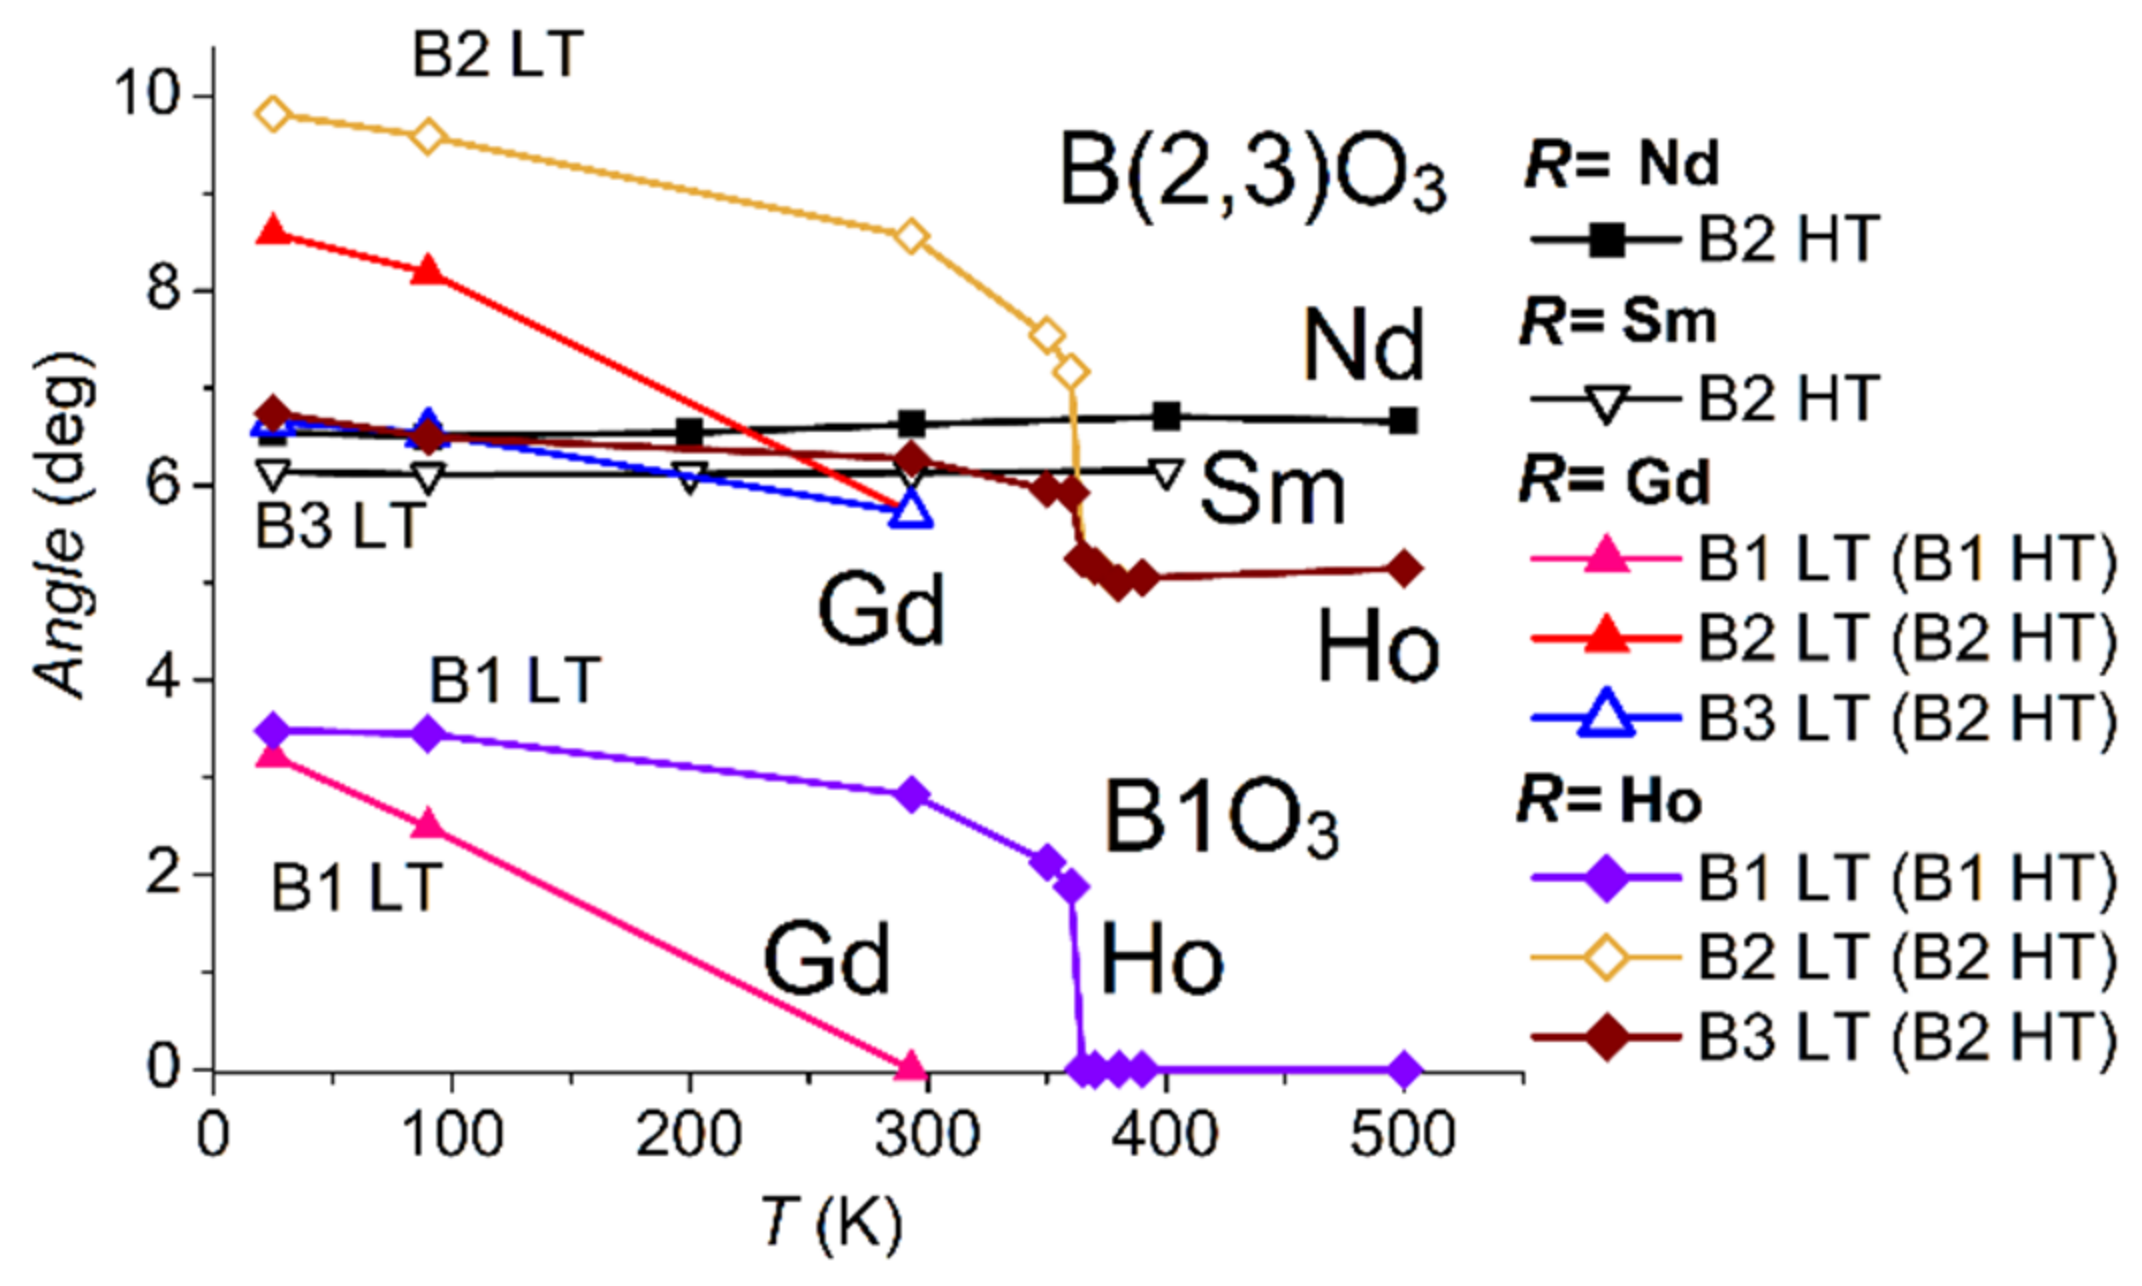
Despite small changes in boron coordination, a noticeable tilt in all three BO3 triangles in the compounds in space group P3121 occurred with decrease in temperature (Figure 7). In space group R32, the B1O3 triangles lay in the ab plane, and the B2O3 HT triangles were slightly deviated from that at about 5–7°. At high temperatures, this deviation was the most pronounced for the crystal with a large rare-earth radius (R = Nd), and the least pronounced for crystals with the smallest rare-earth ionic radii (R = Ho and Y) (Figure 7). For crystals with R = Nd and Sm in space group R32, the tilt of B2O3 HT slowly decreased with decreasing temperature (Figure 7). For crystals with R = Gd, Ho, and Y in space group P3121, the tilt of B3O3 LT slightly increased with decreasing temperature, and at 25 K was at a level close to that of B2O3 HT for compounds with R = Nd and Sm. At the same time, the tilt of the B2O3 LT triangle significantly increased to 8.6° for the crystal with R = Gd and to 9.8° for crystals with R = Ho and Y. Thus, the difference in the slope of B2O3 LT and B3O3 LT triangles demonstrates the dependence on the rare-earth element in the structure. With decreasing temperature, the tilt in the B1O3 LT triangle also increased to 3.2–3.5° for compounds with R = Gd, Ho, and Y at 25 K (Figure 7).

3.2.2. Distortion of Iron Atom Coordination

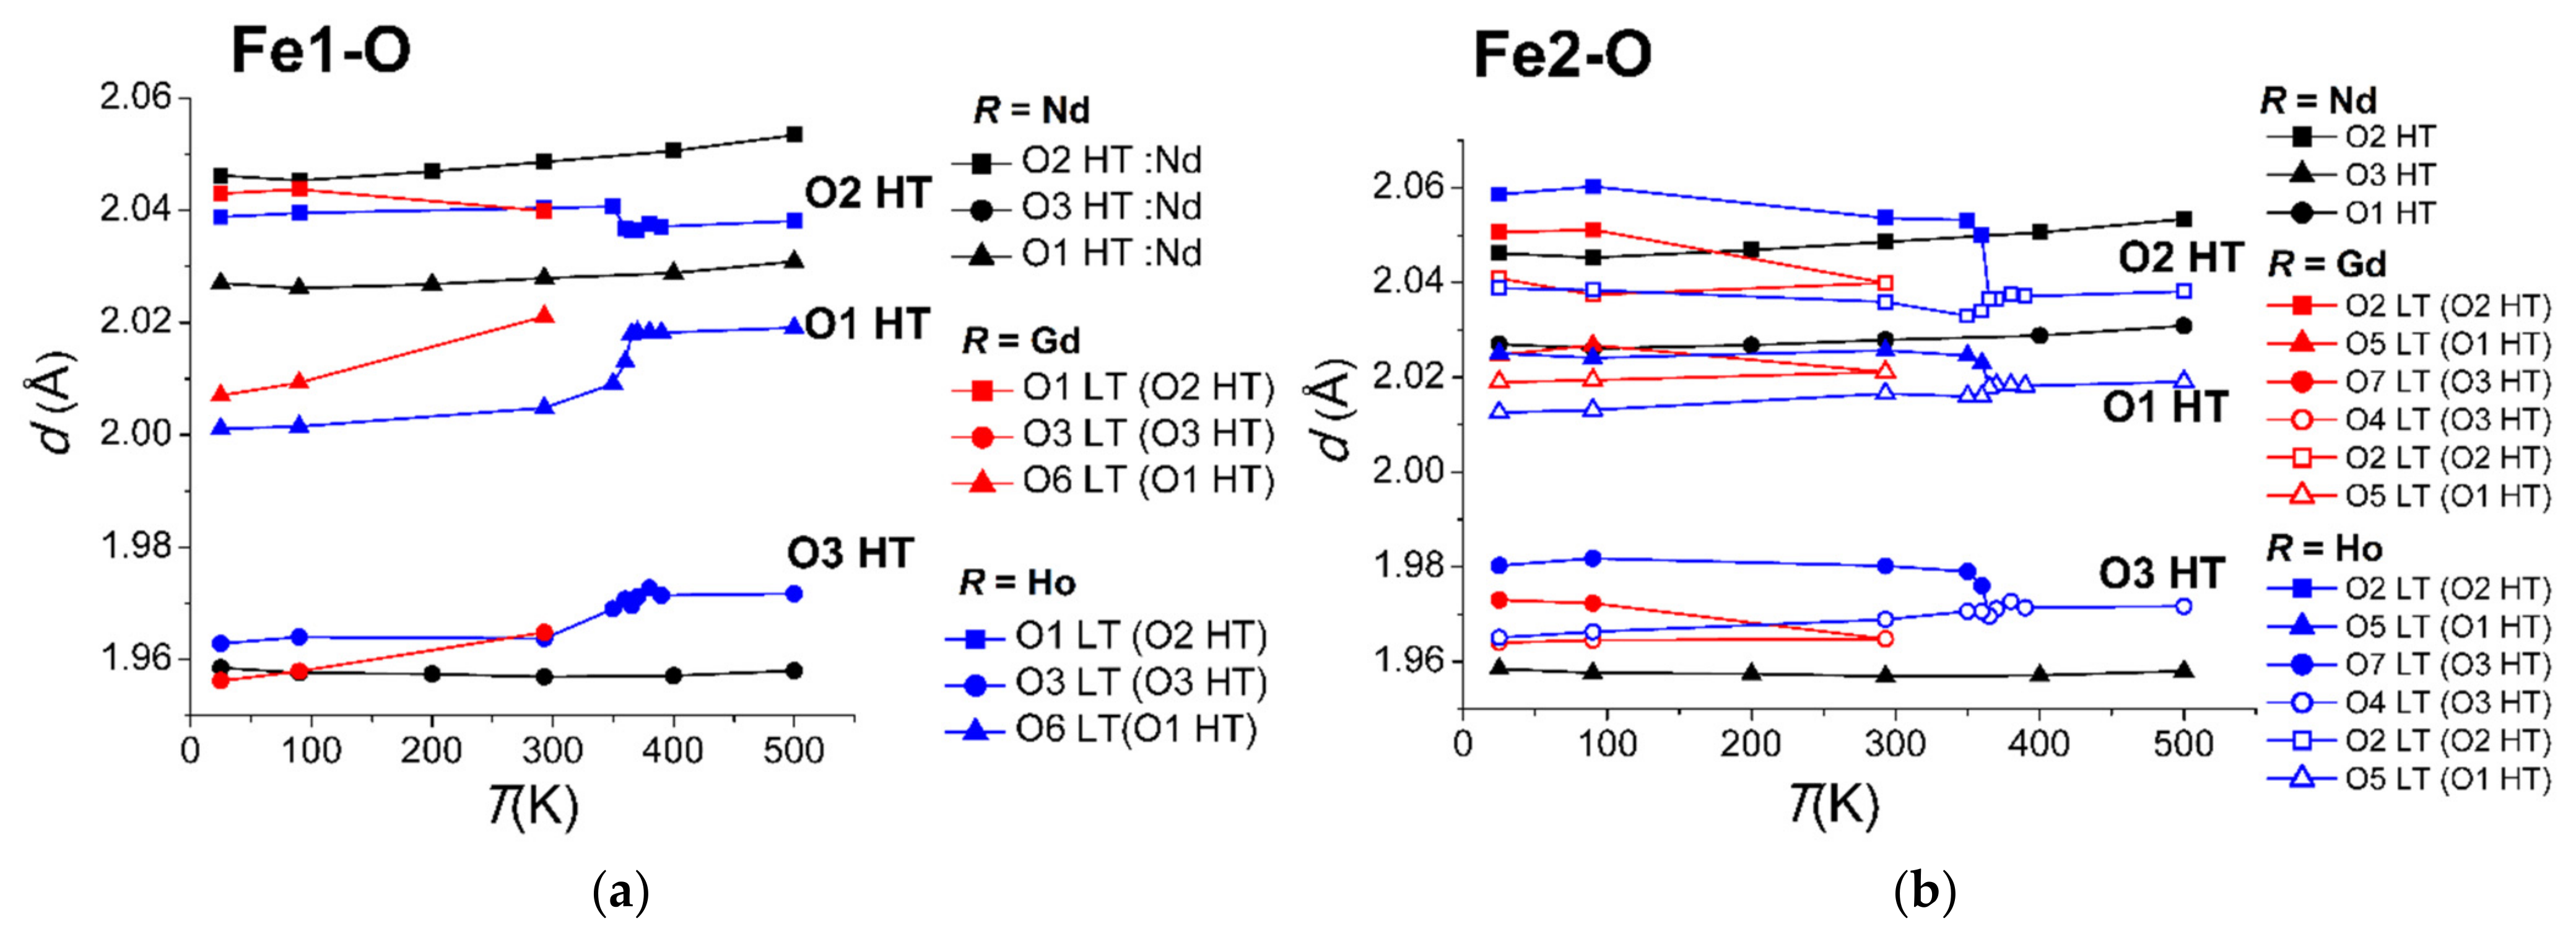
As can be seen from Figure 8a,b, the Fe–O distances in the FeO6 octahedra are comparable to the R1−xBixFe3(BO3)4 structures with different rare-earth ions R = Nd, Sm, Gd, Ho, and Y and at different temperatures. Distortions in Fe1O6 HT octahedra are observed after the structural phase transition R32 → P3121, and no strong deviation from the temperature dependence is observed upon cooling to 25 K (Figure 8a,b). The interatomic distances in the Fe1O6 LT and Fe2O6 LT octahedra are also close. This demonstrates a weak dependency of the closest oxygen surrounding of iron ions on temperature and the presence of a structural phase transition.
However, the Fe1O6 LT and Fe2O6 LT octahedra in R1−xBixFe3(BO3)4 with R = Gd, Ho, and Y are distorted and arranged differently (Figure 8a,b). The less distorted Fe1O6 polyhedron is elongated in the O6–O6 LT direction, whereas the significantly more distorted Fe2O6 polyhedron is noticeably flattened along the O7–O2 LT direction at 25 K (Figure 10). The O2–O5 LT and O1–O6 LT edges are mutual to adjacent octahedra in the Fe2 LT and Fe1 LT chains, respectively.
Distortions in FeO6 octahedra and Fe–Fe chains with decreasing temperature are caused not only by changes in interatomic distances, but also by changes in Fe–O–Fe angles (Figure 4).

3.2.3. Distortion of Rare-Earth Atom Coordination

The coordination of rare-earth atoms noticeably changed for R1-xBixFe3(BO3)4 with R = Gd, Ho, and Y compared to R = Nd and Sm at 25 K (Figure 5), which is a consequence of the tilt and rotation of boron triangles (Figure 7, Figure 9b, Figure 11b and Figure 12).
A noticeable change in the oxygen coordination of R atoms appeared below structural phase transition temperature, and became more significant at 25 K (Figure 5a,b).
Figure 9 and Figure 11 demonstrate the shifts in atoms and reduction in atomic displacement ellipsoids in the structures of R1−xBixFe3(BO3)4 with R = Gd, Ho, and Y, which have structural phase transitions, as shown by the example of structural models of yttrium single crystals at 25 and 500 K. The unit cell parameters at 25 K were used to show the superposition of two structures. For R1−xBixFe3(BO3)4 with R = Nd and Sm, such a superposition resulted in an accurate overlay of low-temperature and high-temperature structures; a noticeable difference was only observed in the size of atomic displacement ellipsoids. This is further evidence that changes in the structure of R1−xBixFe3(BO3)4 with R = Nd and Sm based on temperature are consistent and uniform.
In space group R32, oxygen atoms of the same type (O3 HT) formed trigonal prisms around rare-earth atoms (Figure 1a). The bases of the prism were parallel to the ab plane and slightly rotated relative to each other. All R–O3 HT distances were the same. In space group P3121, three independent positions of oxygen atom (O3, O4, O7 LT) with different R–O distances appeared (Figure 1b). After the phase transition with decreasing temperature, the R–O4 LT distance sharply increased and continued to lengthen down to 25 K, while the R–O3 LT and R–O7 LT distances sharply decreased and continued to shorten (Figure 5a). The average R–O distance also continued to slightly decrease. The difference between the shortest R–O7 LT and the longest R–O4 LT distances at 25 K was ≈0.04 Å for R = Gd and ≈0.06 Å for R = Ho and Y.
The second coordination sphere of a rare-earth atom R in the R32 space group was formed by six B2 HT, six O2 HT, and six Fe1 HT atoms. Changes in R coordination in the second sphere below the structural phase transition temperature were more pronounced than changes in the first coordination sphere (Figure 5).
In compounds with R = Gd, Ho, and Y (space group P3121), a significant rearrangement of oxygen and boron atoms in the second coordination sphere of R occurred at low temperatures.
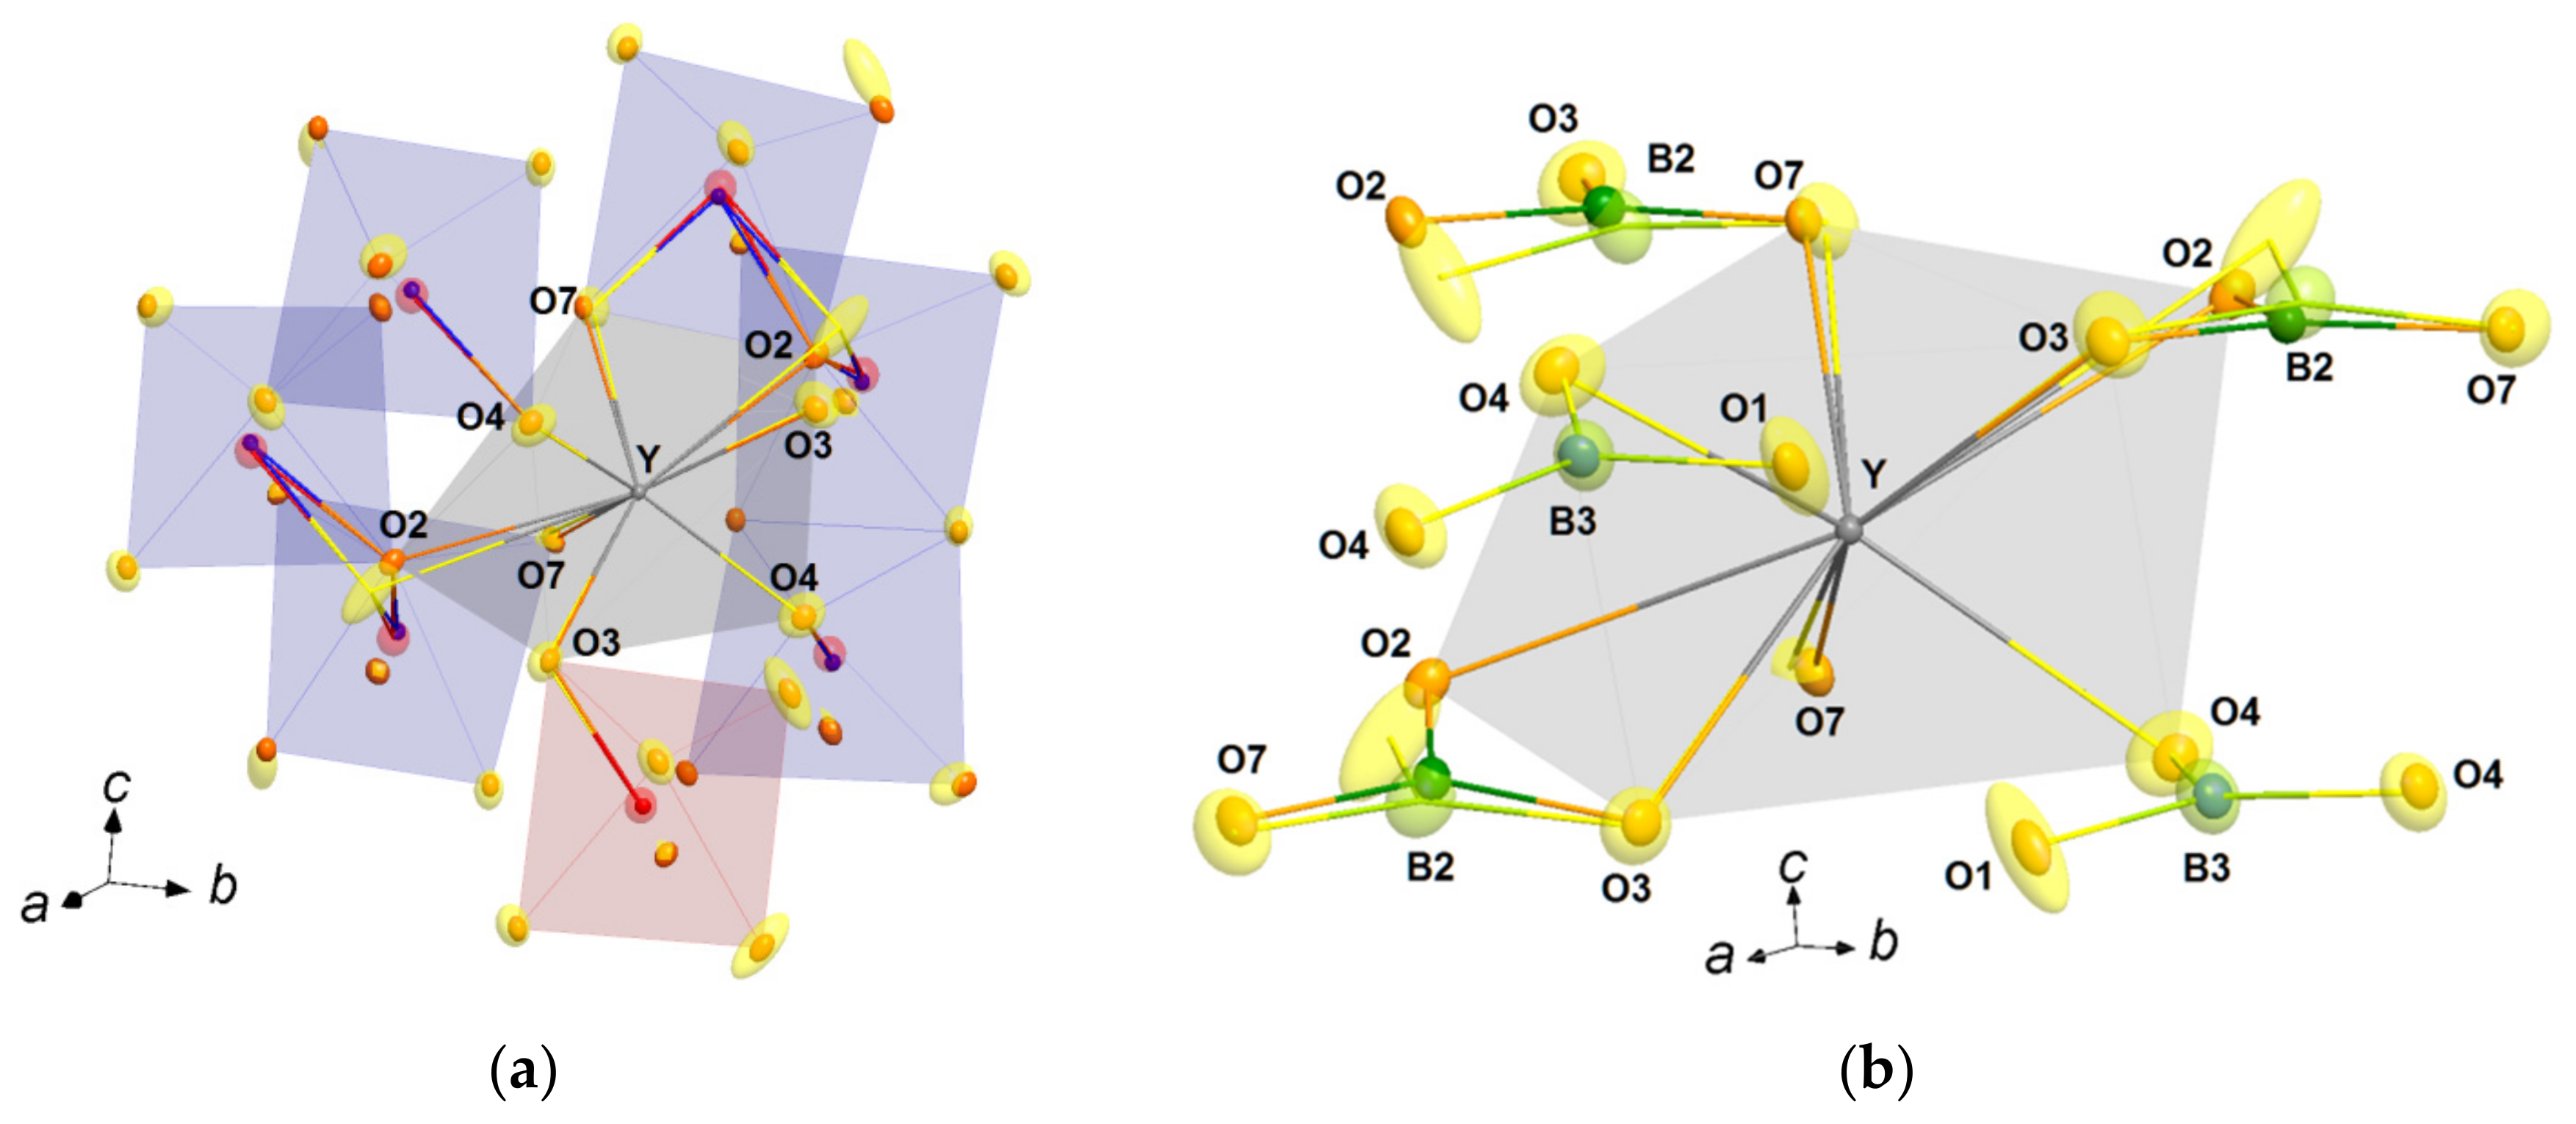
The structures of R1−xBixFe3(BO3)4 in this space group had four O2 LT (O2 HT) atoms and two O1 LT (O2 HT) atoms in the second coordination sphere of R. These atoms connected the B2 LT and B3 LT boron triangles with Fe–Fe chains of the second and first type, respectively (Figure 9b and Figure 11b). The R–O1 LT distance did not significantly change with temperature (Figure 5b and Figure 11b), whereas the longest R–O2 LT distance significantly increased by about 0.06 Å, and the shortest R–O2 LT distance decreased by about 0.06 Å when the temperature dropped to 25 K (Figure 5b, Figure 9b and Figure 11). The latter reduction in the shortest R–O2 LT distance is of interest, since O2 LT can be considered to be included in the first coordination sphere of rare-earth atoms (Figure 11).
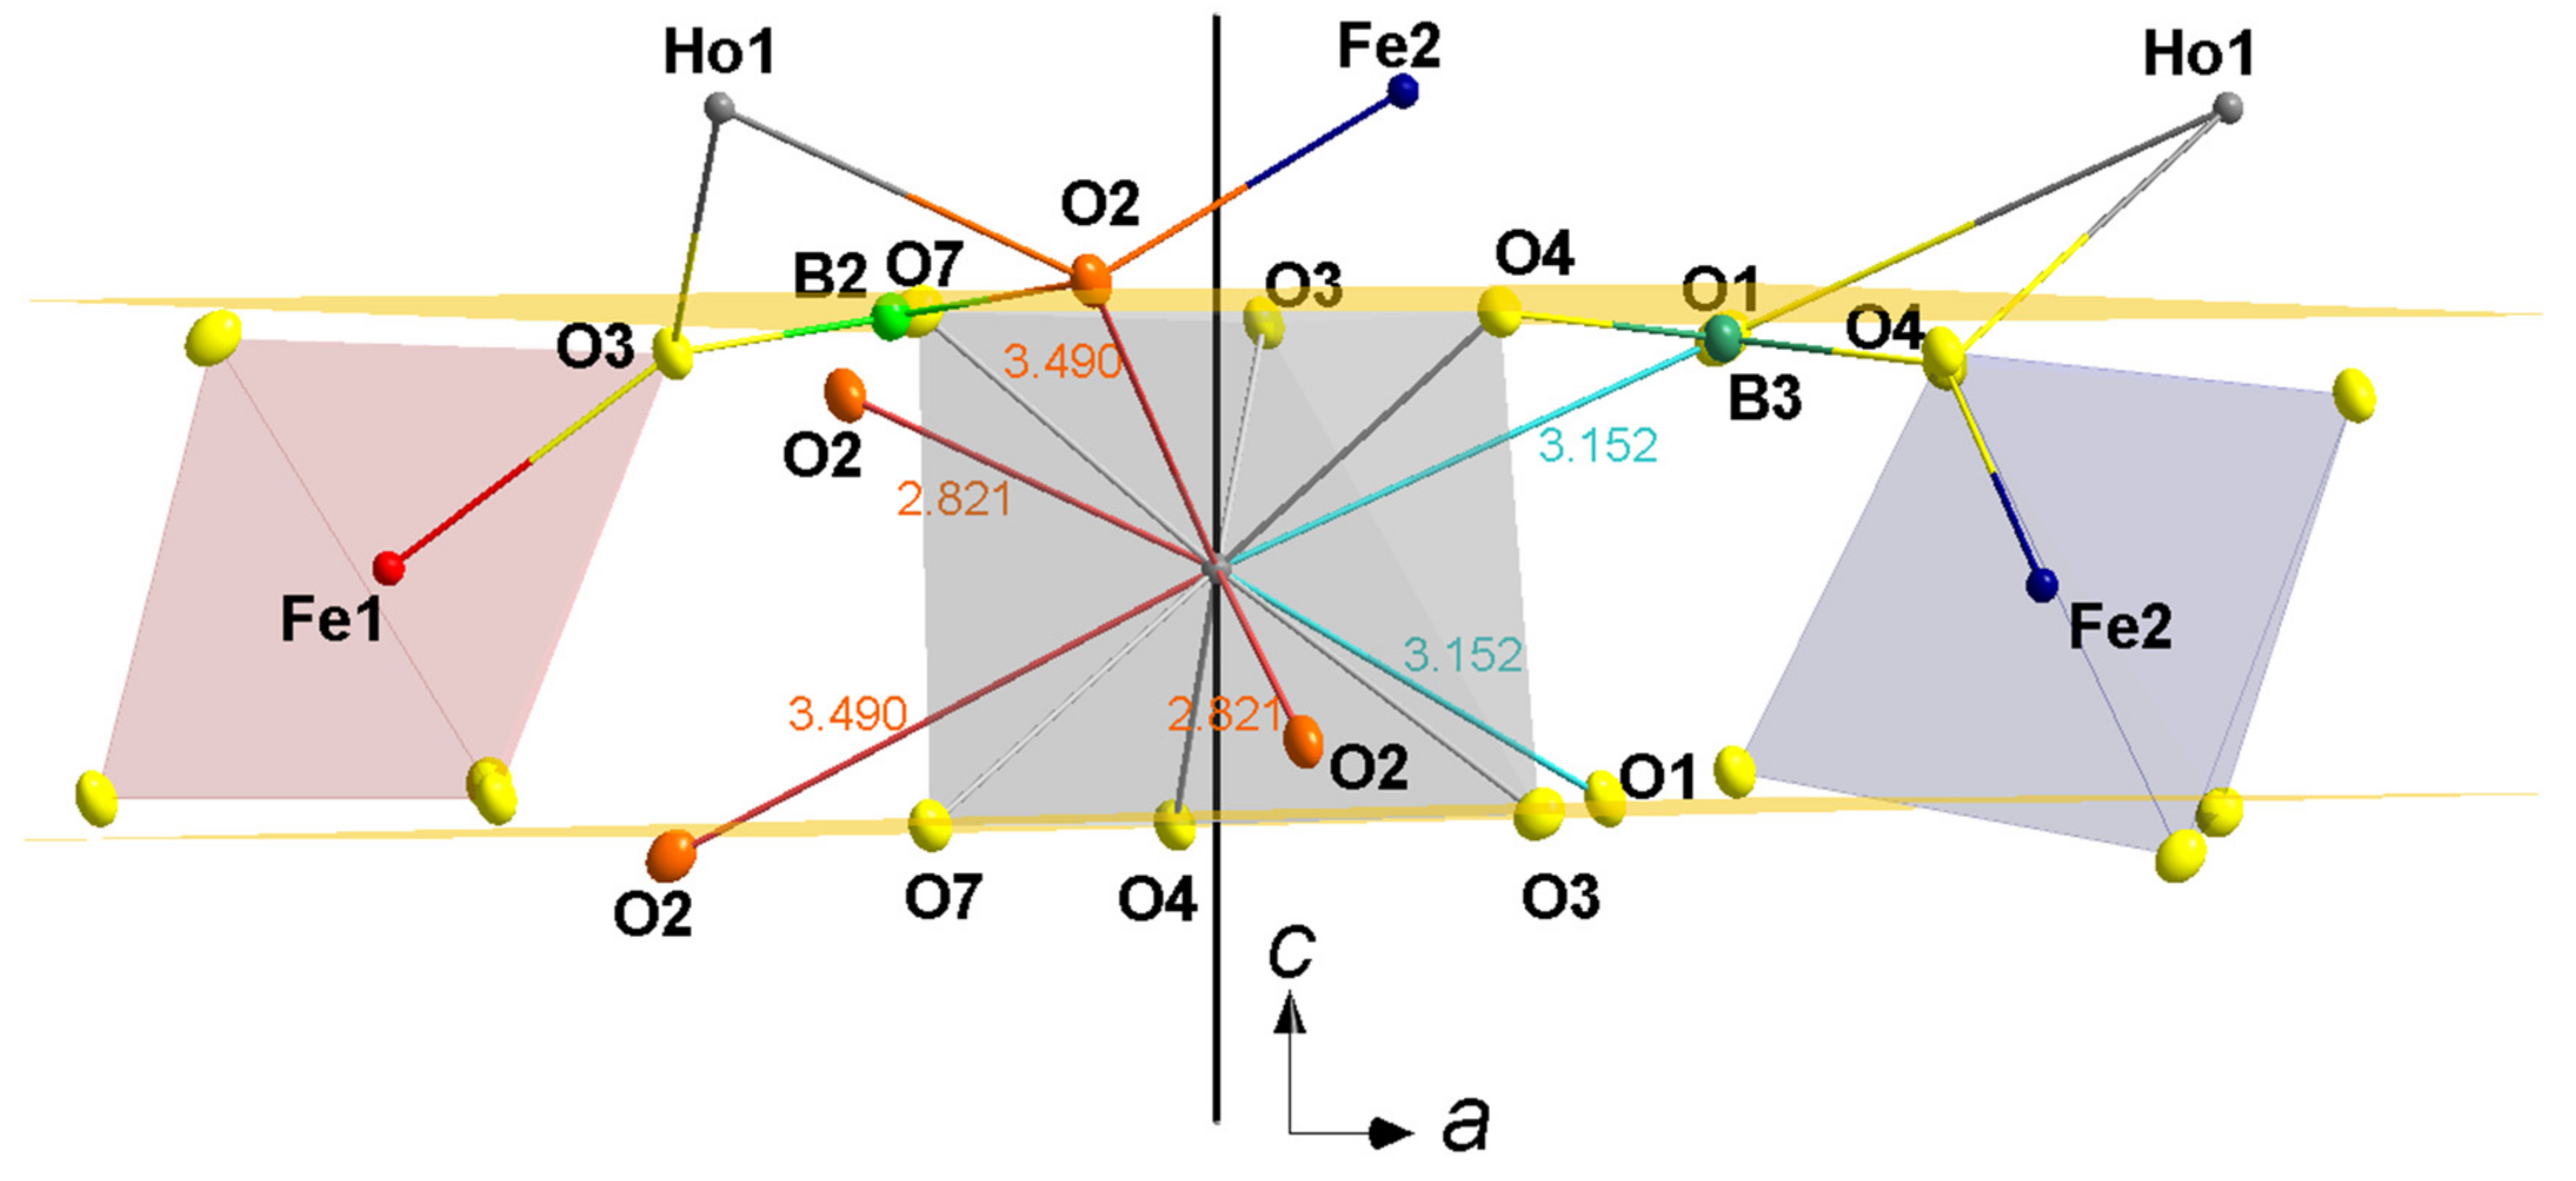
In the structures with Nd and Sm (R32) at 25 K, the oxygen atoms O2 HT from the second coordination sphere were close to the planes built through the O3 bases of trigonal prism RO6. In the structures with Gd, Ho, and Y, atoms O1 LT and O2 LT, which were more distant from R, were still close to that plane, whereas atoms O2 LT, which were closer to the R atom, shifted toward it from the planes (Figure 12).
The R–O2 HT distance varied from 3.163(1) Å (R = Nd) to 3.154(1) Å (R = Y) at 500 K, and significantly exceeded the R–O3 HT distance, which was within the range of 2.404(1) Å (R = Nd) to 2.349(1) Å (R = Y) at 500 K.
O2 LT approached the R atom at 25 K to a greater extent in compounds with a smaller ionic radius of R (Ho and Y; Figure 5b). At 25 K, R–O2 LT distances were equal to 2.899(1) Å, 2.821(1) Å, and 2.818(1) Å for R = Gd, Ho, and Y, respectively, which were still longer than the longest R–O distances for R = Gd, Ho, and Y in the first coordination sphere, equal to 2.391(1) Å, 2.383(1) Å, and 2.382(1) Å.
At high temperatures, the O2 HT atom had the most elongated displacement ellipsoid and the maximal equivalent isotropic displacement parameter value of all atoms in the structures [29,31]. Figure 9 and Figure 11 show that the O2 LT atom at 25 K shifted in the direction of the main axis of this ellipsoid, whereas the O1 LT atom remained at the center of the O2 HT ellipsoid.
This denotes a special role for the O2 LT atom and the B2O3 LT triangle (which is connected to the R atom and Fe2 LT chains; Figure 9b and Figure 11) in the rearrangement of the structure at low temperatures, which may modify the magnitude of the magnetoelectric effect [56].
It should be noted that usually the number of oxygen anions coordinating rare-earth elements or yttrium is eight rather than six [57]. According to recent works [57,58], the structural databases include 96 Nd-containing compounds with coordination number (CN) = 6 and 672 with CN = 8; 42 Sm-containing compounds with CN = 6 and 344 with CN = 8; 36 Gd-containing compounds with CN = 6 and 464 with CN = 8; and 90 Ho-containing compounds with CN = 6 and 312 with CN = 8. For these structures, the R–O distances at CN = 8 can be in the range of 2.266÷2.891 Å for R = Nd3+, 2.212 ÷ 2.853 Å for R = Sm3+, 2.223÷2.837 for R = Gd3+, 2.222÷2.936 Å for R = Ho3+ [57] and 2.222 ÷ 2.729 for R = Y3+ [58]. Similarly, for Bi3+ atoms with CN = 8, the range of Bi–O distances is 2.096 ÷ 3.165 [59]. In addition, in the studied structures of bismuth containing rare-earth iron borates, the effective ionic radius of R increased due to the partial substitution of rare-earth atoms by bismuth atoms.
The above analysis shows that the O2 LT atoms in the R1−xBixFe3(BO3)4 with R = Gd, Ho, and Y structures (P3121 space group) should be considered as being in the local coordination of the R atom. In this case, the polyhedron of rare-earth atoms transforms from a distorted trigonal prism RO6 into a bicapped trigonal prism RO8 (Figure 11).
If O2 HT atoms are considered as a local coordination of R atoms for compounds with R = Gd, Ho, and Y at 25 K, then RO8 is connected to В3О3 LT triangles by two vertices (O4 LT) and to В2O3 LT triangles by two vertices (O7 LT) and along two edges (O2–O3 LT) (Figure 11b).
Additionally, the bicapped trigonal prism RO8 is connected by two vertices (O3 LT) with the Fe1O6 LT octahedron, by two vertices (O4 LT) with the Fe2O6 LT octahedron, and also along the two O2–O7 LT edges with another Fe2O6 octahedron (Figure 11a). The distance between R and Fe2 LT atoms, whose polyhedra are in contact with the O4 LT vertex, is substantially longer than the distance between R–Fe2 and Fe2 atoms, whose polyhedra are connected to RO8 along the O2–O7 edge (Figure 13d). Furthermore, the longer distance increases by ≈0.023–0.034 Å with decreasing temperature after the structural phase transition, while the shorter one continues to decrease by ≈0.054–0.059 Å.
A pronounced shift in the O2 LT atoms (vertex of B2O3 LT triangle) toward the R atom occurs along with a pronounced deviation of the B2O3 triangle from the ab plane and its rotation in the direction of the rare-earth atom (Figure 9 and Figure 11). The B2–O2 LT bond (Figure 13d) is the longest in the B2O3 triangle and increases with decreasing temperature.
The deviation of the B3O3 triangle from the ab plane only slightly increases at 25 K (Figure 7, Figure 11 and Figure 12). This deviation is caused by a shift in the O4 LT atom, which is connected to the Fe2O6 LT octahedra and the RO8 prism (Figure 7, Figure 11 and Figure 12). The B3–O4 LT bond (Figure 13b) is the longest in the B3O3 LT triangle and increases with decreasing temperature.
As already noted, the B1O3 LT triangle (connected to Fe1–Fe1 LT and Fe2–Fe2 LT chains, but not to the R atom) is almost not distorted with temperature in all R1−xBixFe3(BO3)4 crystals with R = Nd, Sm, Gd, Ho, and Y. B1O3 LT deviates slightly at 25 K due to the shift in the O5 LT (O1 HT) vertex in the direction of the main axis of the atomic displacement ellipsoid at high temperatures (Figure 9 and Figure 13b), but its deviation is weaker than that of B2O3 LT and B3O3 LT.
Therefore, based on atomic displacement, it can be assumed that the main influence on the magnetoelectric properties at low temperatures is caused by the displacement of O2 LT atoms, the shift and rotation of the B2O3 LT triangle, which also causes distortion of the iron chains and a slight change in the super-exchange paths in the structures. This agrees with the observation that the most significant change in RFe3(BO3)4 was the tilting of the BO3 plane and the O3 faces of the connected FeO6 polyhedra away from being parallel to the ab plane [56].
These changes were most noticeable in the R1-xBixFe3(BO3)4 structures with a small rare-earth ionic radius (Figure 5b). In addition, the temperature-dependent structural dynamics are very similar for the crystals with close rare-earth ionic radii, Y and Ho, although Ho is a magnetic ion and Y is not.
The shift in B2 LT (Figure 5c) and Fe2 LT (Figure 5d) atoms from R atoms at 25 K was also more pronounced for the crystals with R = Ho and Y. The R–B1 LT, R–B3 LT (Figure 5c), and R–Fe1 (Figure 5d) distances are close to those at higher temperatures than the phase transition temperature.

3.3. Exchange and Super-Exchange Paths

Information about the structures of the R1-xBixFe3(BO3)4 single crystals with R = Nd, Sm, Gd, Ho, and Y allows for a more detailed analysis of the possible paths of exchange and super-exchange interactions at low temperatures (Table 3 and Table A4).
An analysis of the distances between rare-earth and iron atoms at 25 K shows that the R–Fe distance for R = Nd, Sm, Gd, Ho, and Y is substantially longer than the Fe–Fe distance in both iron chains. At the same time, these R–Fe distances are much shorter than the Fe–Fe distance between iron chains (Figure 13). This indicates the dominant role of Fe–Fe intrachain interactions and the prevailing role of R–Fe over Fe–Fe interchain interactions (Figure 3 and Figure 5).
There was a single Fe1–Fe1 HT exchange path for Nd and Sm crystals at 25 K (Figure 13a). The appearance of two non-equivalent Fe1–Fe1 LT and Fe2–Fe2 LT chains (Figure 13b) for Gd, Y, and Ho crystals below the structural phase transition temperature enhanced the direct exchange interaction through Fe1–Fe1 LT, which became shorter at 25 K (Figure 3a). This may explain the higher Néel temperatures (TN) for these compounds compared to R = Nd and Sm [2]. An increase in the Fe2–Fe2 LT intrachain distance (Figure 3b) and Fe–O–Fe angles (Figure 4) at 25 K results in an elongation of this exchange path.
The number of possible non-equivalent Fe–O–Fe intrachain, Fe–O–Fe interchain, and Fe–O–R–O–Fe paths increases in the P3121 space group compared to the R32 space group (Table 3). The hierarchy of these paths is the same for compounds with different rare-earth ions, but the total length varies. (Table 3 and Table A4).
The summarized intrachain distance Fe1–O6–Fe1 LT in the chain of the first type is substantially shorter than other Fe–O–Fe distances in Gd, Y, and Ho crystals, and is much shorter than all Fe–O–Fe intrachain distances in Nd and Sm crystals (Figure 13b). Thus, the Fe1–O6–Fe1 LT super-exchange intrachain path may be dominant for compounds with a smaller R radius at low temperatures. In chains of the second type, the shortest exchange path is Fe2–O5–Fe2 LT (Figure 13b). It should be noted that the shortest paths in both iron chains involve oxygen atoms, which are in the coordination of the B1O3 triangle, the most stable fragment in the structure (Figure 9a). This indicates the absence of direct interactions between different chains.
The longest summarized Fe–O–Fe distance is Fe2–O2–Fe2 LT. This is due to the displacement of the O2 oxygen atom toward the R position, which occurs with a decrease in both R radius and temperature.
When considering more complex interchain paths, the summarized distance Fe1–O3–O3–Fe1 HT, via the B2O3 HT triangle, was shorter for the compounds in the R32 space group, whereas two non-equivalent paths, Fe2–O2–O3–Fe1 LT (Table 3) via the B2O3 LT triangle (Fe1–O2–O3–Fe1 HT via B2O3 HT triangle in R32 space group), were predominant for the compounds in the P3121 space group (Figure 14a).
The Fe–O–O–Fe distances obtained via the B1O3 triangle were longer than those via the B2O3 LT and B3O3 LT triangles for all five compounds, which may correspond to a lower degree of super-exchange interactions in these directions.
This demonstrates the different nature of super-exchange interactions in the crystals in R32 and P3121 space groups at low temperatures and emphasizes the importance of the B2O3 LT triangle in the super-exchange interaction between iron chains.
When the structures transformed from the R32 space group into P3121, the predominant interaction paths also rearranged in the Fe–O–R–O–Fe direction (Table 3). In the case of space group R32, there was a single direction Fe1–O3–R HT and a single direction Fe1–O3–O3–R HT via the B2O3 HT triangle (Figure 13c). For the structures in the P3121 space group, there were different Fe–O–R and Fe–O–O–R paths, and the shortest super-exchange paths between the rare-earth and iron atoms were Fe2–O7–R LT and Fe1–O3–R, and Fe1–O3–O7–R and Fe2–O2–O3–R (Table 3, Figure 13d and Figure 14b). In all of these paths, the oxygen atoms were connected to the B2O3 LT triangle, and O2–O3 was an edge of an RO8 bicapped trigonal prism (Figure 11). This indicates the importance of the B2O3 LT triangle in the super-exchange interaction between R and Fe atoms.
Therefore, the shortest super-exchange interactions between rare-earth atoms and iron atoms were carried out via oxygen atoms O2 LT, O3 LT, and O7 LT connected to the iron chains and positioned as vertices of the B2O3 LT triangle.
A small amount of diamagnetic bismuth ions in the positions of rare-earth atoms is supposed to lead to additional local distortions, which increase with an increase in the difference between the ionic radii of R and bismuth. This could also affect the exchange interactions between the magnetic subsystems of iron and R ions.

3.4. Mössbauer Spectroscopy Results

Additional information about the dynamics of structural and magnetic phase transitions, the local environment of iron ions, and the type and dimension of magnetic ordering in rare-earth iron borates RFe3(BO3)4 containing bismuth impurities was obtained using MS on 57Fe nuclei. A detailed description of the MS measurements and the models used to fit the experimental spectra, and an analysis of the obtained Mössbauer hyperfine parameters, are presented in our previously published papers [18,33,39,42,60]. Figure 15 shows the Mössbauer spectra of all studied samples in the paramagnetic state at room temperature (Figure 15a) and in the magnetically ordered state at temperatures <10 K (Figure 15b).
For all studied compositions, the Mössbauer spectra measured above the Néel temperature TN of magnetic ordering were approximated by a single paramagnetic pseudo-Voigt doublet with hyperfine parameters corresponding to Fe3+ ions in the high-spin state (3d5, S = 5/2). For iron borates with R = Y, Ho, and Gd, the shape and approximation of the paramagnetic spectrum did not change when the crystal structure was transformed based on the temperature from space group R32 to P3121 during the structural phase transition. Two non-equivalent iron structural positions, Fe1 and Fe2, appearing in the P3121 phase were not distinguished in the paramagnetic Mössbauer spectra. This is an unexpected result for such a sensitive technique as MS.
One of the hyperfine Mössbauer parameters, quadrupole splitting Δ, is related to the magnitude of the electric field gradient (EFG) at the 57Fe nuclei appearing from surrounding ions of all coordination spheres of the iron ion. The best approximation of the paramagnetic spectrum by one doublet for the iron borates with the P3121 crystal structure, which contains two non-equivalent Fe1 and Fe2 sites, indicates an extremely small difference in the structure of the local environment of these sites and their EFG values.
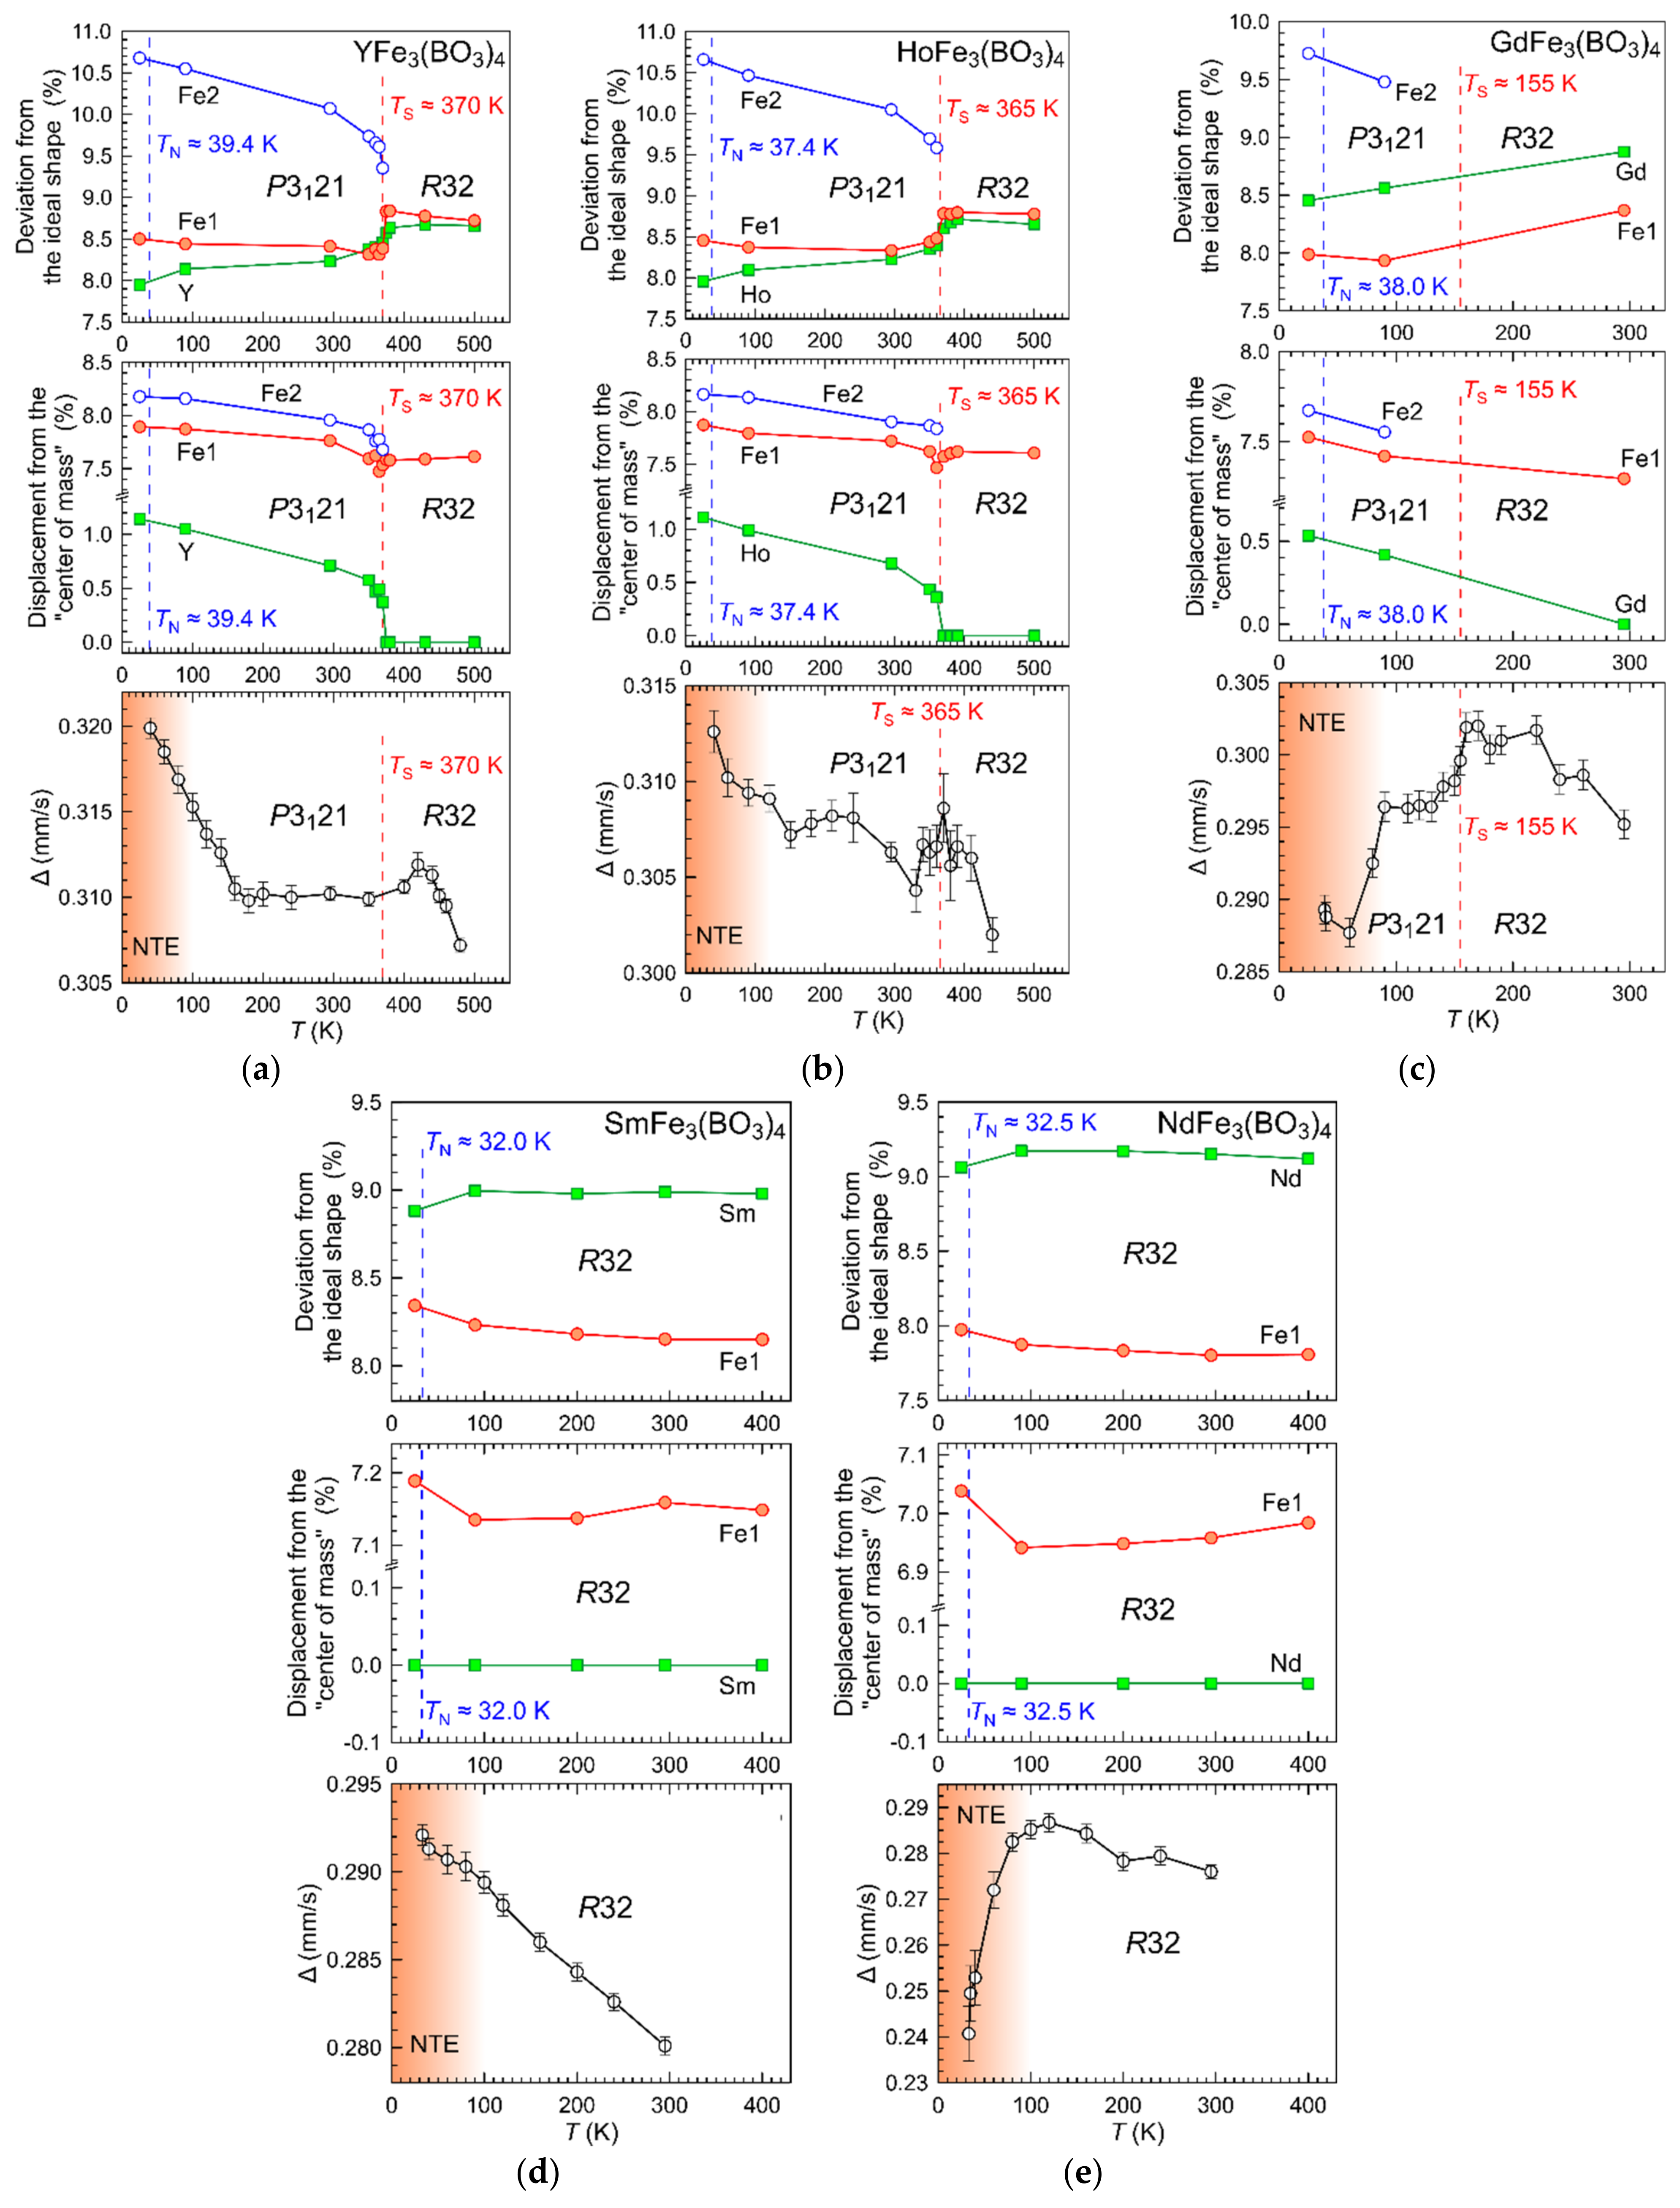
Figure 16 shows the temperature dependencies of the relative deviation of oxygen polyhedra around iron and rare-earth ions from an ideally symmetrical shape in the temperature range T = 25–500 K. The data are based on XRD results. For all studied rare-earth iron borates, the dynamics of the dependencies are similar in the same space group. Meanwhile, the temperature dependencies of the quadrupole splitting Δ(T), shown in Figure 16, demonstrates different and complex dynamics in the regions of the structural phase transition and negative thermal expansion (NTE). This behavior only partially correlates with the dynamics of the distortion of the polyhedral shape of oxygen. This clearly indicates the insufficiency of only accounting for the contribution of the first coordination sphere of ions when calculating the EFG in rare-earth iron borates.
Table 4. Characteristic temperatures and magnetic order parameters determined in RFe3(BO3)4 crystals by XRD, MS, and neutron diffraction (ND) methods. ΘM: Mössbauer Debye temperature (MS); ΘD: Debye temperature for iron atoms determined by XRD; TN: Néel temperature (MS); β: critical coefficient (MS); TSR: spin-reorientation temperature (ND, MS).
RYHoGdSmNd
ΘM (K)390(2)440(2)
[42]
445(2)490(2)
[33]
485(2)
[60]
ΘD (K)R32Fe1472(19)478(15)-420(10)439(3)
P3121Fe1422(4)439(4)---
Fe2416(5)430(2)---
Fe1-Fe2 separation by MSNoYes, below TNYes, below TN--
TN (K)39.42(16)
[18]
37.42(1)
[42]
38.0(1)
[39]
31.93(5)
[33]
32.54(4)
[60]
βR32Fe1---0.343(1)0.324(1)
P3121Fe10.369(16)0.283(1)0.33(1)--
Fe20.283(1)0.29(2)
nR32Fe1---2, XY or plane Izing1, one-dimensional Izing
P3121Fe13, Heisenberg1, one-dimensional Izing2, XY or plane Izing--
Fe21, one-dimensional Izing1, one-dimensional Izing
TSR (K)-4.4(3)≈ 10--
Orientation of ion
magnetic moments (above/below
TSR)
R32R---in ab plane
[14]
in ab plane
[20,21]
Fe1in ab planein ab plane
P3121R-in ab plane/
along c axis, partially off axis
[17]
about 45° to the c axis/
along c axis
[23,39,66,67]
--
Fe1in ab plane
[17]
slightly out of ab plane (increase on cooling)/
along c axis
from 15° to 30° (on cooling) to the ab plane/
about 45° to the c axis
Fe2in ab planein ab plane/
along c axis
From the temperature dependencies of isomer shifts δ(T) in the Mössbauer spectra, the values of Mössbauer Debye temperature ΘM for the subsystem of iron ions in all studied iron borates were calculated using the standard method [61,62]. Table 4 provides the ΘM values in comparison with the Debye temperatures of the iron ion subsystem calculated from the XRD data.
Upon cooling to below T = 40 K, the Mössbauer spectra of all studied rare-earth iron borates demonstrated a characteristic Zeeman splitting (Figure 15b), indicating the appearance of magnetic ordering of the iron ion subsystem (Table 4). The experimental dependencies of the magnetic hyperfine field at 57Fe nuclei Bhf(T) near TN were approximated by the model of critical coefficients, B(T) = B0(1−T/TN)β [63], to calculate the values of Néel temperature and coefficient β. The value of critical coefficient allows one to determine the dimensions of magnetic lattice d and magnetic order parameter n [64,65]. The value d = 1 corresponds to one-dimensional magnetic chains, d = 2 is related to the layered magnetic structure or surface, and d = 3 is typical of the bulk magnetic material. The parameter n is determined by the model describing the magnetic system. The Ising model (n = 1) allows for two-dimensional (β ≈ 0.125) and three-dimensional (β ≈ 0.31) long-range order, while the low-dimensional order (d = 1 and 2) is absent in the XY (n = 2, β ≈ 0.33) and Heisenberg (n = 3, β ≈ 0.35) models. A long-range order for all n exists only at d = 3.
It was previously established in our study [18,33,39,42,60] that the values of critical coefficient β obtained from MS measurements and the type and dimension of magnetic ordering for all RFe3(BO3)4 crystals correlated well with the data on the magnetic structure and orientation of the Fe and R magnetic moments obtained from neutron diffraction experiments [14,17,20,21], antiferromagnetic resonance [66], and magnetic X-ray scattering [67] (Table 4).
We found that, in the rare-earth iron borates with R = Nd and Sm (R32 space group), the low-temperature Mössbauer spectra were well-approximated by a single magnetic sextet [33,60]. In iron borates with R = Y, Ho, and Gd, the crystal structure at T < TN was described by space group P3121, and iron ions were located in two non-equivalent sites, Fe1 and Fe2. The low-temperature Mössbauer spectra of HoFe3(BO3)4 and GdFe3(BO3)4 compounds allow one to distinguish the contributions of Fe1 and Fe2 ions [39,42]. Figure 15b shows an example approximation of the spectrum of GdFe3(BO3)4 at T = 5 K by two pseudo-Voigt sextets corresponding to the Fe1 and Fe2 sites. However, for the YFe3(BO3)4 compound, which does not contain a rare-earth ion, the spectra in the magnetically ordered state exhibit only one symmetrical pseudo-Voigt sextet [18] and the contributions of Fe1 and Fe2 ions cannot be separated.
Note that all three Ho, Gd, and Y iron borates demonstrated similar distortion dynamics of the oxygen polyhedra of R and Fe ions upon cooling from T = 90 to 25 K (Figure 16a–c). For rare-earth ions, the deviation of RO6 from the regular trigonal prism decreased, while for iron ions in both Fe1 and Fe2 positions, the deviation of FeO6 from the regular octahedron increased. A similar behavior was observed for the compounds with R = Nd and Sm when cooling from 90 K to 25 K (Figure 16d,e). In these compounds, the deviation of RO6 from the shape of a regular trigonal prism decreased, while that of FeO6 from a regular octahedron increased.
The similarity of the dynamics indicates that, in a magnetically ordered state, a change in the shape of the nearest oxygen environment of magnetic ions does not significantly affect the magnetic behavior and exchange interaction between these ions.
Thus, the structurally determined difference in the strength of exchange interactions R–Fe1 and R–Fe2 between the rare-earth ions and iron ions in two non-equivalent positions only appears in the Mössbauer spectra in the magnetically ordered states of HoFe3(BO3)4 and GdFe3(BO3)4. Upon further cooling, this difference plays an important role in the competition between R–Fe and Fe–Fe exchange interactions along the FeO6 helicoidal chains, leading to spin-reorientation transitions at TSR = 4.4 K (R = Ho) [42] and TSR = 10 K (R = Gd) [39] (see Table 4).

4. Conclusions

The crystal structure of rare-earth iron borates R1−xBixFe3(BO3)4 (R = Nd, Sm, Gd, Ho, and Y) was refined in the region of magnetic ordering using single-crystal XRD at 25 K. The crystal structure dynamics in the temperature range of 25–500 K were discussed based on XRD and MS results.
The temperature dependencies of the closest interatomic distances and distortions of the coordination polyhedra, previously obtained in the range of 90–500 K, were retained, except for those of Fe–Fe distances and Fe–O–Fe angles in iron chains directed along crystallographic axis c.
A slight increase in Fe–Fe intrachain distances and Fe–O–Fe angles at 25 K in the structures in both P3121 and R32 space groups may cause an anomalous increase in unit cell parameter c in the low-temperature region, observed earlier at below 100 K.
Distortions in characteristic interatomic distances and angles, related to structural phase transition R32 → P3121 (R = Gd, Ho, and Y) and absent in the crystals without a structural phase transition from space group R32 (R = Nd and Sm), became stronger at 25 K. These distortions were observed in Fe–Fe intrachain and interchain, R–O, R–B, and R–Fe distances, and in angles of deviation of BO3 triangles from the ab plane. Fe–O distances in the first coordination sphere of iron atoms (distorted FeO6 octahedra) changed little for compounds with R = Nd, Sm, Gd, Ho, and Y and with reduced temperature. The most stable was the closest coordination of boron atoms in BO3 triangles, especially in the B1O3 triangle, connecting three iron chains and having no mutual vertexes with the RO6 trigonal prism.
Compared to Ho and Y compounds, an increase in the longest interatomic distances and a decrease in the shortest ones appeared in Gd crystals with a temperature delay when the temperature was reduced. This may be due to both the looser coordination packing of the smaller rare-earth atoms and the presence of diamagnetic bismuth atoms with larger ionic radii in the structures, which is supposed to lead to additional local distortions that increase with an increase in the difference between the ionic radii of R and Bi.
At the same time, for R1-xBixFe3(BO3)4 with R = Nd, Sm, Gd, Ho and Y, the temperature dependencies of quadrupole splitting Δ(T) in Mössbauer spectra demonstrated various complex dynamics, in both the vicinity of the structural phase transition and the region of negative thermal expansion. This only partially correlated with the dynamics of the dependencies of the shape distortion of FeO6 polyhedra.
In addition, the Mössbauer spectra did not allow one to distinguish iron ions in the Fe1 LT and Fe2 LT positions (space group P3121, LT; space group R32, HT) for crystals in the paramagnetic state. They could only distinguish Fe1 LT and Fe2 LT ions in the magnetically ordered state for Ho and Gd crystals, not for Y crystals. Therefore, when analyzing magnetoelectric interactions, it is not sufficient to only account for the contribution of the ions of the first coordination sphere.
A special role of oxygen atoms O2 LT (second coordination sphere of rare-earth atoms, Wycoff position 6c) was found in the iron borate structures with Gd, Ho, and Y, in contrast to those with Nd and Sm. The shift of O2 LT toward the R atom led to the formation of a bicapped trigonal prism RO8. This caused a strong deviation in the B2O3 LT triangle from the ab plane and its rotation to the direction of rare-earth atoms. It also led to different rearrangements of the two types of iron chains and influenced the exchange and super-exchange paths.
Based on interatomic distances, the hierarchy of Fe–Fe exchange paths and super-exchange paths Fe–O–Fe, Fe–O–R, and Fe–O–O–Fe were considered at 25 K.
The dominant role of the intrachain Fe–Fe interaction and the prevailing role of the R–Fe interaction over Fe–Fe interchain were established. The shortened Fe1–Fe1 LT distance compared to Fe2–Fe2 LT for Gd, Y, and Ho crystals may have led to a stronger exchange interaction in the first iron chain. This may explain the higher Néel temperatures for these compounds compared to those with R = Nd and Sm.
The number of non-equivalent Fe–O–Fe intrachain, Fe–O–Fe interchain, and Fe–O–R–O–Fe paths in the structures described by the P3121 space group increased compared to R32 structures. The hierarchy of these paths was the same for compounds in the same space group with different rare-earth ions in their composition, but the summarized length varied. Depending on the differences in distance and angle, different super-exchange paths can dominate at different temperatures in crystals, the structures of which are described by P3121 and R32 space groups.
The shortest Fe–O–Fe intrachain paths were via oxygen atoms in the coordination of the most stable B1O3 triangle, which indicates the predominance of intrachain over interchain interactions. The longest summarized Fe–O–Fe distance was Fe2–O2–Fe2 LT, which was due to the displacement of O2 LT oxygen atoms in the direction of the R position with both a decreased R radius and lower temperature, which demonstrates the existence of distant R–Fe interactions. Among the Fe–O–O–Fe, Fe–O–R, and Fe–O–O–R paths, the shortest ones passed via the B2O3 LT triangle and the O2–O3 LT edge of the RO8 bicapped trigonal prism. This demonstrates the importance of the B2O3 LT triangle in the super-exchange interaction between different iron chains and between iron and rare-earth atoms.
It was only possible to determine the contributions of Fe1 LT and Fe2 LT positions in the Mössbauer spectra for magnetically ordered holmium and gadolinium iron borates due to the structurally determined difference in the strength of the R–Fe1 and R–Fe2 exchange interactions between rare-earth and iron ions. Upon further cooling, this difference plays an important role in the competition between R–Fe and Fe–Fe exchange interactions along FeO6 helicoidal chains.

Supplementary Materials

The following supporting information can be downloaded at: https://www.mdpi.com/article/10.3390/cryst12091203/s1. Videos S1–S3 supporting to Figure 11 and Figure 12, structure information CIF-files CIF S1-S5 for R1−xBixFe3(BO3)4, R = Nd, Sm, Gd, Ho, Y at 25 K.

Author Contributions

Conceptualization, O.A.A., K.V.F. and E.S.S.; writing—original draft preparation, E.S.S., O.A.A., K.V.F.; writing—review and editing, E.S.S., K.V.F., O.A.A., M.V.L. and I.S.L.; single-crystal XRD, E.S.S.; Mössbauer spectroscopy, K.V.F.; crystal growth, I.A.G.; formal analysis, O.A.A., E.S.S. and K.V.F.; data curation, E.S.S. and K.V.F.; visualization, E.S.S., O.A.A. and K.V.F.; supervision and project administration, O.A.A., K.V.F. and I.S.L. All authors have read and agreed to the published version of the manuscript.

Funding

This research was funded by the Ministry of Science and Higher Education within the State assignment FSRC ‘Crystallography and Photonics’ RAS 075-01025-22-00.

Institutional Review Board Statement

Not applicable.

Informed Consent Statement

Not applicable.

Data Availability Statement

Crystal structure datasets were deposited via the joint CCDC/FIZ Karlsruhe deposition service at https://www.ccdc.cam.ac.uk and assigned Deposition Numbers CSD 2176631–2176635.

Acknowledgments

This work was performed using the equipment of the Shared Research Center FSRC ‘Crystallography and Photonics’ RAS supported by the Russian Ministry of Science and Higher Education.

Conflicts of Interest

The authors declare no conflict of interest.

Appendix A. Interatomic Distances in the Closest Coordination Spheres

Table A1. B–O distances (in Å) for R1−xBixFe3(BO3)4 R = Nd, Sm, Gd, Ho, and Y at 25 K. LT and HT denotes atomic labels in space groups P3121 and R32, respectively. Averaged distances and distance difference Δ are given to the third decimal place.
RNd0.91Bi0.09Sm0.93Bi0.07Gd0.95Bi0.05Ho0.96Bi0.04Y0.95Bi0.05
Space groupR32R32P3121P3121P3121
B1O3–triangle
B1–O5 LT (O1 HT) × 2
B1–O6 LT (O1 HT)
(B1–O)ave
Δ (max–min)
1.3823(3)
1.3823(3)
1.382
0
1.3805(3)
1.3805(3)
1.381
0
1.3801(15)
1.3802(10)
1.380
0
1.3768(10)
1.3753(7)
1.376
0.002
1.3762(13)
1.3770(8)
1.376
0.001
B2O3–triangle
B2–O2 LT (O2 HT)
B2 –O3 LT (O3 HT)
B2– O7 LT (O3 HT)
(B2–O)ave
Δ (max–min)
1.3796(6)
1.3698(8)
1.3698(8)
1.373
0.010
1.3775(6)
1.3715(8)
1.3715(8)
1.374
0.006
1.3782(9)
1.3733(15)
1.3650(19)
1.372
0.013
1.3793(6)
1.3726(10)
1.3648(13)
1.372
0.014
1.3793(7)
1.3723(11)
1.3658(13)
1.372
0.014
B3O3–triangle
B3– O4 LT (O3 HT) × 2
B3–O1 LT (O2 HT)
(B3–O)ave
Δ (max–min)
1.3698(8)
1.3796(6)
1.373
0.010
1.3715(8)
1.3775(6)
1.374
0.006
1.3790(8)
1.3748(15)
1.378
0.004
1.3813(6)
1.3707(10)
1.378
0.011
1.3811(6)
1.3718(12)
1.378
0.010
Table A2. Closest distances to rare-earth atom (in Å) for R1−xBixFe3(BO3)4 R = Nd, Sm, Gd, Ho, and Y at 25 K. LT and HT denotes atomic labels in space groups P3121 and R32, respectively. Averaged distances (ave) and distance difference Δ between closest and farthest distance are given to the third decimal place. For RO6 polyhedron, distortion from a regular trigonal prism is given (%) and displacement of R atom from centre of mass.
RNd0.91Bi0.09Sm0.93Bi0.07Gd0.95Bi0.05Ho0.96Bi0.04Y0.95Bi0.05
Space groupR32R32P3121P3121P3121
RO6–prism (1st coordination sphere)
R–O3 LT (O3 HT) × 2
R–O4 LT (O3 HT) × 2
R–O7 LT (O3 HT) × 2
(R–O)ave
Δ (max–min)
Distortion (%)
Displacement MC (%)
2.3976(4)
2.3976(4)
2.3976(4)
2.398
0
9.06
0
2.3793(4)
2.3793(4)
2.3793(4)
2.379
0
8.99
0
2.3519(8)
2.3907(8)
2.3495(6)
2.364
0.041
8.45
0.53
2.3253(8)
2.3834(6)
2.3196(5)
2.343
0.064
8.09
0.99
2.3248(6)
2.3820(6)
2.3175(5)
2.341
0.065
7.95
1.05
R–O distance (2nd coordination sphere)
R–O1 LT (O2 HT)
R–O2 LT (O2 HT)
3.1636(5)
3.1636(5)
3.1601(3)
3.1601(3)
3.1462(2)
2.8987(7)
3.1515(10)
2.8210(10)
3.1522(10)
2.8180(10)
R–B distance (2nd coordination sphere)
R–B2min LT (B2 HT) × 2
R–B2max LT (B2 HT) × 2
R–B3 LT (B2 HT) × 2
(R–B)ave
Δ (max–min)
3.0853(5)
3.0853(5)
3.0853(5)
3.085
0
3.0778(6)
3.0778(6)
3.0778(6)
3.078
0
2.9738(12)
3.1533(9)
3.0760(12)
3.068
0.180
2.9332(9)
3.1608(6)
3.0769(2)
3.057
0.228
2.9315(10)
3.1628(7)
3.0771(2)
3.057
0.231
R–B distance (3rd coordination sphere)
R–B1 LT (B1 HT) × 23.7980(1)3.7910(4)3.7796(5)3.7691(5)3.7712(5)
R–Fe distance (3rd coordination sphere)
R–Fe1 LT (Fe1 HT) × 2
R–Fe2min LT (Fe1 HT) × 2
R–Fe2max LT (Fe1 HT) × 2
(R–Fe)ave
Δ (max–min)
3.7814(1)
3.7814(1)
3.7814(1)
3.781
0
3.7736(1)
3.7736(1)
3.7736(1)
3.774
0
3.7662(2)
3.6960(3)
3.8244(3)
3.762
0.128
3.7654(2)
3.6588(2)
3.8275(3)
3.751
0.168
3.7663(2)
3.6597(2)
3.8280(3)
3.751
0.168
Table A3. Closest distances to iron atoms (in Å) for R1−xBixFe3(BO3)4 R = Nd, Sm, Gd, Ho, and Y at 25 K. LT and HT denotes atomic labels in space groups P3121 and R32, respectively. Averaged distances (ave) and distance difference Δ are given to the third decimal place. For FeO6 polyhedra, distortion from a regular octahedron (%) and displacement of Fe atom from centre of mass is given.
RNd0.91Bi0.09Sm0.93Bi0.07Gd0.95Bi0.05Ho0.96Bi0.04Y0.95Bi0.05
Space groupR32R32P3121P3121P3121
Fe1O6 octahedra (1st coordination sphere)
Fe1–O1 LT (O2 HT) × 2
Fe1–O3 LT (O3 HT) × 2
Fe1–O6 LT (O1 HT) × 2
(Fe1–O)ave
Δ (max-min)
Distortion(%)
Displacement MC (%)
2.0462(4)
1.9585(3)
2.0270(3)
2.011
0.088
7.97
7.04
2.0396(4)
1.9620(3)
2.0230(3)
2.008
0.078
8.23
7.14
2.0430(6)
1.9562(6)
2.0070(7)
2.002
0.087
7.99
7.53
2.0388(5)
1.9628(7)
2.0011(6)
2.001
0.076
8.45
8.79
2.0379(5)
1.9626(5)
2.0010(5)
2.001
0.075
8.50
7.87
Fe2O6 octahedra (1st coordination sphere)
Fe2–O2min LT (O2 HT)
Fe2–O2max LT (O2 HT)
Fe2–O4 LT (O3 HT)
Fe2–O5min LT (O1 HT)
Fe2–O5max LT (O1 HT)
Fe2–O7 LT (O3 HT)
(Fe2–O)ave
Δ (max-min)
Distortion(%)
Displacenent MC
2.0462(4)
2.0462(4)
1.9585(3)
2.0270(3)
2.0270(3)
1.9585(3)
2.011
0.088
7.97
7.04
2.0396(4)
2.0396(4)
1.9620(3)
2.0230(3)
2.0230(3)
1.9620(3)
2.008
0.078
8.23
7.14
2.0409(8)
2.0506(5)
1.9640(6)
2.0190(8)
2.0247(6)
1.9730(8)
2.012
0.087
9.73
7.67
2.0388(5)
2.0586(4)
1.9651(5)
2.0126(7)
2.0251(5)
1.9803(7)
2.013
0.094
10.46
8.13
2.0392(7)
2.0603(5)
1.9666(5)
2.0152(6)
2.0232(5)
1.9832(6)
2.015
0.094
10.55
8.15
Fe1–B distance (2nd coordination sphere)
Fe1–B1 LT (B1 HT) × 2
Fe1–B2 LT (B2 HT) × 2
Fe1–B3 LT (B2 HT) × 2
(Fe1–B)ave
Δ (max-min)
3.0807(1)
3.0611(6)
3.1049(7)
3.082
0.043
3.074(1)
3.0575(7)
3.0943(7)
3.075
0.037
3.0577(9)
3.0878(13)
3.1024(12)
3.083
0.045
3.0465(4)
3.0919(7)
3.0935(2)
3.077
0.047
3.0474(8)
3.0914(10)
3.0937(8)
3.078
0.046
Fe2–B distance (2nd coordination sphere)
Fe2–B1min LT (B1 HT)
Fe2–B1max LT (B1 HT)
Fe2–B2I LT (B2 HT)
Fe2–B2II LT (B2 HT)
Fe2–B2III LT (B2 HT)
Fe2–B3 LT (B2 HT)
(Fe2–B)ave
Δ (max-min)
3.0807(1)
3.0807(1)
3.0611(6)
3.0611(6)
3.0611(6)
3.1049(7)
3.075
0.044
3.074(1)
3.074(1)
3.0575(7)
3.0575(7)
3.0575(7)
3.0943(7)
3.069
0.037
3.0572(8)
3.0804(9)
3.0263(13)
3.0435(9)
3.0923(13)
3.0513(11)
3.059
0.066
3.0420(4)
3.0776(5)
3.0164(9)
3.0189(6)
3.0812(9)
3.0344(8)
3.045
0.065
3.0429(7)
3.0761(8)
3.0169(10)
3.0200(7)
3.081(10)
3.0443(8)
3.047
0.064
Fe–Fe distances inside chains (2rd coordination sphere)
Fe1-Fe1intra
Fe2-Fe2intra
(Fe1–Fe1)ave
Δ (max-min)
3.1824(1)
3.1824(1)
3.182
0
3.1810(1)
3.1810(1)
3.181
0
3.1597(3)
3.1908(3)
3.175
0.031
3.1555(3)
3.1970(3)
3.176
0.041
3.1571(3)
3.1980(3)
3.176
0.041
Fe–Fe distances between chains (4th coordination sphere)
Fe1-Fe2interI
Fe1-Fe2interII (ab plane)
Fe1-Fe2interIII (ab plane)
Fe2-Fe2interI
Fe2-Fe2interII (ab plane)
(Fe1–Fe1)ave
Δ (max-min)
4.4054(1)
4.8646(1)
4.8646(1)
4.4054(1)
4.8646(1)
4.681
0.459
4.3907(1)
4.8537(1)
4.8537(1)
4.3907(1)
4.8537(1)
4.669
0.463
4.3438(1)
4.8337(2)
4.8436(2)
4.4184(1)
4.8416(1)
4.656
0.500
4.3080(1)
4.8193(1)
4.8261(2)
4.4100(2)
4.8263(2)
4.638
0.518
4.3092(1)
4.8183(2)
4.8263(1)
4.4086(1)
4.8260(1)
4.638
0.517
Table A4. Interatomic distances in possible super-exchange paths for Sm0.93Bi0.07Fe3(BO3)4 (R32) and Gd0.95Bi0.05Fe3(BO3)4 (P3121) at 25 K. Distances for each pair of atoms in the path are divided by en-dash. Boron atoms connected to oxygen atoms are shown in parentheses. Summarized distance in the paths is given in brackets.
Sm0.93Bi0.07Fe3(BO3)4 (HT Labels)Gd0.95Bi0.05Fe3(BO3)4 (LT Labels)
Intrachain Fe–O–Fe
Fe1–Fe13.1810(1)Fe1–Fe1
Fe2–Fe2
3.1597(3)
3.1908(3)
Intrachain Fe–O–Fe
Fe1–O1–Fe1
Fe1–O2–Fe2
2.0230(3)–2.0230(3) [4.046]
2.0396(4)–2.0396(4) [4.0792]
Fe2–O5–Fe2
Fe2–O2–Fe2
Fe1–O6–Fe1
Fe1–O1–Fe1
2.0189(7)–2.0247(5) [4.0436]
2.0506(5)–2.0409(5) [4.0915]
2.0070(7)–2.0070(7) [4.014]
2.0430(5)–2.0430(5) [4.086]
Interchain Fe–O–Fe
Fe1–O1–O1–Fe1 (B1)

Fe1–O2–O3–Fe1 (B2)

Fe1–O3–O3–Fe1 (B2)
2.0230(3)–2.3911(7)–2.0230(3) [6.4371]
2.0396(4)–2.3534(5)– 1.9620(3)
[6.355]
1.9620(3)–2.4274(7)–1.9620(3) [6.3514]
Fe2–O4–O1–Fe1
Fe2–O5–O6–Fe1
Fe2–O7–O3–Fe1
Fe2–O5’–O6’–Fe1
Fe2–O2–O3–Fe1
Fe2–O2’–O3’–Fe1
Fe2–O4–O4–Fe2
Fe2–O5–O5–Fe2
Fe2–O5–O5–Fe2’
Fe2–O7–O2–Fe2
Fe2–O7–O2–Fe2’
Fe2–O5’–O5’–Fe2
1.9640(6)–2.3572(8)–2.0430(5) [6.3642]
2.0189(7)–2.3816(9)–2.0070(6) [6.4075]
1.9730(9)–2.4239(9)–1.9562(7) [6.3531]
2.0247(6)–2.3816(11)– 2.0070(6) [6.4133]
2.0506(5)–2.3305(11)–1.9562(8) [6.3373]
2.0409(7)–2.3305(11)–1.9562(8) [6.3276]
1.9640(6)–2.4413(12)–1.9640(6) [6.3693]
2.0189(7)–2.4079(11)–2.0247(7) [6.4515]
2.0189(7)–2.4079(11)–2.0189(6) [6.4457]
1.9730(9)–2.3717(12)–2.0409(5) [6.3856]
1.9730(9)–2.3717(12)–2.0505(6) [6.3952]
2.0247(6)–2.4079(13)–2.0247(5) [6.4573]
Fe–O–R, Fe–O–R–O–Fe
Fe1–O3–R (B2)
Fe1–O3–O3–R (B2)
1.9620(3)–2.3793(4) [4.3413]
1.9620(3)–2.4272(7)–2.3793(4) [6.7327]
Fe2–O4–R (B3)
Fe2–O7–R (B2)
Fe2–O2–R (B2)
Fe2–O2’–R (B2)
Fe2–O4–O4–R (B3)
Fe2–O7–O3–R (B2)
Fe2–O7–O2–R (B2)
Fe2–O2–O3–R (B2)
Fe2–O2–O7–R (B2)
Fe2–O2’–O3–R (B2)
Fe2–O2’–O7–R (B2)
Fe1–O3–R (B2)
Fe1–O3–O2–R (B2)
Fe1–O3–O7–R (B2)
Fe1–O1–O4–R (B3)
1.9640(6)–2.3907(8) [4.3547]
1.9730(9)–2.3495(6) [4.3225]
2.0506(5)–2.8987(7) [4.9493]
2.0409(7)–2.8987(6) [4.9396]
1.9640(6)–2.4413(12)–2.3907(7) [6.796]
1.9730(9)–2.4239(9)–2.3519(8) [6.7488]
1.9730(9)–2.3717(12)–2.8987(4) [7.2434]
2.0506(5)–2.3305(7)–2.3519(8) [6.733]
2.0506(5)–2.3717(9)–2.3495(8) [6.7718]
2.0409(7)–2.3305(11) [4.3714]
2.0409(7)–2.3717(8)–2.3495(8) [6.7621]
1.9562(8)–2.3519(6) [4.3081]
1.9562(8)– 2.3305(11)–2.8987(7) [7.1854]
1.9562(8)–2.4239(9)–2.3495(8) [6.7296]
2.0430(5)–2.3571(10)–2.3907(6) [6.7908]

References

  1. Vasiliev, A.N.; Popova, E.A. Rare-Earth Ferroborates RFe3(BO3)4. Low Temp. Phys. 2006, 32, 735–747. [Google Scholar] [CrossRef]
  2. Kadomtseva, A.M.; Popov, Y.F.; Vorob’ev, G.P.; Pyatakov, A.P.; Krotov, S.S.; Kamilov, K.I.; Ivanov, V.Y.; Mukhin, A.A.; Zvezdin, A.K.; Kuz’menko, A.M.; et al. Magnetoelectric and Magnetoelastic Properties of Rare-Earth Ferroborates. Low Temp. Phys. 2010, 36, 511–521. [Google Scholar] [CrossRef]
  3. Kadomtseva, A.M.; Vorob’ev, G.P.; Popov, Y.F.; Pyatakov, A.P.; Mukhin, A.A.; Ivanov, V.Y.; Zvezdin, A.K.; Gudim, I.A.; Temerov, V.L.; Bezmaternykh, L.N. Magnetoelectric and Magnetoelastic Properties of Easy-Plane Ferroborates with a Small Ionic Radius. J. Exp. Theor. Phys. 2012, 114, 810–817. [Google Scholar] [CrossRef]
  4. Kuzmenko, A.M.; Szaller, D.; Kain, T.; Dziom, V.; Weymann, L.; Shuvaev, A.; Pimenov, A.; Mukhin, A.A.; Ivanov, V.Y.; Gudim, I.A.; et al. Switching of Magnons by Electric and Magnetic Fields in Multiferroic Borates. Phys. Rev. Lett. 2018, 120, 027203. [Google Scholar] [CrossRef]
  5. Kuz’menko, A.M.; Mukhin, A.A.; Ivanov, V.Y.; Kadomtseva, A.M.; Bezmaternykh, L.N. Effects of the Interaction between R and Fe Modes of the Magnetic Resonance in RFe3(BO3)4 Rare-Earth Iron Borates. JETP Lett. 2011, 94, 294–300. [Google Scholar] [CrossRef]
  6. Kurumaji, T.; Ohgushi, K.; Tokura, Y. Magnetoelectric Responses from the Respective Magnetic R and Fe Subsystems in the Noncentrosymmetric Antiferromagnets RFe3(BO3)4 (R = Eu, Gd, and Tb). Phys. Rev. B 2014, 89, 195126. [Google Scholar] [CrossRef]
  7. Kuz’micheva, G.; Kaurova, I.; Rybakov, V.; Podbel’skiy, V. Crystallochemical Design of Huntite-Family Compounds. Crystals 2019, 9, 100. [Google Scholar] [CrossRef]
  8. Zvezdin, A.K.; Krotov, S.S.; Kadomtseva, A.M.; Vorob’ev, G.P.; Popov, Y.F.; Pyatakov, A.P.; Bezmaternykh, L.N.; Popova, E.A. Magnetoelectric Effects in Gadolinium Iron Borate GdFe3(BO3)4. J. Exp. Theor. Phys. Lett. 2005, 81, 272–276. [Google Scholar] [CrossRef]
  9. Kuzmenko, A.M.; Mukhin, A.A.; Ivanov, V.Y.; Bezmaternikh, L.N. Coupled R and Fe Magnetic Excitations in RFe3(BO3)4 Multiferroics. Solid State Phenom. 2012, 190, 269–272. [Google Scholar] [CrossRef]
  10. Ritter, C.; Pankrats, A.; Gudim, I.; Vorotynov, A. Magnetic Structure of Iron Borate DyFe3(BO3)4: A Neutron Diffraction Study. In Proceedings of the Journal of Physics: Conference Series, 5th European Conference on Neutron Scattering, Prague, Czech Republic, 17–21 July 2011; Institute of Physics Publishing: Bristol, UK, 2012; Volume 340, p. 012065. [Google Scholar] [CrossRef] [Green Version]
  11. Ritter, C.; Vorotynov, A.; Pankrats, A.; Petrakovskiǐ, G.; Temerov, V.; Gudim, I.; Szymczak, R. Magnetic Structure in Iron Borates RFe3(BO3)4 (R = Er, Pr): A Neutron Diffraction and Magnetization Study. J. Phys. Condens. Matter 2010, 22, 206002. [Google Scholar] [CrossRef]
  12. Ritter, C.; Pankrats, A.I.; Demidov, A.A.; Velikanov, D.A.; Temerov, V.L.; Gudim, I.A. Inclined Magnetic Structure of Iron Borate P Rx Y1-x F E3(BO3)4: A Neutron Diffraction Study and Crystal-Field Calculations. Phys. Rev. B-Condens. Matter Mater. Phys. 2015, 91, 134416. [Google Scholar] [CrossRef]
  13. Pankrats, A.I.; Petrakovskiĭ, G.A.; Bezmaternykh, L.N.; Temerov, V.L. Antiferromagnetic Resonance and Magnetic Anisotropy in Single Crystals of the YFe3(BO3)4-GdFe3(BO3)4 System. Phys. Solid State 2008, 50, 79–83. [Google Scholar] [CrossRef]
  14. Ritter, C.; Pankrats, A.; Gudim, I.; Vorotynov, A. Determination of the Magnetic Structure of SmFe3(BO3)4 by Neutron Diffraction: Comparison with Other RFe3(BO3)4 Iron Borates. J. Phys. Condens. Matter 2012, 24, 386002. [Google Scholar] [CrossRef]
  15. Ritter, C.; Balaev, A.; Vorotynov, A.; Petrakovskii, G.; Velikanov, D.; Temerov, V.; Gudim, I. Magnetic Structure, Magnetic Interactions and Metamagnetism in Terbium Iron Borate TbFe3(BO3)4: A Neutron Diffraction and Magnetization Study. J. Phys. Condens. Matter 2007, 19, 196227. [Google Scholar] [CrossRef]
  16. Pankrats, A.I.; Demidov, A.A.; Ritter, C.; Velikanov, D.A.; Semenov, S.V.; Tugarinov, V.I.; Temerov, V.L.; Gudim, I.A. Transformation from an Easy-Plane to an Easy-Axis Antiferromagnetic Structure in the Mixed Rare-Earth Ferroborates PrxY1-XFe3(BO3)4: Magnetic Properties and Crystal Field Calculations. J. Phys. Condens. Matter 2016, 28, 96001. [Google Scholar] [CrossRef]
  17. Ritter, C.; Vorotynov, A.; Pankrats, A.; Petrakovskii, G.; Temerov, V.; Gudim, I.; Szymczak, R. Magnetic Structure in Iron Borates RFe3(BO3)4 (R = Y, Ho): A Neutron Diffraction and Magnetization Study. J. Phys. Condens. Matter 2008, 20, 365209. [Google Scholar] [CrossRef]
  18. Frolov, K.V.; Lyubutin, I.S.; Alekseeva, O.A.; Smirnova, E.S.; Verin, I.A.; Temerov, V.L.; Bezmaternykh, L.N.; Gudim, I.A.; Artemov, V.V.; Dmitrieva, T.V. Dynamics of Structural and Magnetic Phase Transitions in Ferroborate YFe3(BO3)4. J. Alloys Compd. 2018, 748, 989–994. [Google Scholar] [CrossRef]
  19. Kadomtseva, A.M.; Kuvardin, A.V.; Pyatakov, A.P.; Zvezdin, A.K.; Vorob’ev, G.P.; Popov, Y.F.; Bezmaternykh, L.N. Magnetic Magnetoelectric and Magnetoelastic Properties of New Multiferroic Material NdFe3(BO3)4. arXiv 2006, arXiv:cond-mat/0607217. [Google Scholar] [CrossRef]
  20. Janoschek, M.; Fischer, P.; Schefer, J.; Roessli, B.; Pomjakushin, V.; Meven, M.; Petricek, V.; Petrakovskii, G.; Bezmaternikh, L. Single Magnetic Chirality in the Magnetoelectric NdFe3( 11BO3)4. Phys. Rev. B-Condens. Matter Mater. Phys. 2010, 81, 094429. [Google Scholar] [CrossRef] [Green Version]
  21. Fischer, P.; Pomjakushin, V.; Sheptyakov, D.; Keller, L.; Janoschek, M.; Roessli, B.; Schefer, J.; Petrakovskii, G.; Bezmaternikh, L.; Temerov, V.; et al. Simultaneous Antiferromagnetic Fe3+ and Nd3+ Ordering in NdFe3(11BO3)4. J. Phys. Condens. Matter 2006, 18, 7975–7989. [Google Scholar] [CrossRef]
  22. Partzsch, S.; Hamann-Borrero, J.E.; Mazzoli, C.; Herrero-Martin, J.; Valencia, S.; Feyerherm, R.; Dudzik, E.; Vasiliev, A.; Bezmaternykh, L.; Büchner, B.; et al. Control of Coexisting Magnetic Phases by Electric Fields in NdFe3(BO3)4. Phys. Rev. B 2016, 94, 054421. [Google Scholar] [CrossRef]
  23. Kharlamova, S.A.; Ovchinnikov, S.G.; Balaev, A.D.; Thomas, M.F.; Lyubutin, I.S.; Gavriliuk, A.G. Spin Reorientation Effects in GdFe3(BO3)4 Induced by Applied Field and Temperature. J. Exp. Theor. Phys. 2005, 101, 1098–1105. [Google Scholar] [CrossRef]
  24. Popova, E.A.; Tristan, N.; Hess, C.; Klingeler, R.; Büchner, B.; Bezmaternykh, L.N.; Temerov, V.L.; Vasil’Ev, A.N. Magnetic and Thermal Properties of Single-Crystal NdFe3(BO3)4. J. Exp. Theor. Phys. 2007, 105, 105–107. [Google Scholar] [CrossRef]
  25. Chaudhury, R.P.; Yen, F.; Lorenz, B.; Sun, Y.Y.; Bezmaternykh, L.N.; Temerov, V.L.; Chu, C.W. Magnetoelectric Effect and Spontaneous Polarization in HoFe3(BO3)4 and Ho0.5 Nd0.5 Fe3(BO3)4. Phys. Rev. B-Condens. Matter Mater. Phys. 2009, 80, 104424. [Google Scholar] [CrossRef]
  26. Bezmaternykh, L.N.; Kharlamova, S.A.; Temerov, V.L. Flux Crystallization of Trigonal GdFe3(BO3)4 Competing with the Crystallization of α-Fe2O3. Crystallogr. Rep. 2004, 49, 855–857. [Google Scholar] [CrossRef]
  27. Gudim, I.A.; Eremin, E.V.; Temerov, V.L. Flux Growth and Spin Reorientation in Trigonal Nd1−xDyxFe3(BO3)4 Single Crystals. J. Cryst. Growth 2010, 312, 2427–2430. [Google Scholar] [CrossRef]
  28. Eremin, E.; Gudim, I.; Temerov, V.; Smolyakov, D.; Molokeev, M. Comparing the Magnetic and Magnetoelectric Properties of the SmFe3(BO3)4 Ferroborate Single Crystals Grown Using Different Solvents. J. Cryst. Growth 2019, 518, 1–4. [Google Scholar] [CrossRef]
  29. Smirnova, E.S.; Alekseeva, O.A.; Dudka, A.P.; Khmelenin, D.N.; Frolov, K.V.; Lyubutina, M.V.; Gudim, I.A.; Lyubutin, I.S. Crystal Structure and Structural Phase Transition in Bis-muth-Containing HoFe3(BO3)4 in the Temperature Range 11–500 K. Acta Crystallogr. Sect. B Struct. Sci. Cryst. Eng. Mater. 2019, 75, 954–968. [Google Scholar] [CrossRef]
  30. Smirnova, E.S.; Alekseeva, O.A.; Dudka, A.P.; Verin, I.A.; Artemov, V.V.; Bezmaternykh, L.N.; Gudim, I.A.; Frolov, K.V.; Lyubutin, I.S. Structure of Gd0.95Bi0.05Fe3(BO3)4 Single Crystals at 293 and 90 K. Crystallogr. Rep. 2016, 61, 558–565. [Google Scholar] [CrossRef]
  31. Smirnova, E.S.; Alekseeva, O.A.; Dudka, A.P.; Verin, I.A.; Artemov, V.V.; Lyubutina, M.V.; Gudim, I.A.; Frolov, K.V.; Lyubutin, I.S. Crystal Structure of Bismuth-Containing NdFe3(BO3)4 in the Temperature Range 20–500 K. Acta Crystallogr. Sect. B: Struct. Sci. Cryst. Eng. Mater. 2022, 78, 1–13. [Google Scholar] [CrossRef]
  32. Smirnova, E.S.; Alekseeva, O.A.; Dudka, A.P.; Artemov, V.V.; Zubavichus, Y.V.; Gudim, I.A.; Bezmaterhykh, L.N.; Frolov, K.V.; Lyubutin, I.S. Crystal Structure, Phase Transition and Structural Deformations in Iron Borate (Y0.95Bi0.05)Fe3(BO3)4 in the Temperature Range 90–500 K. Acta Crystallogr. Sect. B Struct. Sci. Cryst. Eng. Mater. 2018, 74, 226–238. [Google Scholar] [CrossRef]
  33. Smirnova, E.S.; Alekseeva, O.A.; Dudka, A.P.; Sorokin, T.A.; Khmelenin, D.N.; Yapaskurt, V.O.; Lyubutina, M.V.; Frolov, K.V.; Lyubutin, I.S.; Gudim, I.A. Crystal Structure, Absolute Configuration and Characteristic Temperatures of SmFe3(BO3)4 in the Temperature Range 11–400 K. Acta Crystallogr. Sect. B Struct. Sci. Cryst. Eng. Mater. 2022, 78, 546–556. [Google Scholar] [CrossRef]
  34. Popova, M.N.; Malkin, B.Z.; Boldyrev, K.N.; Stanislavchuk, T.N.; Erofeev, D.A.; Temerov, V.L.; Gudim, I.A. Evidence for a Collinear Easy-Plane Magnetic Structure of Multiferroic EuF E3(BO3)4: Spectroscopic and Theoretical Studies. Phys. Rev. B 2016, 94, 184418. [Google Scholar] [CrossRef]
  35. Popov, Y.F.; Pyatakov, A.P.; Kadomtseva, A.M.; Vorob’ev, G.P.; Zvezdin, A.K.; Mukhin, A.A.; Ivanov, V.Y.; Gudim, I.A. Peculiarities in the Magnetic, Magnetoelectric, and Magnetoelastic Properties of SmFe3(BO3)4 Multiferroic. J. Exp. Theor. Phys. 2010, 111, 199–203. [Google Scholar] [CrossRef]
  36. Popova, M.N.; Chukalina, E.P.; Boldyrev, K.N.; Stanislavchuk, T.N.; Malkin, B.Z.; Gudim, I.A. Spectroscopy of F-f Transitions, Crystal-Field Calculations, and Magnetic and Quadrupole Helix Chirality in DyF E3(BO3)4. Phys. Rev. B 2017, 95, 125131. [Google Scholar] [CrossRef]
  37. Hinatsu, Y.; Doi, Y.; Ito, K.; Wakeshima, M.; Alemi, A. Magnetic and Calorimetric Studies on Rare-Earth Iron Borates LnFe 3(BO3)4 (Ln = Y, La-Nd, Sm-Ho). J. Solid State Chem. 2003, 172, 438–445. [Google Scholar] [CrossRef]
  38. Fausti, D.; Nugroho, A.A.; van Loosdrecht, P.H.M.; Klimin, S.A.; Popova, M.N.; Bezmaternykh, L.N. Raman Scattering from Phonons and Magnons in RFe3(BO3)4. Phys. Rev. B 2006, 74, 024403. [Google Scholar] [CrossRef]
  39. Frolov, K.V.; Lyubutin, I.S.; Smirnova, E.S.; Alekseeva, O.A.; Verin, I.A.; Artemov, V.V.; Kharlamova, S.A.; Bezmaternykh, L.N.; Gudim, I.A. Low-Temperature Structural and Magnetic Phase Transitions in Multiferroic GdFe3(BO3)4. J. Alloys Compd. 2016, 671, 545–551. [Google Scholar] [CrossRef]
  40. Campá, J.A.; Cascales, C.; Gutiérrez-Puebla, E.; Monge, M.A.; Rasines, I.; Ruíz-Valero, C. Crystal Structure, Magnetic Order, and Vibrational Behavior in Iron Rare-Earth Borates. Chem. Mater. 1997, 9, 237–240. [Google Scholar] [CrossRef]
  41. Klimin, S.A.; Fausti, D.; Meetsma, A.; Bezmaternykh, L.N.; van Loosdrecht, P.H.M.; Palstra, T.T.M. Evidence for Differentiation in the Iron-Helicoidal Chain in GdFe3(BO3)4. Acta Crystallogr. Sect. B Struct. Sci. 2005, 61, 481–485. [Google Scholar] [CrossRef]
  42. Frolov, K.V.; Alekseeva, O.A.; Lyubutin, I.S.; Ksenofontov, V.; Smirnova, E.S.; Temerov, V.L.; Gudim, I.A.; Lyubutina, M.A. Structural and Magnetic Phase Transitions in the Multiferroic HoFe3(BO3)4 Detected by Mössbauer Spectroscopy and X-ray Diffraction. JETP 2022, 135. [Google Scholar]
  43. Popova, M.N.; Chukalina, E.P.; Erofeev, D.A.; Gudim, I.A.; Golosovsky, I.V.; Gukasov, A.; Mukhin, A.A.; Malkin, B.Z. High-Resolution Optical Spectroscopy, Magnetic Properties, and Single-Crystal Neutron Diffraction of Multiferroic HoFe3(BO3)4: Magnetic Structure. Phys. Rev. B 2021, 103, 094411. [Google Scholar] [CrossRef]
  44. Golosovsky, I.V.; Mukhin, A.A.; Skumryev, V.; Boehm, M.; Schmidt, W.; Regnault, L.P.; Gudim, I.A. Magnetic Excitations and Exchange Interactions in the Substituted Multiferroics (Nd, Tb)Fe3(BO3)4 Revealed by Inelastic Neutron Scattering. Phys. Rev. B 2021, 103, 214412. [Google Scholar] [CrossRef]
  45. Klimin, S.A.; Kuzmenko, A.B.; Kashchenko, M.A.; Popova, M.N. Infrared Study of Lattice Dynamics and Spin-Phonon and Electron-Phonon Interactions in Multiferroic TbFe3(BO3)4 and GdFe3(BO3)4. Phys. Rev. B 2016, 93, 054304. [Google Scholar] [CrossRef]
  46. Platunov, M.; Kazak, N.; Dudnikov, V.; Wilhelm, F.; Hen, A.; Diadkin, V.; Dovgaliuk, I.; Bosak, A.; Temerov, V.; Gudim, I.; et al. Probing Magnetic Sublattices in Multiferroic Ho0.5Nd0.5Fe3(BO3)4 Single Crystal Using X-ray Magnetic Circular Dichroism. arXiv 2018, arXiv:1804.07057v1. [Google Scholar] [CrossRef]
  47. CrysAlisPro Software System; Version 1.171.41.104a; Rigaku Corporation: Wroclaw, Poland, 2021; Available online: http://www.rigaku.com (accessed on 25 August 2022).
  48. Petrícek, V.; Dušek, M.; Palatinus, L. Crystallographic Computing System JANA2006: General Features. Z. Fur Krist. 2014, 229, 345–352. [Google Scholar] [CrossRef]
  49. Stoiber, D.; Niewa, R. PolyDis: Simple Quantification Tool for Distortion of Polyhedra in Crystalline Solids. Z. Für Krist.-Cryst. Mater. 2019, 234, 201–209. [Google Scholar] [CrossRef]
  50. Naumov, P.G.; Lyubutin, I.S.; Frolov, K.V.; Demikhov, E.I. A Closed-Cycle Cryostat for Optical and Mössbauer Spectroscopy in the Temperature Range 4.2–300 K. Instrum. Exp. Tech. 2010, 53, 770–776. [Google Scholar] [CrossRef]
  51. Available online: https://ritverc.com (accessed on 25 August 2022).
  52. Lagarec, K.; Rancourt, D.G. Recoil−Mössbauer Spectral Analysis Software for Windows 1998. Available online: https://denisrancourt.ca/page.php?id=10&name=recoil_ms (accessed on 25 August 2022).
  53. Matsnev, M.E.; Rusakov, V.S. SpectrRelax: An Application for Mössbauer Spectra Modeling and Fitting. AIP Conf. Proc. 2012, 178, 1489. [Google Scholar]
  54. Aroyo, M.I. (Ed.) International Tables for Crystallography; International Union of Crystallography: Chester, UK, 2016; Volume 1, ISBN 978-0-470-97423-0. [Google Scholar]
  55. Bubnova, R.S.; Filatov, S.K. Self-Assembly and High Anisotropy Thermal Expansion of Compounds Consisting of TO3 Triangular Radicals. Struct. Chem. 2016, 27, 1647–1662. [Google Scholar] [CrossRef]
  56. Zhang, H.; Liu, S.; Nelson, C.S.; Bezmaternykh, L.N.; Chen, Y.S.; Wang, S.G.; Lobo, R.P.S.M.; Page, K.; Matsuda, M.; Pajerowski, D.M.; et al. Structural Features Associated with Multiferroic Behavior in the RX3(BO3)4 System. J. Phys. Condens. Matter 2019, 31, 505704. [Google Scholar] [CrossRef]
  57. Gagné, O.C. Bond-Length Distributions for Ions Bonded to Oxygen: Results for the Lanthanides and Actinides and Discussion of the f-Block Contraction: Results. Acta Crystallogr. Sect. B Struct. Sci. Cryst. Eng. Mater. 2018, 74, 49–62. [Google Scholar] [CrossRef]
  58. Gagné, O.C.; Hawthorne, F.C. Bond-Length Distributions for Ions Bonded to Oxygen: Results for the Transition Metals and Quantification of the Factors Underlying Bond-Length Variation in Inorganic Solids. IUCrJ 2020, 7, 581–629. [Google Scholar] [CrossRef]
  59. Gagné, O.C.; Hawthorne, F.C. Bond-Length Distributions for Ions Bonded to Oxygen: Metalloids and Post-Transition Metals: Metalloids. Acta Crystallogr. Sect. B Struct. Sci. Cryst. Eng. Mater. 2018, 74, 63–78. [Google Scholar] [CrossRef]
  60. Frolov, K.V.; Lyubutin, I.S.; Alekseeva, O.A.; Smirnova, E.S.; Dudka, A.P.; Verin, I.A.; Temerov, V.L.; Gudim, I.A. Magnetic Properties and Structural Anomalies Observed in Multiferroic NdFe3(BO3)4 by 57Fe Mossbauer Spectroscopy. J. Alloys Compd. 2022, 909, 164747. [Google Scholar] [CrossRef]
  61. Gütlich, P.; Bill, E.; Trautwein, A.X. Mössbauer Spectroscopy and Transition Metal Chemistry; Springer: Berlin/Heidelberg, Germany, 2011; ISBN 978-3-540-88427-9. [Google Scholar]
  62. Herber, R.H. (Ed.) Chemical Mossbauer Spectroscopy; Plenum: New York, NY, USA, 1984. [Google Scholar]
  63. Stanley, H.E. (Ed.) Introduction to Phase Transitions and Critical Phenomena; Clarendon Press: Oxford, UK, 1971. [Google Scholar]
  64. Renard, J.-P. Magnetic Phase Transitions in Low-Dimensional Systems. In Organic and Inorganic Low-Dimensional Crystalline Materials; Springer: New York, NY, USA, 1987; pp. 125–140. [Google Scholar]
  65. De Jongh, L.J. (Ed.) Magnetic Properties of Layered Transition Metal Compounds; Springer: Dordrecht, The Netherlands, 1990; Volume 9, ISBN 978-94-010-7329-5. [Google Scholar]
  66. Pankrats, A.I.; Petrakovskii, G.A.; Bezmaternykh, L.N.; Bayukov, O.A. Antiferromagnetic Resonance and Phase Diagrams of Gadolinium Ferroborate GdFe3(BO3)4. J. Exp. Theor. Phys. 2004, 99, 766–775. [Google Scholar] [CrossRef]
  67. Mo, H.; Nelson, C.S.; Bezmaternykh, L.N.; Temerov, V.T. Magnetic Structure of the Field-Induced Multiferroic GdFe3(BO3)4. Phys. Rev. B-Condens. Matter Mater. Phys. 2008, 78, 214407. [Google Scholar] [CrossRef] [Green Version]
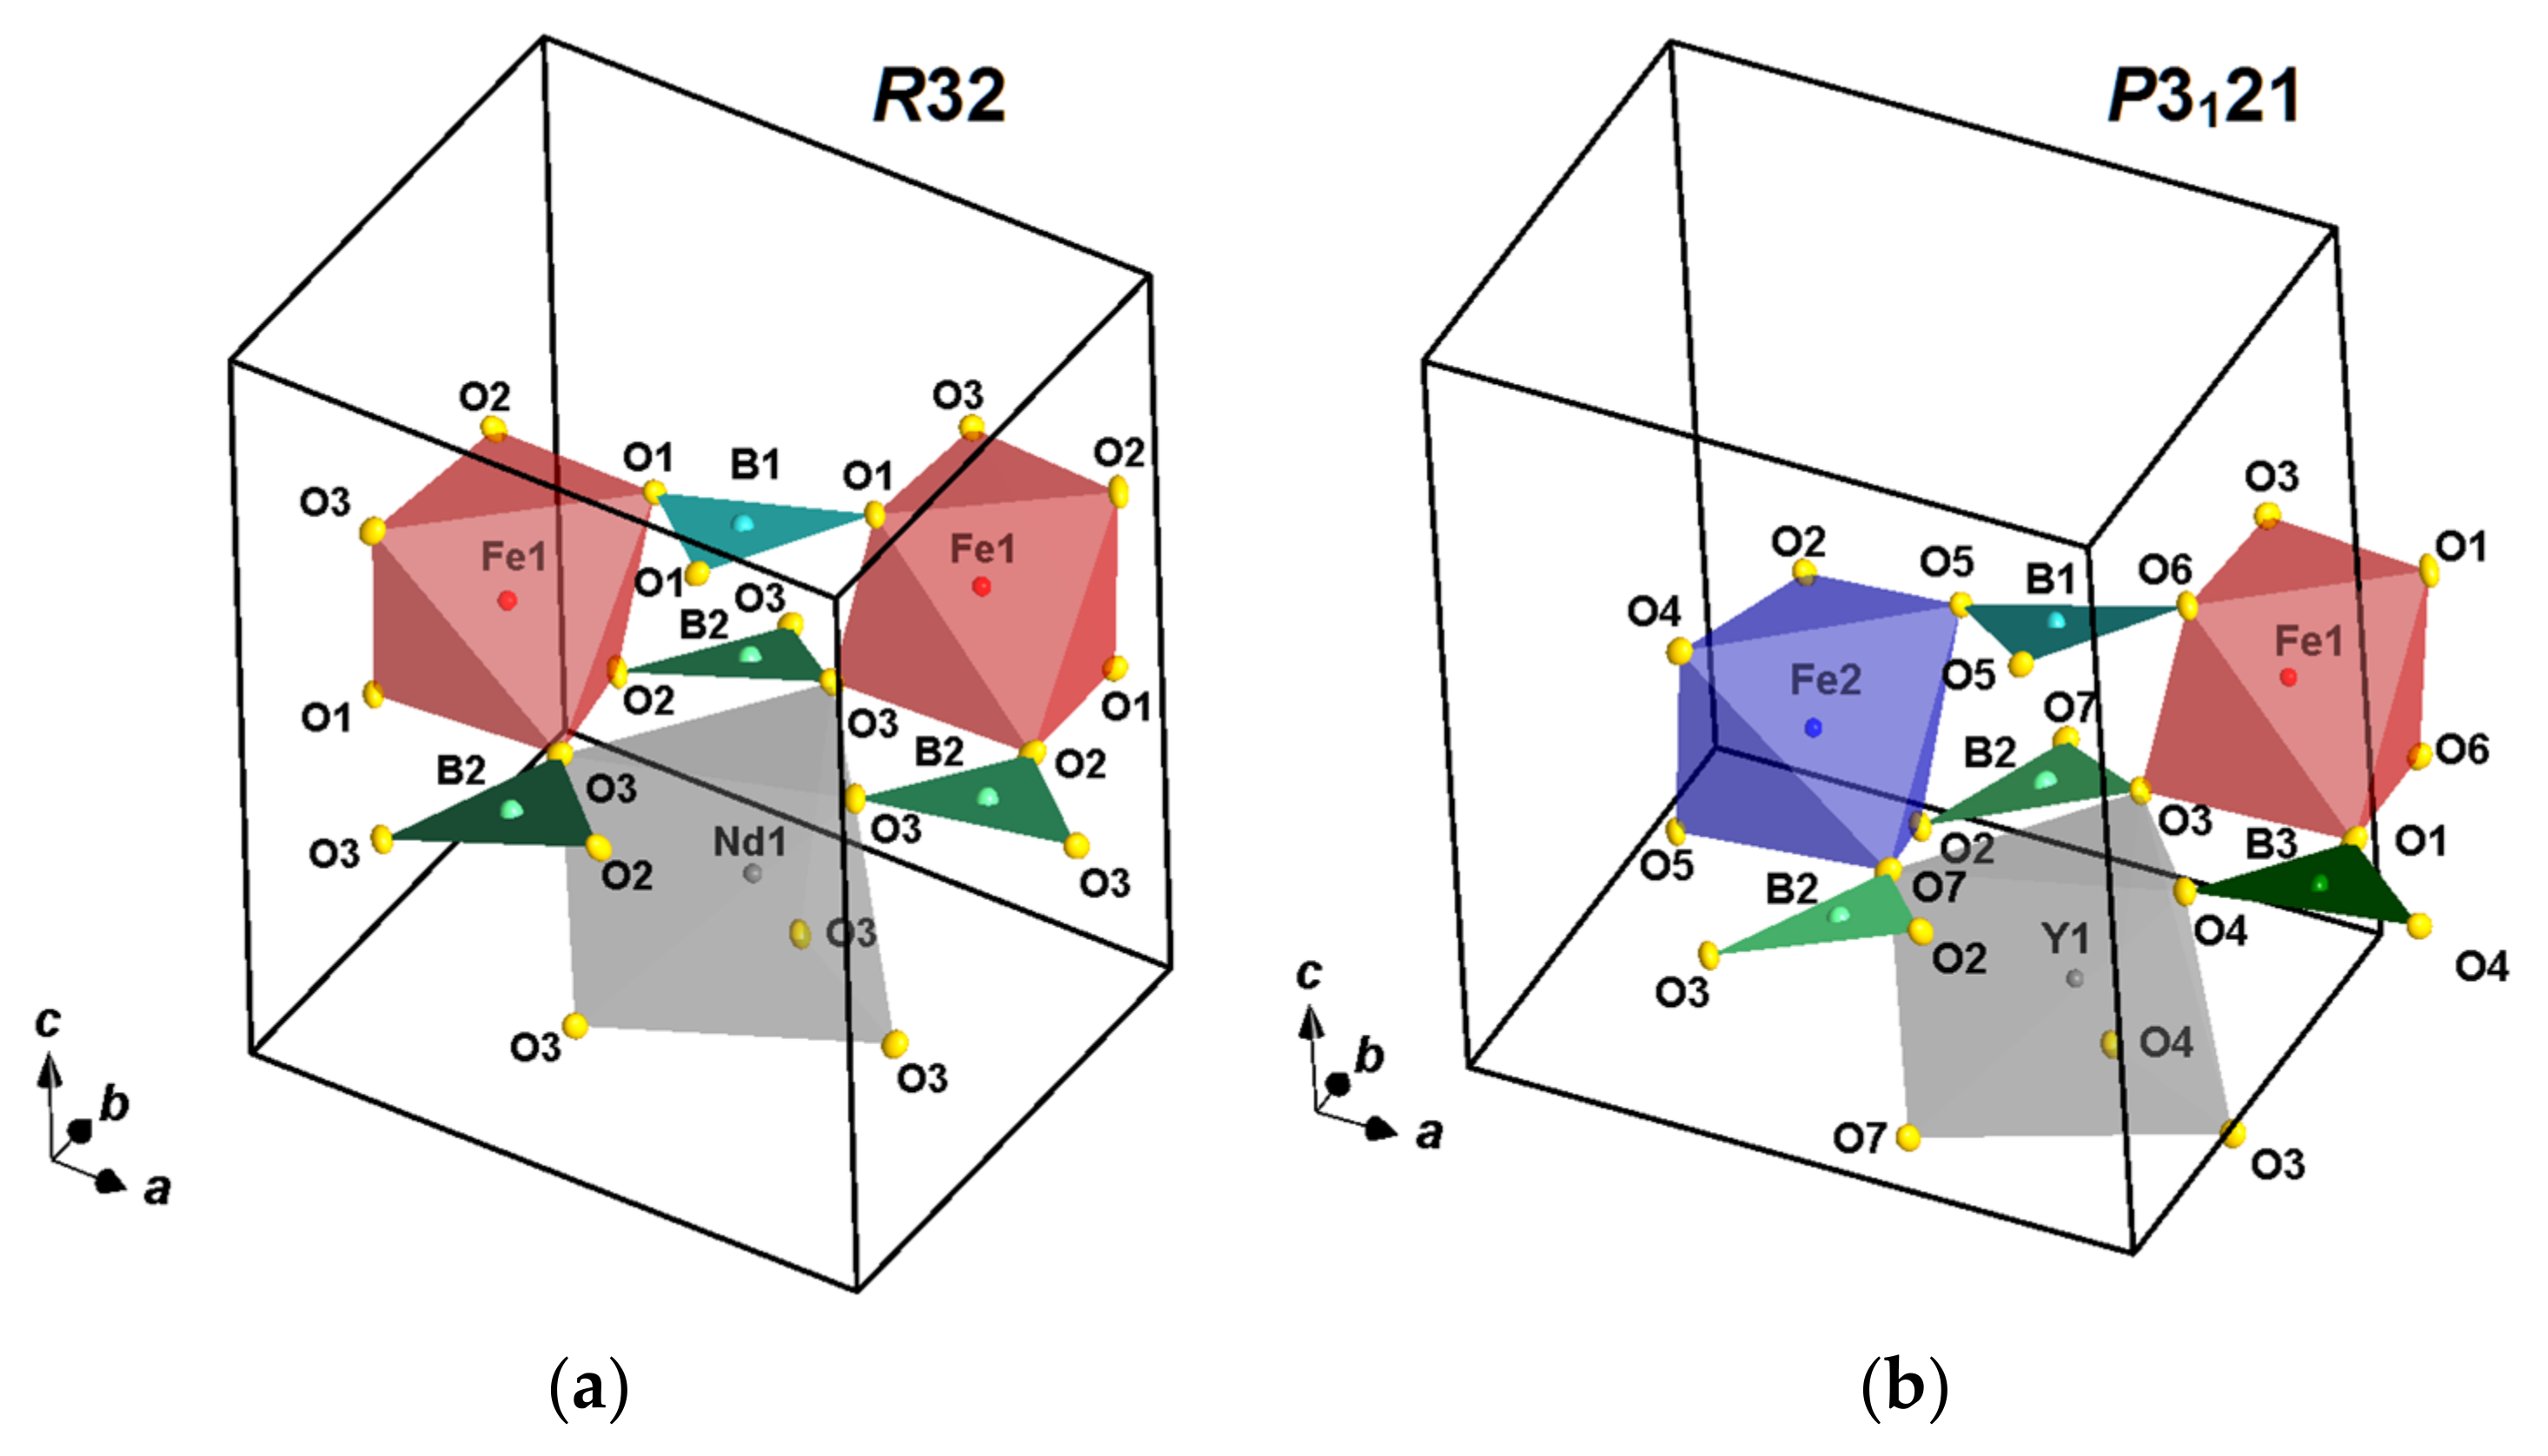
Figure 1. Atomic basis of RFe3(BO3)4 structures in (a) R32 and (b) P3121 space groups. Distorted trigonal prisms RO6, distorted FeO6 octahedra, and BO3 triangles of different types are shown.
Crystals 12 01203 g001
Figure 2. Dependence of unit cell parameters a and c on equivalent ionic radii of R1−xBix at 25 K.
Crystals 12 01203 g002
Figure 3. Temperature dependencies of distances between (a) Fe atoms inside Fe–Fe chains and (b) closest Fe atoms in different chains.
Crystals 12 01203 g003
Figure 4. Temperature dependencies of Fe–O–Fe angles inside iron chains.
Crystals 12 01203 g004
Figure 5. Temperature dependencies of distances from rare-earth atoms (Nd, Sm, Gd, Ho, and Y) to (a) oxygen atoms from first coordination sphere, (b) oxygen atoms O2 HT (O1 LT and O2 LT), (c) boron atoms, and (d) iron atoms from second coordination sphere.
Crystals 12 01203 g005
Figure 6. Temperature dependencies of B–O distances from boron atoms to oxygen atoms in three types of BO3 triangles: (a) B1O3 LT (B1O3 HT), (b) B2O3 LT (B2O3 HT), (c) B3O3 LT (B2O3 HT).
Crystals 12 01203 g006
Figure 7. Temperature dependencies of deviation of three types of BO3 triangles from ab plane.
Crystals 12 01203 g007
Figure 8. Temperature dependencies of Fe–O distances from iron atoms to oxygen atoms in (a) Fe1O6 LT octahedron (Fe1O6 HT) and (b) Fe2O6 LT octahedron (Fe1O6 HT).
Crystals 12 01203 g008
Figure 9. Local coordination of boron atoms (a) B1 LT (B1 HT), and (b) B2 LT (B2 HT) and B3 LT (B2 HT). Superposition of atomic arrangement in Y0.95Bi0.05Fe3(BO3)4 at 25 K (P3121; solid atoms) and 500 K (R32; transparent atoms) is shown. Relative atomic coordinates and the same unit cell dimensions are used for the representation. Atomic displacements are shown as ellipsoids with 80% probability for both temperatures. LT labels are shown.
Crystals 12 01203 g009
Figure 10. O–O distances between oxygen vertices of Fe1O6 LT and Fe2O6 HT octahedra in Gd0.95Bi0.05Fe3(BO3)4 at 25 K. Edges connecting identical adjacent octahedra in the chain are shown in color.
Crystals 12 01203 g010
Figure 11. Local coordination of rare-earth atom: (a) adjacent FeO6 octahedra, (b) adjacent BO3 triangles. Superposition of atomic arrangement in Y0.95Bi0.05Fe3(BO3)4 at 25 K (P3121; solid atoms) and 500 K (R32; transparent atoms) is shown. Both structures are represented using relative atomic coordinates and identical unit cell dimensions. Atomic displacements are shown as ellipsoids with 80% probability for both temperatures. LT labels are used. Videos S1 and S2 supporting to (a,b) are given in Supplementary Materials.
Crystals 12 01203 g011
Figure 12. Tilt of B2O3 LT (B2O3 HT) and B3O3 LT (B2O3 HT) triangles and arrangement of O2 HT (O1 LT and O2 LT) atoms relative to planes passing through RO6 prism bases (O3, O4, O7 LT atoms) in Ho0.96Bi0.04Fe3(BO3)4 at 25 K. LT labels are used. Supporting Video S3 is given in Supplementary Materials.
Crystals 12 01203 g012
Figure 13. Closest Fe–Fe and Fe–O–Fe intrachain and interchain distances in (a) R32 and (b) P3121 space groups, and closest R–Fe and Fe–O–R distances in (c) R32 and (d) P3121 space groups.
Crystals 12 01203 g013
Figure 14. Shortest super-exchange paths (a) Fe–O–O–Fe, and (b) Fe–O–R and Fe–O–O–R (shown in black) in Y0.95Bi0.05Fe3(BO3)4 (P3121) at 25 K.
Crystals 12 01203 g014
Figure 15. Typical Mössbauer spectra of RFe3(BO3)4 compounds at characteristic temperatures in (a) paramagnetic and (b) magnetically ordered states. For GdFe3(BO3)4 compound in (b), an example of spectra fitting by superposition of two sextets is shown.
Crystals 12 01203 g015
Figure 16. Temperature dependencies of distortions of RO6 prism and FeO6 octahedra in RFe3(BO3)4 structures with R (a) Y, (b) Ho, (c) Gd, (d) Sm, and (e) Nd. Deviations of polyhedra formed from the regular shape and displacement of R and Fe atoms from polyhedra’s center of mass are shown in comparison with temperature dependencies of Mössbauer hyperfine parameter quadrupole splitting Δ(T). Gradient fill shows regions of negative thermal expansion (NTE).
Crystals 12 01203 g016
Table 1. Experimental details and structural refinement parameters of R1−xBixFe3(BO3)4 with R = Nd, Sm, Gd, Ho, and Y at 25 K.
R1−xBixNd0.91Bi0.09Sm0.93Bi0.07Gd0.95Bi0.05Ho0.96Bi0.04Y0.95Bi0.05
CSD2,176,6332,176,6352,176,6312,176,6342,176,632
Space groupR32R32P3121P3221P3121
a (Å)9.5835 (1)9.5647 (1)9.5395 (1)9.5132 (1)9.5126 (1)
c (Å)7.5959 (1)7.5819 (1)7.5592 (1)7.5379 (1)7.5422 (1)
V3)604.17 (1)600.69 (1)595.74 (1)590.79 (1)591.05 (1)
Dx (Mg m3)4.5584.6214.7054.8014.195
µ (mm1)13.1013.6614.3815.8913.53
Crystal radius (mm)0.080.080.090.080.09
No. of measured, independent and observed [I > 3σ(I)]
reflections
96,071, 2834, 283495,325, 2820, 2820270,671, 8327, 7350273,676, 8246, 8101269,419, 8268, 7341
No. of R32 sys. abs.
observed [I > 3σ(I)] reflections, Average(I/Sig(I))
0, 0.450, 0.4671,431, 3.49129,171, 5.6970,426, 3.76
Rint0.0390.0440.0770.0760.111
(sin θ/λ)max1)1.3571.3571.3571.3571.357
R[F2 > 3σ(F2)], wR(F2), S0.008, 0.022, 1.010.008, 0.021, 1.040.019, 0.056, 1.080.015, 0.045, 1.050.021, 0.049, 1.09
Δρmax, Δρmin (e Å3)0.91, −1.500.90, −1.242.84, −2.352.33, −1.461.55, −1.64
For all structures: Z = 3. Crystal shape: sphere (light-green). Experiments were carried out at 25 K with Mo Kα radiation using a XtaLAB Synergy-DW system, HyPix-Arc 150. Data collection used ω scans. Absorption correction was for a sphere, Jana2006. Refinement was carried out on F2.
Table 2. Mutual correspondence of atoms in R32 space group (HT labels) and P3121 space group (LT labels).
HT Labels (Wycoff Position)LT Labels (Wycoff Position)
R1 (3a)R1 (3a)
Fe1 (9d)Fe1 (3a)
Fe2 (6c)
B1 (3b)B1 (3b)
B2 (9e)B2 (6c)
B3 (3b)
O1 (9e)O5 (6c)
O6 (3b)
O2 (9e)O1 (3b)
O2 (6c)
O3 (18f)O3 (6c)
O4 (6c)
O7 (6c)
Table 3. Interatomic distances in possible super-exchange paths for Nd0.91Bi0.09Fe3(BO3)4 (R32) and Y0.95Bi0.05Fe3(BO3)4 (P3121) at 25 K. Distances between each pair of atoms in the path are separated by an en-dash. Boron atoms connected to oxygen atoms are shown in parentheses. Summarized distance of paths is given in brackets.
Nd0.91Bi0.09Fe3(BO3)4 (HT Labels)Y0.95Bi0.05Fe3(BO3)4 (LT Labels)
Intrachain Fe–Fe
Fe1–Fe13.1824(1)Fe1–Fe1
Fe2–Fe2
3.1571(3)
3.1980(3)
Intrachain Fe–O–Fe
Fe1–O1–Fe1 (B1)
Fe1–O2–Fe1 (B2)
2.0270(3)–2.0270(3) [4.054]
2.0462(4)–2.0462(4) [4.0924]
Fe2–O5–Fe2 (B1)
Fe2–O2–Fe2 (B2)
Fe1–O6–Fe1 (B1)
Fe1–O1–Fe1 (B3)
2.0232(5)–2.0151(6) [4.0464]
2.0392(7)–2.0603(4) [4.0995]
2.0010(5)–2.0010(5) [ 4.002]
2.0379(4)–2.0379(4) [4.0758]
Interchain Fe–O–Fe
Fe1–O1–O1–Fe1 (B1)

Fe1–O2–O3–Fe1 (B2)

Fe1–O3–O3–Fe1 (B2)
2.0270(3)–2.3943(6)–2.0270(3)
[6.4483]
2.0462(4)–2.3558(5)– 1.9585(3)
[6.3605]
1.9585(3)–2.4208(7)–1.9585(3)
[6.3378 ]
Fe2–O4–O1–Fe1 (B3)
Fe2–O5–O6–Fe1 (B1)
Fe2–O7–O3–Fe1 (B2)
Fe2–O5’–O6’–Fe1 (B1)
Fe2–O2–O3–Fe1 (B2)
Fe2–O2’–O3’–Fe1 (B2)
Fe2–O4–O4–Fe2 (B3)
Fe2–O5–O5–Fe2 (B3)
Fe2–O5–O5–Fe2’ (B1)
Fe2–O7–O2–Fe2 (B2)
Fe2–O7–O2–Fe2’ (B2)
Fe2–O5’–O5’–Fe2 (B1)
Fe1–O3–O4–Fe2 (direct)
1.9666(5)–2.3540(7)–2.0379(4) [6.3585]
2.0151(5)–2.3737(7)–2.0010(5) [6.3898]
1.9832(6)–2.4266(7)–1.9626(5) [6.3724]
2.0232(4)–2.3737(8)–2.0010(5) [6.3979]
2.0603(5)–2.3233(7)–1.9626(5) [6.3462]
2.0393(6)–2.3233(9)–1.9626(5) [6.3252]
1.9666(5)–2.4492(10)–1.9666(5) [6.3824]
2.0151(5)–2.4046(7)–2.0232(6) [6.4429]
2.0151(5)–2.4046(7)–2.0151(5) [6.4348]
1.9832(6)–2.3773(9)–2.0393(4) [6.3998]
1.9832(6)–2.3773(9)–2.0603(5) [6.4208]
2.0232(4)–2.4046(9)–2.0232(4) [6.451]
1.9626(5)–2.7800(7)–1.9666(5) [ 6.7092]
Fe–O–R, Fe–O–R–O–Fe
Fe1–O3–R (B2)
Fe1–O3–O3–R (B2)
1.9585(3)–2.3976(4) [4.3561]
1.9585(3)–2.4208(7)–2.3976(4) [6.7769]
Fe2–O4–R (B3)
Fe2–O7–R (B2)
Fe2–O2–R (B2)
Fe2–O2’–R (B2)
Fe2–O4–O4–R (B3)
Fe2–O7–O3–R (B2)
Fe2–O7–O2–R (B2)
Fe2–O2–O3–R (B2)
Fe2–O2–O7–R (B2)
Fe2–O2’–O3–R (B2)
Fe2–O2’–O7–R (B2)
Fe1–O3–R (B2)
Fe1–O3–O2–R (B2)
Fe1–O3–O7–R (B2)
Fe1–O1–O4–R (B3)
1.9666(5)–2.3819(6) [4.3485]
1.9832(6)–2.3175(4) [4.3007]
2.0603(5)–2.8180(6) [4.8783]
2.0393(6)–2.8180(5) [4.8573]
1.9666(5)–2.4492(10)–2. 3819(6) [6.7977]
1.9832(6)–2.4266(7)–2.3248(6) [6.7346]
1.9832(6)–2.3773(9)–2.8180(4) [7.1785]
2.0603(5)–2.3233(7)–2.3248(6) [6.7084]
2.0603(5)–2.3773(9)–2.3175(6) [6.7551]
2.0393(6)–2.3233(9) –2.3248(4) [6.6874]
2.0393(6)–2.3773(7)–2.3175(6) [6.7341]
1.9626(6)–2.3248(4) [4.2874]
1.9626(6)–2.3233(9)–2.8180(6) [7.1039]
1.9626(6)– 2.4266(7)–2.3175(6) [6.7067]
2.0379(4)–2.3540(7)–2.3819(6) [6.7738]
Publisher’s Note: MDPI stays neutral with regard to jurisdictional claims in published maps and institutional affiliations.