Article

The Migration of Cd in Granitic Residual Soil and Marine Clay: Batch and Column Studies

by
Nur Aishah Zarime
1,*,
Badariah Solemon
1,
Wan Zuhairi Wan Yaacob
2 and
Rohayu Che Omar
1
1
Institute of Energy Infrastructure (IEI), Universiti Tenaga Nasional (UNITEN), Putrajaya Campus, Jalan IKRAM-UNITEN, Kajang 43000, Selangor, Malaysia
2
Department of Earth Sciences and Environmental, Faculty of Science and Technology, Universiti Kebangsaan Malaysia, Bangi 43600, Selangor, Malaysia
*
Author to whom correspondence should be addressed.
Minerals 2022, 12(9), 1106; https://doi.org/10.3390/min12091106
Submission received: 29 July 2022 / Revised: 23 August 2022 / Accepted: 25 August 2022 / Published: 30 August 2022

Abstract

:
Due to the world’s population growth, excessive solid waste generation is a serious environmental issue. The landfill leachate infiltrates the soils, pollutes the groundwater, and puts all living things at risk. This study investigates the geotechnical properties of the soils (marine clay and granitic residual soil) and the migration of cadmium (Cd) using a high-speed centrifuge column test. All soil samples were subjected to physicochemical, morphology and mineralogy properties analyses, including the determination of their particle size distribution, Atterberg limits, specific gravity, compaction, permeability, pH, organic content, cation exchange capacity (CEC) and specific surface area (SSA). They were also subjected to analyses by X-ray diffraction (XRD) and scanning electron microscope (SEM). This research utilizes two types of adsorption tests: batch tests and column infiltration tests. For the Batch test, the elimination percentage of Cd in marine clay was up to 86% (SBMC2) to 98% (SBMC1) at an initial value of 75 mg/L. While the granitic residual soil showed the maximum removal percentages of Cd were 39% (KGR) to 47% (BGR). For the column infiltration test, the soils were subjected to different g-force, (i.e., 10× g and 20× g) and two different soil weights (i.e., 10 and 20 g of soils). The study revealed that marine clay (partition coefficient, Kd = 10–23 L/Kg) has better adsorption on Cd compared to granitic residual soils (Kd = 0.6 to 0.9 L/Kg). The study also concludes that marine clay (SBMC) is one of the natural clay-based energy materials which can effectively use as an engineered clay liner.

1. Introduction

Millions of tonnes of extremely harmful effluents containing heavy metals are discharged into the aquatic environment by various types of waste, landfill leachates [1] and industrial effluents from metal cleaning, plating, tanning, textile, battery manufacturing, pickling, and refining [2,3,4]. Regardless of their source, these contaminants are easily dispersed into the aquatic system and tend to accumulate in live creatures, causing various ecosystem problems and diseases [5]. Cadmium is a highly hazardous heavy metal that is difficult to digest after entering the environment [6]. Long-term cadmium exposure through air, water, soil, and food can cause cancer and toxicity in organ systems such as the skeletal, urinary, reproductive, cardiovascular, central and peripheral neurological systems, and respiratory systems [7]. Natural clay soils play a significant role as an environmental sink for toxins and are commonly utilized as compacted clay landfill liners. According to Rahimzadeh et al. [8], due to their characteristics make clay-based materials appealing for use in energy storage and conversion. Clay liner is an important component in landfill systems where it is responsible for attenuating contaminant transport through the system. Besides, soils have the capability of physically and chemically retarding the flow of leachates. Soil can also be compacted to a very low hydraulic conductivity which is less than 1 × 10⁻⁹ m/s and acts as final protection for groundwater against leachate [9]. Soils with low hydraulic conductivity and high sorption capacity tend to be the best and most effective clay liners [10,11]. Natural soils also can form complexes with heavy metals through various retention mechanisms commonly known as sorption (adsorption). Adsorption is described as a process that occurs when the concentration of a given substance at the interface of two phases increases [12]. The chemicals in the solution are transferred from one phase to another before adhering to the surface. The process is complex, and it is determined by the surface’s chemistry, the sorbent and sorbate’s nature, and the solid-liquid combination’s nature [13]. The retention of heavy metals by natural soils is affected by various parameters, including mineral and organic elements, metal nature, soil solution composition, and pH [14]. Recently, geotechnical centrifuges have prompted growing research interest in studying the migration of contaminants in soil [15,16,17,18]. Prior researchers have shown a great experimental study of the reactive contaminant transport process in fine grain soils due to increased fluid flow through compacted soils using relatively simple apparatus [16]. Centrifuge testing was selected because of its usefulness in reducing experimental time and can reproduce the prototype vertical effective stress condition in the soil samples [19]. In the present work, geotechnical properties of two soils namely, granitic residual soils and marine clays have been studied using physicochemical, mineralogy and morphology tests. This study also compares the adsorption capacity and the migration of Cd through a compacted layer of soil via batch test and mini-column centrifuge tests; respectively. This research also aims to determine the best soils to be used as natural clay liner in landfills. The selected conditions of the mini-column centrifuge test were also performed for simulation of the underground conditions, which can evaluate the effects on a real field condition.

2. Materials and Methods

2.1. Sample Collection and Preparation

This study used two types of geologic materials namely granitic residual soil (BGR and KGR) and marine clay (SBMC1 and SBMC2). The granitic residual soils were collected in Broga and Kajang Selangor. Whereas, the marine clay was sampled in Sungai Besar, Selangor. Each granitic residual soil was brownish-yellow coloured while marine clay were blackish grey coloured (Figure 1). The in-situ sampling technique was applied using a shovel. The soil samples were placed in plastic bags before being labelled. The samples were taken around 5 cm below the soil surface. The weight of each sample taken was around 7 kg and each one was air-dried at room temperature in the laboratory and afterward, sieved using 125 m and 63 m sieves prior to testing.

2.2. Experimental Procedures

The physical properties of soils used in this study are particle size distribution and falling head permeability and their determination was done in accordance with ASTM D-2487 and ASTM D-2434, respectively. The specific gravity, Atterberg limit and compaction were also conducted according to standard BS 1377. The chemical properties of marine clay were evaluated by using pH value (BS 1377), organic matter (BS 1377), specific surface area [20] and cation exchange capacity (ASTM D-4319). The pH measurement was conducted using the pH meter probe, for organic matter using H2O2, for specific surface area (SSA) uses the EGME method and for cation exchange capacity (CEC) using ammonium acetate. The mineralogy and morphology of soils were determined through X-ray Diffraction (XRD) and scanning electron microscopy (SEM). XRD analysis was performed using a D8-Advance, Bruker AXS Co. Ltd., Karlsruhe, Germany, while SEM using Q150RS Quorum equipment with a micrograph obtained at ×5000 magnification.

2.3. Adsorption Test

2.3.1. Batch Equilibrium Test

Batch equilibrium experiments were conducted using the following method [20]. The cadmium was prepared as a 500 mg/L containing stock solution made of cadmium nitrate. This solution depended on the studied factors such as initial concentration, type of solutions, pH factor and kinetic factor. These factors are studied because the ability of soil to absorb heavy metals is different. For the concentration factor, the cadmium solution was prepared with different concentrations (20 mg/L, 40 mg/L, 60 mg/L, 80 mg/L, 100 mg/L, 150 mg/L, 200 mg/L, 250 mg/L, 300 mg/L, 400 mg/L and 500 mg/L) by diluting a single stock solution which was also used for the greatest tested concentration. The batch equilibrium test was performed by mixing 4 g of soil sample (absorbent) with 40 mL of aqueous metal solutions (1:10 soil/solution ratio). The equilibrium was achieved by shaking the samples at 100 RPM for 24 h [21]. After shaking, mixtures soil—cadmium solution were centrifuged for 10 min at 1500 RPM before being filtered through 45 μm nitrocellulose membranes. The filtrates (recovered aqueous solutions) were analyzed using coupled plasma mass spectroscopy (ICP-MS). The concentration of cadmium absorbed by the solution, qe (mg/g) was calculated using the formula below;
q e = C o C f V M
where; C o   and C f   are initial concentration and equilibrium concentration respectively (mg/L), V is the volume of solution added (mL), M is the mass of air-dried soil (g).
The adsorption coefficient, Kd (L/kg) describes the equilibrium partitioning of metal between solid and liquid phases [21]. Kd values can be determined by following the equation q e = K d × C f [21,22,23], where Kd is the partition coefficient (L/kg).
The adsorption isotherms were modelled using the Langmuir [24] and Freundlich equations. The Langmuir adsorption equation was designed to describe gas-solid phase adsorption onto adsorbents [25]. Thse Langmuir adsorption model suggests that maximum adsorption corresponds to a saturated monolayer of solute ions on the adsorbent’s surface, but with no lateral contact between the adsorbed ions. The Langmuir adsorption isotherm has been successfully employed in several monolayer adsorption processes [26,27]. The linearized Langmuir equation can be described as below;
Ce/qe = 1/KL·Am + Ce/Am
where, KL is the Langmuir binding constant (L/mg), Am is the saturated adsorption amount of metal ions (mg/g) and Ce is the equilibrium concentration of metal ions (mg/L).
The Freundlich isotherm can be used to model non-ideal sorption on heterogeneous surfaces and multilayer sorption. The Freundlich equation is written as:
Log qe = logKF + (1/n) log Ce
where, KF is the Freundlich sorption coefficient, 1/n is the Freundlich sorption exponent and Ce is the metal concentration in final contact concentration (mg/L) [26,28].

2.3.2. Column Infiltration Test

This test was conducted following the technique recommended by Antoniadis et al. [29]. Infiltration tests were carried out using stainless steel column filtration with an inner diameter of 35 mm and a length of 125 mm. The column apparatus comprised two components: the top and lower parts. The upper section was a leachate reservoir, with the Whatmann Glass Microfibre (GF/F) filter inserted at small opening holes. At the bottom, the filtered effluent solution was collected. In this experiment, a standard solution of 500 ± 25 mg/L cadmium nitrate, Cd(NO3)2, in distilled water was prepared. The pH of the Cd solution was adjusted to pH 2.3 in view exposing the soil with a low pH aggressive solution. The infiltration test was carried out at 27 °C. A soil sample weighing 20 g was mixed with deionized water until obtaining a slurry; it was then let overnight in water to reach saturation. The centrifugation was conducted in a benchtop centrifuge (Sigma 416S, swing-out rotor). By centrifuging at 231× g (1000 rpm) for 15 min, a compacted soil layer called ‘mud cake layer’ was formed inside the microcolumn. The leachate test of Cd(NO3)2 solution was applied to the soil, the effluent was collected and the concentration analyzed using Couple Plasma Mass Spectroscopy (Perkin Elmer Model OPTIMA 3000). This method was repeated until the pore volume reached 30. The pH of each pore volume was also determined using a pH meter (Hanna Instrument 2211, supplied by Hanna Instruments (M) Sdn Bhd, Selangor, Malaysia). To date, the study was conducted on two different soil types (marine clay and residual granite), four different thicknesses of soil (10, 20, 14 and 28 mm) and two different g-forces (520× g and 1440× g). Table 1 summarizes the experimental techniques.

3. Results and Discussions

3.1. Soil Characterizations

The physicochemical characterization of the soils is presented in Table 2. The granitic residual soils (BGR, KGR) had the most percentage of sand, with an average of 60 ± 3.16% and 51 ± 2.83%; respectively, compared to marine clays (SBMC1, SBMC2), for which the average value was 3.6 ± 2.65% and 12 ± 3.29%; respectively. Marine clay has higher percentage of finer particles (clay + silt), average of 15.6 ± 3.01% (clay) + 80.8 ± 4.66% (silt) for SBMC1 and 17.0 ± 2.61% (clay) + 71.0 ± 3.85 (silt) for SBMC1. Due to this, marine clays have a high liquid limit of 82.16 ± 1.84 (SBMC1) and 75.80 ± 2.01 (SBMC2). As stated by Atanassova [30], coarse-grained soils exhibit a lower tendency for heavy metal adsorption than fine-grained soils. The specific gravity of granitic residual soils is higher 2.54 ± 0.03 (BGR), 2.54 ± 0.07 (KGR) compared to marine clay, 2.23 ± 0.05 (SBMC1), 2.29 ± 0.05 (SBMC2). Lower specific gravity values in marine clays are due to the contribution of high organic content in marine clay 5.79 ± 0.26% (SBMC1) and 5.72 ± 0.53% (SBMC2) which will lead to a lower value of specific gravity [31]. The standard proctor compaction characteristics showed the granitic residual soil at maximum dry density 1.71 ± 0.05 g/cm3 (BGR), 1.70 ± 0.01 g/cm3 (KGR), at optimum moisture content 18.57% (BGR), 14.26% (KGR), to achieve permeability close to 2.08 × 10⁻⁶ m/s (BGR), 1.43 × 10⁻⁶ m/s (KGR). This test also found that the maximum dry density for marine clay is 1.37 ± 0.01 g/cm3 (SBMC1), 1.39 ± 0.01 g/cm3 (SBMC2), at optimum moisture content 36.56% (SBMC1), 25.95% (SBMC2), to achieve permeability close to 6.56 × 10⁻⁷ m/s (SBMC1), 5.64 × 10⁻⁷ m/s (SBMC2). However, the permeability values in Sungai Besar Selangor reported by Murray and Humprey [32] showed a range of 1.18–1.49 × 10⁻⁹ m/s. The difference in values was due to the difference in finer fractions (silt and clay). As reported in Lan et al. and Sastre, Rauret and Vidal [8,33], the permeability of a high-technology landfill liner is suggested to be 1 × 10⁻⁹ m/s. Meanwhile, pH values showed good contrast in these soils, i.e., marine clay soils have higher pH; 7.22 ± 0.16 (SBMC1), 7.59 ± 0.06 (SBMC2) compared to granitic residual soils 5.45 ± 0.08 (BGR), 5.63 ± 0.16 (KGR). Due to calcareous content, marine clay was grouped into alkaline soil [33]. A similar contrast is also displayed for organic matter content, SSA and CEC values. According to Hooda and Alloway [34] soil with large amounts of clay and organic matter and a high CEC value will have a greater metal sorption capacity. Based on the soil properties (Table 2), marine clay has a better characteristic than granitic residual soils to retard the migration of Cd.
Figure 2 shows the XRD pattern of freshly granitic residual soils and marine clays. The BGR was found to have quartz, kaolinite and halloysite minerals, while for KGR, the XRD pattern showed the crystallinity of quartz, illite and kaolinite. Both BGR and KGR reported that quartz is the major mineral resistant to chemical weathering. The kaolinite minerals found in granitic residual soils come from the feldspar mineral alteration. According to Wedepohl [35], illite is a clay mineral derived from muscovite with a low content of K2O (8.5%). The presence of halloysite minerals on BGR also showed the transition from muscovite minerals to kaolinite, then to mineral halloysites. This was due to the chemical weathering process or hydrothermal processes [36]. Previous research [37] showed that the process of platey kaolinite converted to spiral halloysite rods arises due to a lack of structural rigidity at spots along the kaolinite crystal, interpreted as hydration to halloysite. The marine clays (SBMC1, SBMC2) showed quartz, illite, kaolinite and montmorillonite crystallinity. The SBMC1 are also composed of calcite. According to Hanafi, Ekinci and Aydin [38], marine-deposited clay is high in calcium carbonate and has ‘hollow-like’ features.
The SEM images of freshly granitic residual soils and marine clays at 2000× and 5000× magnification are presented in Figure 3. The SEM images also revealed granitic residual soils (BGR, KGR) are dominated by kaolinite. The kaolinite has flaky shapes, rolled, and has rough-edged, and some are well crystalline, stacked with one another. This study also found halloysite minerals on the BGR samples, which support the XRD results. Halloysite showed a rod shape that overlaid the kaolinite minerals. The SEM images of marine clay (SBMC1, SBMC2) showed the presence of kaolinite minerals and microfossils. Kaolinite in marine clay is found to have flaky rolled and rough-edged shapes. Previous research [35] stated that the content of kaolinite minerals in marine clay is low, only 5% to 10%. The presence of microfossils derived from carbonate materials resulted in increasing element Ca in the CEC analysis and an increase in pH values. However, this study did not display the montmorillonite minerals reported by XRD analysis.

3.2. Batch Equilibrium Study

Batch tests with a high water/soil ratio were carried out to create more severe conditions and improve metal extraction from the matrix [39]. Figure 4 presents the amount of Cd adsorbed and its removal percentage against the initial concentration in the sorption solution. The result in Figure 4a showed that the marine clay (SBMC1, SBMC2) curves are linear and correspond to high Cd adsorption compared to those of the granitic residual soil that lack linearity (BGR, KGR). According to Veli and Alyüz [40], an adsorption curve located near the y-axis corresponds to a greater adsorption capacity comparatively to that located near the x-axis. The highest removal percentage of Cd in marine clay achieved was 98% (SBMC1) and 86% (SBMC2) for an initial concentration of 75 mg/L (Figure 4b). The obtained results support the assumption that marine clays possess a stronger retention capacity for Cd than granitic residual soils. For granitic residual soil (BGR, KGR), the adsorption curves are linear with the highest removal percentage of 47% (BGR) and 39% (KGR), for an initial concentration of 75 mg/L. Afterward, the removal percentage dropped to 9%, for an initial concentration of 460 mg/L. At higher concentrations of Cd, the granitic residual soils showed a slower adsorption rate and lower efficiency of Cd removal from aqueous solution found. This could be due to the availability of vacant surface sites during the preliminary adsorption stage. After a certain period, the vacant sites have been occupied by heavy metal ions, resulting in a repulsive force between the adsorbate present on the adsorbent’s surface and the one present in the bulk phase [41].
Adsorption isotherm’s studies enabled an understanding of the interaction between the heavy metal and the adsorbents at equilibrium [42]. Figure 5 plots Langmuir and Freundlich experimental curves for the Cd sorption onto marine clay and granitic residual soil. Langmuir and Freundlich’s isotherm are well fitted to the experimental data with a correlation coefficient (R2 > 0.85). The constants of Langmuir and Freundlich isotherms were calculated as shown in Table 3. Results showed the adsorption of Cd occurred mostly at the surface as a monolayer described by the Langmuir isotherm model, while the Freundlich model predicted that the adsorption of Cd has occurred on a heterogeneous surface. The 1/n value of Freundlich is related to the sorption intensity of the sorbent that lies in the range 0.5 < 1/n ≤ 1 indicating that the heavy metals are easy to adsorb [43].

3.3. Column Infiltration

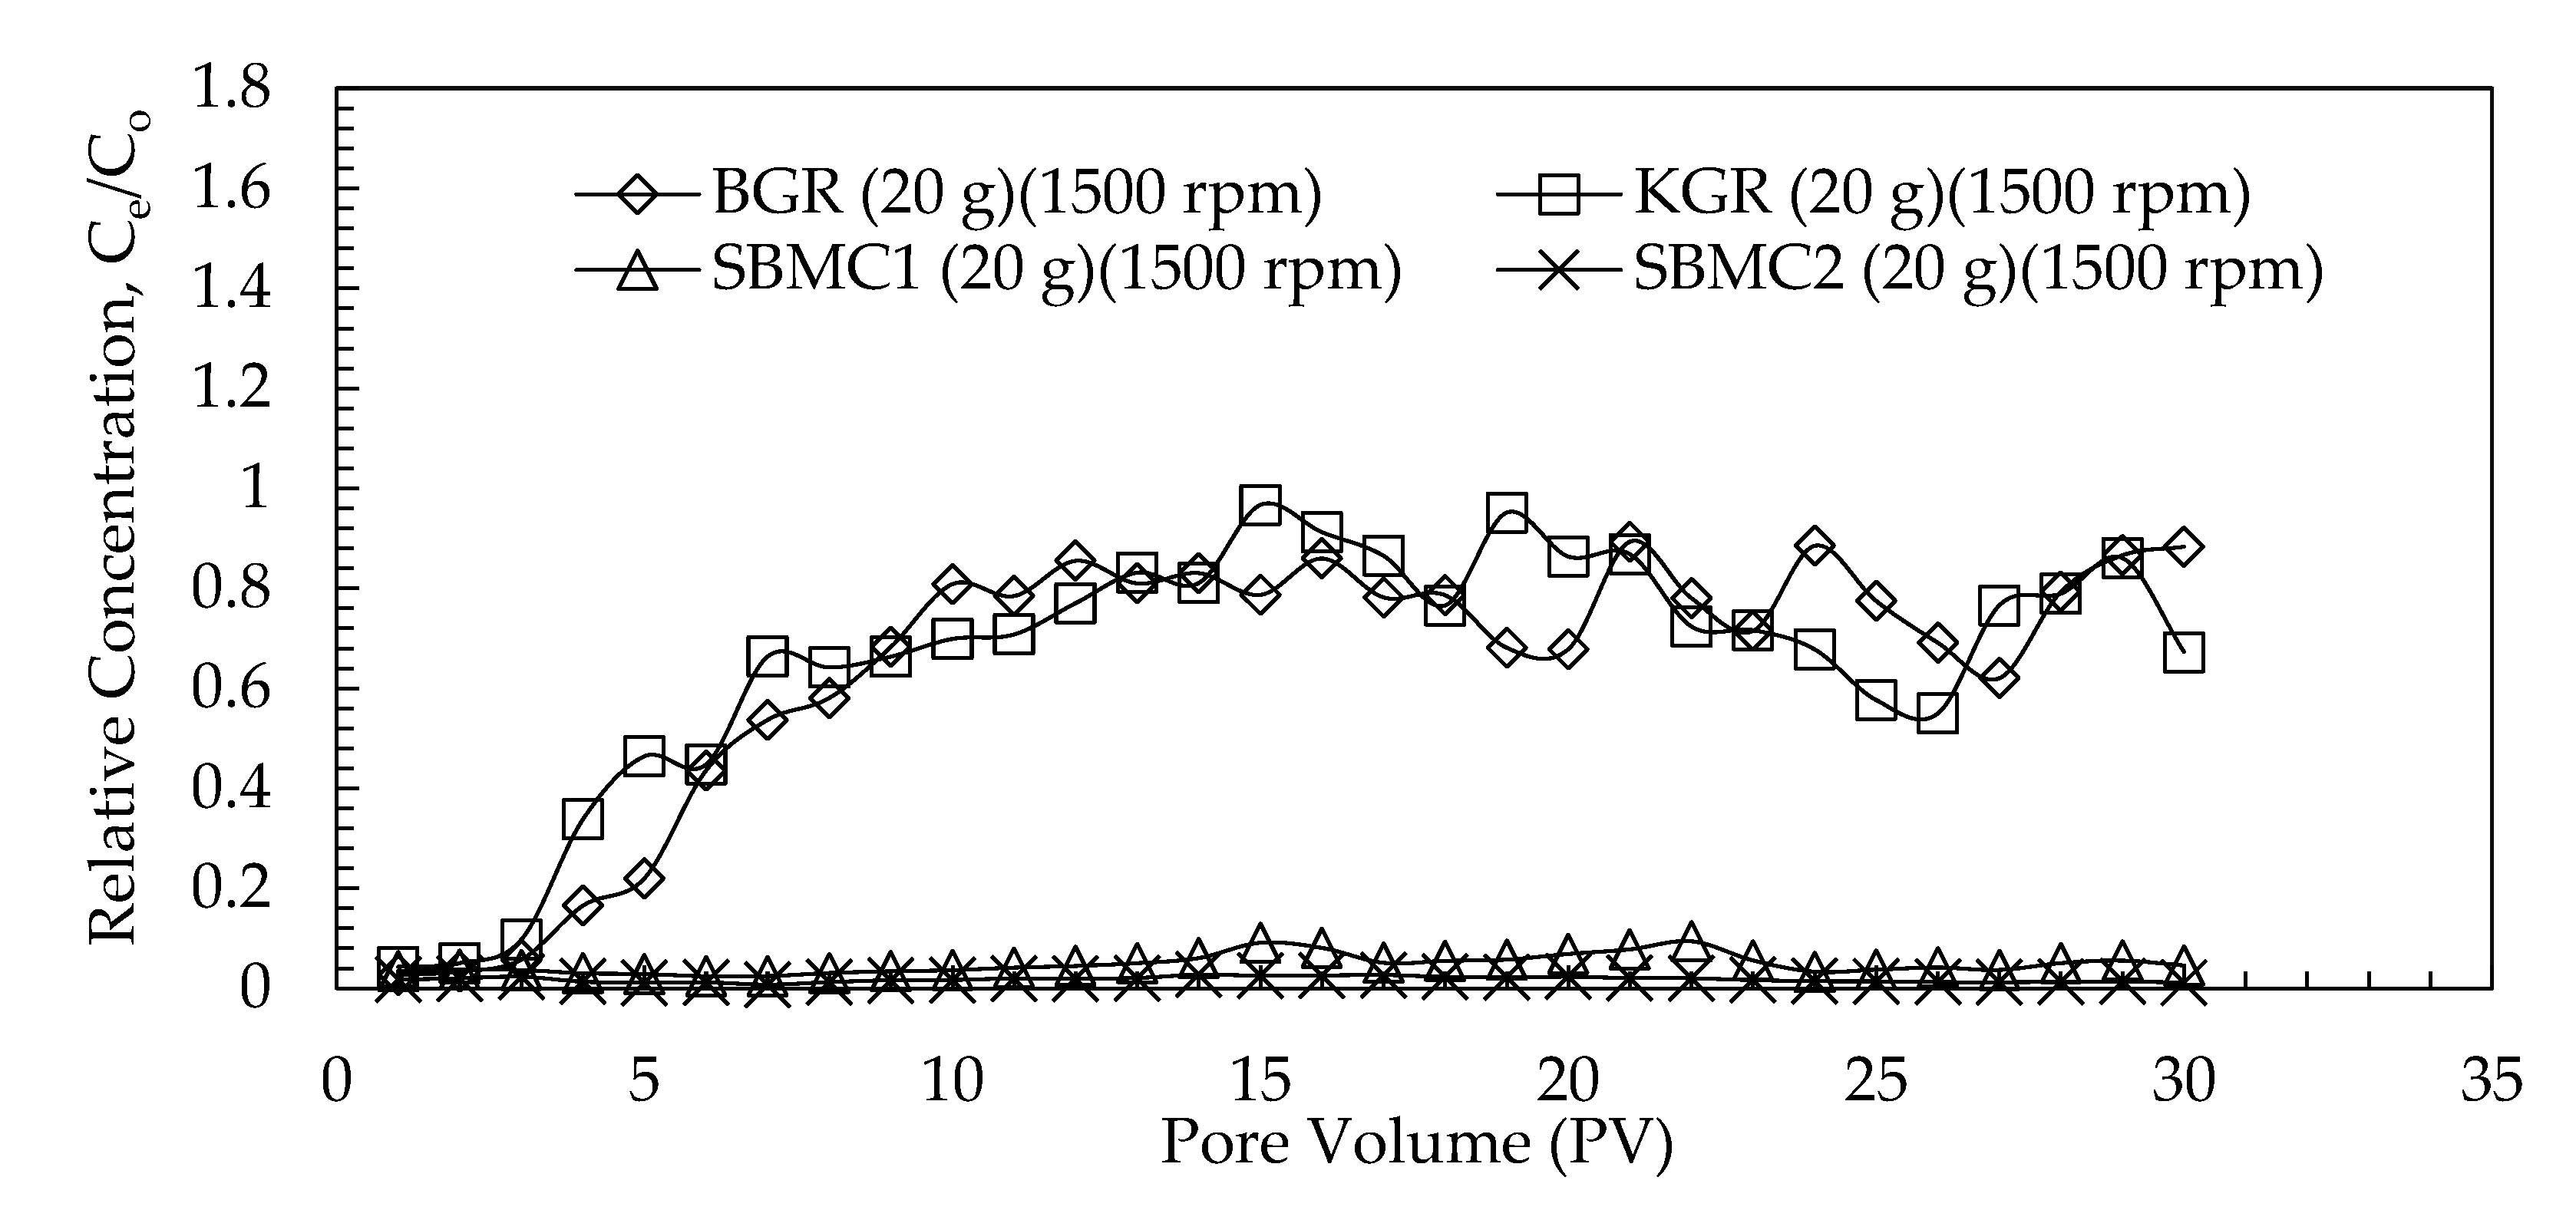
3.3.1. Migration Profiles

Figure 6 depicts Cd breakthrough curves for granitic (BGR, KGR) and marine clay soils (SBMC1, SBMC2). The breakthrough curves were generated by plotting relative concentrations (Ce/Co) against pore volume (PV). Ce/Co is a ratio of effluent concentrations (Ce) to heavy metal solution concentrations put into the column (Co). The curves clearly differentiate marine clay from granitic residual soils. Total Cd penetration occurs when the Ce/Co number is equal to 1.0. In granitic residual soils, the relative concentration increased with the increasing numbers of pore volumes. Total penetrations of Cd occurred after 10 PV and remained constant up to 30 PV. Meanwhile, the relative concentration did not change much for marine clay soils as the curves remained constant (Ce/Co < 0.2) throughout the experiment for up to 30 PV. The study found that marine clay soil has a stronger potential to inhibit Cd migration than granitic residual soil. The physical and chemical features of the soil heavily influence the heavy metal migration. According to the physical and chemical characteristics of these soils (Table 2), marine clay soil has more clay fractions (15%–17%) than granitic residual soil (2%–5% only). The higher clay content of marine clay affects other soil parameters such as cation exchange capacity (CEC) and specific surface area (SSA), both of which play critical roles in Cd retention in soils.

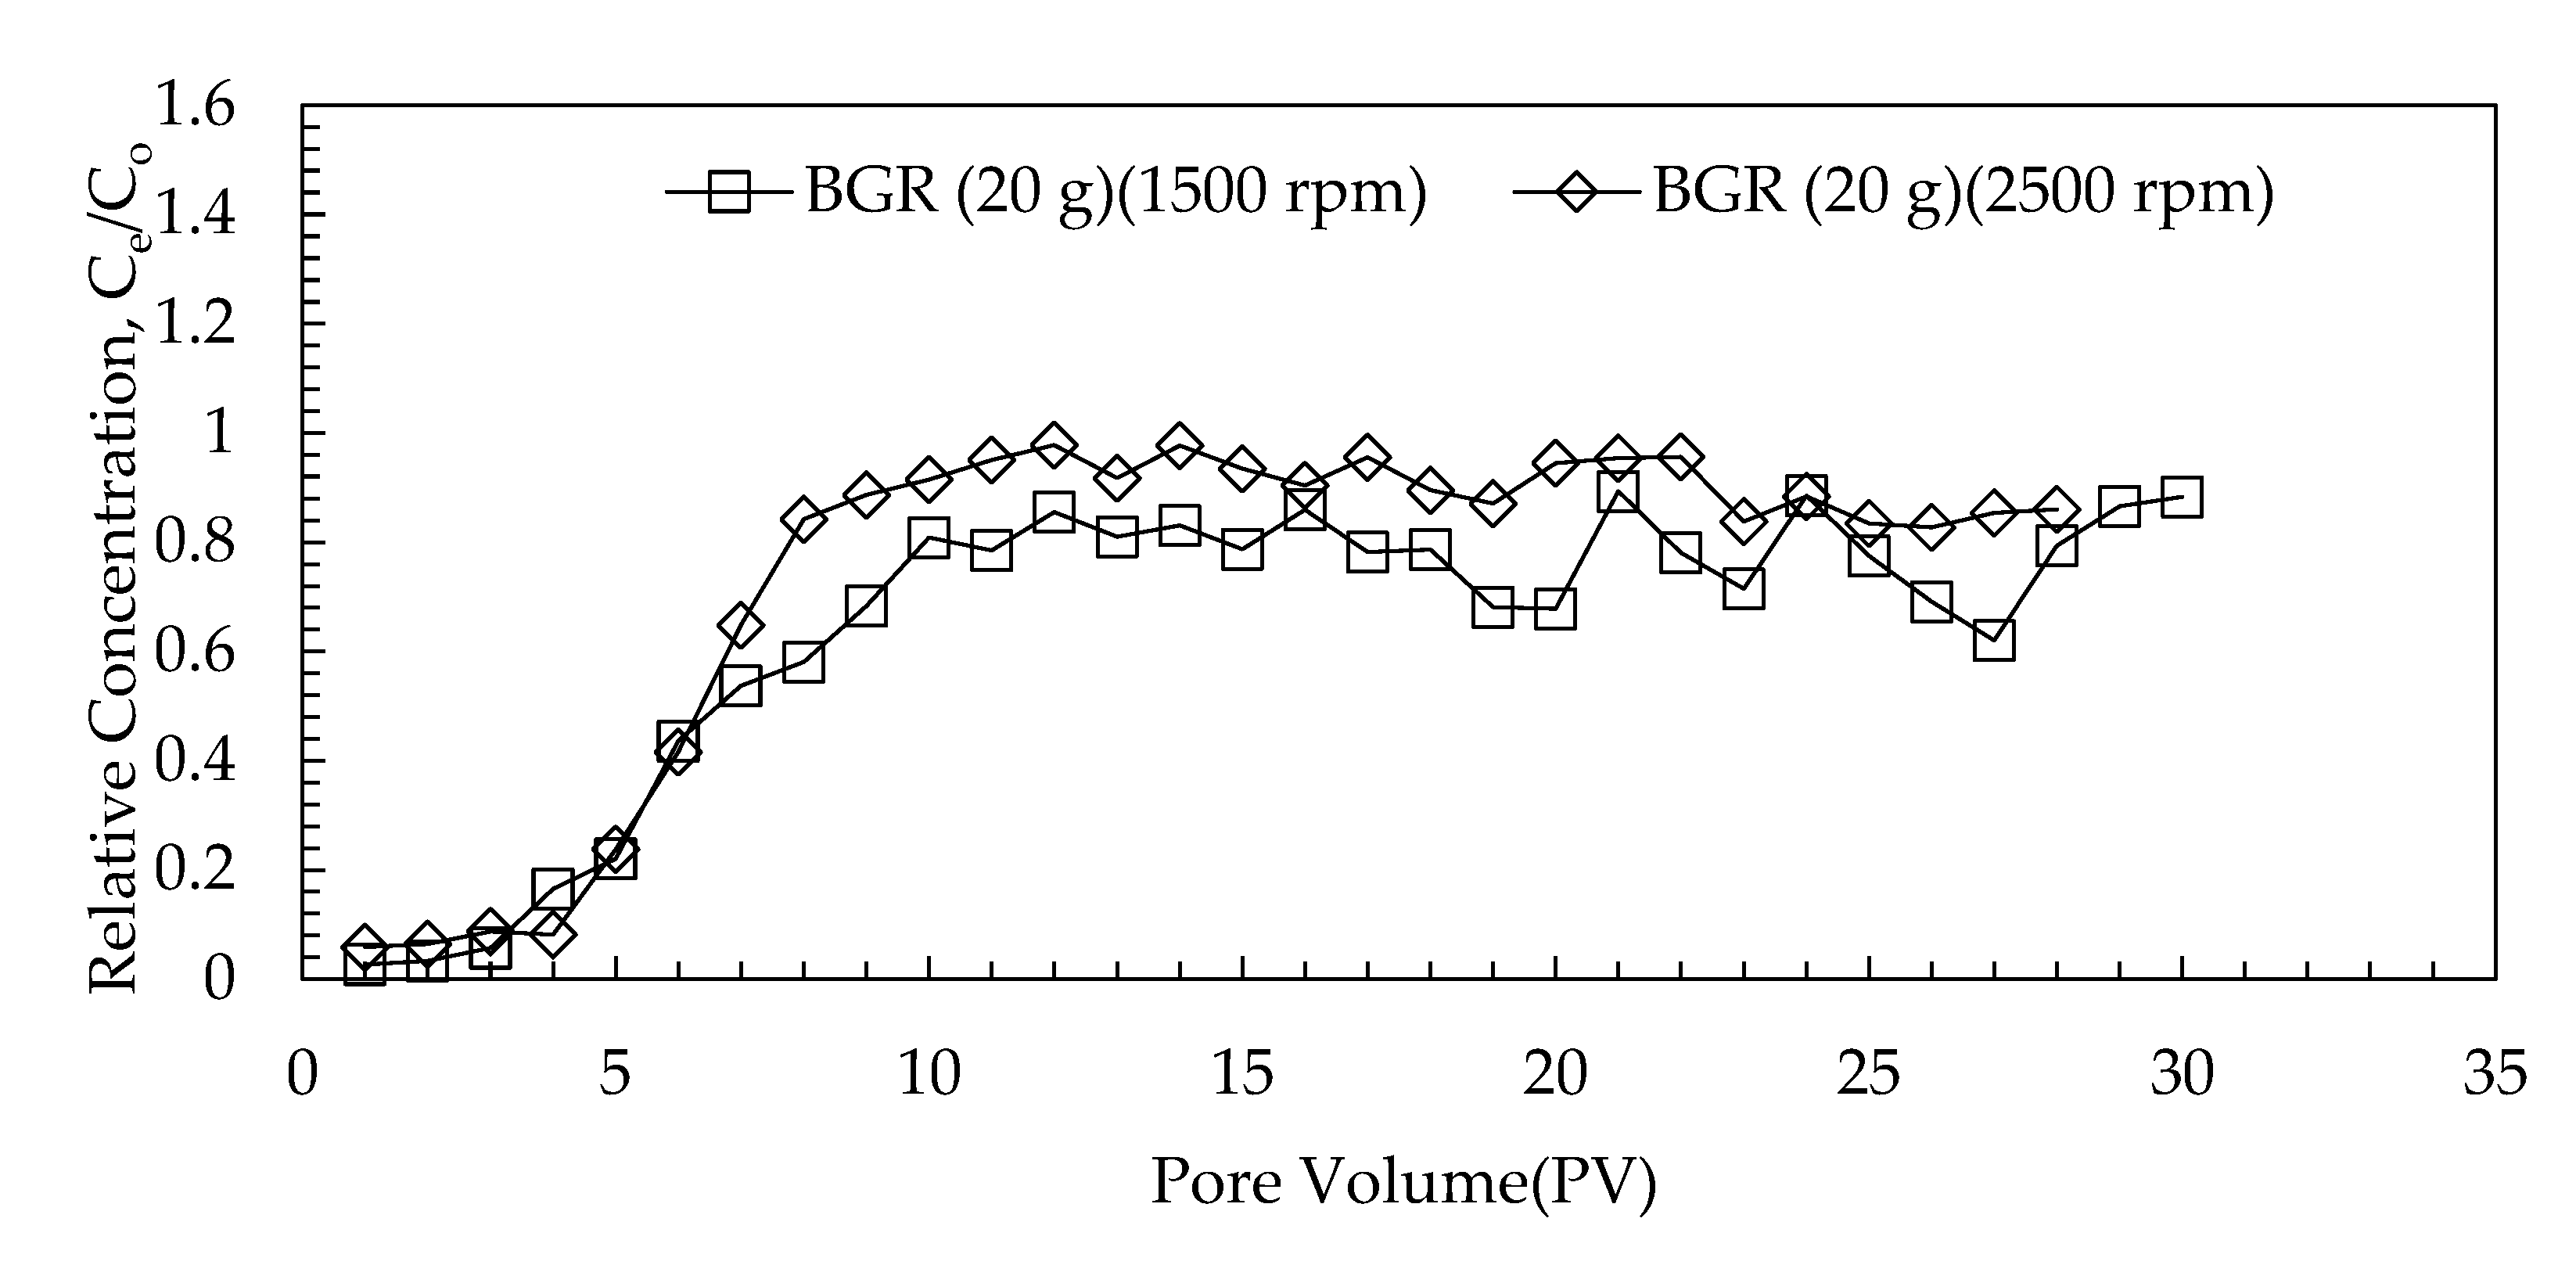
3.3.2. Effect of G-Force

Figure 7 represents the effect of various g-forces on the soil columns during centrifugation. In this study, the g-forces of 520× g (1500 rpm) and 1440× g (2500 rpm) were applied. The results revealed that the g-force had a slight impact on the relative content of granitic residual soil sample (in this case, BGR). The breakthrough curves revealed that Cd penetration occurred way faster in the high g-force BGR column 1440× g (2500 rpm) than in the lower g-force BGR column 520× g (1500 rpm). After 13 PV, the total breakthrough occurred and remained constant (Ce/Co ~ 1.0). The maximum Cd penetration (Ce/Co = 0.8) for the 550× g (1500 rpm) column reached after 10 PV and remained constant at this level for up to 30 PV. Kumar [17] tested four different gravity values (g-force) in his study: 50, 75, 100, and 150× g, and discovered that increasing the centrifugation (time and acceleration level g) increased the concentration of Cl, which is non-reactive and has no sorption involved. Surprisingly, according to this current study, increased the g-force (from 550× g to 1440× g) had only slightly enhanced the Cd breakthrough in the soil column.

3.3.3. The Effect of Soil Thickness

Figure 8 shows the effect of soil thickness on the migration of Cd. The breakthrough curves showed that the thickness of the soil layer in the column was inversely related to the Cd profiles. Comparing BGR only, 10 g and 20 g of soil will produce different thicknesses of the soil layer, 10 mm, and 20 mm respectively. Penetration of Cd through 20 mm of soil layer required more time, as shown by higher PV (PV~30) to achieve total breakthrough in Figure 8. The Cd penetration in 10 mm BGR soil was quicker, where total penetration occurred just after ~12 PV. This was due to heavy metals ions did not have enough time to adsorb on the adsorbent (BGR) at lower bed heights, thus, reduced the breakthrough time [44]. The finer materials, such as marine clay (SBMC), showed slightly different behavior than coarser soil (BGR) due to its high retention capacity on Cd in solution. Adsorbents with smaller particle sizes typically have a higher surface area, resulting in a higher adsorption capacity [45]. Soil thickness (reference done to SBMC) was greater (14 and 28 mm), in spite of the fact that the same amounts of samples were used (10 and 20 g). This is due to the fact that finer clay material is more difficult to compact than coarser clay material. Cd penetration into finer material was initially equal regardless of thickness. However, after 24 PV, the Cd concentration in the effluent solution increased slightly in the 14 mm soil layer. For up to 30 PV, the soil layer of 28 mm remained constant.

3.3.4. Buffering Capacity

Soil buffering capacity is a key component that controls heavy metal retention (sorption). It should be noted that the Cd solution’s pH before testing was 2.3. Figure 9 displays the final pH after centrifugation at each PV. After the first PV, the pH of the effluents in both soils increased to 7.0. (i.e., marine clay and granitic residual soil). However, with a further increasing number of PV, the pH values for granitic soils (BGR and KGR) decreased very rapidly from pH 7 to pH 4 and became constant (pH 4) after 6 PV. Meanwhile, marine clay soils showed different behavior where the pH values were slightly increased and remained constant at pH 8 and 9 (alkaline). The difference in behavior can be explained by the greater buffering capacity of marine clay soils. Soil with a high buffering capacity can withstand pH variations and can improve the soil’s ability to adsorb heavy metals (Cd). According to Yong et al. [11], the precipitation process is the major retention mode of heavy metals in soils with high buffering capacity and this stands for a good reason for using them as landfill liner’s material.

3.3.5. Partition Coefficient (Kd)

The partition coefficient (Kd) of Cd in marine clay and granitic residual soil was calculated using the results of centrifuge column tests (Table 4). Table 4 compares the Kd values from batch adsorption and for in column infiltration tests for which there are some critical information; (i) Kd from the batch experiment is higher than that of column test. The highest Kd value obtained was with marine clay SBMC2 (354.40 L/kg). A previous research [29] reported a maximum Kd value for Cu of 2910 L/Kg, using an initial concentration of 10 mg/L and Kd = 18.2 L/kg, for an initial concentration of 500 mg/L. The result for SBMC2 is too high and further research is needed to confirm it. Column filtration testing yielded acceptable Kd values ranging from 0.28 to 23.6 L/kg. According to Antoniadis, Mckinley and Zuhairi [29], heavy metal adsorption in batch tests occurred in a ‘closed system,’ generating secondary reactions such as precipitation responsible for the heavy metal reduced concentration at the equilibrium and increased Kd values. While in the column infiltration test, metal sorption proceeded in an ‘open system’ with no interference, so the adsorption was constantly leached out of the system. In this situation, metal ion adsorption was greater, resulting in lower Kd values. (ii) Kd at lower g-force is greater than Kd for higher g-force. This is because at lower g-forces, Cd solution has enough contact time for sorption to occur within the soil pores (low mobility), whereas at higher g-forces, contact time is limited (high mobility), hence decreasing sorption (the Kd) (iii) Sample marine clay exhibits greater sorption and thus higher Kd than granitic residual soils. This is confirmed by the high buffering capacity of marine clay as well as conducive physical and chemical properties for Cd adsorption.

4. Conclusions

The experimental study showed that marine clay has a higher capacity to retard the migration of Cd compared to granitic residual soils. This study revealed that physical, chemical, mineralogy and morphology factors significantly impacted on Cd sorption and migration in soil. In batch equilibrium analysis, the removal percentage of Cd in marine clay was 98% (SBMC1) and 86% (SBMC2) whereas the removal percentages in granitic residual soil were 47% (BGR) and 39% (KGR), for an initial concentration of 75 mg/L. High g-force will increase mobility and the contact time and, consequently, the sorption of Cd in soil. This study also enabled the finding that the batch experiment’s partition coefficient (Kd) values were about 5 to 30 times higher than that obtained with the mini-column. The speed of centrifugation (g-force) strongly controlled the Kd values during the experiment conducted in a mini-column. Therefore, this study suggests that marine clay has a good potential to retain heavy metals and is suitable as a liner for landfill purposes.

Author Contributions

Conceptualization, N.A.Z. and W.Z.W.Y.; methodology, N.A.Z. and W.Z.W.Y.; software, N.A.Z.; formal analysis, N.A.Z.; writing—original draft preparation, N.A.Z. and W.Z.W.Y.; writing—review and editing, N.A.Z., W.Z.W.Y. and B.S.; supervision, W.Z.W.Y., B.S. and R.C.O.; funding acquisition, B.S. and R.C.O. All authors have read and agreed to the published version of the manuscript.

Funding

Financial support for this study is provided by the Ministry of Higher Education in Malaysia, grant number: FRGS/1/2012/STWN06/UKM/02/2 and Universiti Tenaga Nasional (UNITEN), grant number: J510050002-IC-6 BOLDREFRESH2025- CENTRE OF EXCELLENCE.

Data Availability Statement

This study’s findings were based on research data.

Acknowledgments

Department of Earth Sciences and Environmental, Faculty of Science and Technology, Universiti Kebangsaan Malaysia; Centre for Research and Instrumentation Management (CRIM), Universiti Kebangsaan Malaysia (UKM) and Institute of Energy Infrastructure (IEI), Universiti Tenaga Nasional (UNITEN) for making this work possible with full financial support.

Conflicts of Interest

There are no conflict of interest declared by all authors to publish this manuscript.

References

  1. Chalermyanont, T.; Arrykul, S.; Charoenthaisong, S.N. Potential use of lateritic and marine clay soils as landfill liners to retain heavy metals. Waste Manag. 2009, 29, 117–127. [Google Scholar] [CrossRef] [PubMed]
  2. Malik, D.S.; Jain, C.K.; Yadav, A.K. Heavy Metal Removal by Fixed-Bed Column-A Review. ChemBioEng Rev. 2018, 5, 173–179. [Google Scholar] [CrossRef]
  3. Tiku, D.K.; Kumar, A.; Sawhney, S.; Singh, V.P.; Kumar, R. Effectiveness of Treatment Technologies for Wastewater Pollution Generated by Indian Pulp Mills. Environ. Monit. Assess. 2007, 132, 453–466. [Google Scholar] [CrossRef]
  4. Singh, R.P. Effect of wastewater disposal and extent of industrial pollution in and around Kanpur, Uttar Pradesh, India. Bull. Eng. Geol. Environ. 2001, 60, 31–35. [Google Scholar] [CrossRef]
  5. Kwon, J.; Yun, S.; Lee, J.; Kim, S.; Young, H. Removal of divalent heavy metals (Cd, Cu, Pb, and Zn) and arsenic (III) from aqueous solutions using scoria: Kinetics and equilibria of sorption. J. Hazard. Mater. 2010, 174, 307–313. [Google Scholar] [CrossRef] [PubMed]
  6. Pasinszki, T.; Krebsz, M. Synthesis and application of zero-valent iron nanoparticles in water treatment, environmental remediation, catalysis, and their biological effects. Nanomaterials 2020, 10, 917. [Google Scholar] [CrossRef] [PubMed]
  7. Rahimzadeh, M.R.; Rahimzadeh, M.R.; Kazemi, S.; Moghadamnia, A.A. Cadmium toxicity and treatment: An update. Casp. J. Intern. Med. 2017, 8, 135–145. [Google Scholar] [CrossRef]
  8. Lan, Y.; Liu, Y.; Li, J.; Chen, D.; He, G.; Parkin, I.P. Natural Clay-Based Materials for Energy Storage and Conversion Applications. Adv. Sci. 2021, 8, 2004036. [Google Scholar] [CrossRef]
  9. Rahman, Z.A.; Yaacob, W.Z.W.; Rahim, S.A.; Lihan, T.; Idris, W.M.R.; Mohd Sani, W.N.F. Geotechnical characterization of marine clay as potential liner material. Sains Malays. 2013, 42, 1081–1089. [Google Scholar]
  10. Yong, B.P.; Mohamed, R.N.; Warkentin, A.M.O. Principles of Contaminant Transport in Soils; Elsevier: New York, NY, USA, 1992. [Google Scholar]
  11. Yong, R.N.; Yaacob, W.Z.W.; Bentley, S.P.; Harris, C.; Tan, B.K. Partitioning of heavy metals on soil samples from column tests. Eng. Geol. 2001, 60, 307–322. [Google Scholar] [CrossRef]
  12. Patel, H. Fixed-bed column adsorption study: A comprehensive review. Appl. Water Sci. 2009, 9, 45. [Google Scholar] [CrossRef] [Green Version]
  13. Negrea, A.; Mihailescu, M.; Mosoarca, G.; Ciopec, M.; Duteanu, N.; Negrea, P.; Minzatu, V. Estimation on fixed-bed column parameters 453 of breakthrough behaviors for gold recovery by adsorption onto modified/functionalized amberlite xad7. Int. J. Environ. Res. Public Health 2020, 17, 6868. [Google Scholar] [CrossRef]
  14. Msaky, J.J.; Calvet, R. Adsorption behavior of copper and zinc in soils, influence of pH on adsorption characteristic. Soil Sci. 1990, 150, 513–522. [Google Scholar] [CrossRef]
  15. Alshaebi, F.Y.; Yaacob, W.Z.W.; Samsudin, A.R. Removal of Arsenic from Contaminated Water by Selected Geological Natural Materials. Aust. J. Basic Appl. Sci. 2010, 4, 4413–4422. [Google Scholar]
  16. Antoniadis, V.; Mckinley, J.D. Leaching tests in a laboratory centrifuge on zinc migration in London Clay. In Proceedings of the International Symposium on Physical Modelling and Testing in Environmental Geotechnics, La Baule, France, 15–17 May 2000. [Google Scholar]
  17. Kumar, P.R. Contaminant Transport Through Geotechnical Centrifuge Models. Environ. Monit. Assess. 2006, 117, 215–233. [Google Scholar] [CrossRef]
  18. Negahdar, A.; Nikghalbpour, M. Geotechnical properties of sandy clayey soil contaminated with lead and zinc. SN Appl. Sci. 2020, 2, 1331. [Google Scholar] [CrossRef]
  19. Mitchell, R. Centrifuge techniques for testing clay liner samples. Can. Geotech. J. 1994, 31, 577–583. [Google Scholar] [CrossRef]
  20. Cerato, A.B.; Lutenegger, A.J. Determination of surface area of fine-grained soils by the ethylene glycol monoethyl ether (EGME) method. Geotech. Test. J. 2002, 25, 315–321. [Google Scholar] [CrossRef]
  21. Cheyns, K.; Mertens, J.; Diels, J.; Smolders, E.; Springael, E. Monod kinetics rather than a first-order degradation model explains atrazine fate in soil mini-columns: Implications for pesticide fate modelling. Environ. Pollut. 2010, 158, 1405–1411. [Google Scholar] [CrossRef]
  22. Alther, G. Using organoclays to enhance carbon filtration. Waste Manag. 2002, 22, 507–513. [Google Scholar] [CrossRef]
  23. Shackelford, C.D. Fundamental considerations for column testing of engineered, clay-based barriers Fundamental considerations for column testing of engineered, clay-based barriers. Jpn. Geotech. Soc. Spec. Publ. 2021, 9, 441–460. [Google Scholar] [CrossRef]
  24. Langmuir, I. The adsorption of gasses on plane surfaces of glass, mica and platinum. J. Am. Chem. Soc. 1918, 40, 1361–1382. [Google Scholar] [CrossRef] [Green Version]
  25. Borna, M.O.; Pirsaheb, M.; Niri, M.V.; Mashizie, R.K.; Kakavandi, B.; Zare, M.R.; Asadi, A. Batch and column studies for the adsorption of chromium (VI) on low-cost Hibiscus Cannabinus kenaf, a green adsorbent. J. Taiwan Inst. Chem. Eng. 2016, 68, 80–89. [Google Scholar] [CrossRef]
  26. Zheng, H.; Liu, D.; Zheng, Y.; Liang, S.; Liu, Z. Sorption isotherm and kinetic modeling of aniline on Cr-bentonite. J. Hazard. Mater. 2009, 167, 141–147. [Google Scholar] [CrossRef]
  27. Grim, R.E. Applied Clay Mineralogy; McGraw-Hill Book Company, Inc.: New York, NY, USA, 1962. [Google Scholar]
  28. Freundlich, H. Über die adsorption in lösungen (adsorption in solution). Z. Phys. Chem. 1906, 57, 385–470. [Google Scholar]
  29. Antoniadis, V.; Mckinley, J.D.; Yaacob, W.Z.W. Single-Element and Competitive Metal Mobility Measured with Column Infiltration and 486 Batch Tests. J. Environ. Qual. 2007, 60, 53–60. [Google Scholar] [CrossRef]
  30. Atanassova, I.D. Adsorption and desorption of Cu at high equilibrium concentrations by soil and clay samples from Bulgaria. Environ. Pollut. 1995, 87, 17–21. [Google Scholar] [CrossRef]
  31. United State Department of Agriculture. Elementary Soil Engineering; United State Department of Agriculture: Washington, DC, USA, 1990; pp. 261–468. [Google Scholar]
  32. Murray, E.J.; Rix, D.W.; Humprey, D. Clay linings to landfill sites. Quat. J. Eng. Geol. Hydrogeol. 1992, 25, 371–376. [Google Scholar] [CrossRef]
  33. Sastre, J.; Rauret, G.; Vidal, M. Sorption-desorption tests to assess the risk derived from metal contamination in mineral and organic soils. Environ. Int. 2007, 33, 246–256. [Google Scholar] [CrossRef]
  34. Hooda, P.S.; Alloway, B.J. Cadmium and lead sorption by selected English and Indian soils. Geoderma 1998, 84, 121–135. [Google Scholar] [CrossRef]
  35. Wedepohl, K.H. Geochemistry; Holt, Rinehart and Winston: New York, NY, USA, 1967. [Google Scholar]
  36. De Plessis, P.; Gazley, M.F.; Tay, S.L.; Trunfull, E.F.; Knorsch, M.; Branch, T.; Fourie, L.F. Quantification of Kaolinite and Halloysite Using Machine Learning from FTIR, XRF, and Brightness Data. Minerals 2021, 11, 1350. [Google Scholar] [CrossRef]
  37. Robertson, I.D.M.; Eggleton, R.A. Weathering of Granitic Muscovite to Kaolinite and Halloysite and of Plagioclase-Derived Kaolinite to Halloysite Clays. Clay Miner. 1991, 39, 113–126. [Google Scholar] [CrossRef]
  38. Hanafi, M.; Ekinci, A.; Aydin, E. Triple-binder-stabilized marine deposit clay for better sustainability. Sustainability 2020, 12, 4633. [Google Scholar] [CrossRef]
  39. Patel, H. Batch and continuous fixed bed adsorption of heavy metals removal using activated charcoal from neem (Azadirachta indica) leaf powder. Sci. Rep. 2020, 10, 16895. [Google Scholar] [CrossRef]
  40. Veli, S.; Alyüz, B. Adsorption of copper and zinc from aqueous solutions by using natural clay. J. Hazard. Mater. 2007, 149, 226–233. [Google Scholar] [CrossRef]
  41. Banerjee, S.; Chattopadhyaya, M.C. Adsorption characteristics for the removal of a toxic dye, tartrazine from aqueous solutions by a low cost agricultural by-product. Arab. J. Chem. 2017, 10, 1629–1638. [Google Scholar] [CrossRef]
  42. Aminu, I.; Gumel, S.M.; Ahmad, W.A.; Idris, A.A. Adsorption Isotherms and Kinetic Studies of Congo-Red Removal from Waste Water Using Activated Carbon Prepared from Jujube Seed. Am. J. Anal. Chem. 2020, 11, 47–59. [Google Scholar] [CrossRef]
  43. Tang, H.; Zhou, W.; Zhang, L. Adsorption isotherms and kinetics studies of malachite green on chitin hydrogels. J. Hazard. Mater. 2012, 209–210, 218–225. [Google Scholar] [CrossRef]
  44. Gouran-orimi, R.; Mirzayi, B.; Nematollahzadeh, A.; Tardast, A. Journal of Environmental Chemical Engineering Competitive adsorption of nitrate in fi xed-bed column packed with bio-inspired polydopamine coated zeolite. J. Environ. Chem. Eng. 2018, 6, 2232–2240. [Google Scholar] [CrossRef]
  45. Zhang, F.; Wang, F.; Cao, B.; Yin, H.; Al-Tabbaa, A. Simultaneous removal of Pb and MTBE by mixed zeolites in fixed-bed column tests Simultaneous removal of Pb and MTBE by mixed zeolites in fixed-bed column tests. J. Environ. Sci. 2022, 122, 41–49. [Google Scholar] [CrossRef]
Figure 1. The granitic residual soil ((A) Broga granitic residual soil, BGR and (B) Kajang granitic residual soil KGR) and marine clay ((C) Sg Besar marine clay, SBMC1 and (D) SBMC2) used in this study. Petri dish size are 35 mm.
Minerals 12 01106 g001
Figure 2. XRD pattern of freshly granitic residual soils and marine clays.
Minerals 12 01106 g002
Figure 3. SEM images of granitic residual soil on (A) BGR at 2000×, (B) BGR at 5000×, (C) KGR at 2000×, (D) KGR at 5000×, and marine clay on (E) SBMC1 at 2000×, (F) SBMC1 at 5000×, (G) SBMC2 at 2000×, (H) SBMC2 at 5000×.
Minerals 12 01106 g003
Figure 4. The (a) Effect of initial concentration on adsorption of Cd onto adsorbents [W: 4 g; V: 40 mL, t: 24 h] and (b) removal percentage.
Minerals 12 01106 g004
Figure 5. Adsorption data using Linear, Langmuir and Freundlich plots at different concentrations of Cd using granitic residual soil, (A) BGR, (B) KGR and marine clay (C) SBMC1, (D) SBMC2.
Minerals 12 01106 g005
Figure 6. Breakthrough curves for granite soil (BGR, KGR) and marine clay (SBMC).
Minerals 12 01106 g006
Figure 7. The effect of different g-forces on the migration of Cd in soil column. Note: 1500 rpm (520× g) and 2500 rpm (1440× g).
Minerals 12 01106 g007
Figure 8. The effect of soil thickness on the migration of Cd. Note: 10 g (10 mm) and 20 g (20 mm).
Minerals 12 01106 g008
Figure 9. Soil buffering capacity of granitic residual soil and marine clay.
Minerals 12 01106 g009
Table 1. Experimental set-up for mini column centrifuge testing.
SamplesSoil Weight (g)Soil
Thickness
(mm)
Parameters
Speed (rpm)G-Force (g)Spinning Time (min)
BGR/KGR1010150052030
20202500144060
SBMC1/SBMC21014150052080
202825001440180
Table 2. Physical and chemical properties of the soils.
Properties BGRKGRSBMC1SBMC2
Sand (%)60.0 ± 3.1651.0 ± 2.833.6 ± 2.6512.0 ± 3.29
Silt (%)37.2 ± 3.2544.6 ± 3.280.8 ± 4.6671.0 ± 3.85
Clay (%)2.8 ± 1.944.4 ± 1.5015.6 ± 3.0117.0 ± 2.61
USCS classificationSandy silt Sandy elastic siltSandy elastic siltSandy elastic silt
USCS symbolMLMHMHMH
Plastic Limit (%)38.37 ± 0.2535.57 ± 0.6055.83 ± 3.7247.39 ± 1.47
Liquid Limit (%)49.06 ± 0.5651.12 ± 0.3782.16 ± 1.8475.80 ± 2.01
Plasticity Index (%)10.69 ± 0.7015.55 ± 0.5426.33 ± 5.2028.41 ± 2.25
Plasticity ChartIntermediateHighVery highVery high
Specific Gravity2.54 ± 0.032.54 ± 0.072.23 ± 0.052.29 ± 0.05
Max Dry Density, ρdmax (g/cm3)1.71 ± 0.051.70 ± 0.011.37 ± 0.011.39 ± 0.01
Optimum Moisture Content, Wopt (%)18.57 ± 0.0314.26 ± 2.5836.56 ± 3.9925.95 ± 1.61
Permeability (m/s)2.08 × 10−61.43 × 10−66.56 × 10−75.64 × 10−7
pH 5.45 ± 0.085.63 ± 0.167.22 ± 0.167.59 ± 0.06
Organic Matter (%)0.46 ± 0.040.27 ± 0.055.79 ± 0.265.72 ± 0.53
SSA (m2/g)19.73 ± 1.6426.36 ± 0.4561.36 ± 0.8673.73 ± 4.70
CEC (meq/100 g)1.06 ± 0.231.33 ± 1.0191.81 ± 0.4476.91 ± 1.08
Note: USCS is Unified Soil Classification System.
Table 3. Adsorption isotherms and their correlations.
Adsorption Isotherm BGRKGRSBMC1SBMC2
Linear EquationKd (L/g)0.00620.00420.07030.3544
R20.97230.9780.97010.9614
Langmuir EquationKL (L/g)0.07800.13780.01200.1236
Am (mg/g)0.55900.48248.57996.4771
R20.85390.93980.87610.8964
RL0.0267
0.2544
0.0089
0.5520
0.5375
1.0000
0.3638
1.0000
Freundlich EquationKF (L/g)0.01370.04540.15390.8202
1/n0.83430.55030.78050.6340
R20.92660.92660.96410.9813
Table 4. Partition coefficient (Kd) of soils from centrifuge column testing.
SoilsBatch, Kd (L/Kg)Column (20 g) Kd (L/Kg)
1500 rpm/522500 rpm/1440
BGR6.200.880.45
KGR4.200.590.28
SBMC170.3010.408.06
SBMC2354.4023.5821.60
Publisher’s Note: MDPI stays neutral with regard to jurisdictional claims in published maps and institutional affiliations.

