Abstract
The influence of cold rotary forging on the mechanical properties of the Cu/Al–10% La composite, depending on the billet’s reduction ratio, has been studied. The billet was forged from an original diameter of 20 mm to a final diameter of 2.5 mm (e = 4.16). It is shown that the formation of a predominantly subgrain structure with a high density of dislocations in a copper shell, and a predominantly ultrafine grain/subgrain structure in an aluminum rod provides an approximately two-fold increase in the strength of the composite material compared to its components. To clarify the mechanisms of deformation and fracture of the composite samples under tension, the acoustic emission technique was used. It is shown that by choosing the temperature of post-deformation annealing, it is possible to achieve the required balance between strength and plasticity of the composite samples. The electrical conductivity and coefficient of linear thermal expansion of the composite samples have been measured.
1. Introduction
In recent years, the copper–aluminum based composite materials have received new development [1,2,3,4]. Such materials are promising for electrical engineering, since they simultaneously have increased strength, ductility, electrical conductivity, and lower density. Rotary forging, which is one of the severe plastic deformation techniques, is considered as a method of their manufacture [5,6,7,8,9].
In [7,8,10], the copper–aluminum composites of various designs (laminar or fibrous) based on pure copper and aluminum were studied. Thus, for a pure copper/aluminum fiber composite, a strength of 250–280 MPa was achieved, depending on the reduction ratio and forging temperature. In [5], the aluminum alloy/copper composite samples with a shell of an aluminum alloy of the Al–Cu–Mg type and a rod of pure copper were obtained by rotary forging. In [6], the order of the components was changed to the reverse, namely a shell of copper and a rod of aluminum alloy. Due to the use of an aluminum alloy of the Al-Cu-Mg type as one of the components, the composite samples after forging had increased strength (approximately 370 MPa), but their ductility was limited to 2–3% due to early cracking in the aluminum alloy. It is advisable to use eutectic aluminum alloys of the Al–Ca, Al–Ce, or Al–La type, which have a high margin of plasticity and are well amenable to deformation processing [11,12,13,14], as one of the components of the composite. Among these alloys, the most plastic is the eutectic alloy Al–10% La (wt.%) [12]. In addition, alloying aluminum with lanthanum increases the working temperatures of the alloy [15,16]. It is well known that post-deformation annealing can increase the plasticity of metal materials obtained by the severe plastic deformation techniques, however, in general, its effect on mechanical properties is ambiguous [17,18,19].
Therefore, the aim of the work was to study in detail the structure and mechanical behavior of the Cu/Al–10% La composite sample depending on the billet’s reduction ratio by rotary forging as well as the post-deformation annealing temperature, and to evaluate its physical properties, namely electrical conductivity and coefficient of linear thermal expansion.
2. Materials and Methods
The composite billet consisted of a rod made of an aluminum alloy Al–10%La (wt.%) with a diameter of 12 mm, placed in a shell of pure copper (99.97%) with an outer diameter of 20 mm. The original length of the billet was 200 mm. Machining of the billet’s components was carried out using a lathe. Before assembling the billet, the copper shell was subjected to softening annealing in vacuum at a temperature of 500 °C with a holding time of 40 min. The aluminum alloy was used in the as-cast state.
The billets were sequentially forged using modernized double-die rotary forging machines RKM1 (V2129.01) (from 20.0 to 5.5 mm in billet’s diameter), RKM3 (V2127.01) (from 5.5 to 4.0 mm in billet’s diameter), and RKM4 (V2123.01) (from 4.0 to 2.5 mm in billet’s diameter) at room temperature. Between passes, part of the billets were subjected to periodic low-temperature annealing at 180 °C (1 h) for partial removal of work hardening. The annealing was carried out after the billet reached a diameter of 5 mm, and then a diameter of 3.5 mm. The other part of the billets was forged up to 3.5 mm diameter without intermediate annealing. The reduction ratio was computed using the e = ln(S0/Sf) relation, where S0 and Sf were the original and final cross-sectional areas, respectively. For research, the composite samples with diameters of 5.0 mm; 3.5 mm, and 2.5 mm (the reduction ratios were 2.77, 3.49, and 4.16, respectively) were taken.
After rotary forging, some of the composite samples were annealed in an electric furnace at temperatures of 180 °C, 240 °C, and 300 °C for 2 h, and air cooled.
Microhardness measurements on the transverse sections of the composite samples (along the diameter) were carried out by the Vickers method (load 50 g, exposure time 10 s) using a MICROMET 5101 microhardness tester-microscope (Buehler, Leinfelden-Echterdingen, Germany).
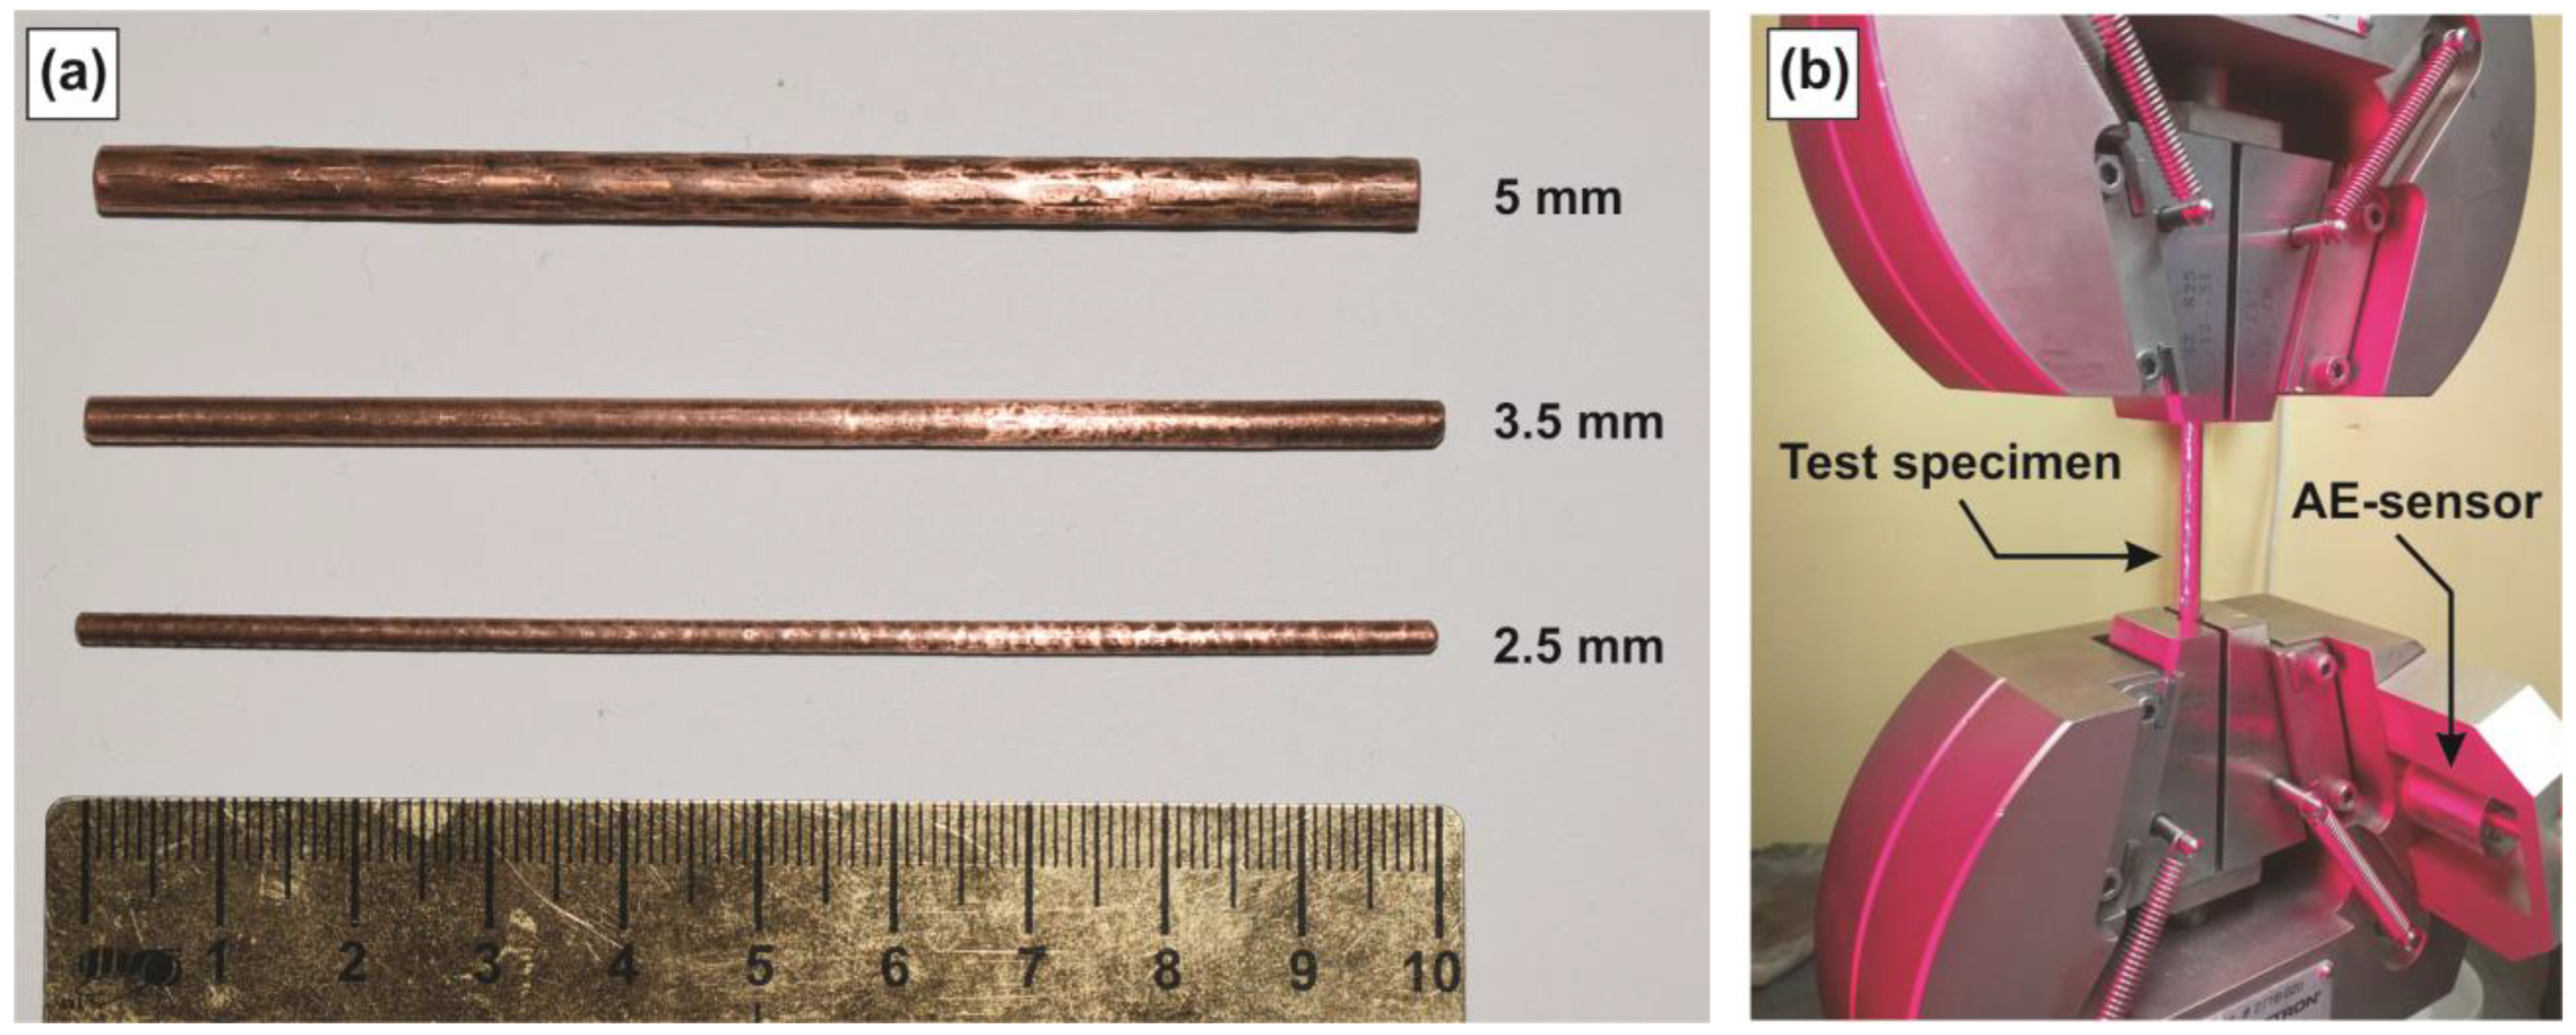
Uniaxial tensile tests of the composite specimens with a total and gage length of 100 mm and 30 mm, respectively, were carried out using an Instron 5569 universal testing machine (Instron, Norwood, MA, USA) at room temperature with a deformation rate of 0.001 s–1 and using a video extensometer. The yield strength, ultimate tensile strength, and the relative elongation were determined from the test results. The yield strength was determined by strain 0.2%. Tensile testing was carried out with simultaneous measurement of acoustic emission (AE) signals using the NI PXIe-1082 DC modular measuring platform [20,21]. AE signals were recorded at a clock frequency of 100 MHz with a built-in amplification of 10 times. The average level of technological noise of the equipment was approximately 10 mV at a dynamic signal range of 40 V. The processing of AE signals and the analysis of AE diagrams were carried out in the LabVIEW 2016 environment. The stress–strain curves and AE diagrams were combined by time marks. The appearance of the tensile test specimens as well as the test installation are shown in Figure 1.
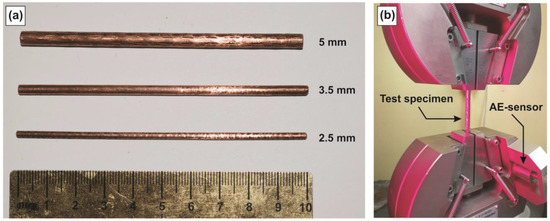
Figure 1.
(a) The appearance of the tensile test specimens with different diameters and (b) the test installation.
The images of the transverse section sample’s structure were obtained using a scanning electron microscope TESCAN VEGA 3 and back-scattered electron mode. Chemical analysis was carried out using an INCA Energy 15013 X-act Oxford Instruments energy-dispersive microanalyzer (EDS) with an X-act ADD detector and INCA Energy software.
The microstructure of the composite sample’s components (copper shell and aluminum rod) in the longitudinal direction was studied by transmission electron microscopy (TEM) using a JEM-2100 microscope (JEOL Ltd., Tokyo, Japan) with EDS. The preparation of samples (so-called lamella) for studying the microstructure was carried out using a Strata 201 SIMSmapIII×P scanning ion microscope and a gallium liquid metal ion gun.
The electrical conductivity of the composite samples was measured according to GOST 7229-76 (Russian document) using a GOM-802 digital milliohmmeter (GP + RS).
The coefficient of linear thermal expansion in the temperature range 25–450 °C was determined using a quenching-deformation dilatometer DIL 805 A/D and the composite specimens 10 mm high and 5 mm in diameter.
3. Results and Discussion
3.1. Structure
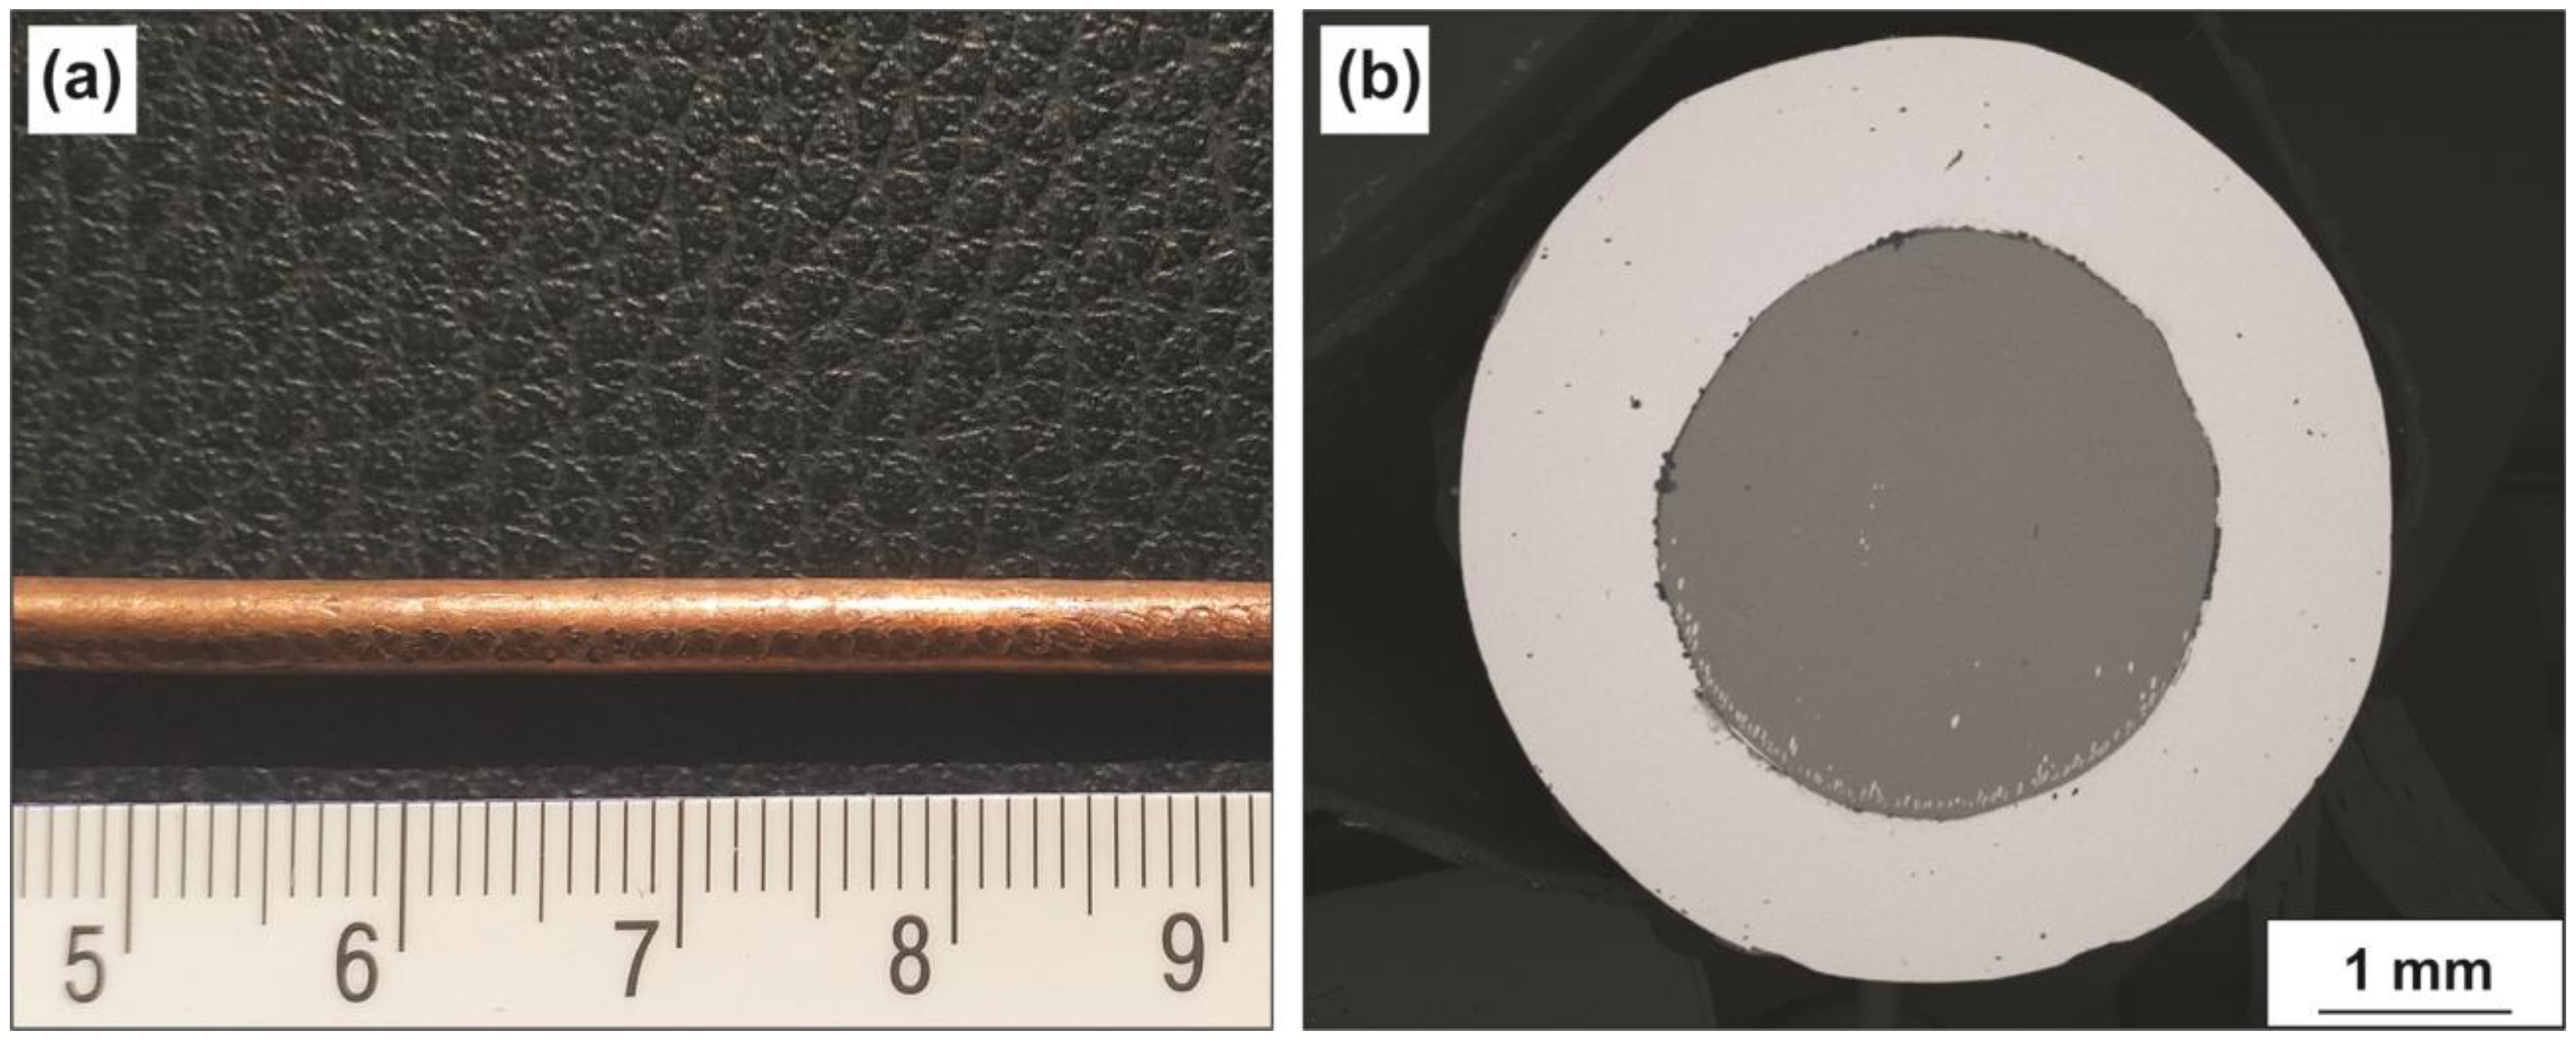
As a result of rotary forging, the long-length (with a maximum length of about 3000 mm) composite samples were obtained without a noticeable difference in the thickness of the components (Figure 2).
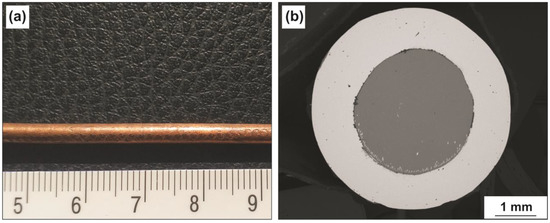
Figure 2.
(a) The appearance and (b) cross section of the 5-mm diameter composite sample.
The structure of the composite billet’s components, namely copper and aluminum in the annealed and cast state, respectively, was studied earlier [5,12]. Copper is characterized by a recrystallized partially twinned structure with an average grain size of 36 µm. The structure of the Al–10% La alloy consists of an aluminum matrix (Al) and a finely dispersed eutectic [(Al) + Al11La3]) uniformly distributed in the bulk of the alloy.
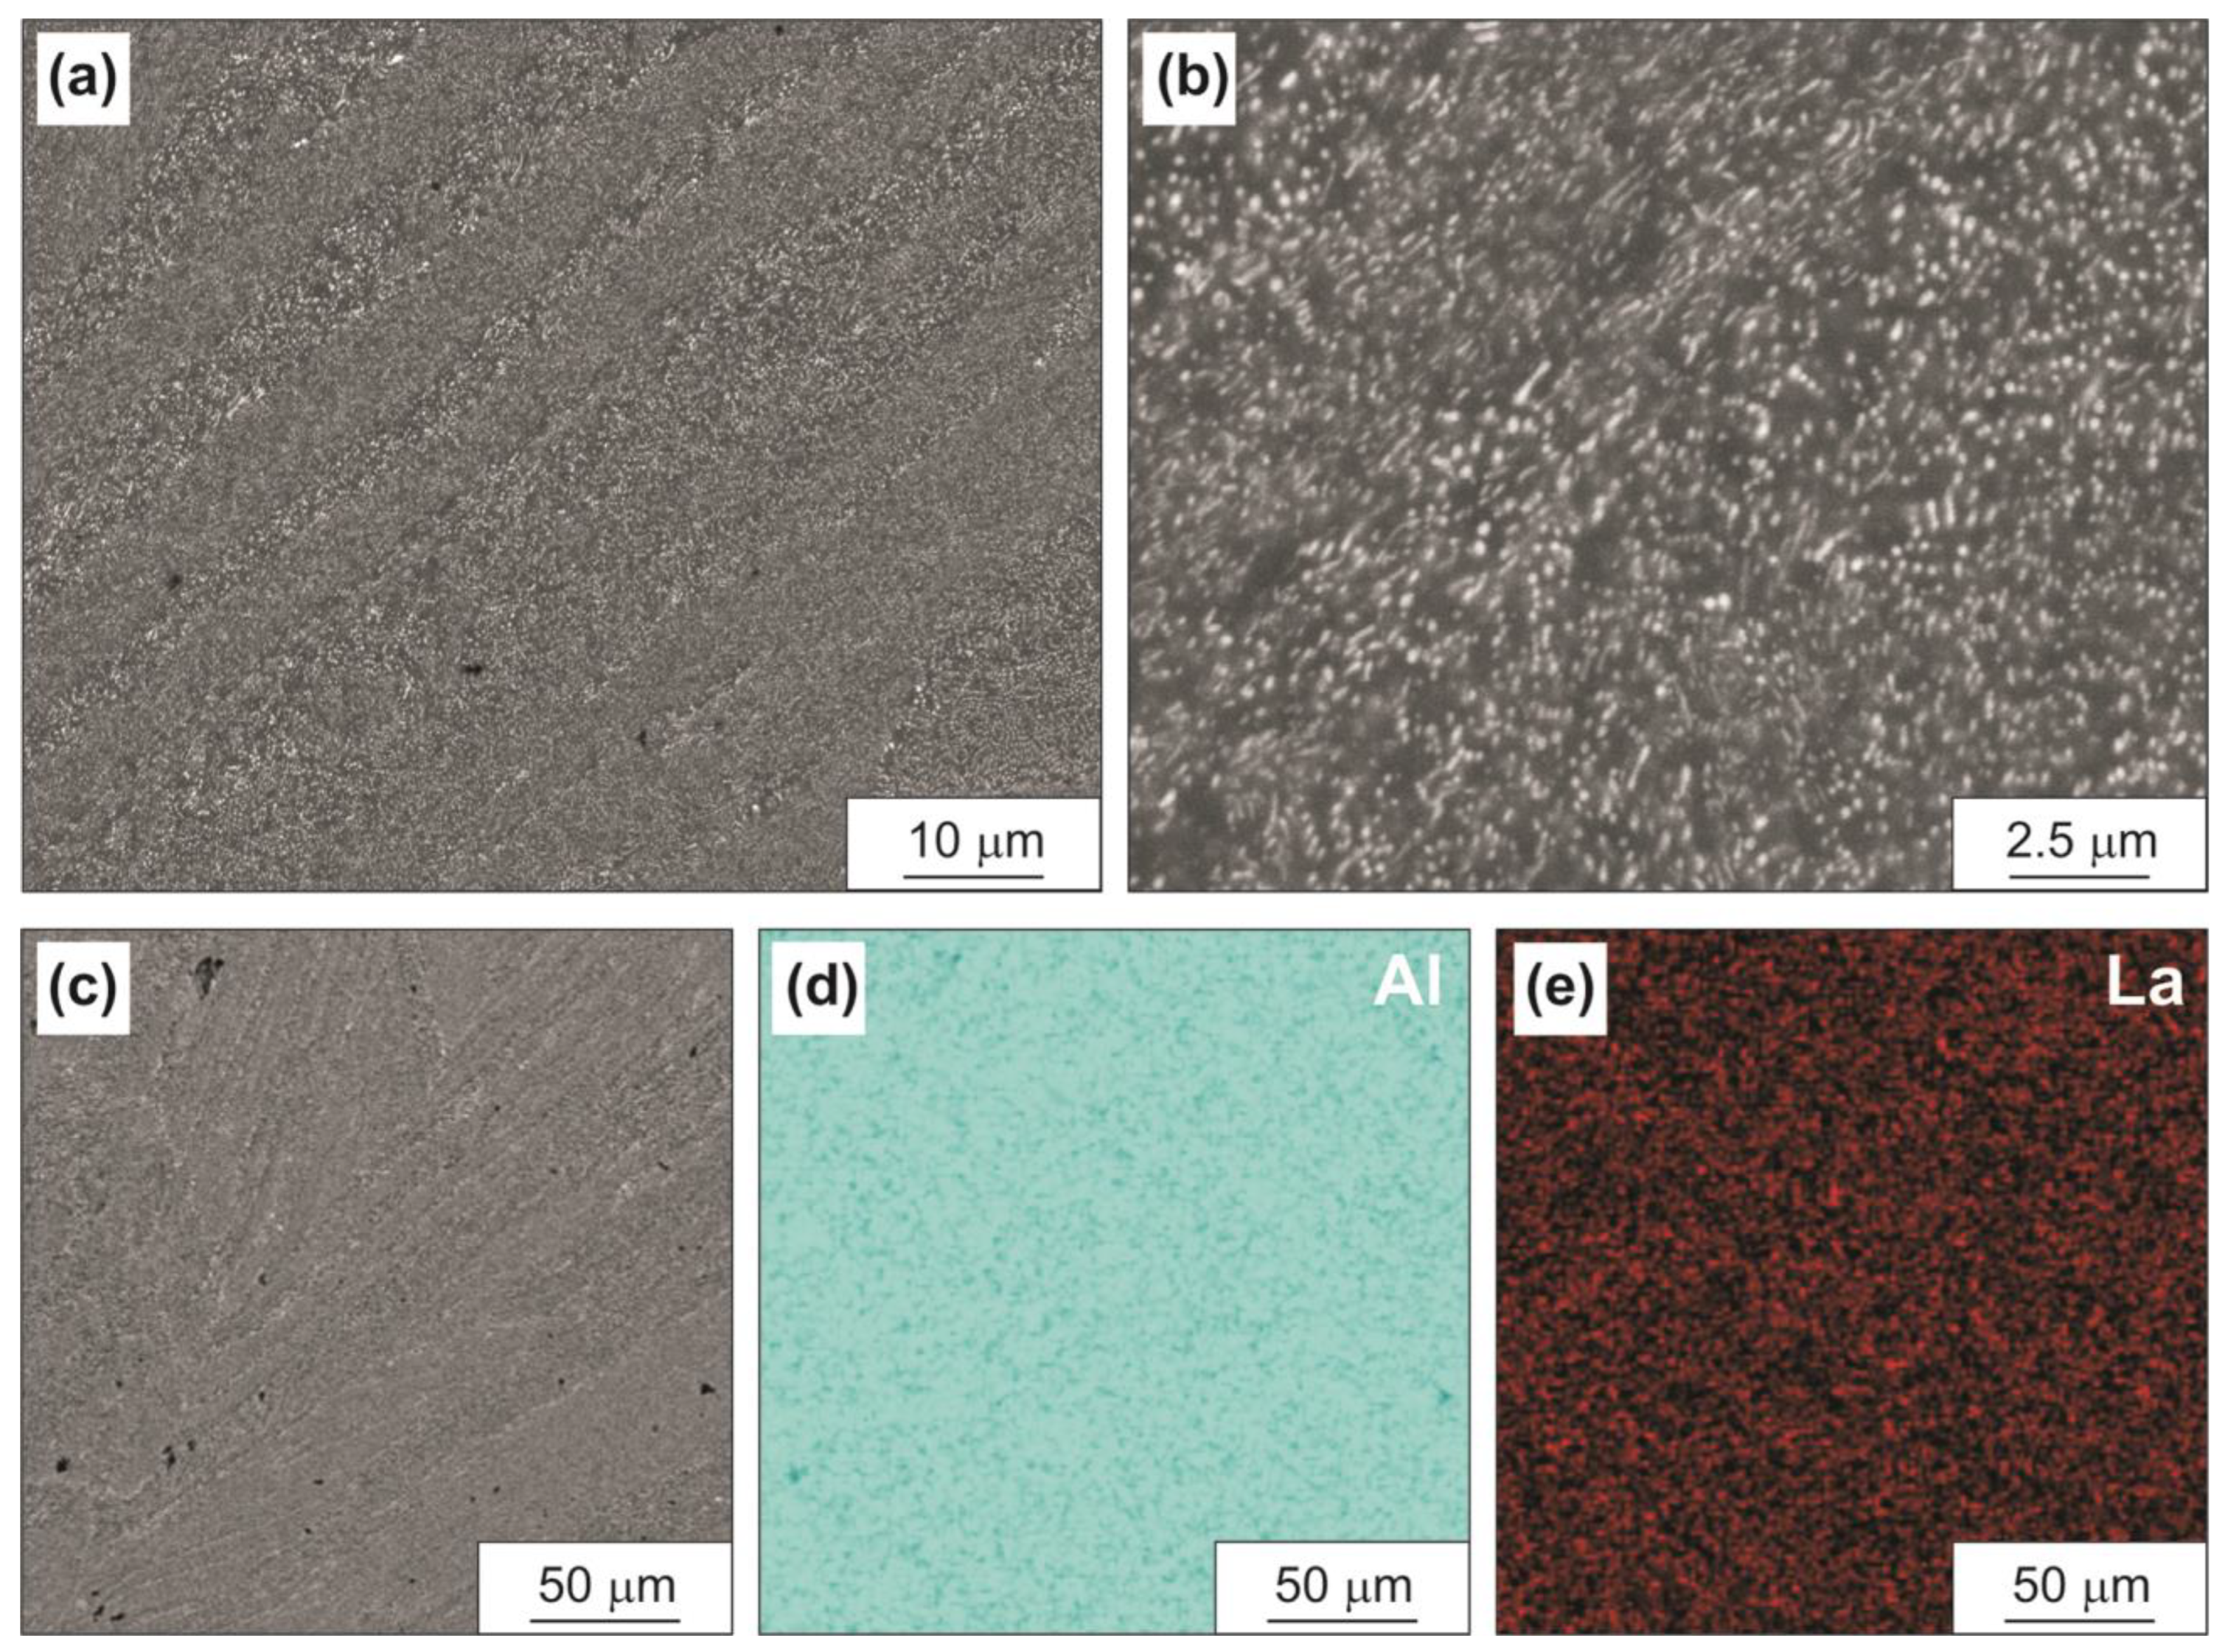
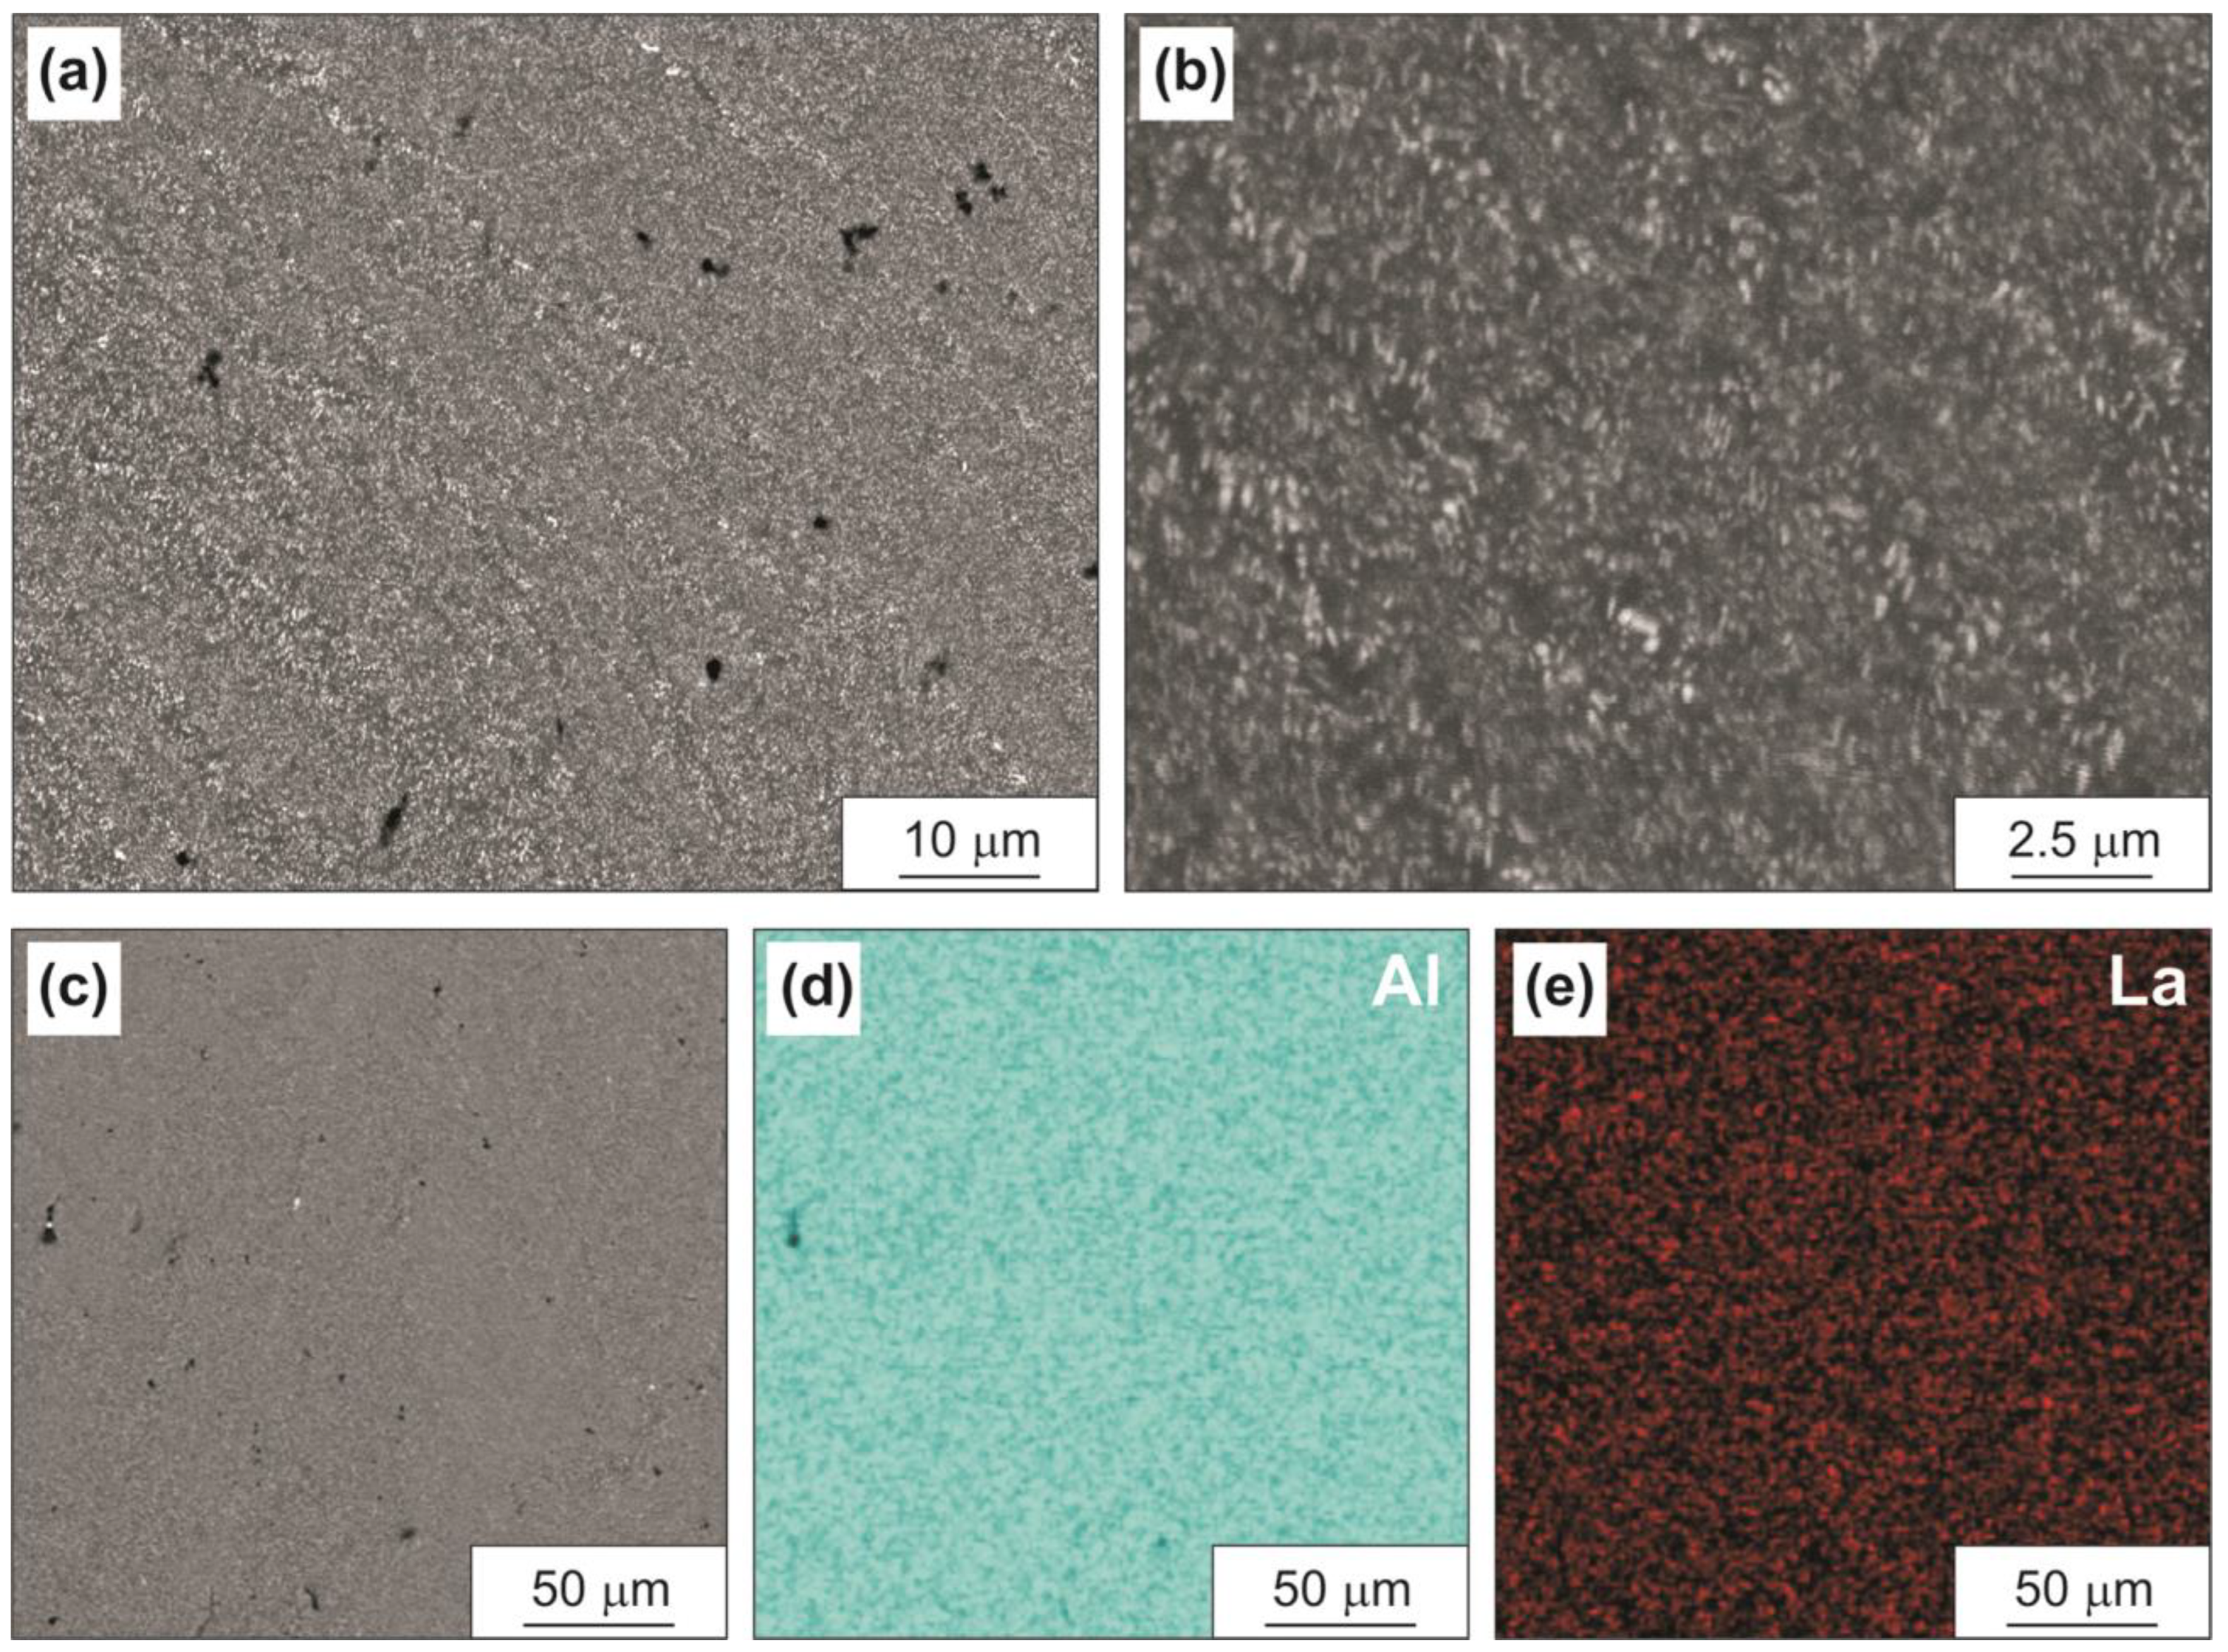
Figure 3 and Figure 4 show the cross-sectional images of the composite samples after rotary forging to a diameter of 5 and 2.5 mm, respectively, obtained by SEM. In the aluminum rod of the 5-mm diameter composite sample, a finely dispersed eutectic structure with dendrite cell contours is preserved (Figure 3a,b). The predominant size of the Al11La3 eutectic particles is about 1 µm or less. With a decrease in the composite sample’s diameter to 2.5 mm (with intermediate annealing), the structure of the eutectic becomes even more refined and uniform (Figure 4a,b). The contours of the dendrites are very weakly visible. In both cases, the EDS analysis shows a uniform distribution of lanthanum in the aluminum rod structure (Figure 3c and Figure 4c). With an increase in billet’s reduction ratio, no changes in the copper shell were detected by SEM.
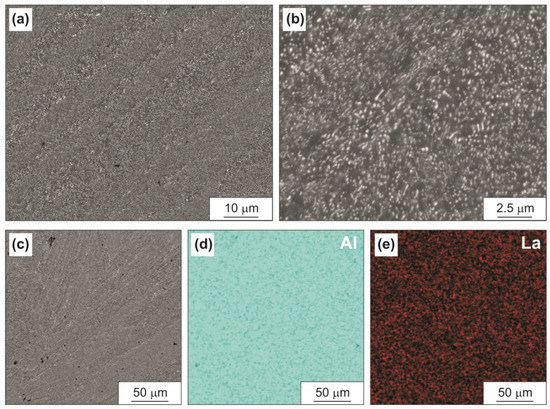
Figure 3.
(a,b) SEM-cross sectional structure of the aluminum rod of the 5-mm diameter composite sample (e = 2.77) and EDS results (c–e): (c)—the analyzed area of the structure and chemical distribution maps for (d) Al and (e) La.
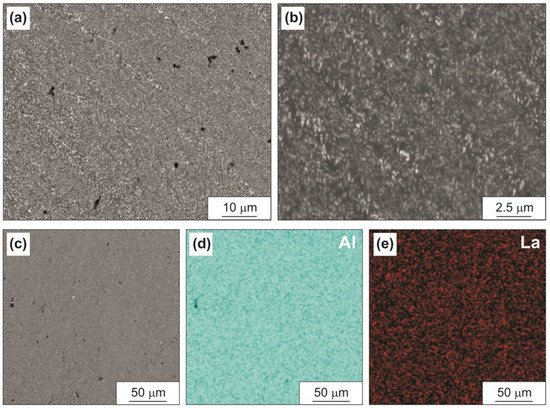
Figure 4.
(a,b) SEM-cross sectional structure of the aluminum rod of the 2.5-mm diameter composite sample (e = 4.16) and EDS results (c–e): (c)—the analyzed area of the structure and chemical distribution maps for (d) Al and (e) La.
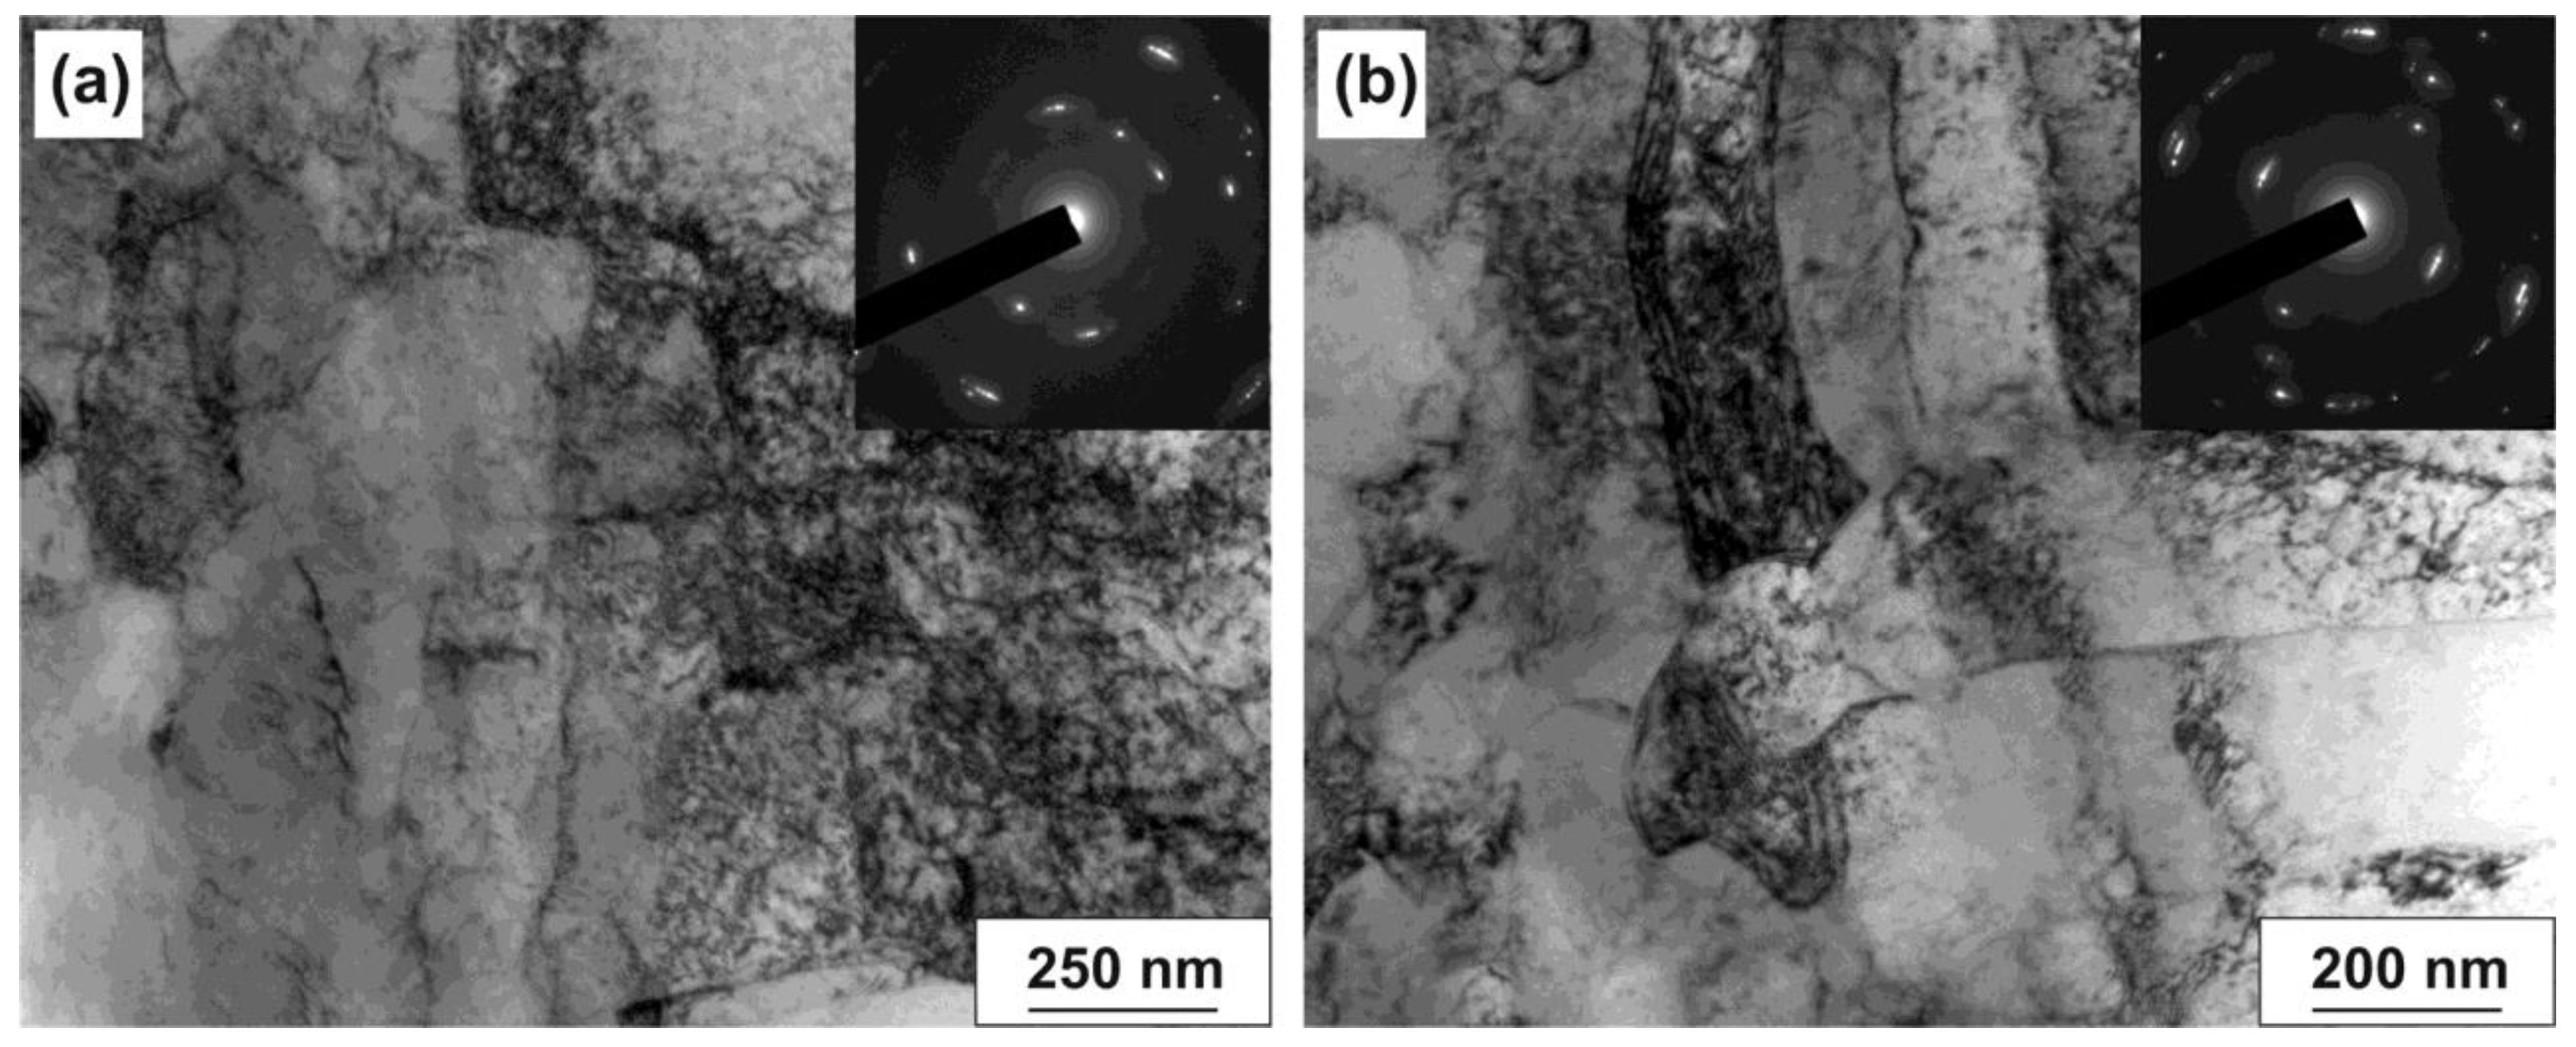
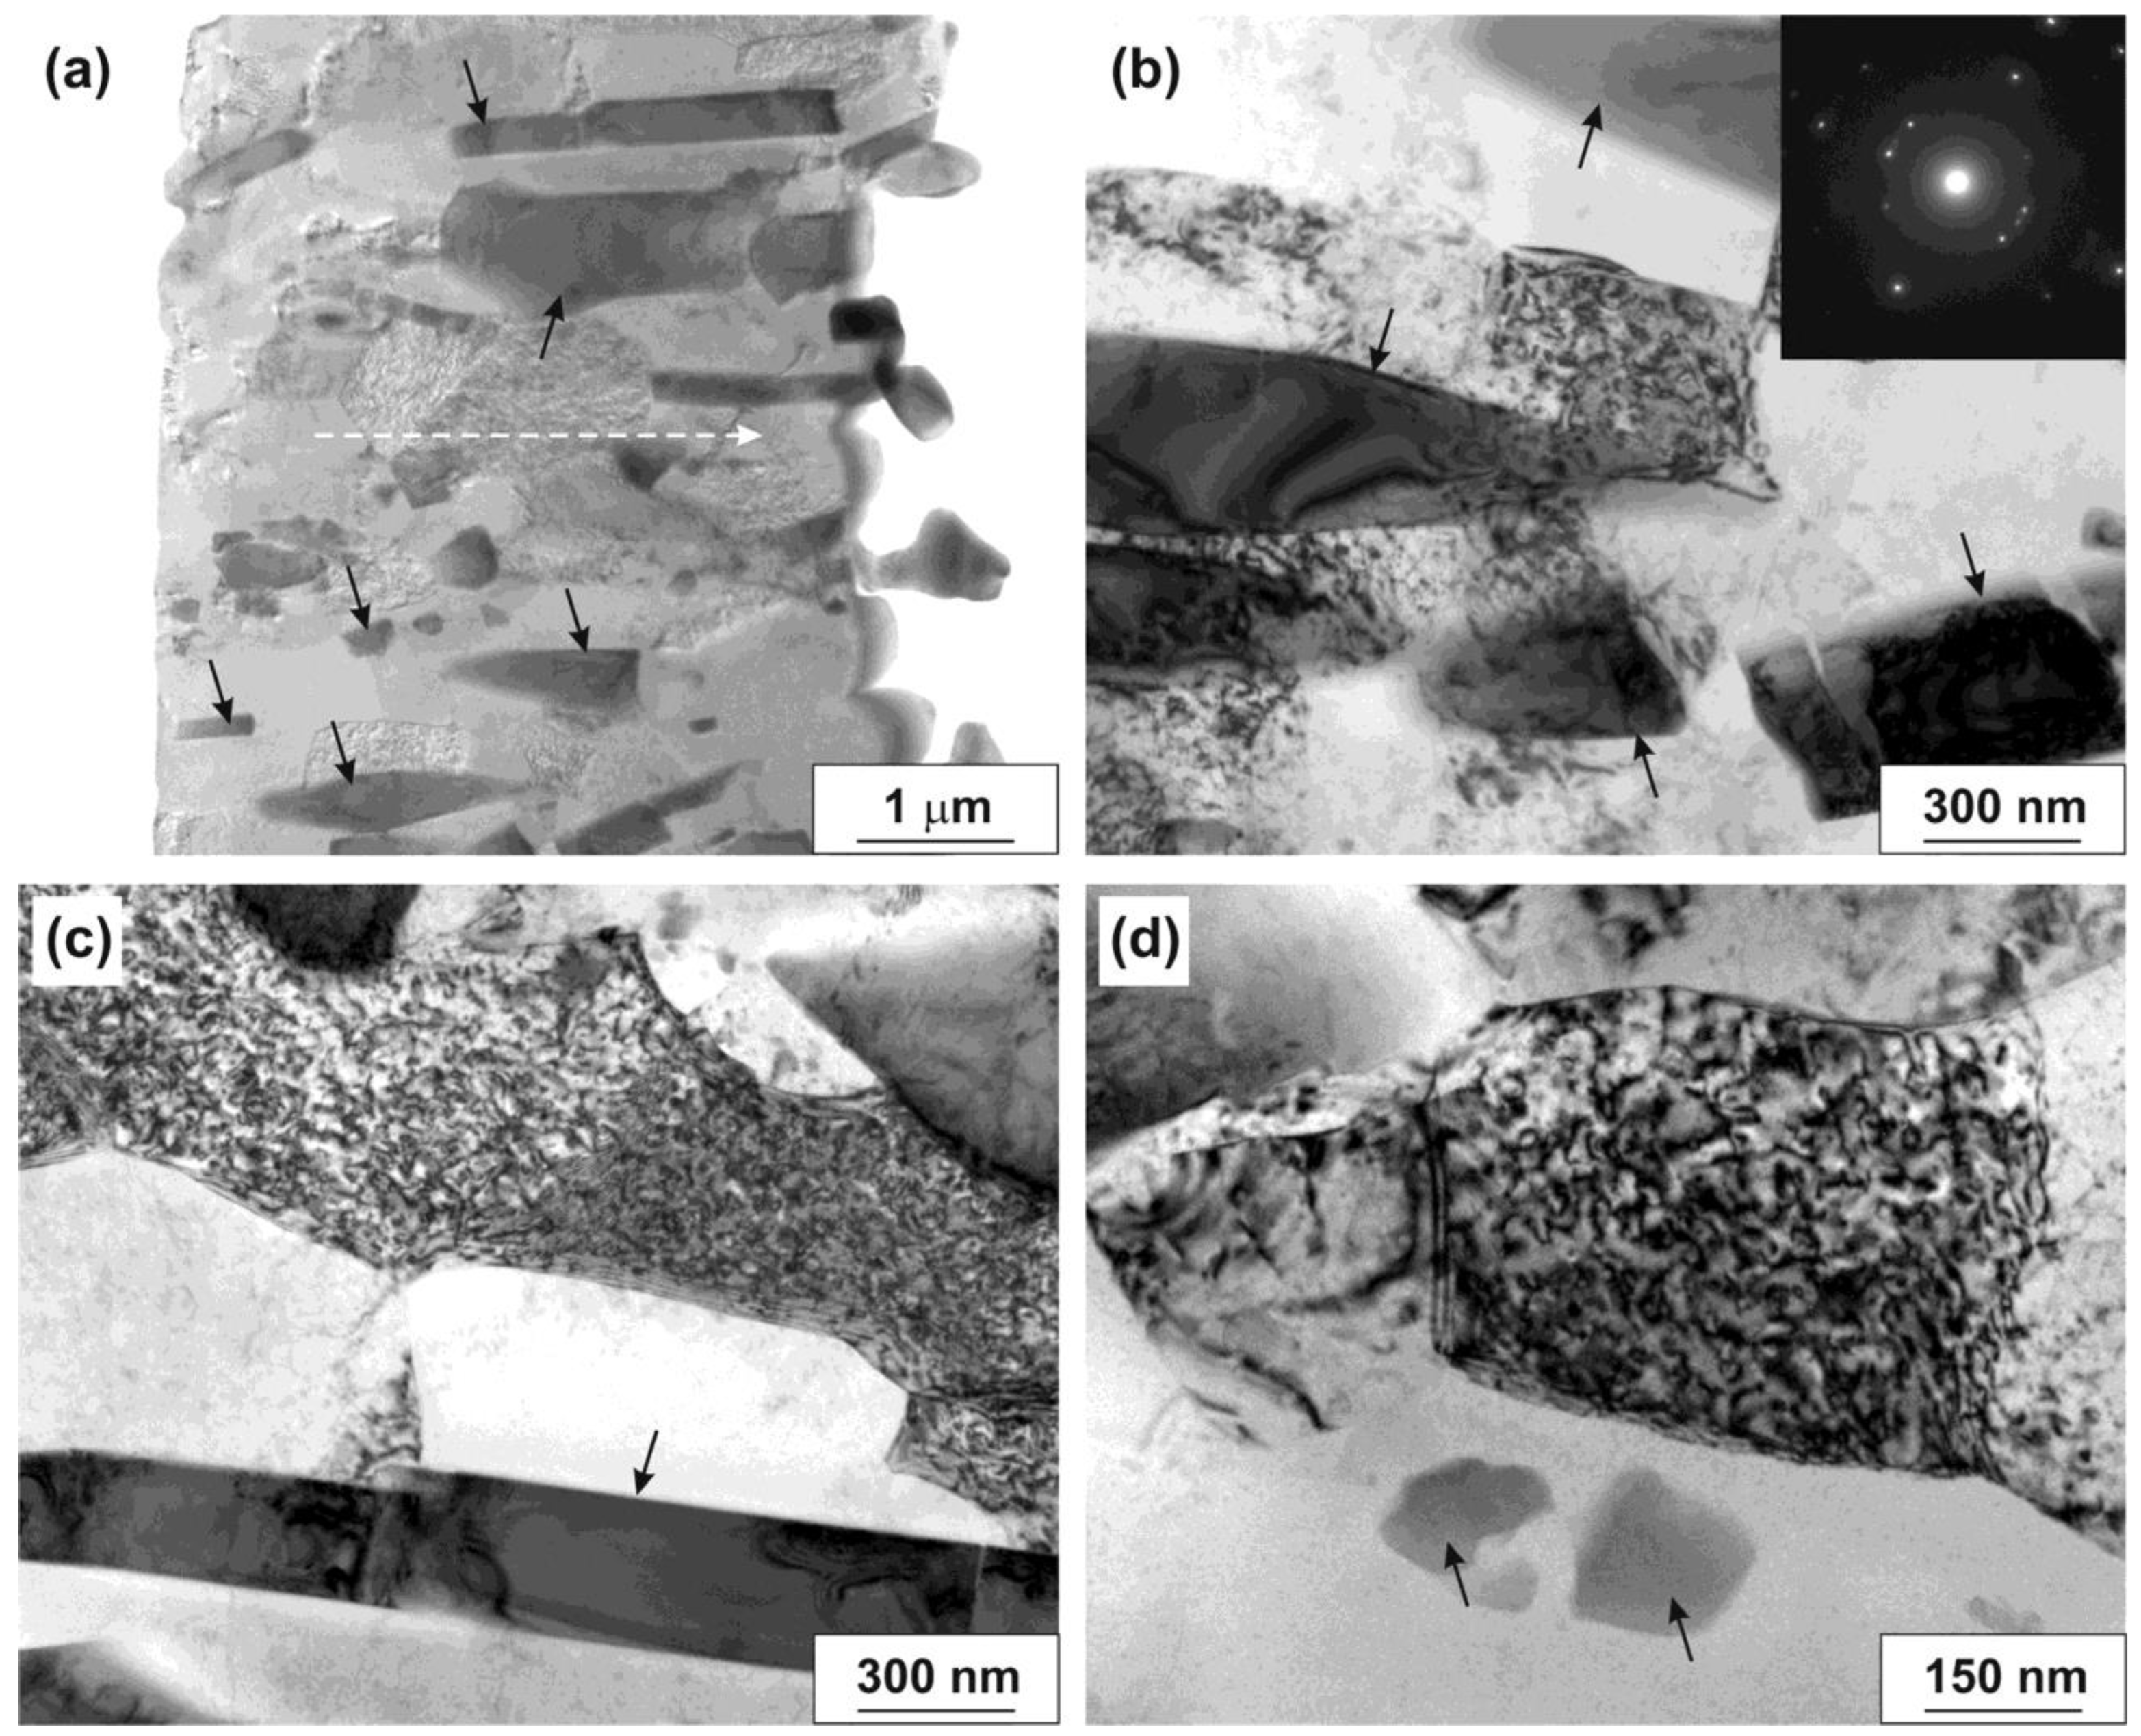
According to TEM data, rotary forging of the composite sample to a diameter of 2.5 mm led to the accumulation of a high density of dislocations in the copper shell and the formation of a developed dislocation structure (Figure 5a). Dislocations form mainly low-angle boundaries, which can be seen from the azimuthal blur of reflections in the SAED patterns. The structure also contains a few submicron crystallites with a shape close to equiaxed (Figure 5b). The SAED patterns have both an intermediate type, from single-crystal to polycrystalline (Figure 5a), and ring-shaped type (Figure 5b), which indicates a refined structure. No orientation of the structure relative to the direction of forging is observed. Predominantly ultrafine grain/subgrain structure with a predominant crystallite size of 0.5–0.8 µm was formed in the aluminum rod (Figure 6a). At the same time, crystallites larger than 1 µm are present. In addition, the Al11La3 eutectic particles are oriented along the forging direction and are partially crushed (Figure 6a). Thus, both non-crushed particles about 1–1.5 μm in size (Figure 6b,c) and smaller particles 50–200 nm in size (Figure 6d) are preserved in the structure.
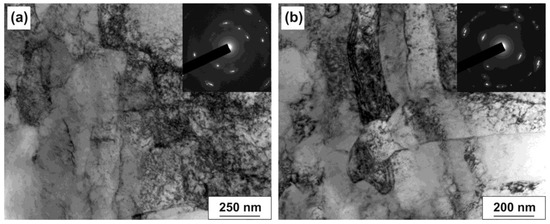
Figure 5.
(a,b) Bright-field TEM images of the microstructure of the copper shell of the 2.5-mm diameter composite sample (e = 4.16).
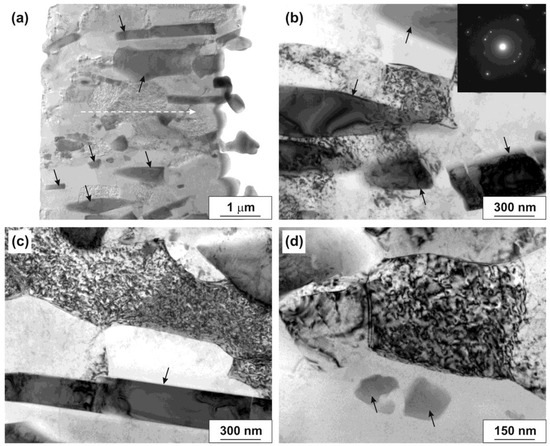
Figure 6.
(a) General view of the lamella and (b–d) bright-field TEM images of the microstructure of the aluminum rod of the 2.5-mm diameter composite sample (e = 4.16). The white dotted arrow indicates the direction of forging, and the black arrows indicate the Al11La3 particles.
3.2. Mechanical Properties
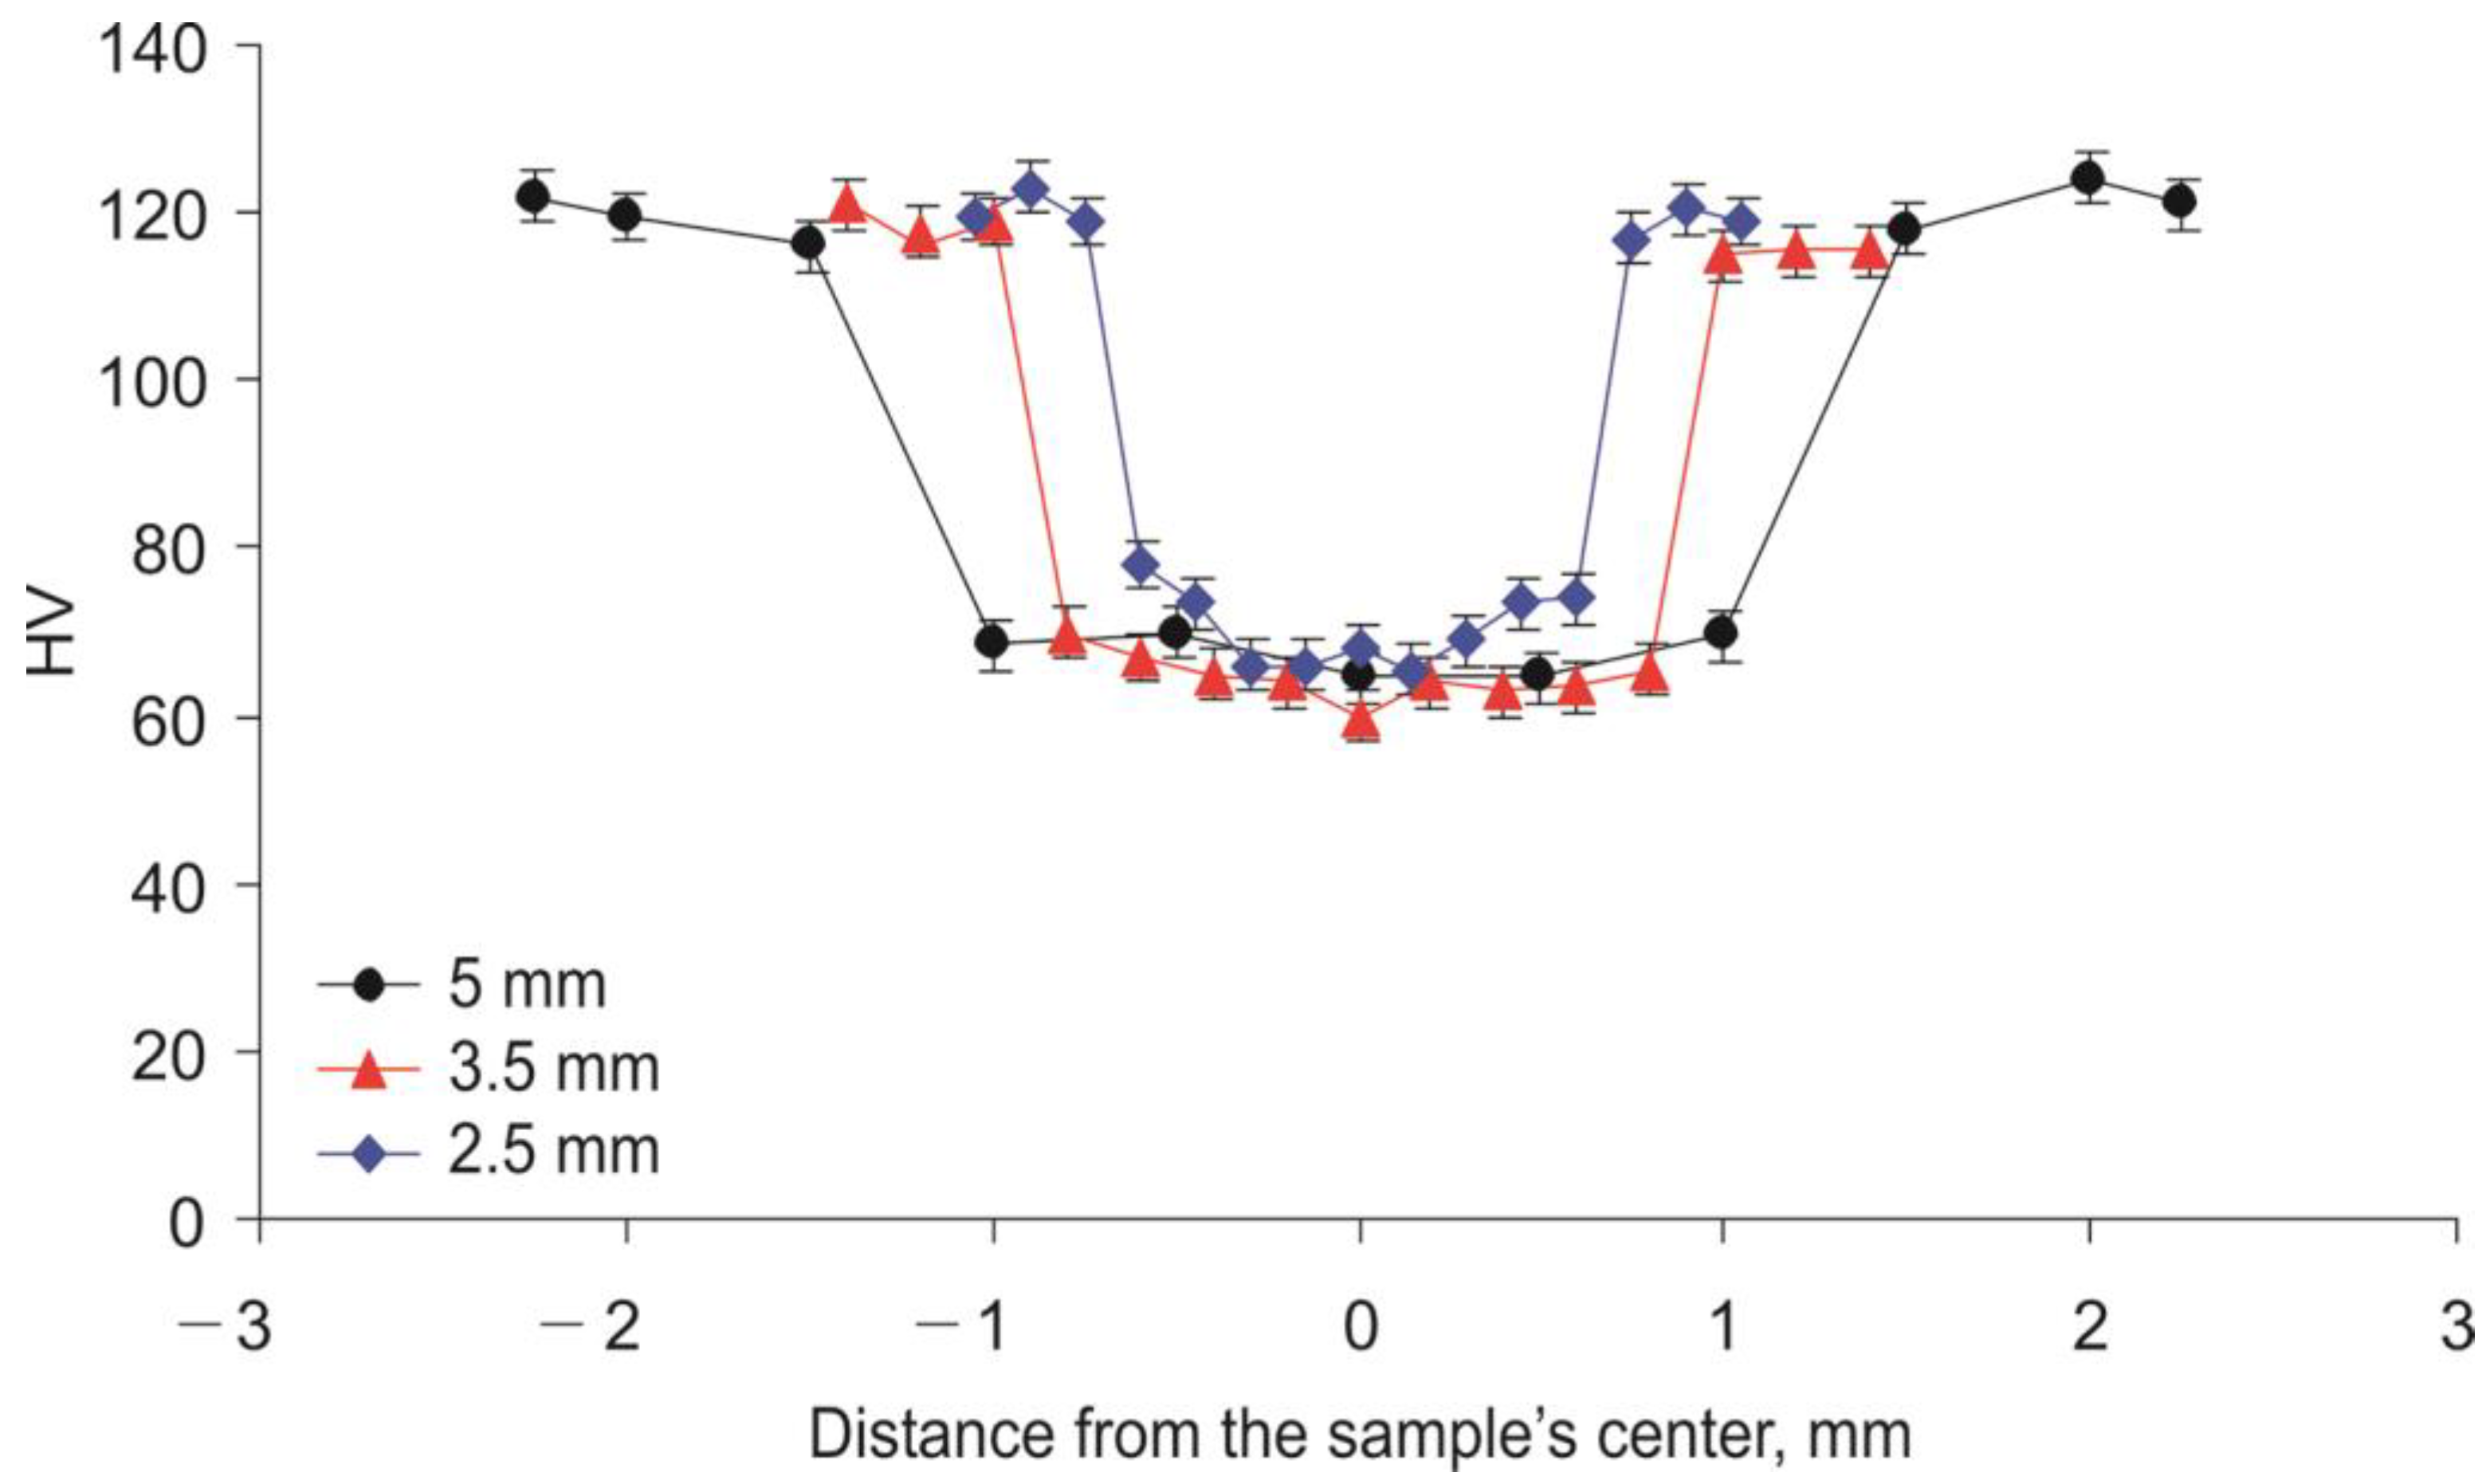
Rotary forging led to a hardening of the composite billet’s components, which is expressed in an increase in microhardness (Figure 7). This is due to the accumulation of dislocations in the copper shell and the refinement of the structure in the aluminum rod. In this case, the hardening of the copper shell is more pronounced than that of the aluminum rod. So, with a decrease in the billet’s diameter from 20 to 5 mm, the microhardness of the copper shell increases from 63 ± 1 HV to 120 ± 3 HV (1.9 times), and the microhardness of the aluminum rod increases from 49 ± 1 HV to 67 ± 4 HV (1.4 times). With a further decrease in the billet’s diameter to 3.5 and 2.5 mm, the microhardness of both the copper shell and the aluminum rod does not noticeably change. Thus, the microhardness in the composite sample’s cross section is unevenly distributed, namely it is maximal at the composite sample’s surface (in the area of the copper shell) and minimum at the composite sample’s center (in the area of the aluminum rod). The microhardness of the composite sample is the same after forging with and without intermediate annealing. The achieved level of copper hardening is typical for rotary forging processed composite samples with the same degree of strain, regardless of the design of the composite sample [5,6]. At the same time, the type of structure formed in copper differed for composite samples with different designs: from cellular in [5] to subgrained in this work. A developed grain structure was not formed in any of the cases. The close level of hardening of copper with different structures can be explained by a comparable density of dislocations, which has the main effect on hardening.
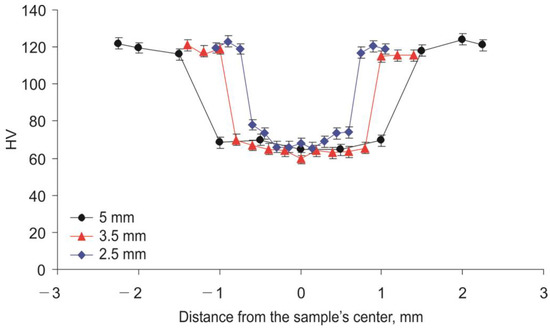
Figure 7.
Microhardness value distribution in the cross section of the composite samples with different diameters.
In addition, the composite samples after rotary forging have a higher tensile strength compared to the strength of the original components (Table 1). Thus, the yield strength and ultimate tensile strength of annealed copper were 122 and 238 MPa, and the relative elongation was 28% [5]. The yield strength and ultimate tensile strength of the as-cast Al-10% La alloy were 113 and 173 MPa, and the relative elongation was 22% [12]. The yield strength and ultimate tensile strength of the composite samples after rotary forging to a diameter of 5 mm were 278–280 MPa and 284–285 MPa, respectively, with a relative elongation of 5–8%. It can be seen that the yield strength of the composite sample is 2.3 times higher than the yield strength of copper and 2.5 times higher than the yield strength of the Al-10% La alloy before forging. At the same time, the relative elongation of the composite sample is several times lower than that of its components before forging.

Table 1.
Mechanical properties of the composite samples and their components.
With a decrease in the composite billet’s diameter to 3.5 mm (without intermediate annealing), a slight decrease in strength by 5–10% and a decrease in relative elongation to 3% are observed. On the contrary, the use of intermediate annealing during the rotary forging process at the transition from a billet’s diameter of 5 mm to 3.5 mm leads to a slight (by 5%) increase in strength at a constant level of relative elongation.
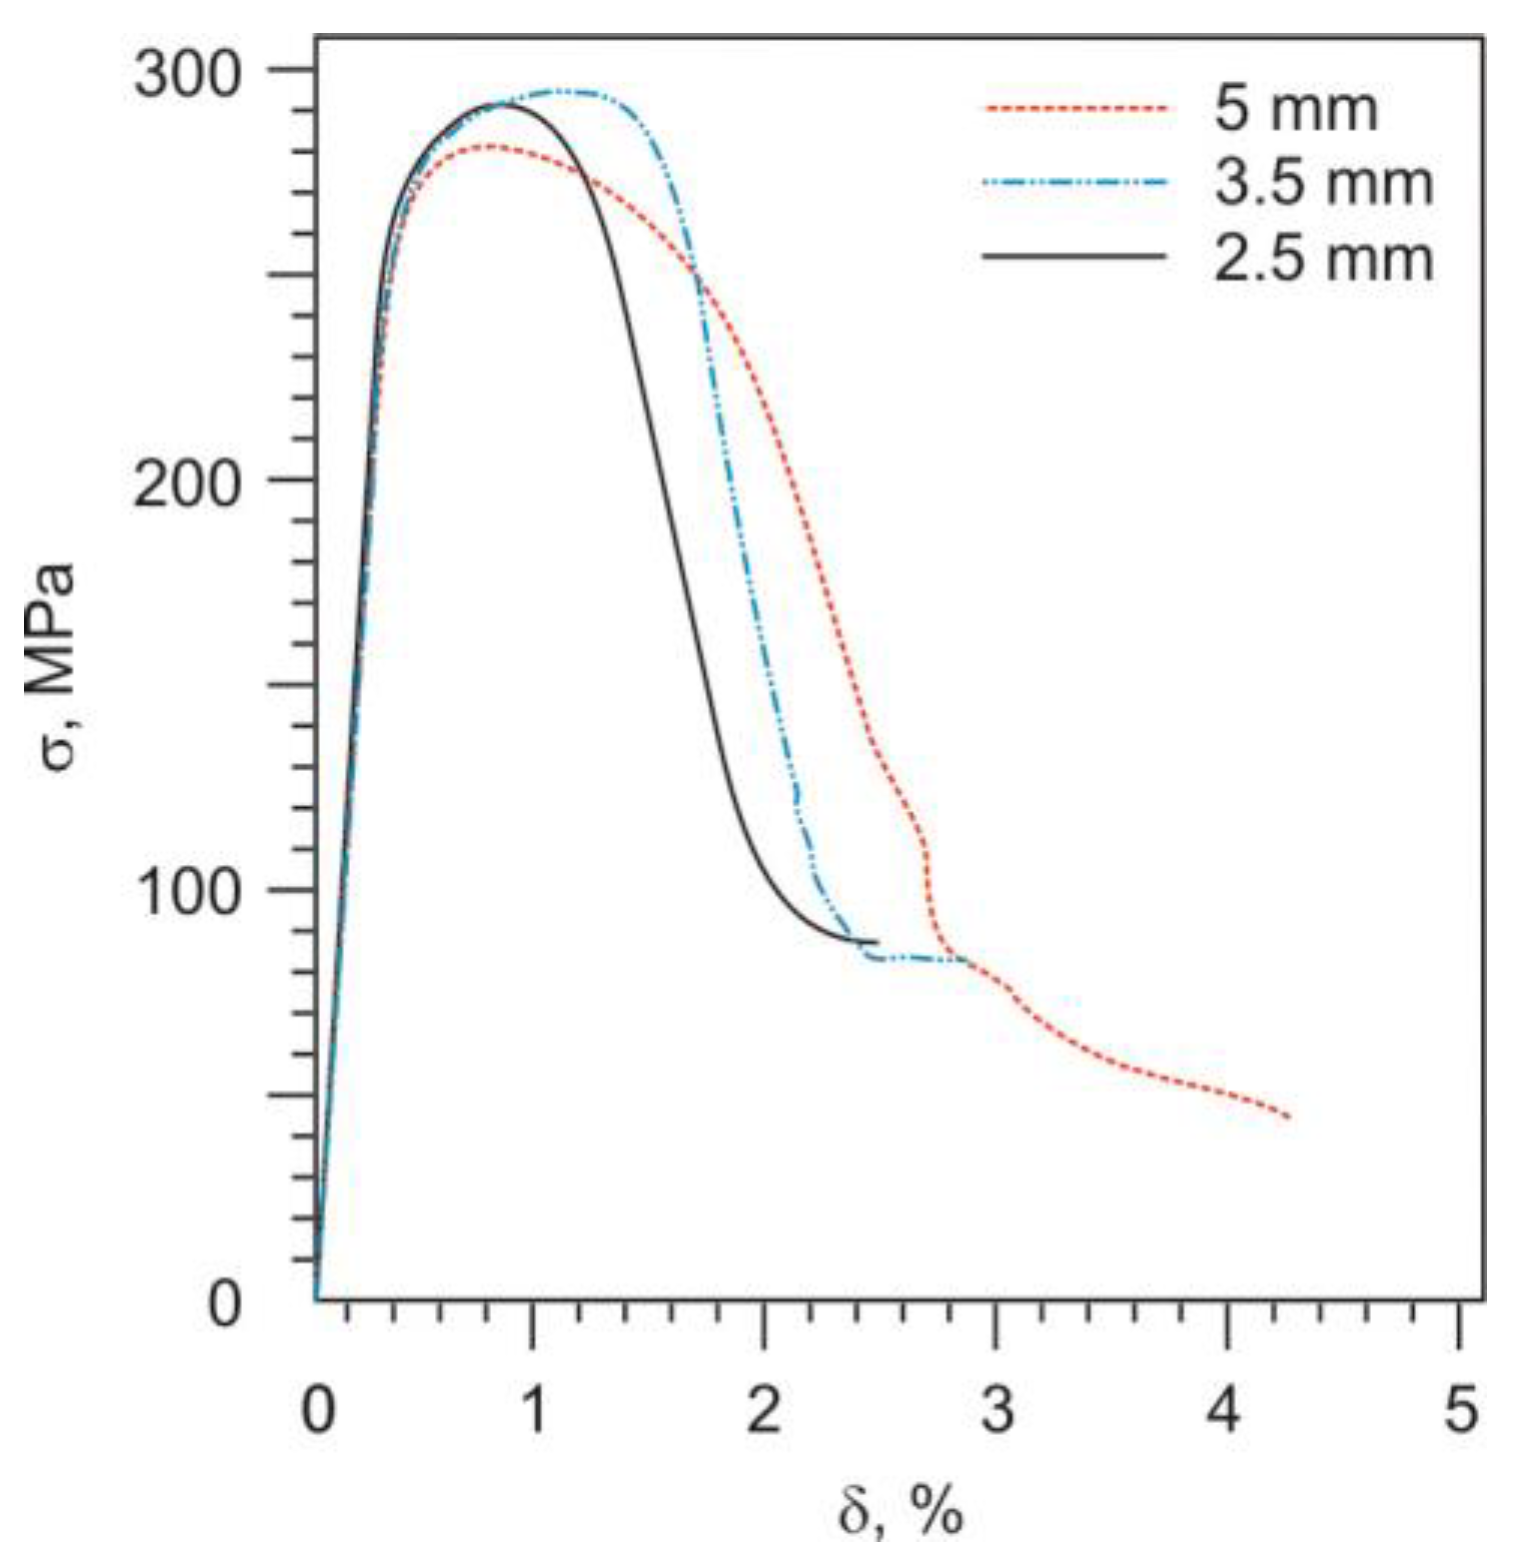
With a further decrease in the billet’s diameter to 2.5 mm (with intermediate annealing), the mechanical properties do not change statistically significantly: the yield strength and ultimate tensile strength were 285 MPa and 294 MPa, respectively, and the relative elongation remains at the level of 3%. The stress–strain curves for composite samples with different billet’s reduction ratio are shown in Figure 8.
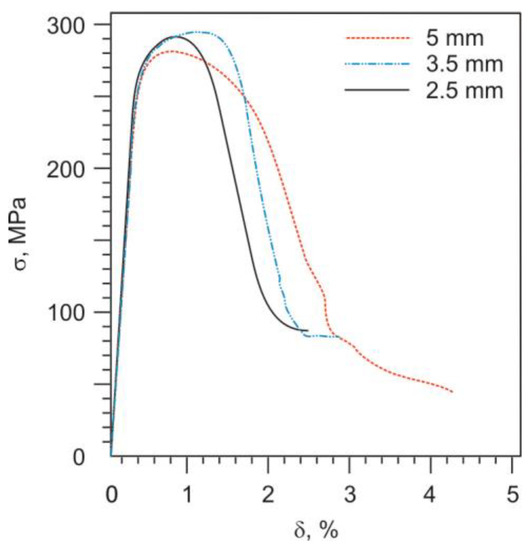
Figure 8.
Stress–strain curves for composite samples with different diameters.
The appearance of the composite sample after tensile test is shown in Figure 9. Since the composite consists of two components, its tensile deformation pattern is more complex compared to a solid material. Two necks formed at once—in a copper shell and in an aluminum rod, that is, inside the composite. The reduction of a more hardened copper shell during the tensile test was less than of a more ductile aluminum rod. The non-monotonic decrease in the load at the stress–strain curves is a consequence of the formation and development of these two necks.
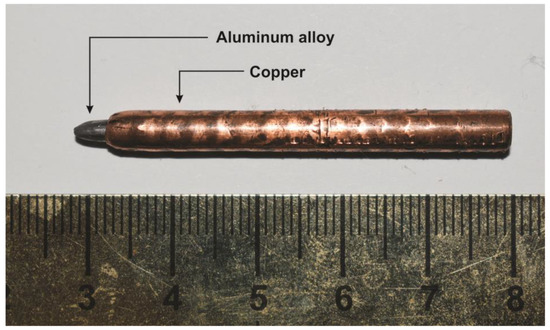
Figure 9.
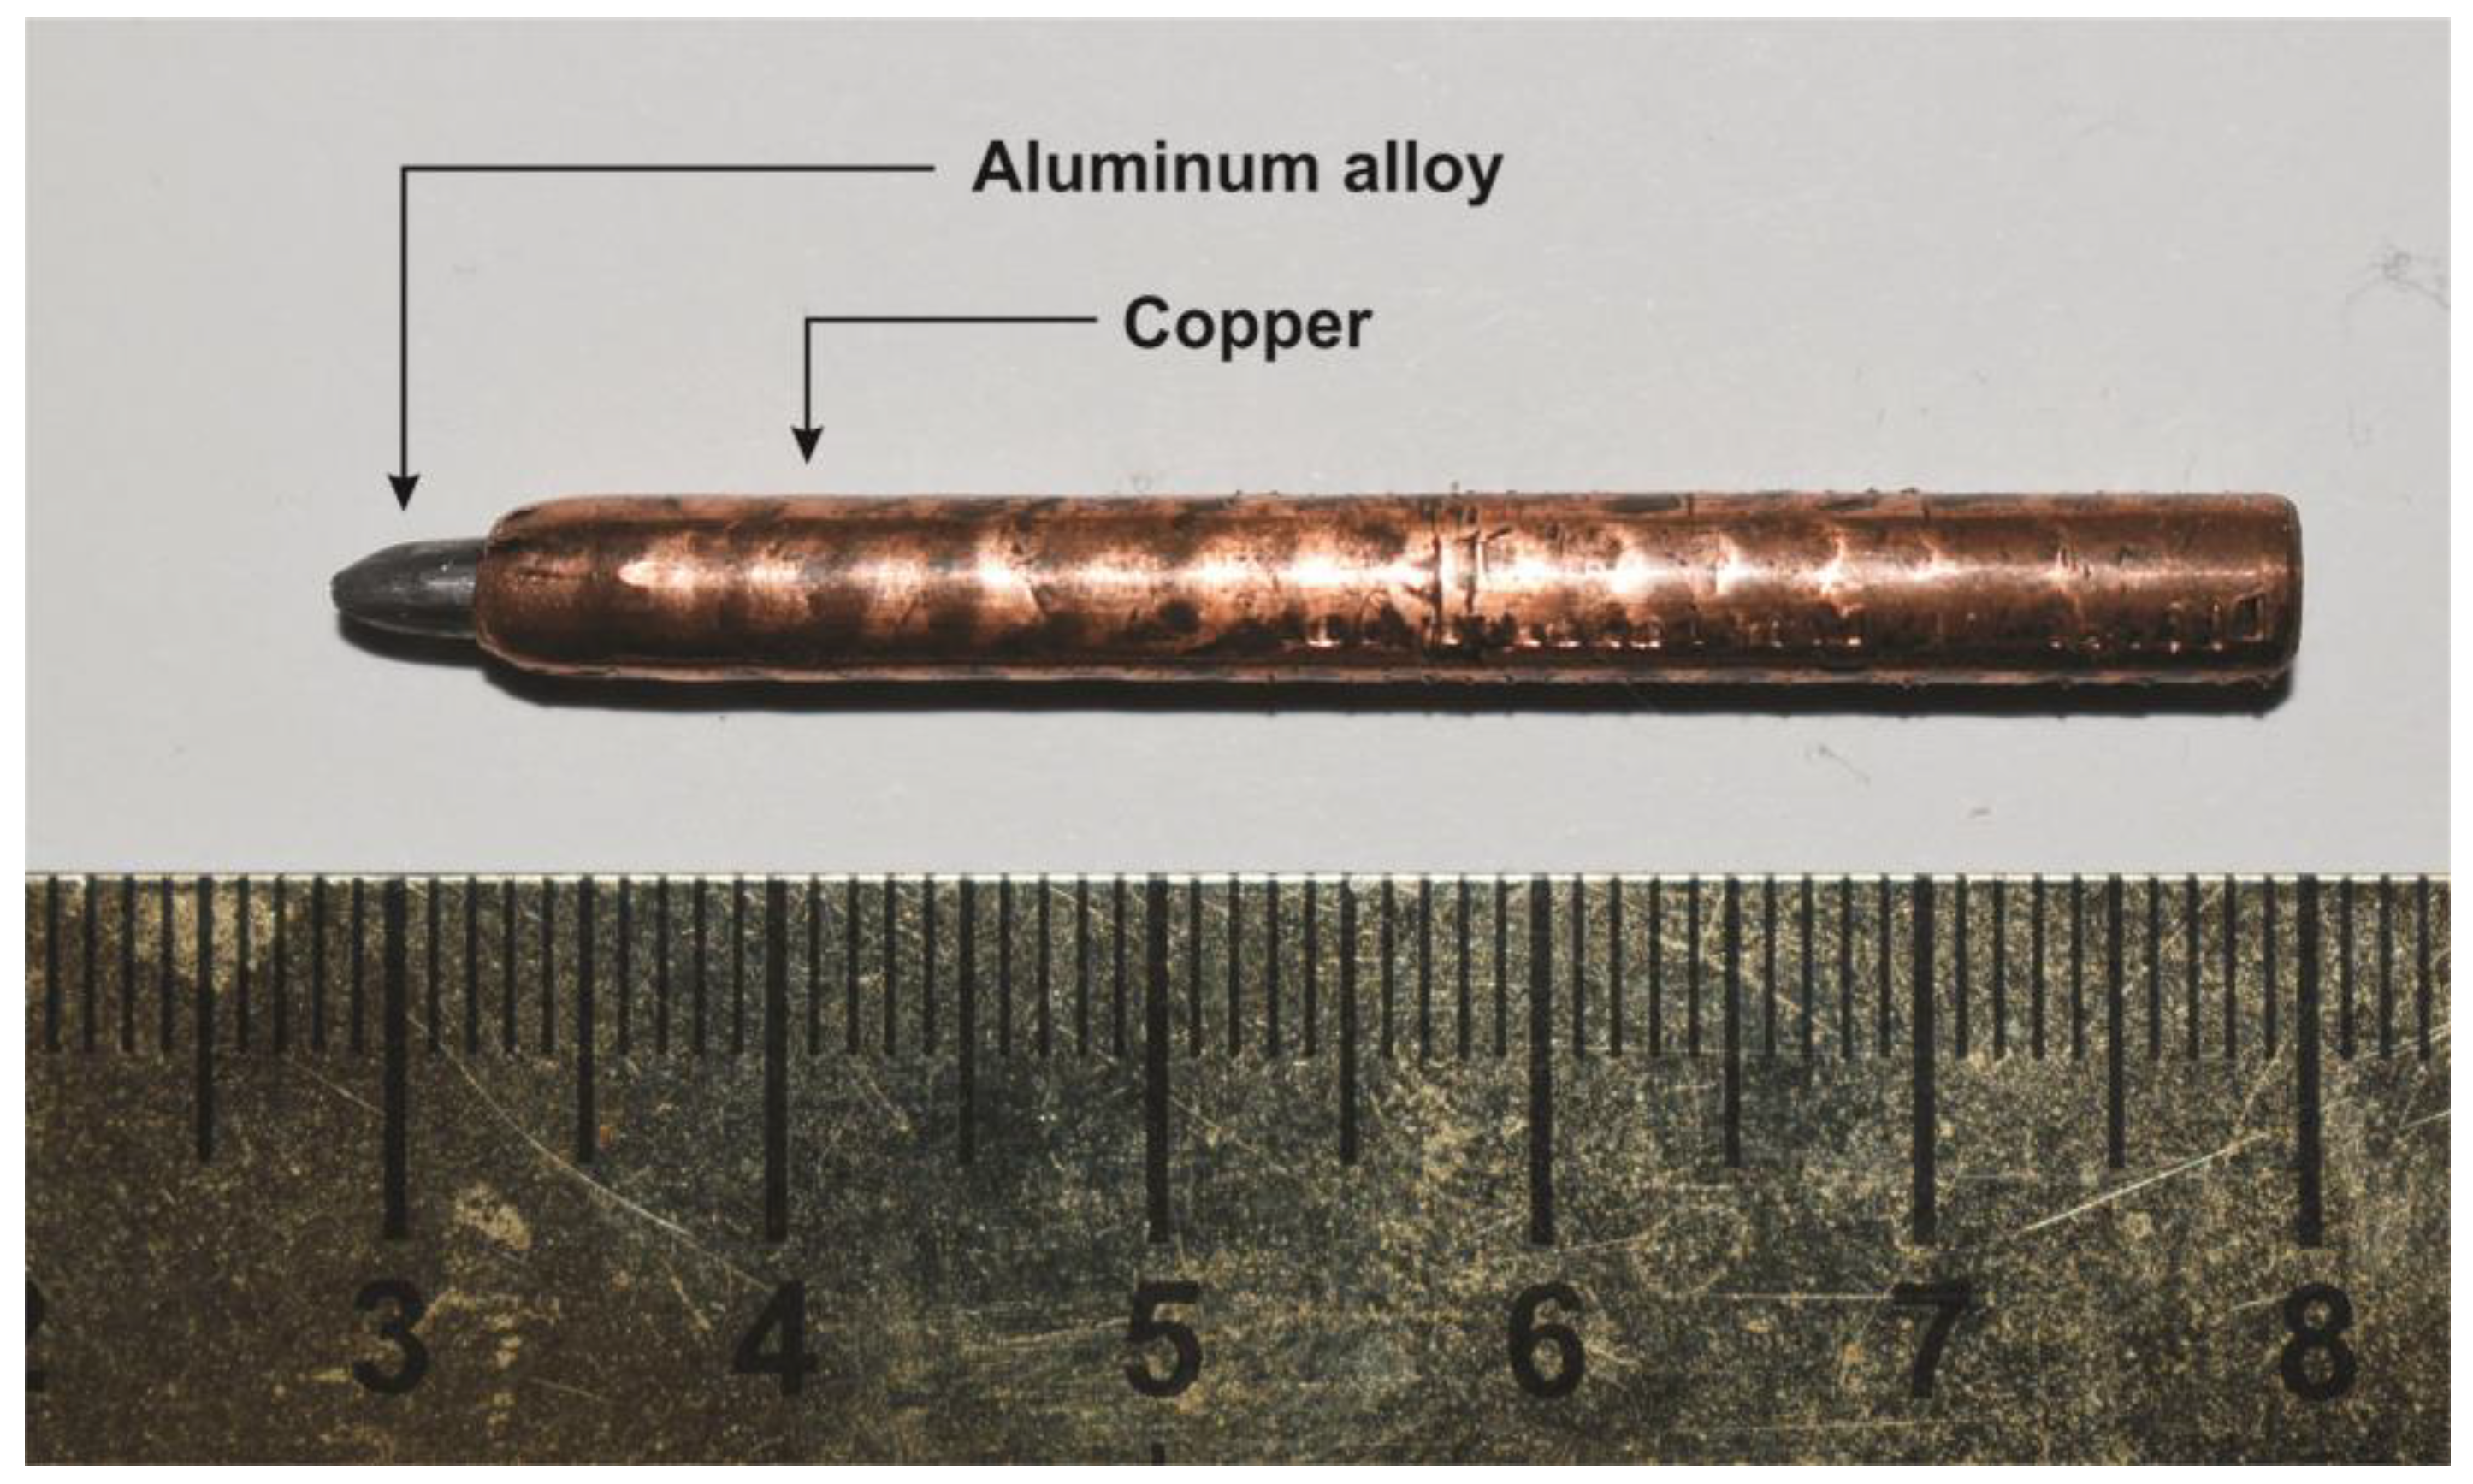
The appearance of the 5-mm diameter composite sample after tensile test.
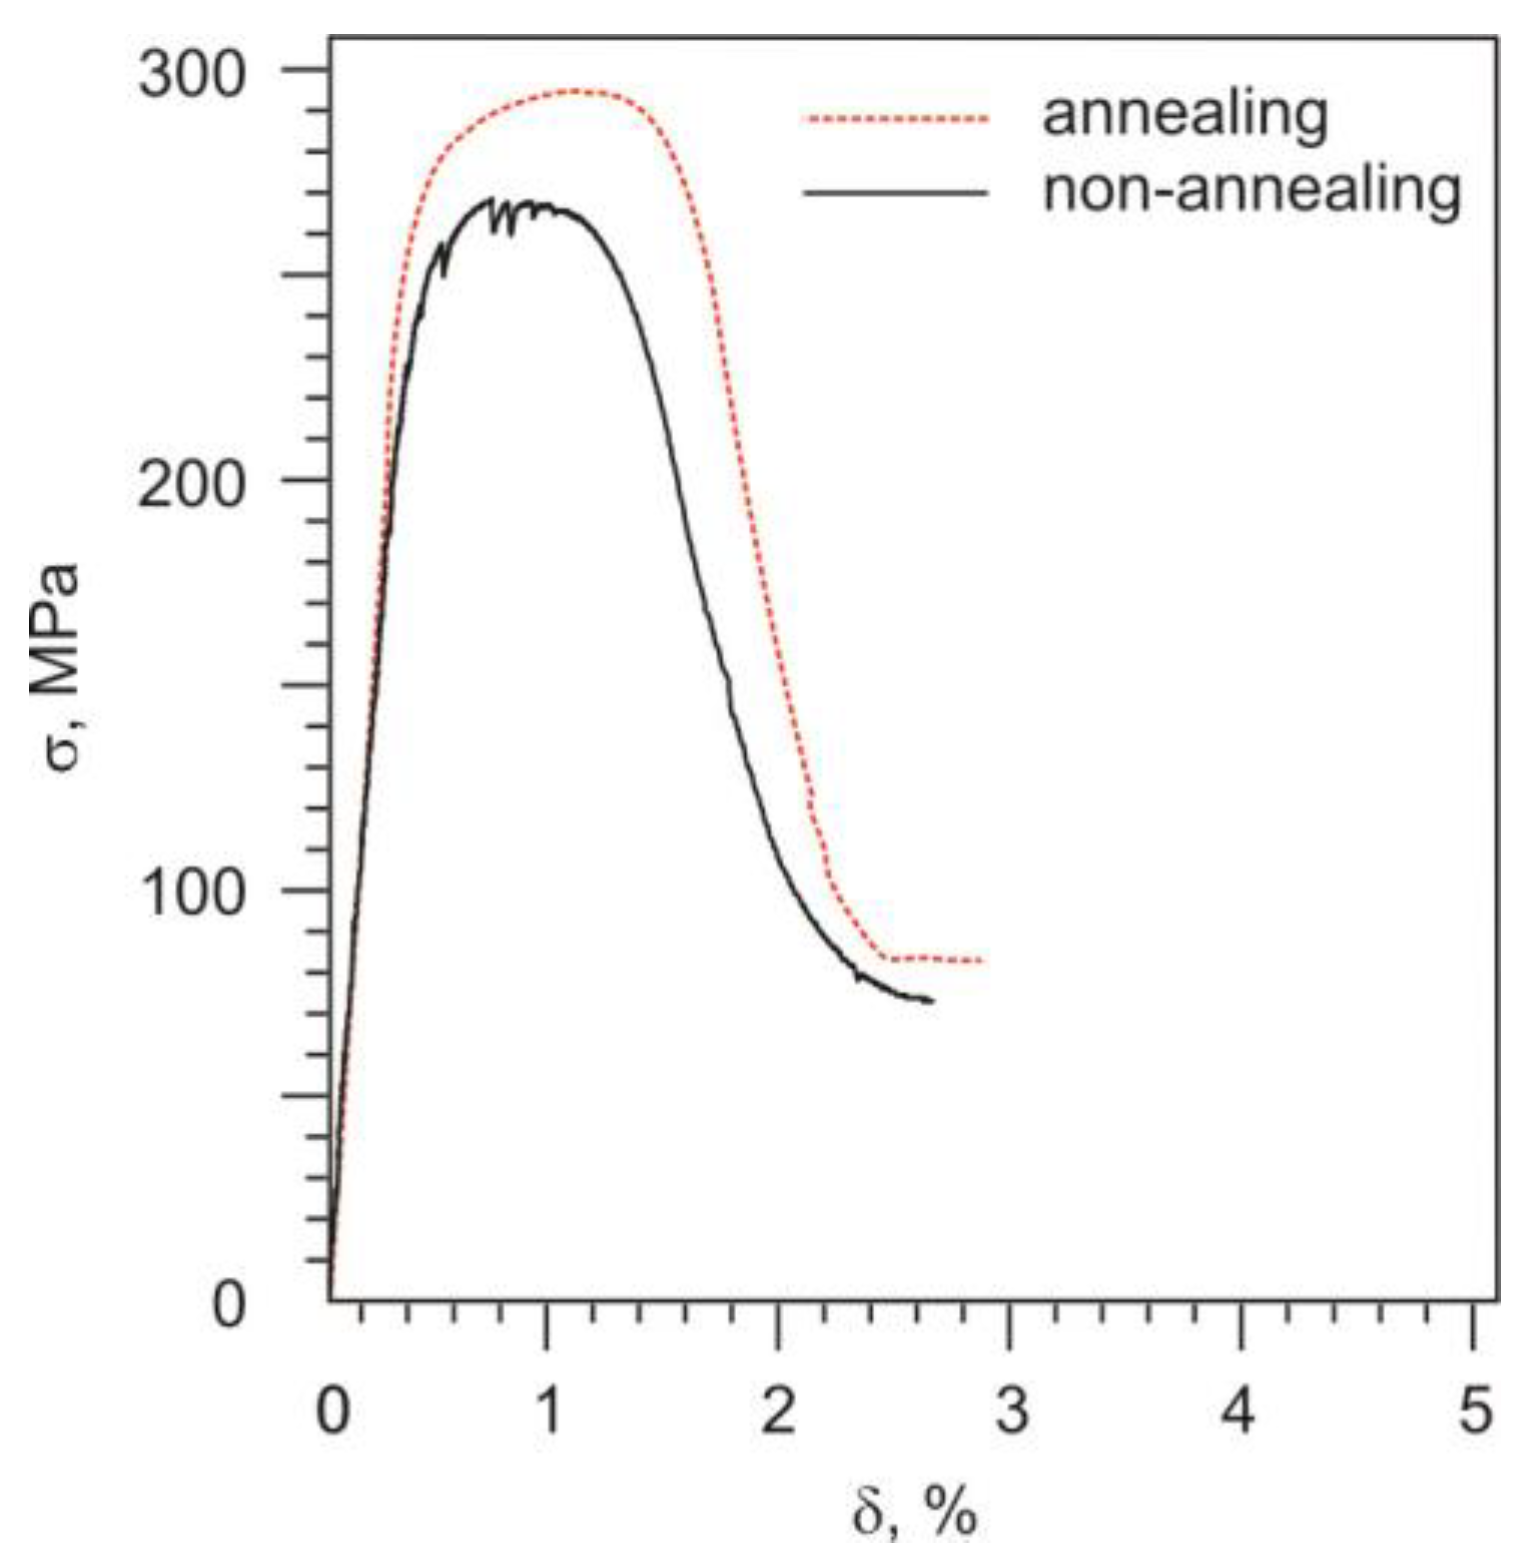
Figure 10 shows the stress–strain curves for 3.5-mm diameter composite samples with and without intermediate annealing during forging. It can be seen that the stage of uniform plastic deformation of the composite sample obtained by forging without intermediate annealing is characterized by a series of load drops, acquiring a sawtooth shape. This is the result of the formation of large cracks in the copper shell, observed visually on its surface. The formation of each crack leads to a decrease in the composite sample’s cross section on which the load acts, and, consequently, to a decrease in the flow stress. The stage of uniform deformation of the composite sample obtained by forging with intermediate annealing has a smooth appearance, and the maximum of the curve is located in the area of higher stresses.
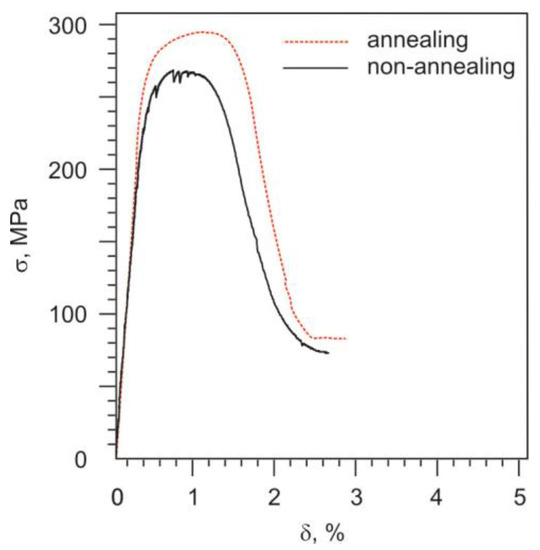
Figure 10.
Stress–strain curves for the 3.5-mm diameter composite sample without and with intermediate annealing during forging.
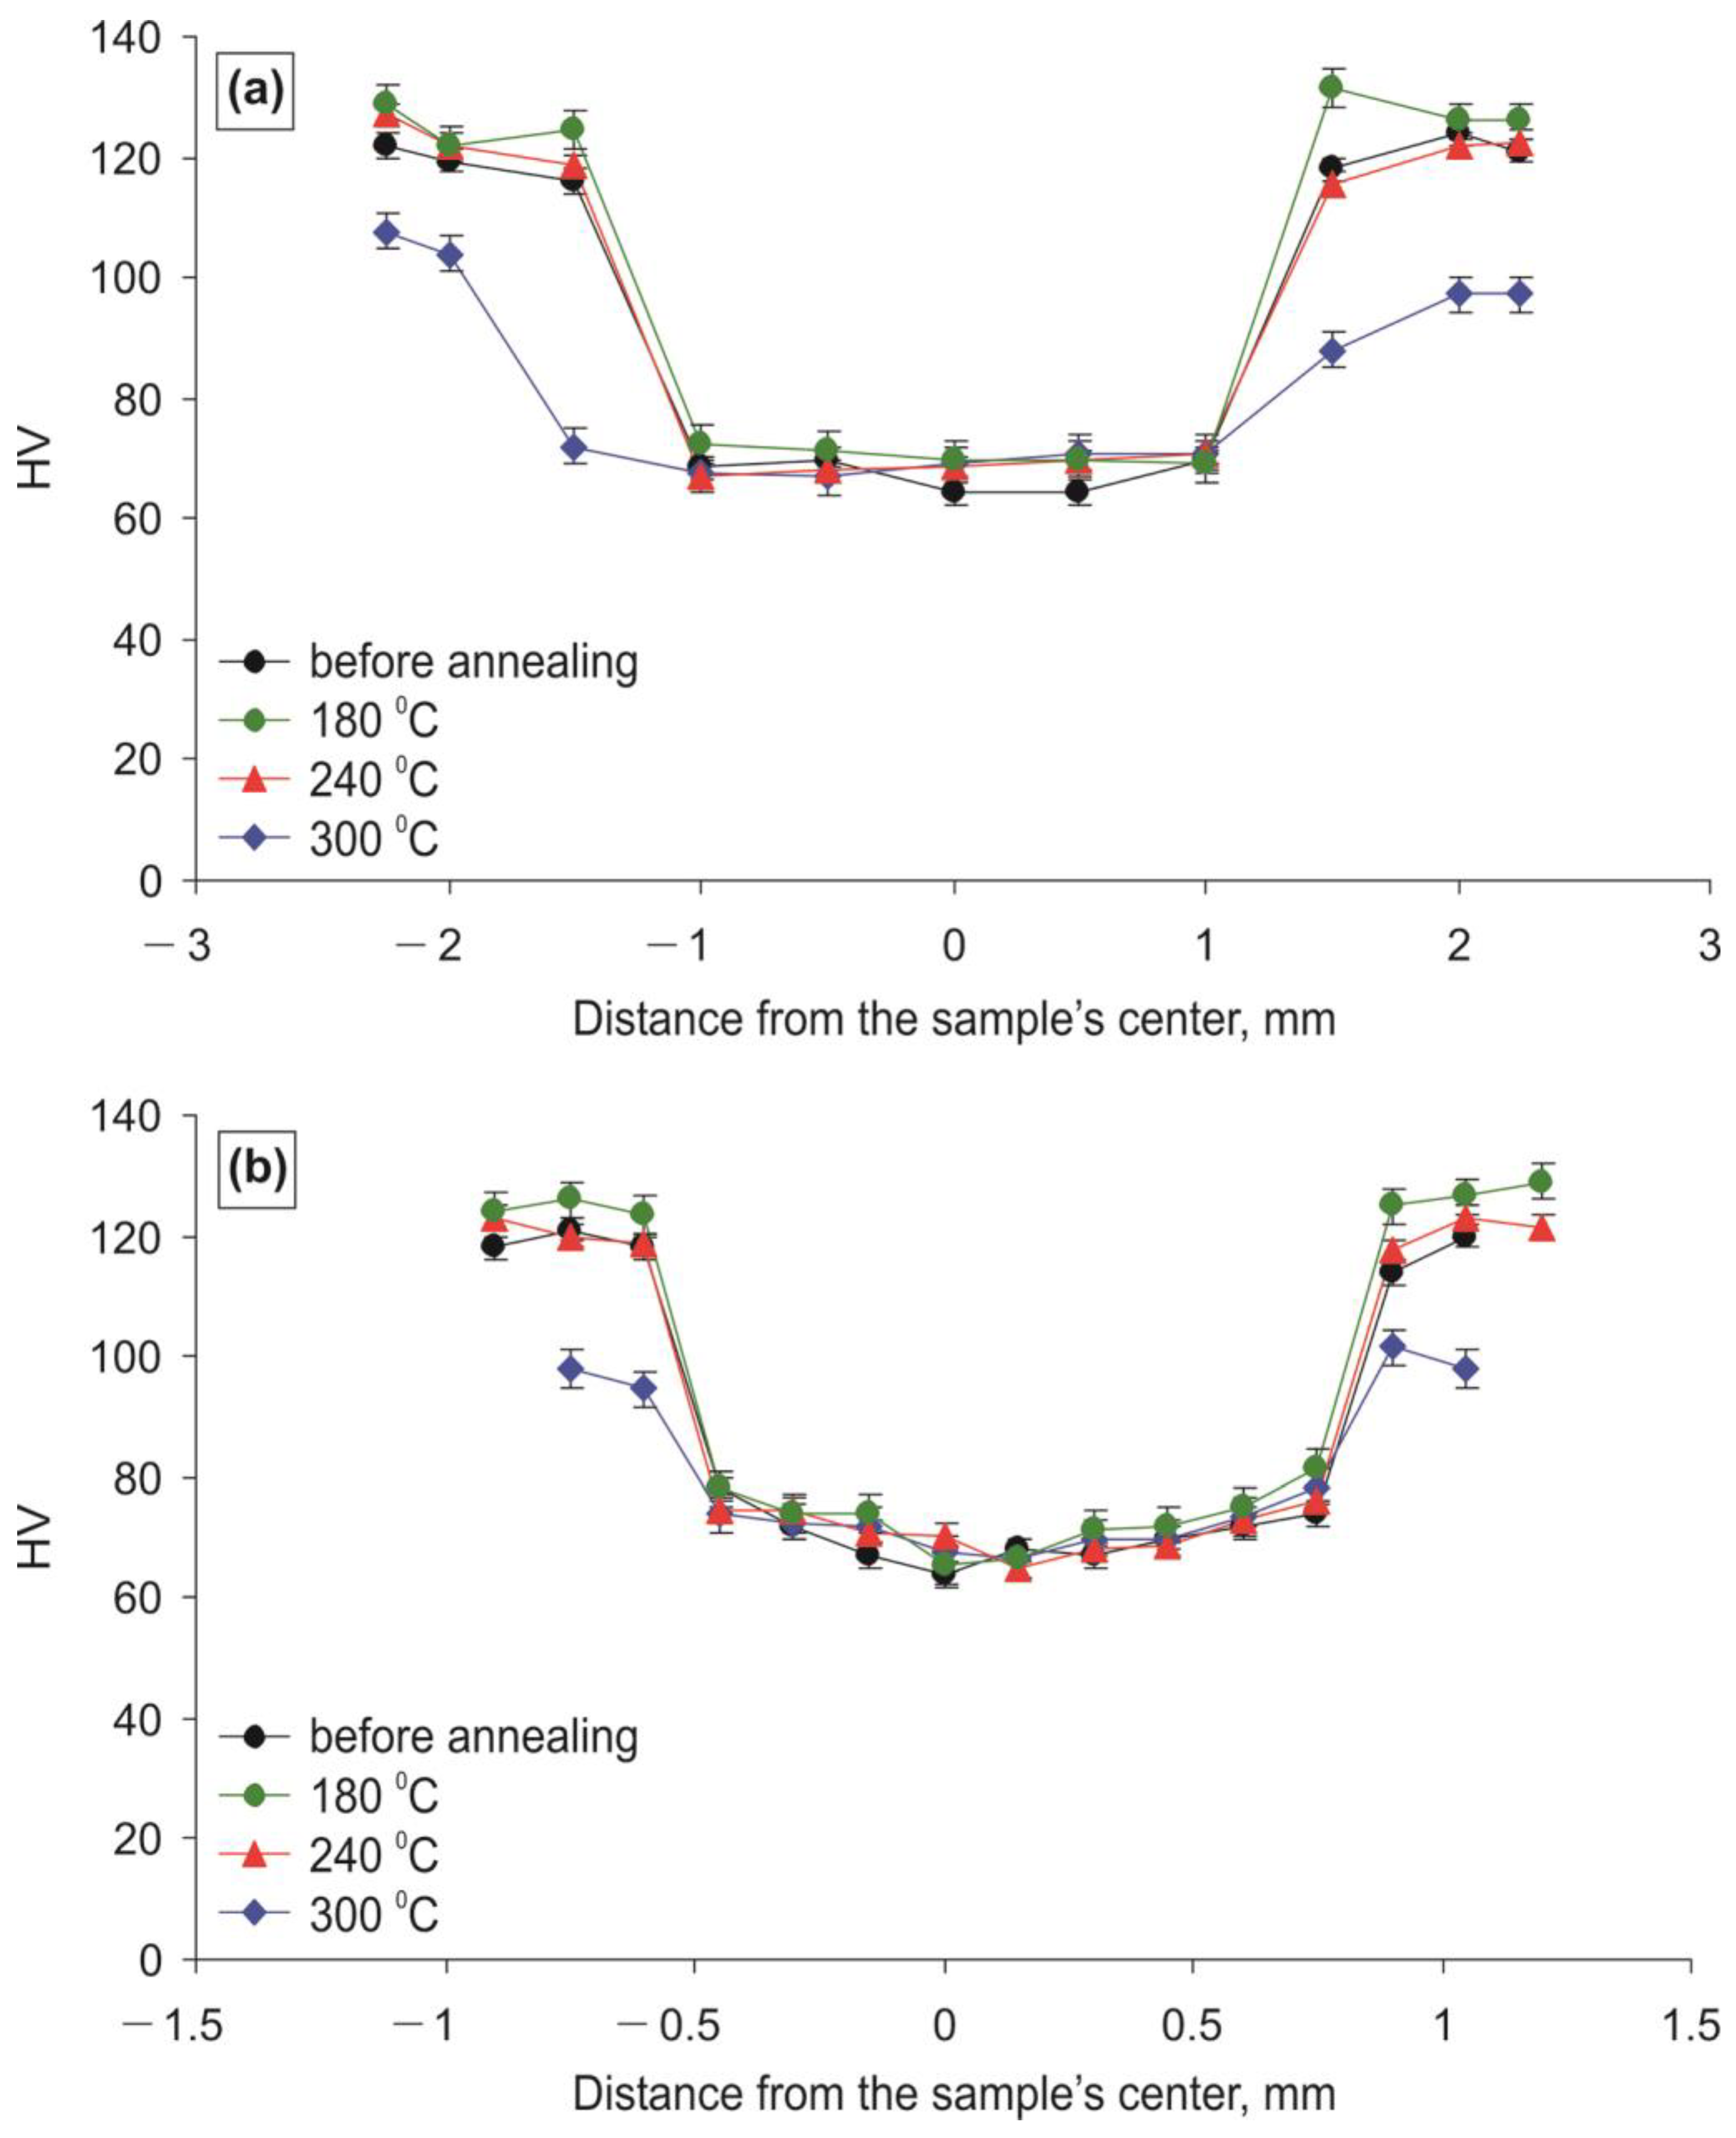
The effect of post-deformation annealing in the temperature range of 180–300 °C on the microhardness of the composite samples with different diameters, 5 and 2.5 mm, was studied. Figure 11 shows the dependences of the microhardness values in the cross section of the composite samples with a diameter of 5 mm and 2.5 mm on the annealing temperature. It can be seen that annealing in the temperature range of 180–300 °C of both composite samples does not lead to visible changes in the microhardness of the aluminum rod. At the same time, annealing at a temperature of 180 °C causes a slight increase in the microhardness of the copper shell to ~130 HV for both composite samples, and annealing at a temperature of 300 °C causes a sharp decrease in the microhardness of the copper shell to 100–110 HV for the 5-mm diameter composite sample and up to 80–100 HV for the 2.5-mm diameter composite sample.
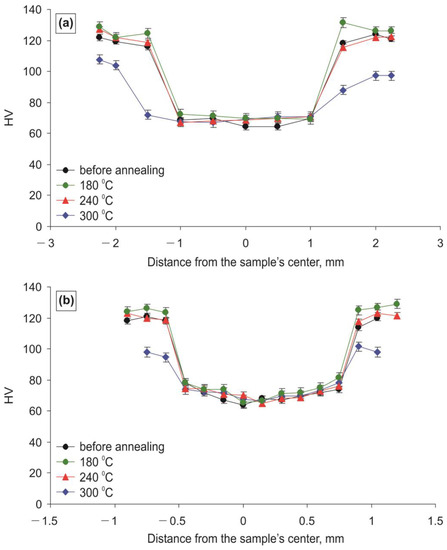
Figure 11.
Microhardness value distribution in the cross section of the composite sample with a diameter of (a) 5 mm (e = 2.77) and (b) 2.5 mm (e = 4.16), depending on the annealing temperature.
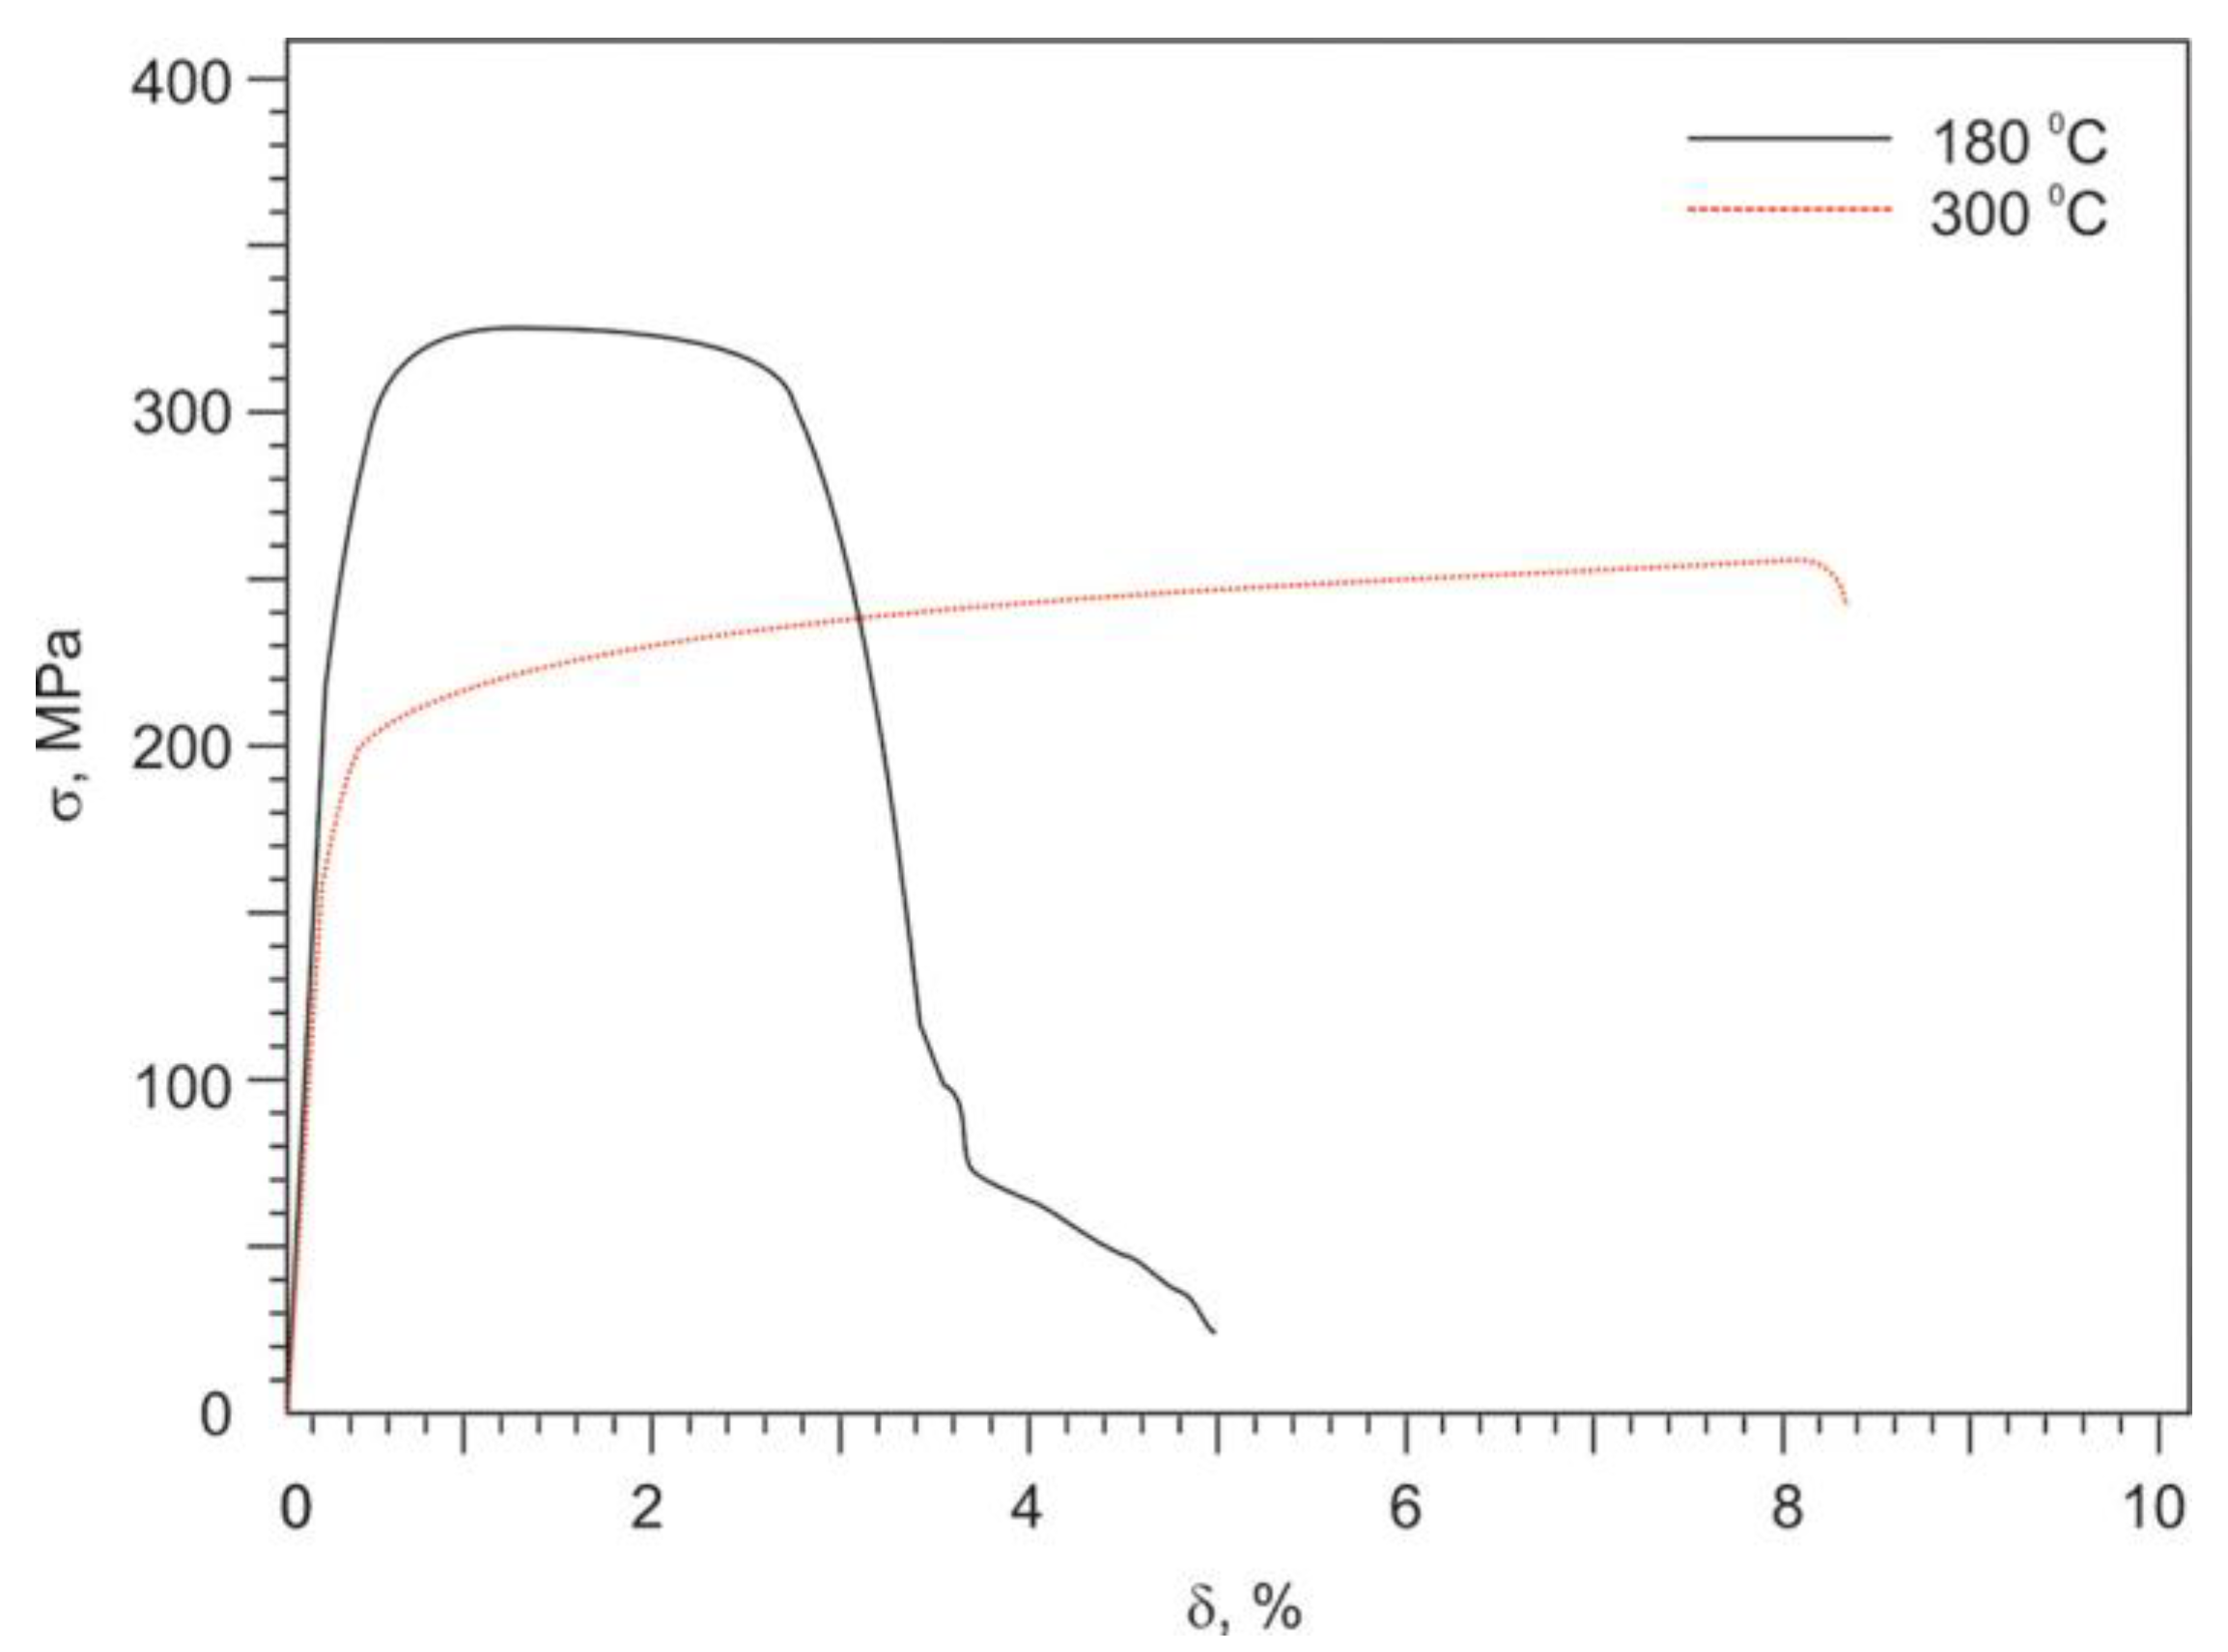
The change in tensile mechanical properties of the composite samples after annealing in the range of 180–300 °C correlates with the change in microhardness. Figure 12 shows the stress–strain curves for the 5-mm diameter composite samples after annealing at temperatures of 180 and 300 °C. The obtained values of the mechanical properties are presented in Table 1. It can be seen that annealing at 180 °C does not lead to a significant change in the strength properties of the 5-mm diameter composite sample. On the contrary, annealing at a temperature of 300 °C leads to a decrease in the yield strength (by 30% compared to the unannealed state) and ultimate tensile strength (by 15%), and to an increase in the elongation value up to 10%. Nevertheless, the yield strength of the composite samples after annealing at 300 °C is 1.6–1.7 times higher than the yield strength of the composite sample’s components in the original condition (before forging); and the ultimate tensile strength is comparable to the ultimate tensile strength of annealed copper, but 1.4 times higher than the ultimate tensile strength of the as-cast Al-10% La alloy.
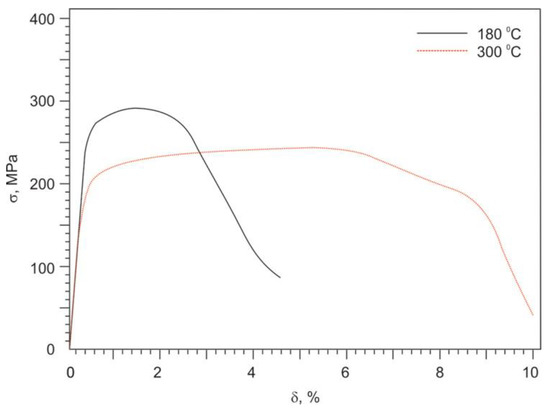
Figure 12.
Stress–strain curves for composite sample after rotary forging to a diameter of 5 mm (e = 2.77) and subsequent annealing at different temperatures.
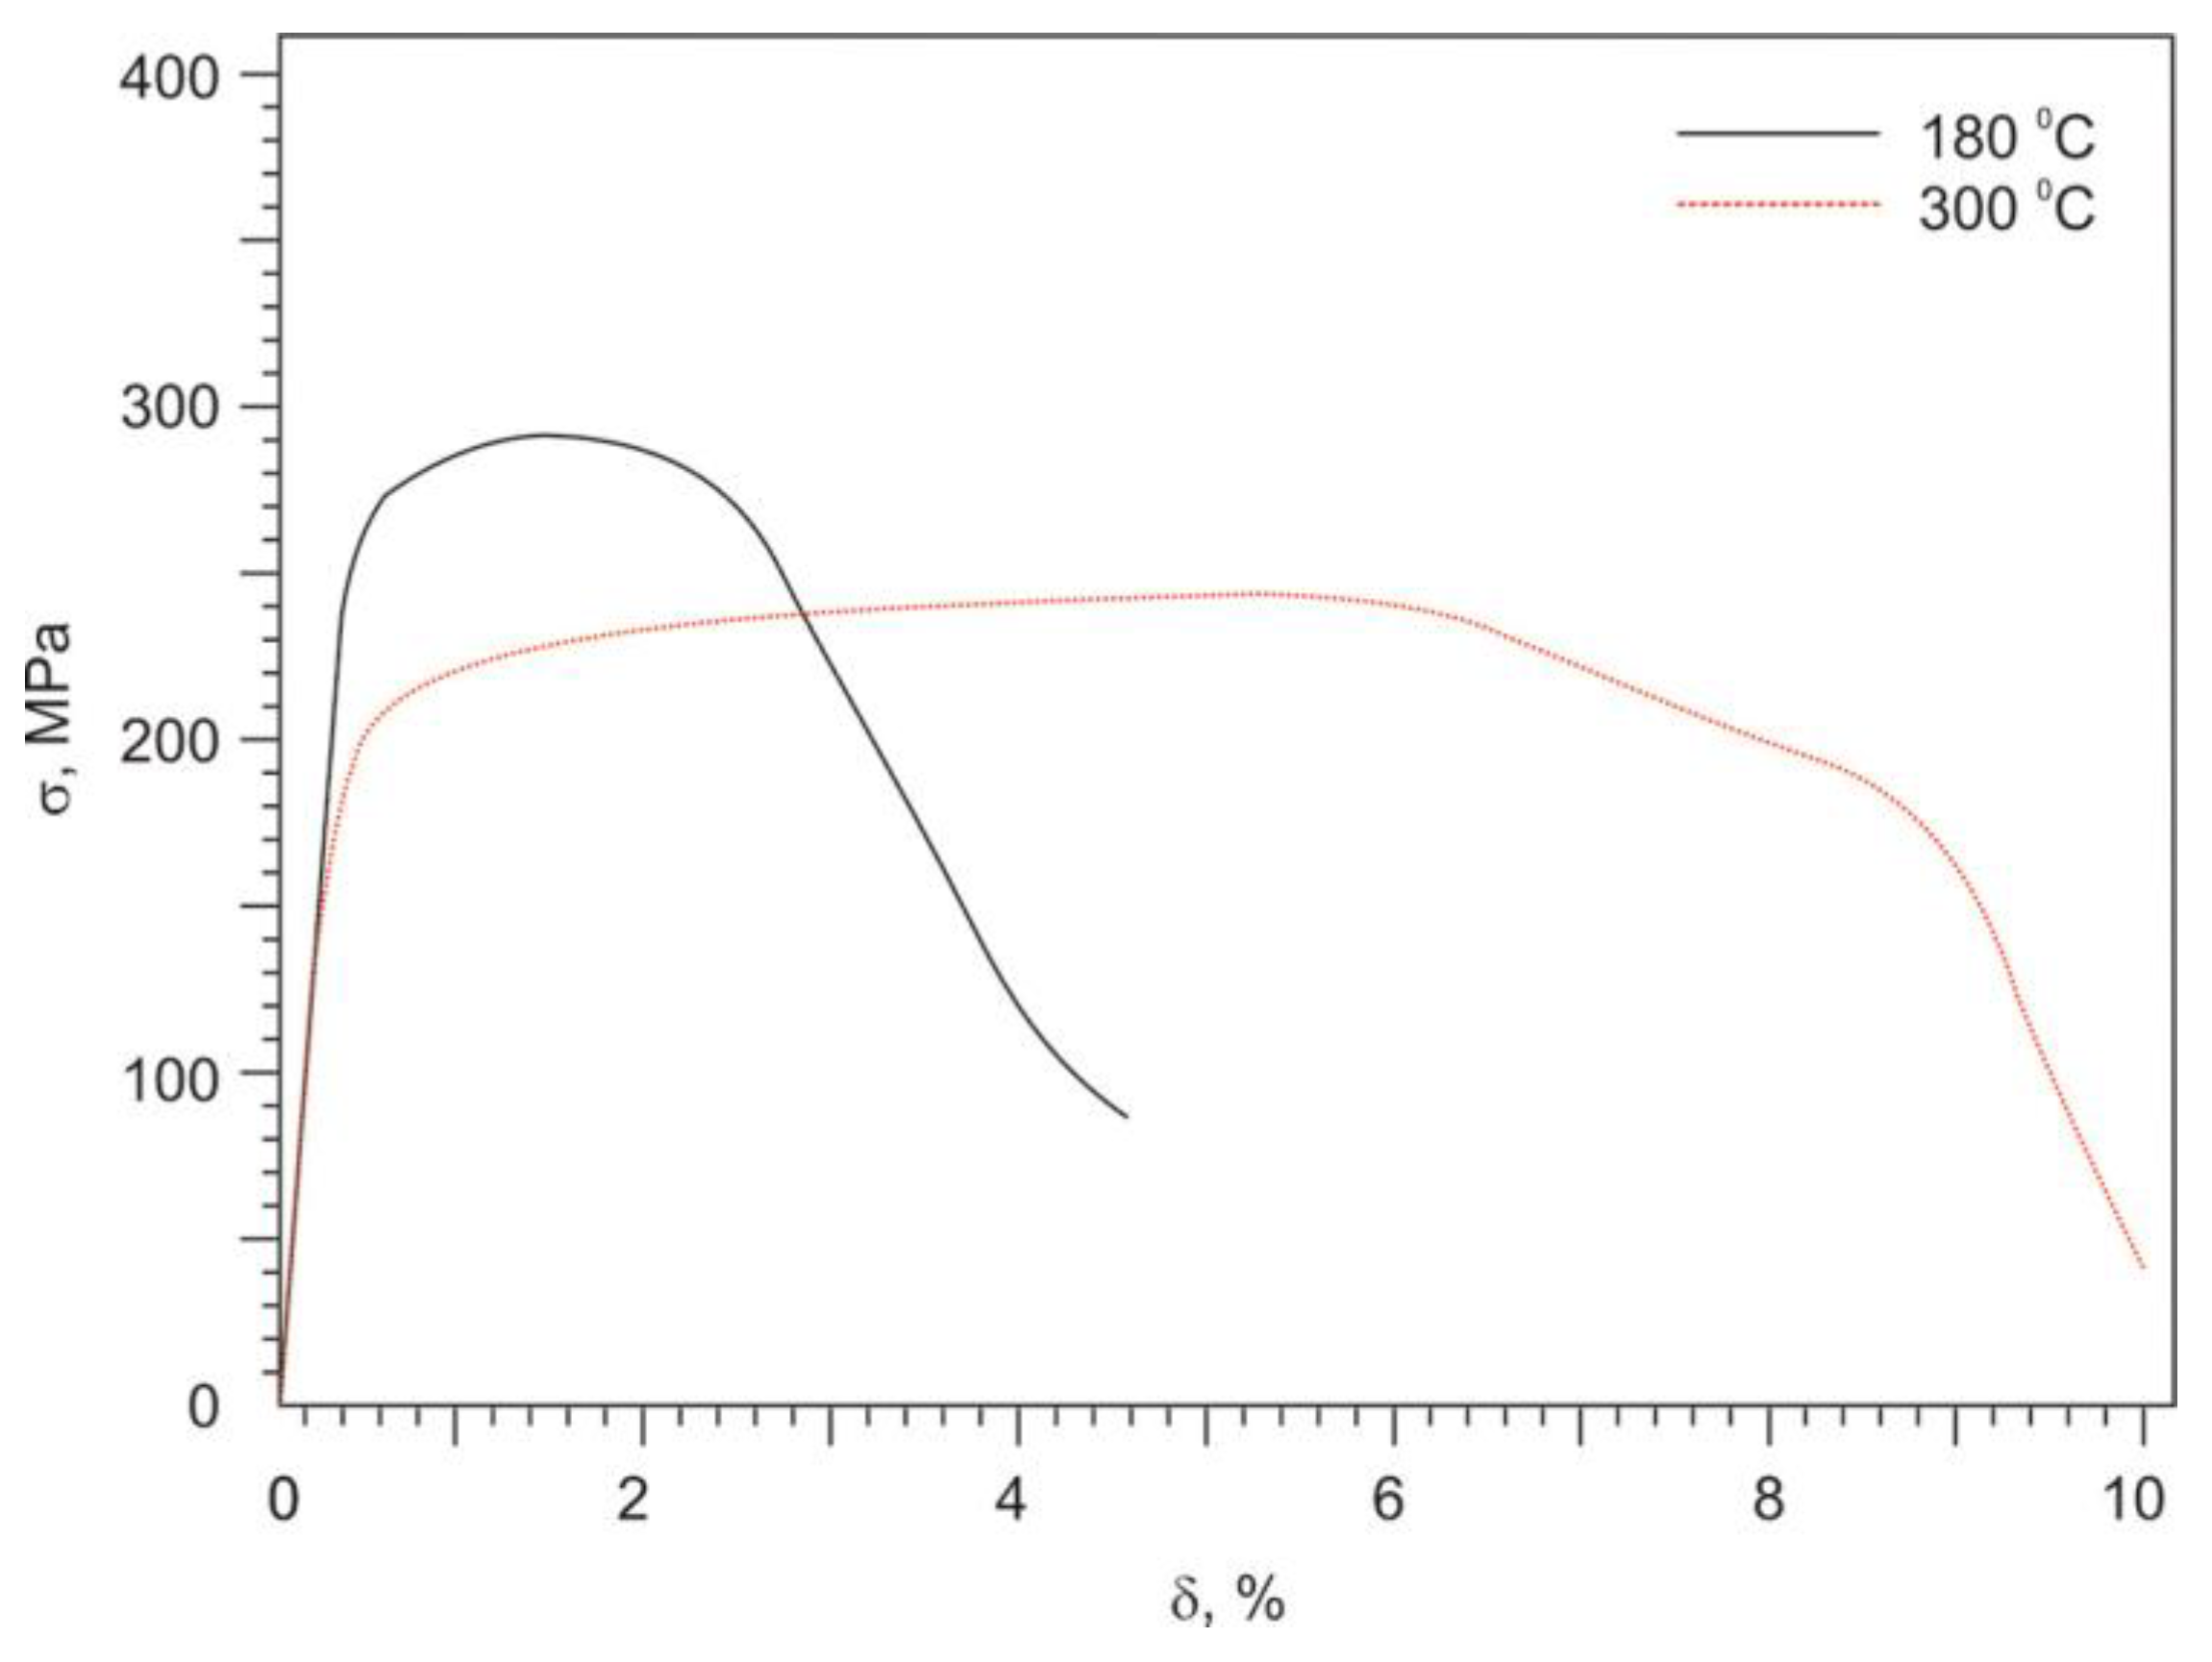
Figure 13 shows the stress–strain curves for the 2.5-mm diameter composite samples after annealing at temperatures of 180 and 300 °C. The obtained values of the mechanical properties are presented in Table 1. It can be seen that annealing at 180 °C leads to some increase in the strength properties of the 2.5-mm diameter composite sample, namely the yield strength increases by 4% and the ultimate tensile strength increases by 11%, while the relative elongation also increases to 5% (2 times). Annealing at a temperature of 300 °C, as well as for the 5-mm diameter composite sample, leads to a decrease in the yield strength (by 28% compared to the unannealed state) and ultimate tensile strength (by 11%) and to an increase in the relative elongation to 9%. Thus, the mechanical properties of the composite samples with a diameter of 5 and 2.5 mm after annealing at a temperature of 300 °C are comparable. In addition, annealing at 300 °C changes the shape of the stress–strain curves, namely, it greatly increases the length of the stage of uniform plastic deformation.
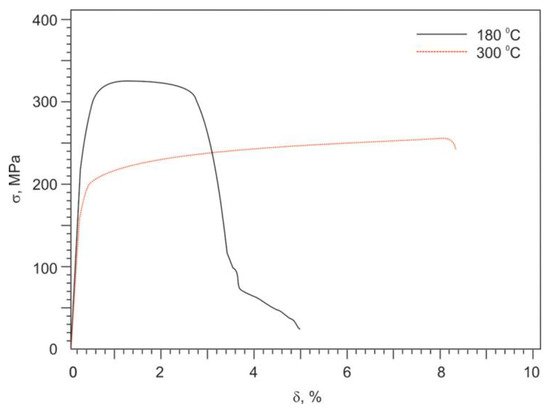
Figure 13.
Stress–strain curves for composite sample after rotary forging to a diameter of 2.5 mm (e = 4.16) and subsequent annealing at different temperatures.
As can be seen from the stress–strain curves, for both composites with a diameter of 5 mm and 2.5 mm, annealing at 180 °C leads to an increase in the plateau at a maximum stress (Figure 9, Figure 12 and Figure 13). In addition, as noted above, for the 2.5-mm diameter composite, the strength also slightly increases. It can be assumed that, during annealing of the composites at a temperature of 180 °C, partial annihilation of dislocations occurs; their density decreases. This means that during subsequent tensile deformation there will be fewer areas with a high stress concentration in the metal sufficient for the initiation of microcracks, which lead to rapid localization of deformation and a decrease in relative elongation. Therefore, it can be expected that the metal after such annealing will have the ability to undergo a longer plastic deformation as seen at the stress–strain curves. With an increase in the annealing temperature to 300 °C, the processes of structure recovery should proceed more completely (primarily in the copper shell), which leads to the observed significant softening of copper shell and a decrease in the strength and an increase in the plasticity of the composite material.
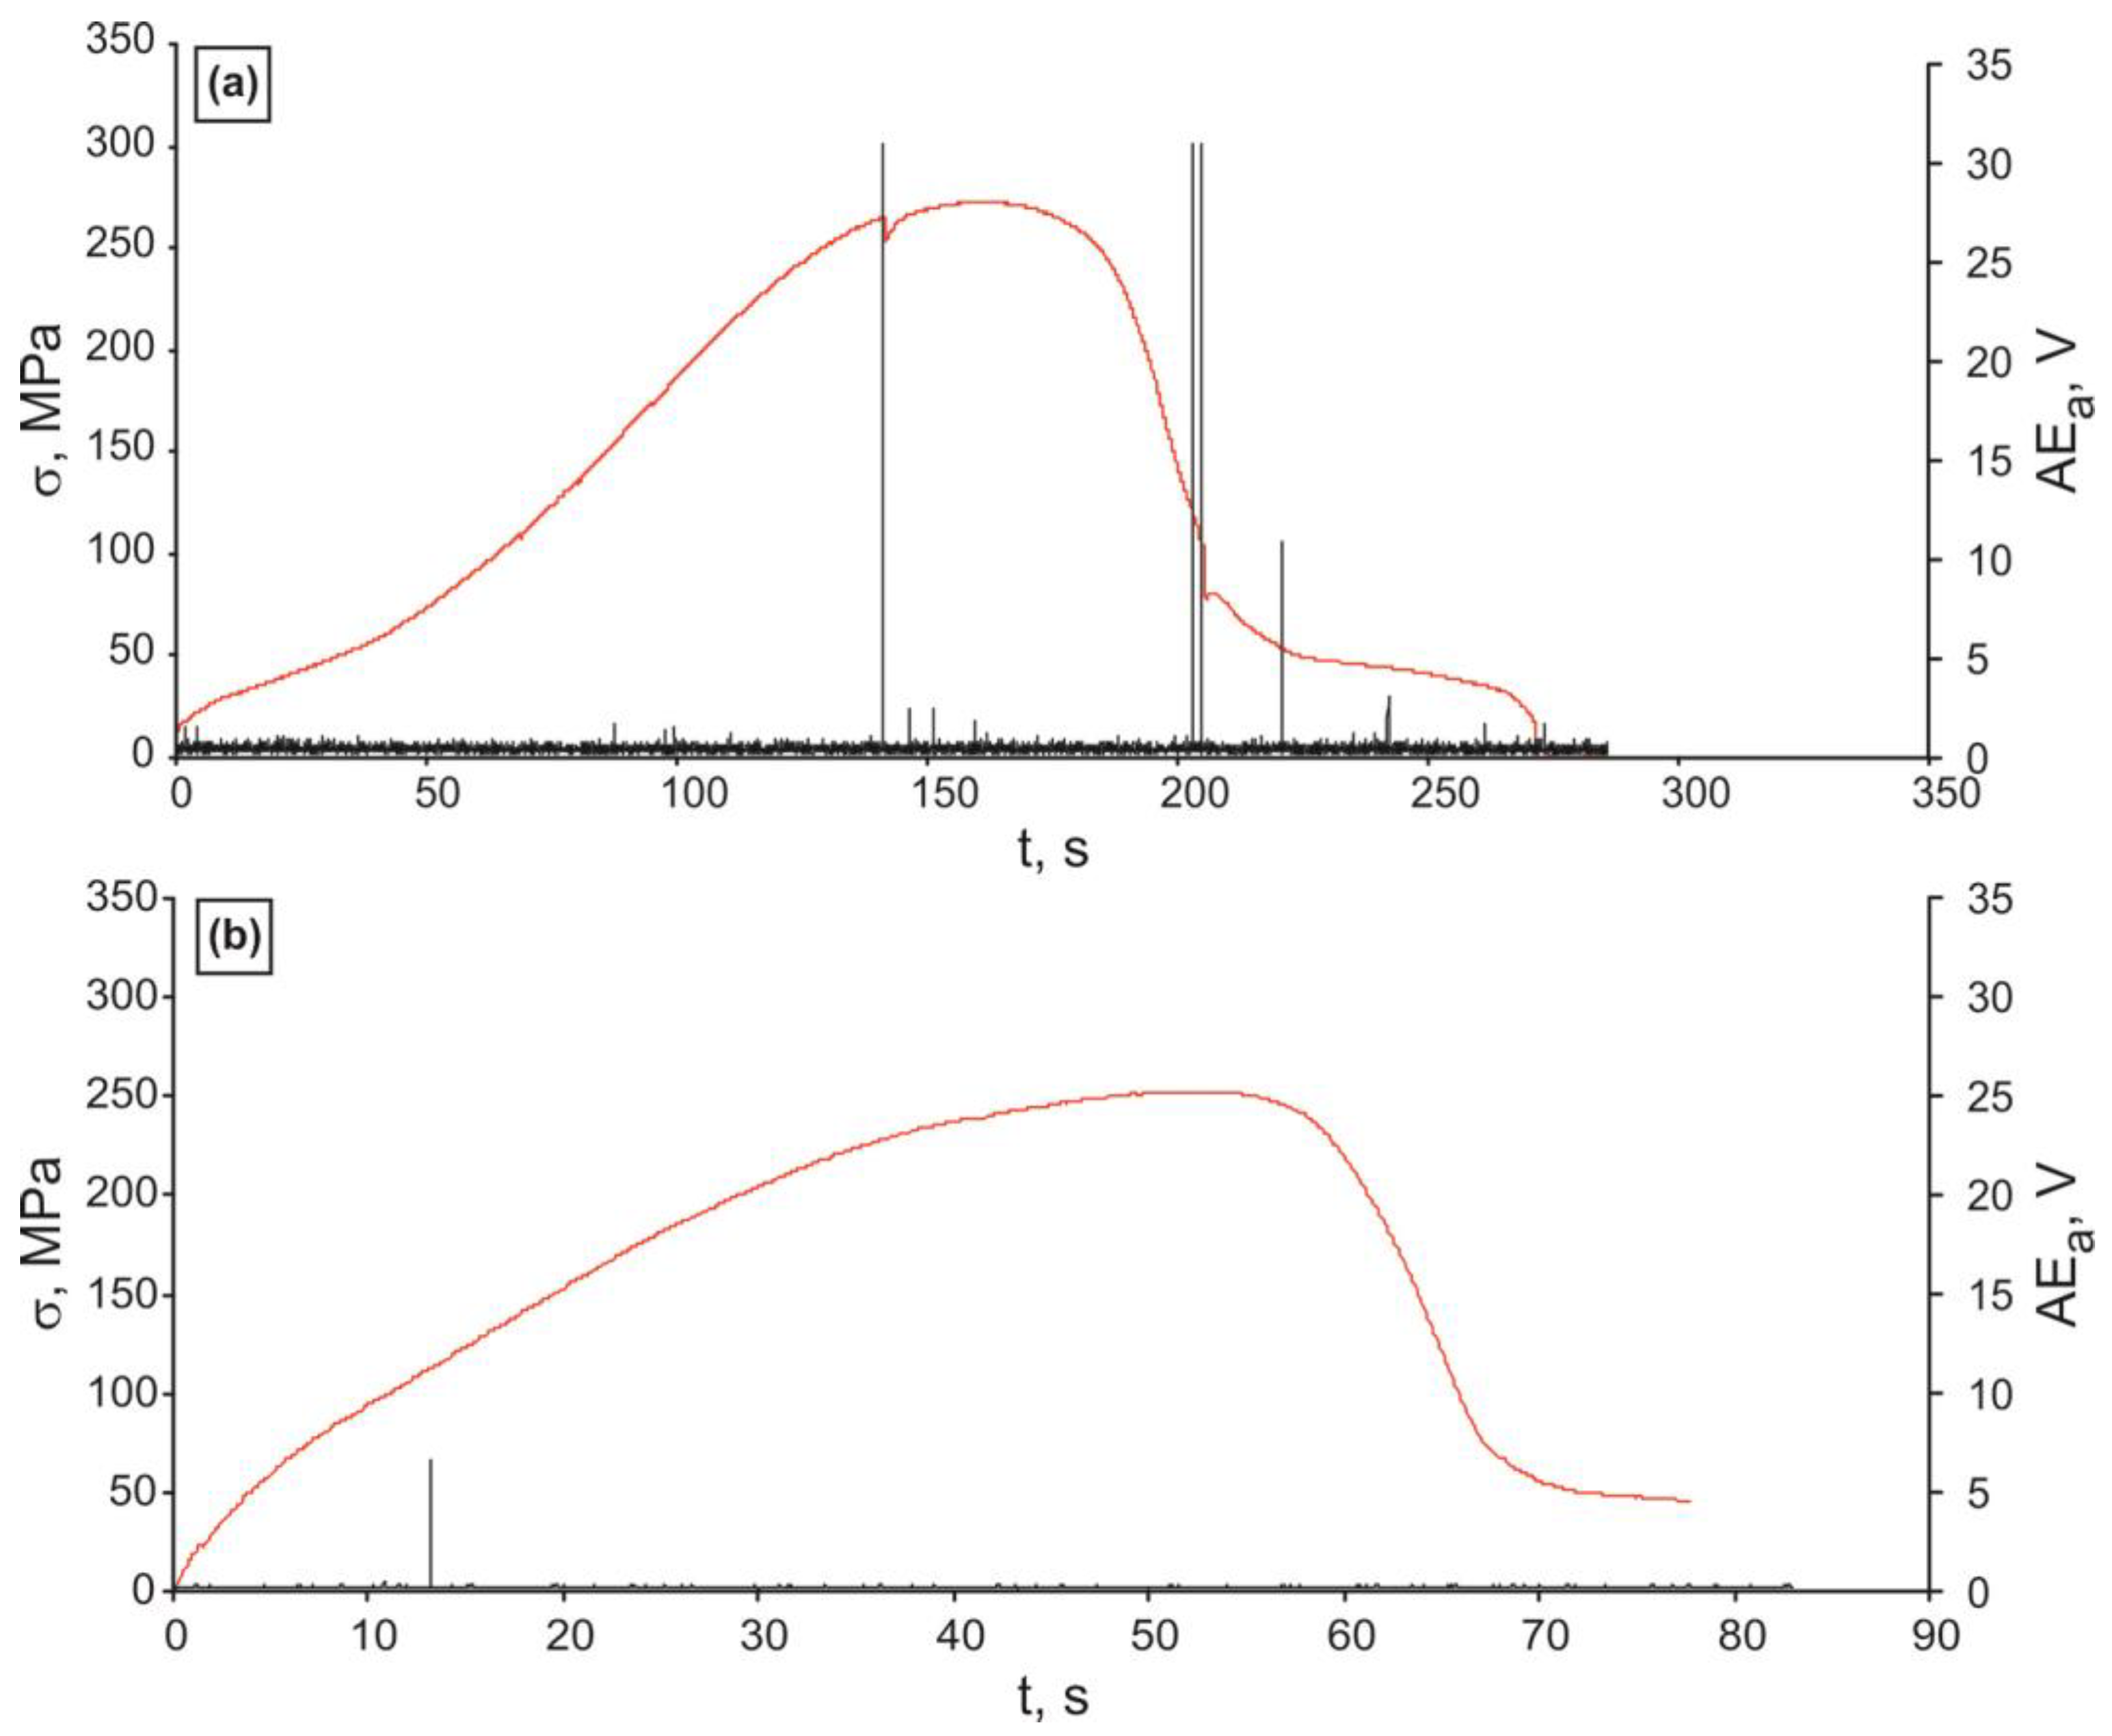
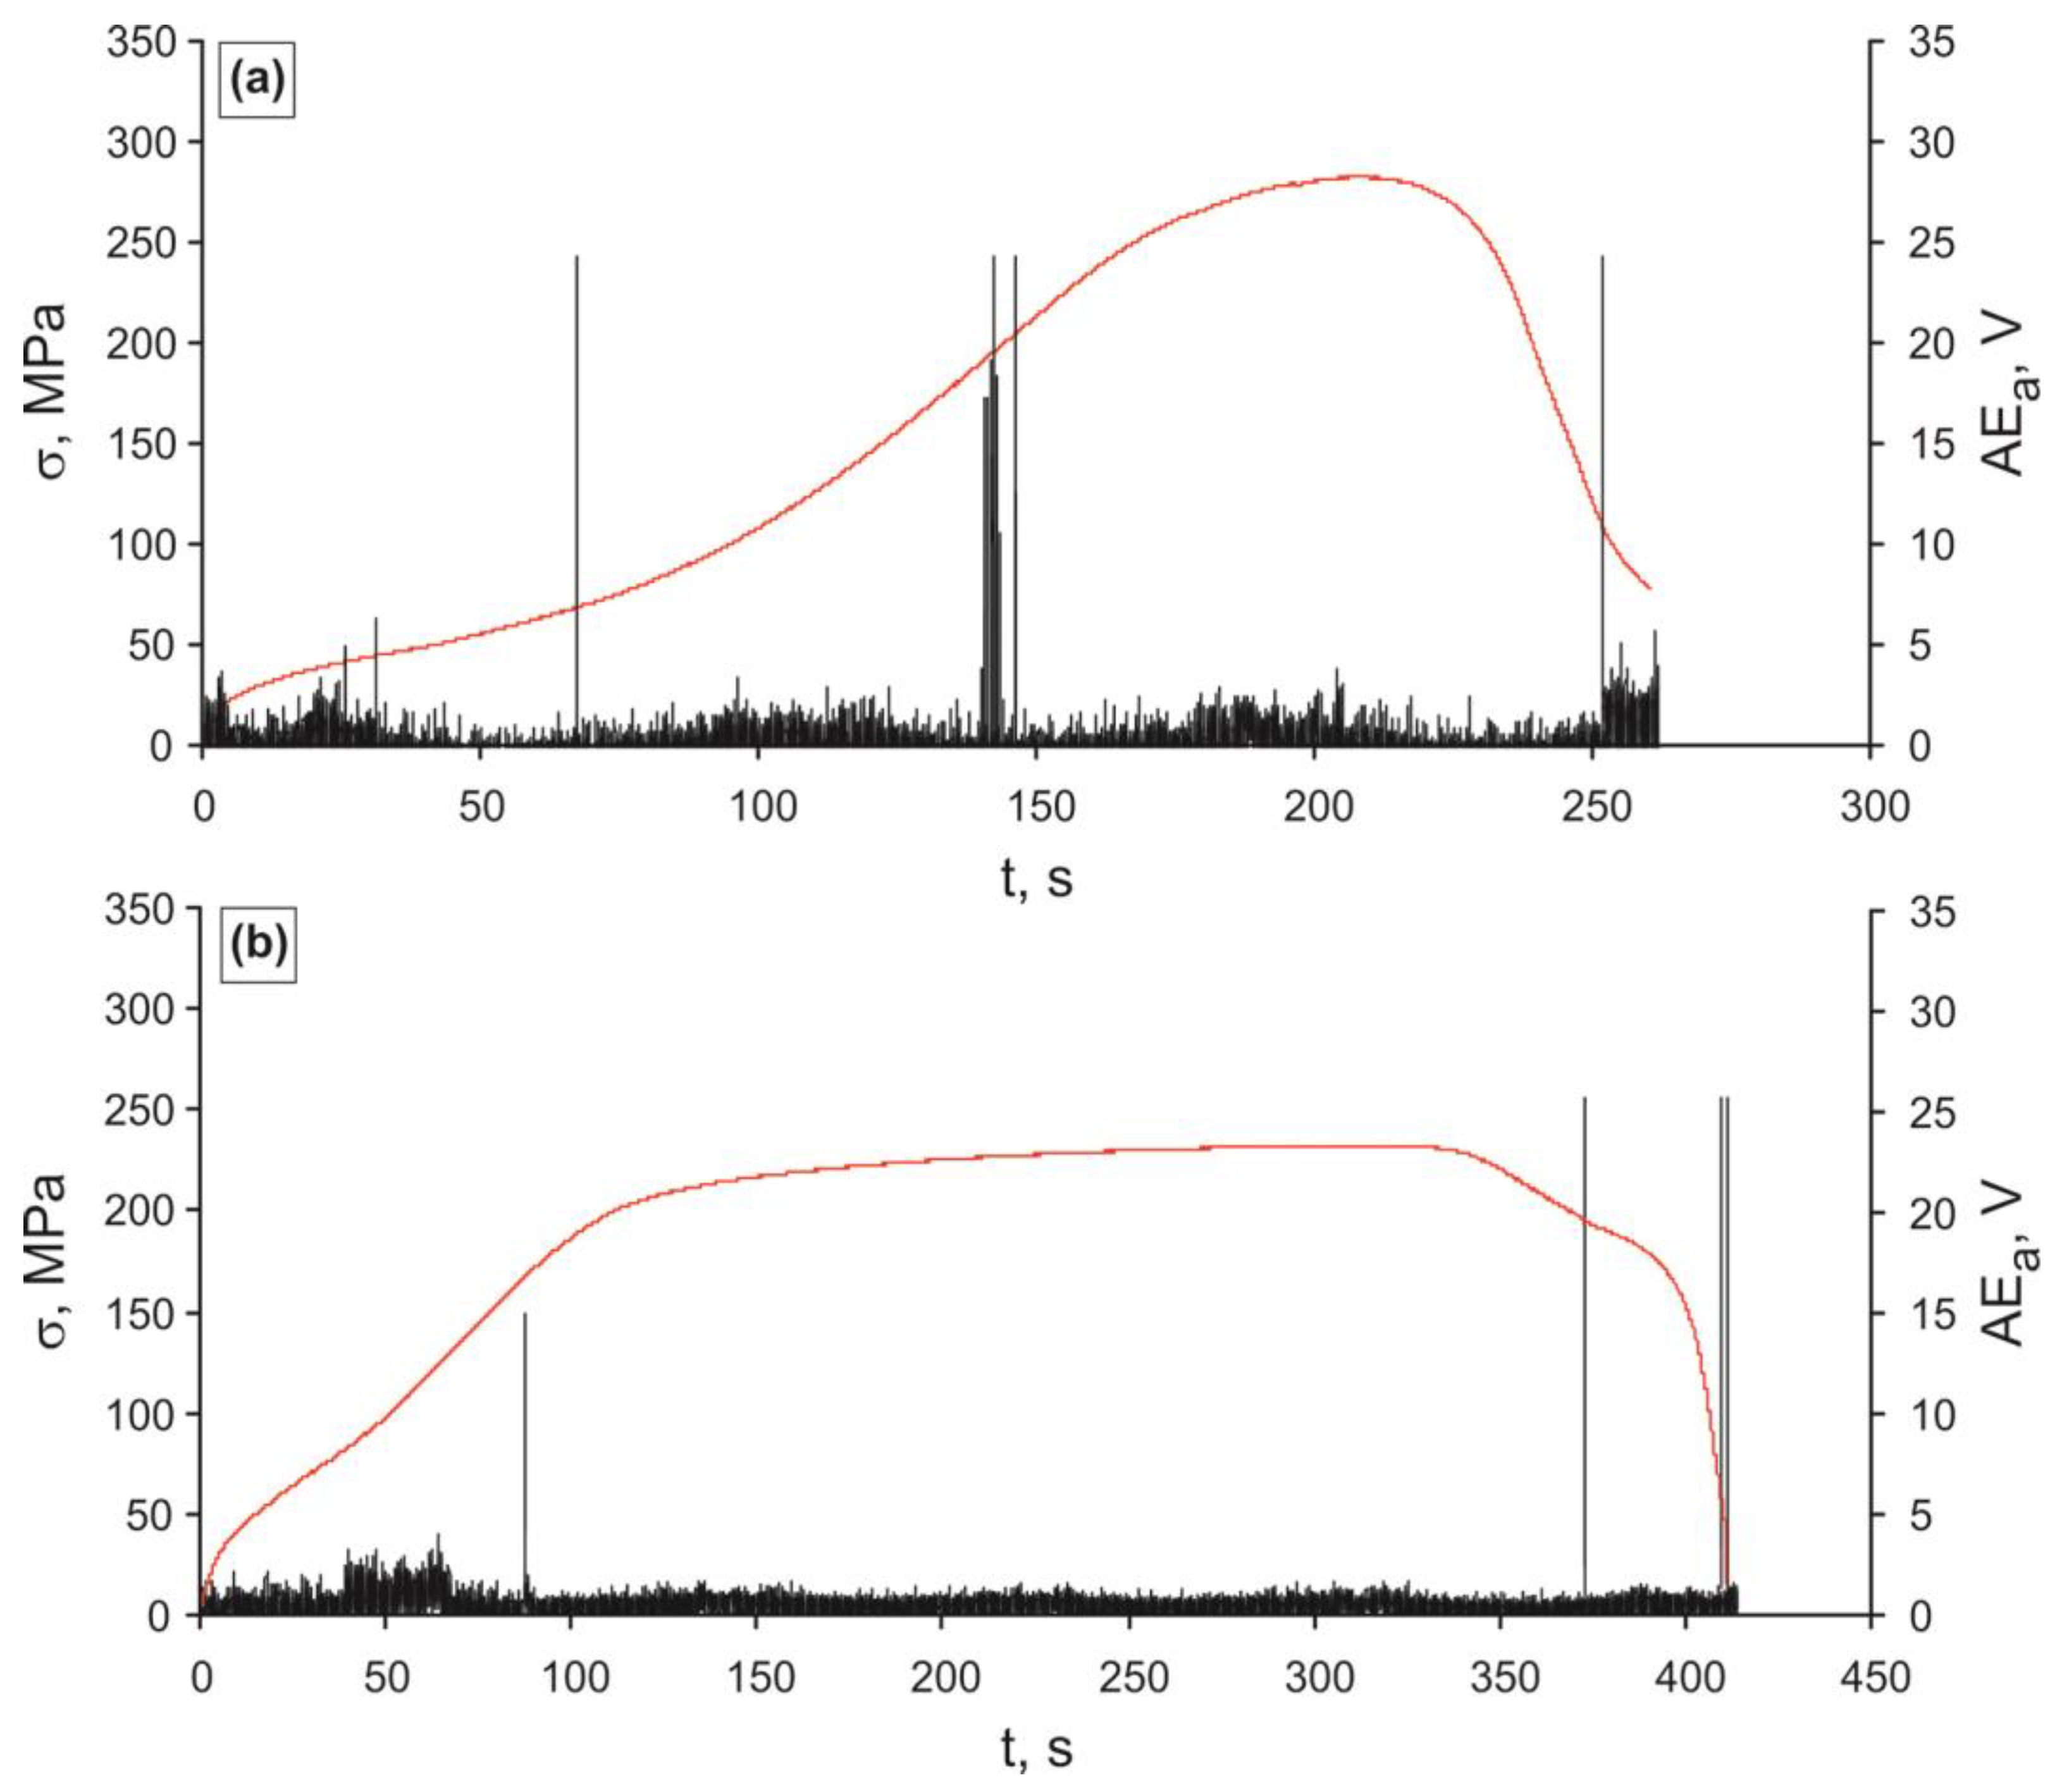
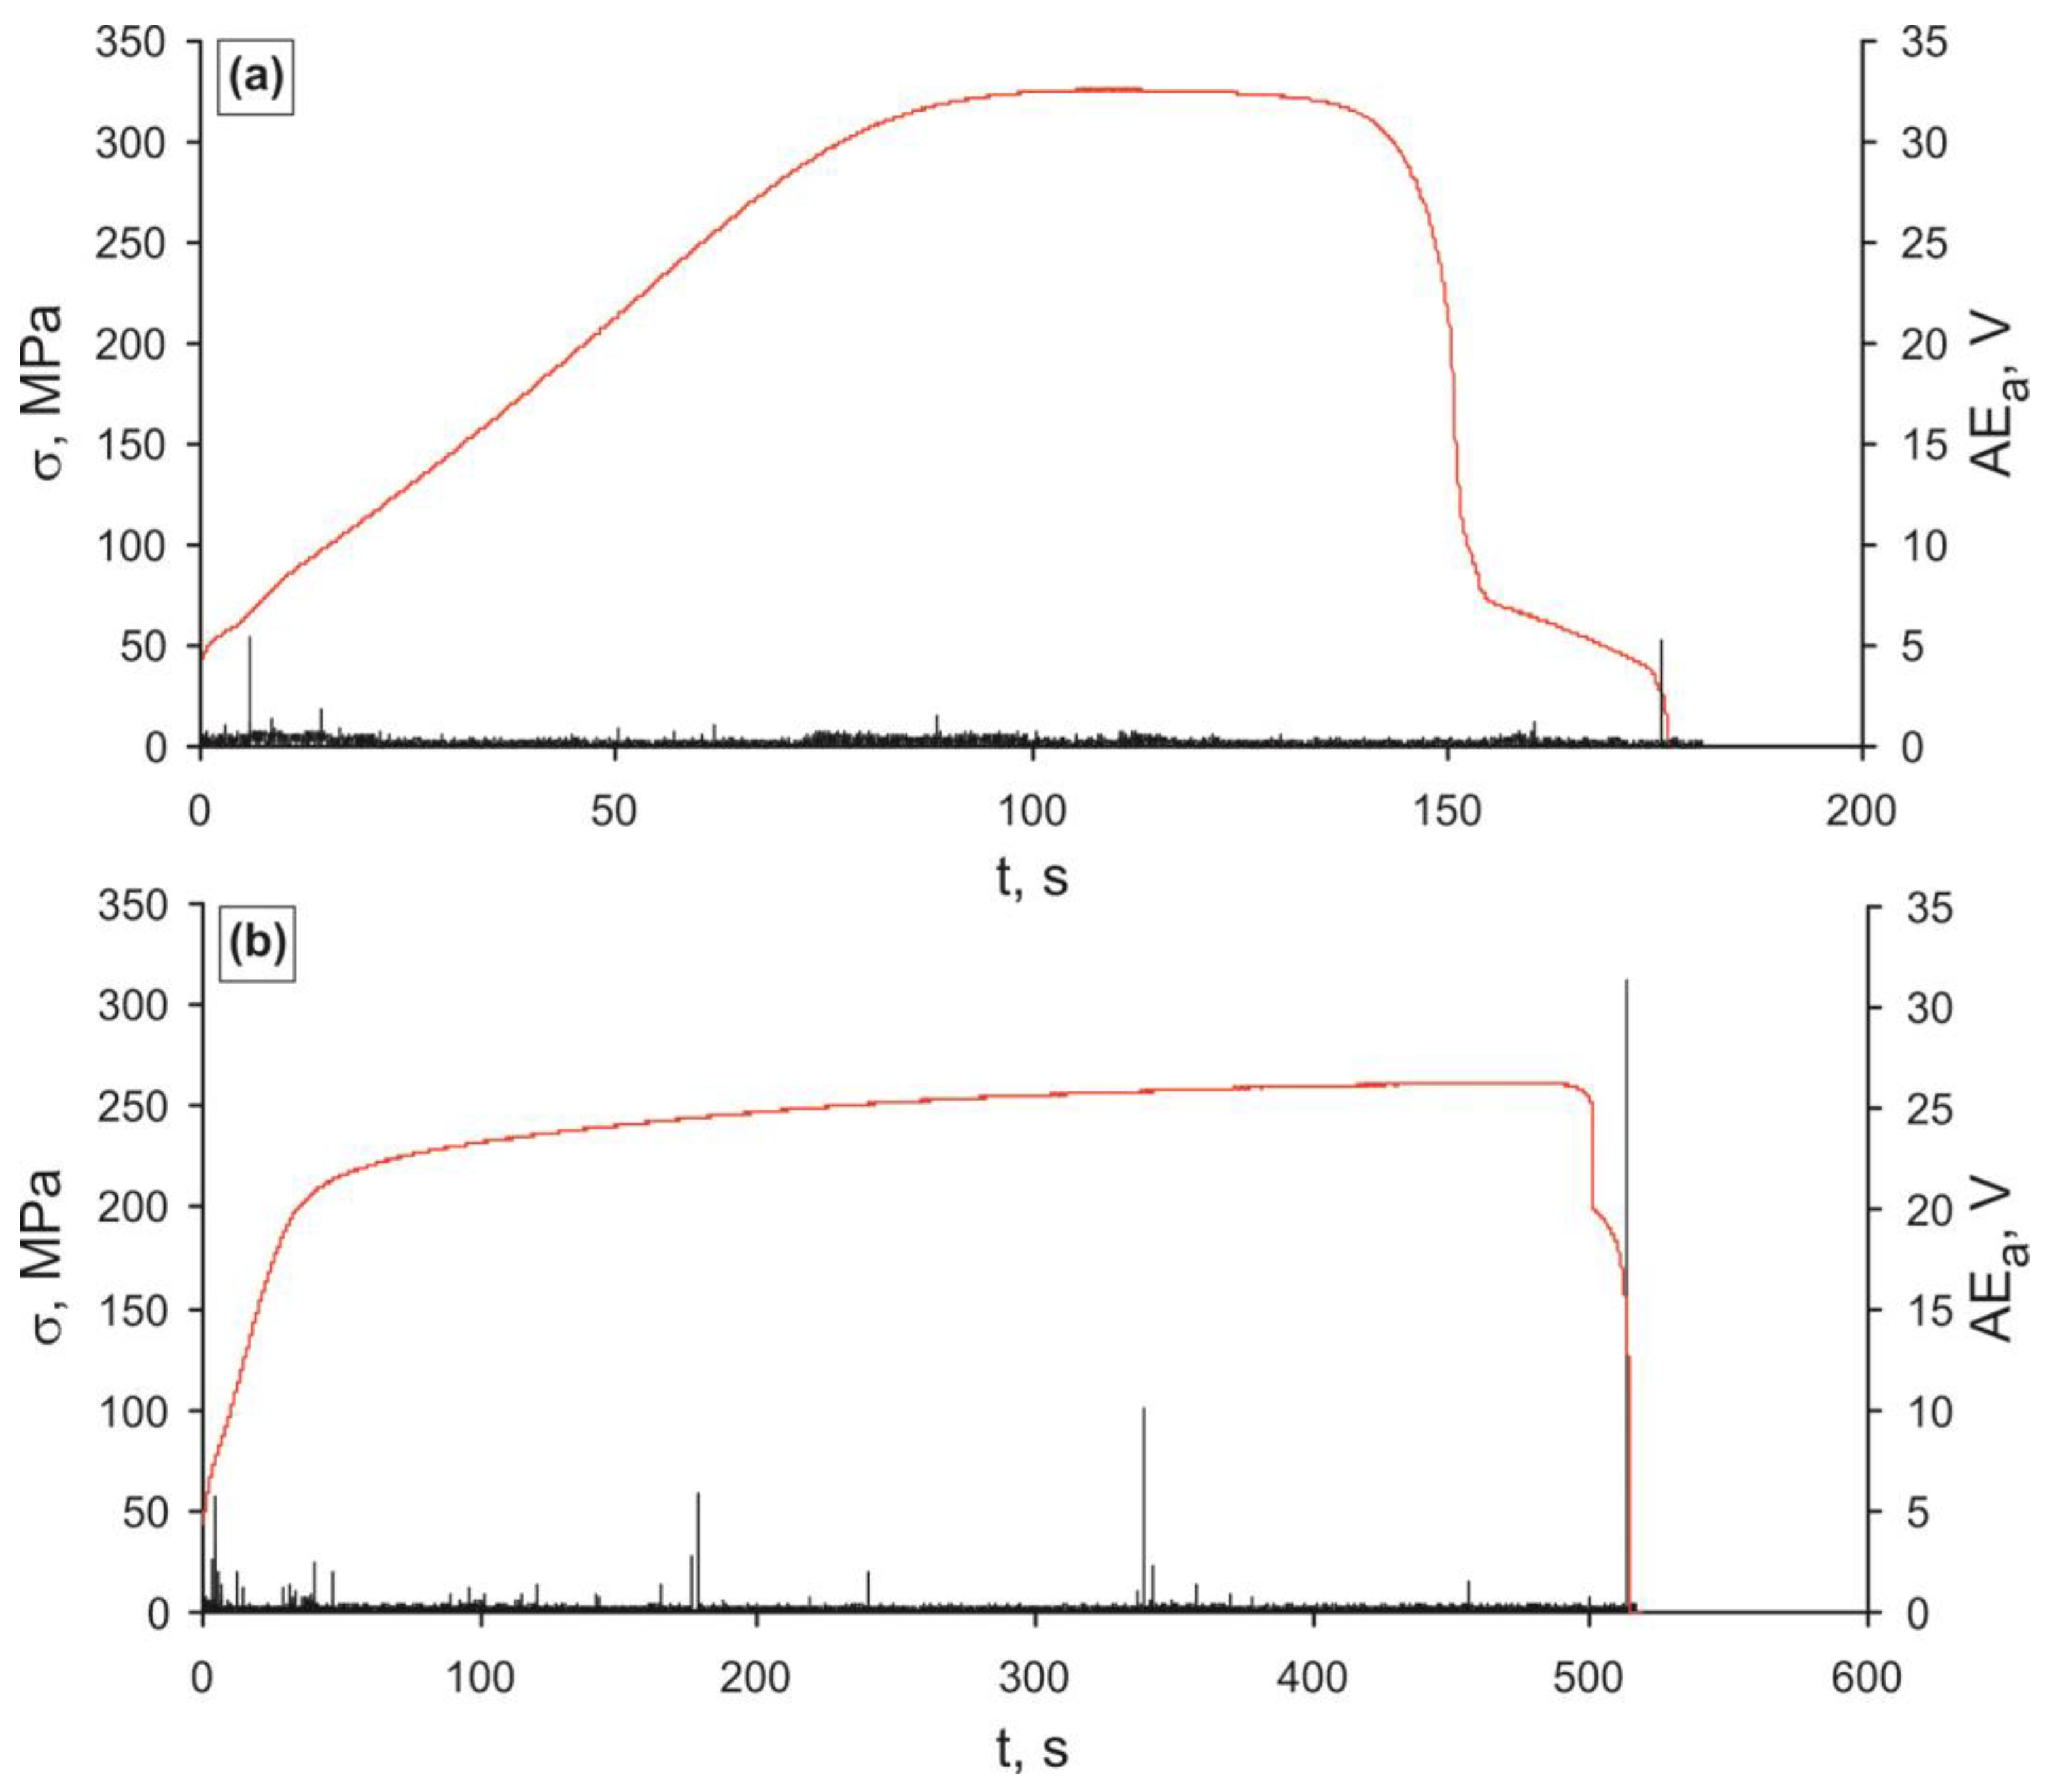
Combined stress–strain curves and AE diagrams of the composite samples after rotary forging to different diameters are shown in Figure 14, and after subsequent annealing—in Figure 15 and Figure 16. A joint analysis of stress–strain curves and AE signals revealed similarities and differences in the processes of deformation and fracture of composite samples depending on the billet’s reduction ratio and subsequent annealing temperatures. Thus, in the tension process of an unannealed 5-mm diameter composite sample, high-amplitude AE signals (5–30 V) were observed at the stage of uniform deformation. These signals were associated with the formation of cracks in the copper shell (Figure 14a). However, the formation of such cracks did not lead to the early localization of deformation and to the final failure of the sample, and the uniform deformation of the sample continued. After the maximum stress at the stress–strain curves, the stage of localized deformation began, which was also accompanied by AE signals. The moment of the final failure of the sample was accompanied by several high-amplitude AE signals.
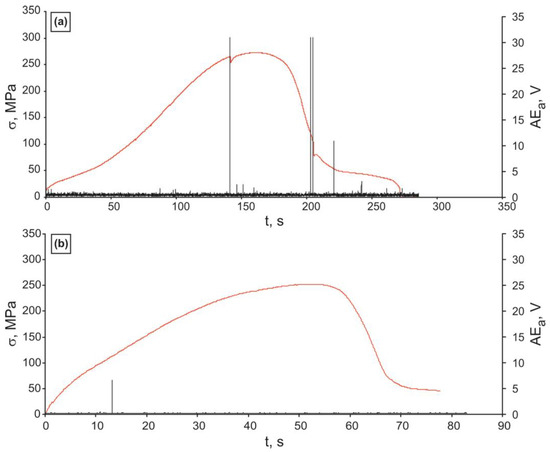
Figure 14.
Combined AE diagrams and stress–strain curves for composite sample after rotary forging to a diameter of (a) 5 mm (e = 2.77) and (b) 2.5 mm (e = 4.16).
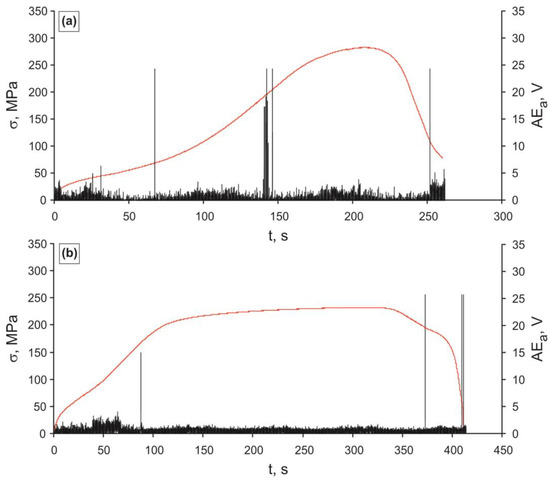
Figure 15.
Combined AE diagrams and stress–strain curves for the 5-mm diameter composite sample (e = 2.77) after annealing at (a) 180 °C and (b) 300 °C.
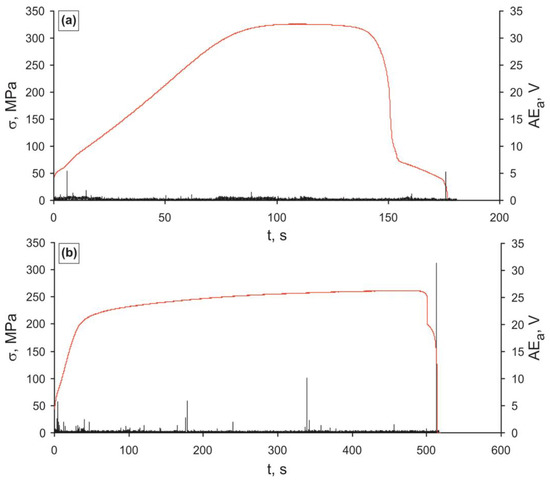
Figure 16.
Combined AE diagrams and stress–strain curves for the 2.5-mm diameter composite sample (e = 4.16) after annealing at (a) 180 °C and (b) 300 °C.
As the composite sample’s diameter decreased to 2.5 mm, the number of high-amplitude signals decreased. At the same time, the AE intensity also strongly decreased, which is explained, among other things, by the scale factor.
Annealing of the composite samples with diameters of 5 and 2.5 mm at 180 and 300 °C did not change the character of AE during tension compared to unannealed samples (Figure 15 and Figure 16).
Previously, the advantage of a structure with a gradient distribution of hardness (using the example of a low carbon steel) in terms of improved resistance to crack propagation was shown [22]. In our case, instead of a gradient distribution of hardness in the composite sample, there is an abrupt change in hardness at the copper/aluminum alloy interface. Such a structure should also have improved resistance to crack propagation, which is confirmed experimentally. Cracks nucleated in a higher strength copper shell slow down or stop completely in a more ductile aluminum rod. In addition, the copper/aluminum alloy interface itself is a barrier to crack propagation [23].
3.3. Physical Properties
The electrical conductivity of the composite sample after rotary forging to a diameter of 2.5 mm is 72.6% of the electrical conductivity of annealed copper and 1.3 times higher than the electrical conductivity of the cast Al–10% La alloy (Table 2).

Table 2.
Results of measuring the electrical resistance of the composite samples.
The low sensitivity of the electrical conductivity of pure copper at room temperature to defects on the scale of dislocations and grain boundaries was noted in [24]. This is due to the short wavelength of the electron at room temperature. Thus, the value of the electrical conductivity of the composite sample is between the values of the electrical conductivity of the copper shell and the aluminum rod.
The measured values of the coefficient of linear thermal expansion values for the 5-mm diameter composite sample are shown in Table 3. It can be seen that the coefficient of linear thermal expansion slightly increases with increasing temperature, and its value lies between the coefficient of linear thermal expansion of pure copper and aluminum [25].

Table 3.
Results of measuring the coefficient of linear thermal expansion of the 5-mm diameter composite sample.
4. Conclusions
Based on the results of studying the structure, mechanical and physical properties of the Cu/Al–10% La composite samples after cold rotary forging from a diameter of 20 mm to a diameter of 5–2.5 mm (e = 2.77–4.16) and subsequent annealing in the temperature range of 180–300 °C, the following conclusions were made:
- (a)
- Rotary forging of the composite sample to a diameter of 2.5 mm leads to the formation of a predominantly subgrain structure with a high dislocation density in the copper shell, and to the formation of a predominantly ultrafine grain/subgrain structure in the aluminum rod, as well as to partial refinement of the Al11La3 eutectic particles and their orientation along the forging direction.
- (b)
- As a result of structural changes after rotary forging, an increase in the microhardness of the composite billet is observed: the copper shell’s microhardness is increased by 1.9 times, and the aluminum rod’s microhardness is increased by 1.4 times, and the microhardness is unevenly distributed in the sample’s cross section, namely microhardness is maximal in the area of the copper shell and minimal in the area of the aluminum rod.
- (c)
- The yield strength of the composite sample after rotary forging is 2.3 times higher than the yield strength of copper and 2.5 times higher than the yield strength of the Al-10% La alloy before forging. An increase in the billet’s reduction ratio does not significantly change the strength of the composite sample, but reduces its plasticity.
- (d)
- The strength of the composite sample does not change or slightly increases after annealing to a temperature of 180 °C. Increasing the annealing temperature to 300 °C leads to a decrease in the yield strength (by 28–30% compared to the unannealed state) and ultimate tensile strength (by 11–15%), and to an increase in the relative elongation to 9–10%.
- (e)
- The processes of deformation and fracture of the composite samples with different reduction ratio are similar: during tensile test of the composite samples, AE signals were recorded from the formation of cracks in the copper shell at the stage of uniform deformation, which nevertheless did not lead to early localization of deformation and final failure of the sample, and the uniform deformation of the sample continued. After the maximum stress at the stress–strain curve, the stage of localized deformation began, which was also accompanied by AE signals.
- (f)
- The composite sample, after rotary forging, has a high electrical conductivity at the level of 72.6% of the electrical conductivity of annealed copper and a low coefficient of linear thermal expansion.
Author Contributions
Conceptualization, S.O.R. and V.M.K.; methodology, V.A.A. and N.V.A.; investigation, S.O.R., D.V.T., E.V.N. and N.Y.T.; writing—original draft preparation, S.O.R.; writing—review and editing, R.V.S.; visualization, S.O.R., funding acquisition, R.V.S. All authors have read and agreed to the published version of the manuscript.
Funding
The study was financially supported by the Russian Foundation for Basic Research and the Government of Moscow as part of a research project (grant #21-32-70015). The investigation of the structure was carried out using the equipment of the Center for Collective Use ‘Materials Science and Metallurgy’ with the financial support of the Ministry of Science and Higher Education of the Russian Federation (#075-15-2021-696). We thank engineer Aleksey Tokar for help in making samples, and engineer Pavel Sokolov, and engineer Natalya Korotkova for help in conducting research.
Institutional Review Board Statement
Not applicable.
Informed Consent Statement
Not applicable.
Data Availability Statement
The raw/processed data required to reproduce these findings cannot be shared at this time as the data also forms part of an ongoing study.
Conflicts of Interest
The authors declare that they have no known competing financial interests or personal relationships that could have appeared to influence the work reported in this paper.
References
- Danilenko, V.N.; Sergeev, S.N.; Baimova, J.A.; Korznikova, G.F.; Nazarov, K.S.; Khisamov, R.K.; Glezer, A.M.; Mulyukov, R.R. An approach for fabrication of Al-Cu composite by high pressure torsion. Mater. Lett. 2019, 236, 51–55. [Google Scholar] [CrossRef]
- Kim, I.-K.; Hong, S.I. Effect of heat treatment on the bending behavior of tri-layered Cu/Al/Cu composite plates. Mater. Des. 2013, 47, 590–598. [Google Scholar] [CrossRef]
- Zebardast, M.; Taheri, A.K. The cold welding of copper to aluminum using equal channel angular extrusion (ECAE) process. J. Mater. Process. Technol. 2011, 211, 1034–1043. [Google Scholar] [CrossRef]
- Song, H.; Hao, W.; Mu, X.; Han, T.; Che, C.; Geng, G. Effect of pulse current-assisted rolling on the interface bonding strength and microstructure of Cu/Al laminated composite. Metals 2020, 10, 1555. [Google Scholar] [CrossRef]
- Rogachev, S.O.; Andreev, V.A.; Yusupov, V.S.; Bondareva, S.A.; Hatkevich, V.M.; Nikolaev, E.V. Effect of rotary forging on microstructure evolution and mechanical properties of aluminum alloy/copper bimetallic material. Met. Mater. Int. 2022, 28, 1038–1046. [Google Scholar] [CrossRef]
- Rogachev, S.O.; Sundeev, R.V.; Andreev, V.A.; Yusupov, V.S.; Khatkevich, V.M.; Nikolaev, E.V.; Bondareva, S.A. Mechanical behavior of a copper–aluminum clad composite material during rotary forging. Russ. Met. 2022, 2022, 332–338. [Google Scholar] [CrossRef]
- Kocich, R.; Kunčická, L.; Král, P.; Strunz, P. Characterization of innovative rotary swaged Cu-Al clad composite wire conductors. Mater. Des. 2018, 160, 828–835. [Google Scholar] [CrossRef]
- Kocich, R.; Macháčková, A.; Kunčická, L.; Fojtík, F. Fabrication and characterization of cold-swaged multilayered Al–Cu clad composites. Mater. Des. 2015, 71, 36–47. [Google Scholar] [CrossRef]
- Zhang, Q.; Zhang, Y.; Cao, M.; Ben, N.; Ma, X.; Ma, H. Joining process for copper and aluminum tubes by rotary swaging method. Int. J. Adv. Manuf. Technol. 2017, 89, 163–173. [Google Scholar] [CrossRef]
- Kocich, R.; Kunčická, L.; Macháčková, A.; Šofer, M. Improvement of mechanical and electrical properties of rotary swaged Al-Cu clad composites. Mater. Des. 2017, 123, 137–146. [Google Scholar] [CrossRef]
- Belov, N.A.; Naumova, E.A.; Ilyukhin, V.D.; Doroshenko, V.V. Structure and mechanical properties of Al—6% Ca—1% Fe alloy foundry goods, obtained by die casting. Tsvetnye Met. 2017, 3, 69–75. [Google Scholar] [CrossRef]
- Rogachev, S.O.; Naumova, E.A.; Lukina, E.A.; Zavodov, A.V.; Khatkevich, V.M. High strength Al-La, Al-Ce, and Al-Ni eutectic aluminum alloys obtained by high-pressure torsion. Materials 2021, 14, 6404. [Google Scholar] [CrossRef] [PubMed]
- Murashkin, M.Y.; Sabirov, I.; Medvedev, A.E.; Enikeev, N.A.; Lefebvre, W.; Valiev, R.Z.; Sauvage, X. Mechanical and electrical properties of an ultrafine grained Al–8.5 wt. % RE (RE = 5.4 wt.% Ce, 3.1 wt.% La) alloy processed by severe plastic deformation. Mater. Des. 2016, 90, 433–442. [Google Scholar] [CrossRef]
- Naumova, E.; Doroshenko, V.; Barykin, M.; Sviridova, T.; Lyasnikova, A.; Shurkin, P. Hypereutectic Al-Ca-Mn-(Ni) alloys as natural eutectic composites. Metals 2021, 11, 890. [Google Scholar] [CrossRef]
- Cao, Z.; Kong, G.; Che, C.; Wang, Y.; Peng, H. Experimental investigation of eutectic point in Al-rich Al-La, Al-Ce, Al-Pr and Al-Nd systems. J. Rare Earths 2017, 35, 1022–1028. [Google Scholar] [CrossRef]
- Liu, Y.; Bian, Z.; Chen, Z.; Wang, M.; Chen, D.; Wang, H. Effect of Mn on the elevated temperature mechanical properties of Al-La alloys. Mater. Charact. 2019, 155, 109821. [Google Scholar] [CrossRef]
- Valiev, R.Z.; Alexandrov, I.V.; Enikeev, N.A.; Murashkin, M.Y.; Semenova, I.P. Towards enhancement of properties of UFG metals and alloys by grain boundary engineering using SPD processing. Rev. Adv. Mater. Sci. 2010, 25, 1–10. [Google Scholar]
- Horita, Z.; Fujinami, T.; Nemoto, M.; Langdon, T.G. Equal-channel angular pressing of commercial aluminum alloys: Grain refinement, thermal stability and tensile properties. Metall. Mater. Trans. A 2000, 31, 691–701. [Google Scholar] [CrossRef]
- Islamgaliev, R.K.; Nikitina, M.A.; Kamalov, A.F. Enhanced thermal stability and mechanical properties of ultrafine-grained aluminum alloy. Mater. Sci. Forum 2011, 667–669, 331–336. [Google Scholar] [CrossRef]
- Khanzhin, V.G.; Shtremel, M.A. Quantitative information on damage processes obtained in acoustic emission measurements. Met. Sci. Heat Treat. 2009, 51, 250–255. [Google Scholar] [CrossRef]
- Khanzhin, V.G. Designing computer systems for acoustic emission materials testing. Met. Sci. Heat Treat. 2009, 51, 245–249. [Google Scholar] [CrossRef]
- Nikulin, S.A.; Khanzhin, V.G.; Nikitin, A.V.; Turilina, V.Y.; Zabolotnikova, V.I. Analysis of the fracture kinetics and mechanisms of 20GL steel having different strengths using the acoustic emission parameters. Russ. Met. 2017, 2017, 895–900. [Google Scholar] [CrossRef]
- Pohl, P.M.; Kümmel, F.; Schunk, C.; Serrano-Munoz, I.; Markötter, H.; Göken, M.; Höppel, H.W. About the role of interfaces on the fatigue crack propagation in laminated metallic composites. Materials 2021, 14, 2564. [Google Scholar] [CrossRef] [PubMed]
- Faizov, I.A.; Mulyukov, R.R.; Aksenov, D.A.; Faizova, S.N.; Zemlyakova, N.V.; Cardoso, K.R.; Zeng, Y. Dissolution of the second phase particles in the course of the equal channel angular pressing of diluted Cu-Cr-Zr alloy. Lett. Mater. 2018, 8, 110–114. [Google Scholar] [CrossRef]
- Hagart-Alexander, C. Temperature measurement. In Instrumentation Reference Book, 4th ed.; Elsevier: Amsterdam, The Netherlands, 2010; pp. 269–271. [Google Scholar] [CrossRef]
Publisher’s Note: MDPI stays neutral with regard to jurisdictional claims in published maps and institutional affiliations. |
© 2022 by the authors. Licensee MDPI, Basel, Switzerland. This article is an open access article distributed under the terms and conditions of the Creative Commons Attribution (CC BY) license (https://creativecommons.org/licenses/by/4.0/).

