
Geochemical Approach to Determine the Possible Precipitation Parameters of the Coniacian–Santonian Mazıdağı Phosphates, Mardin, Turkey


Abstract
:
1. Introduction
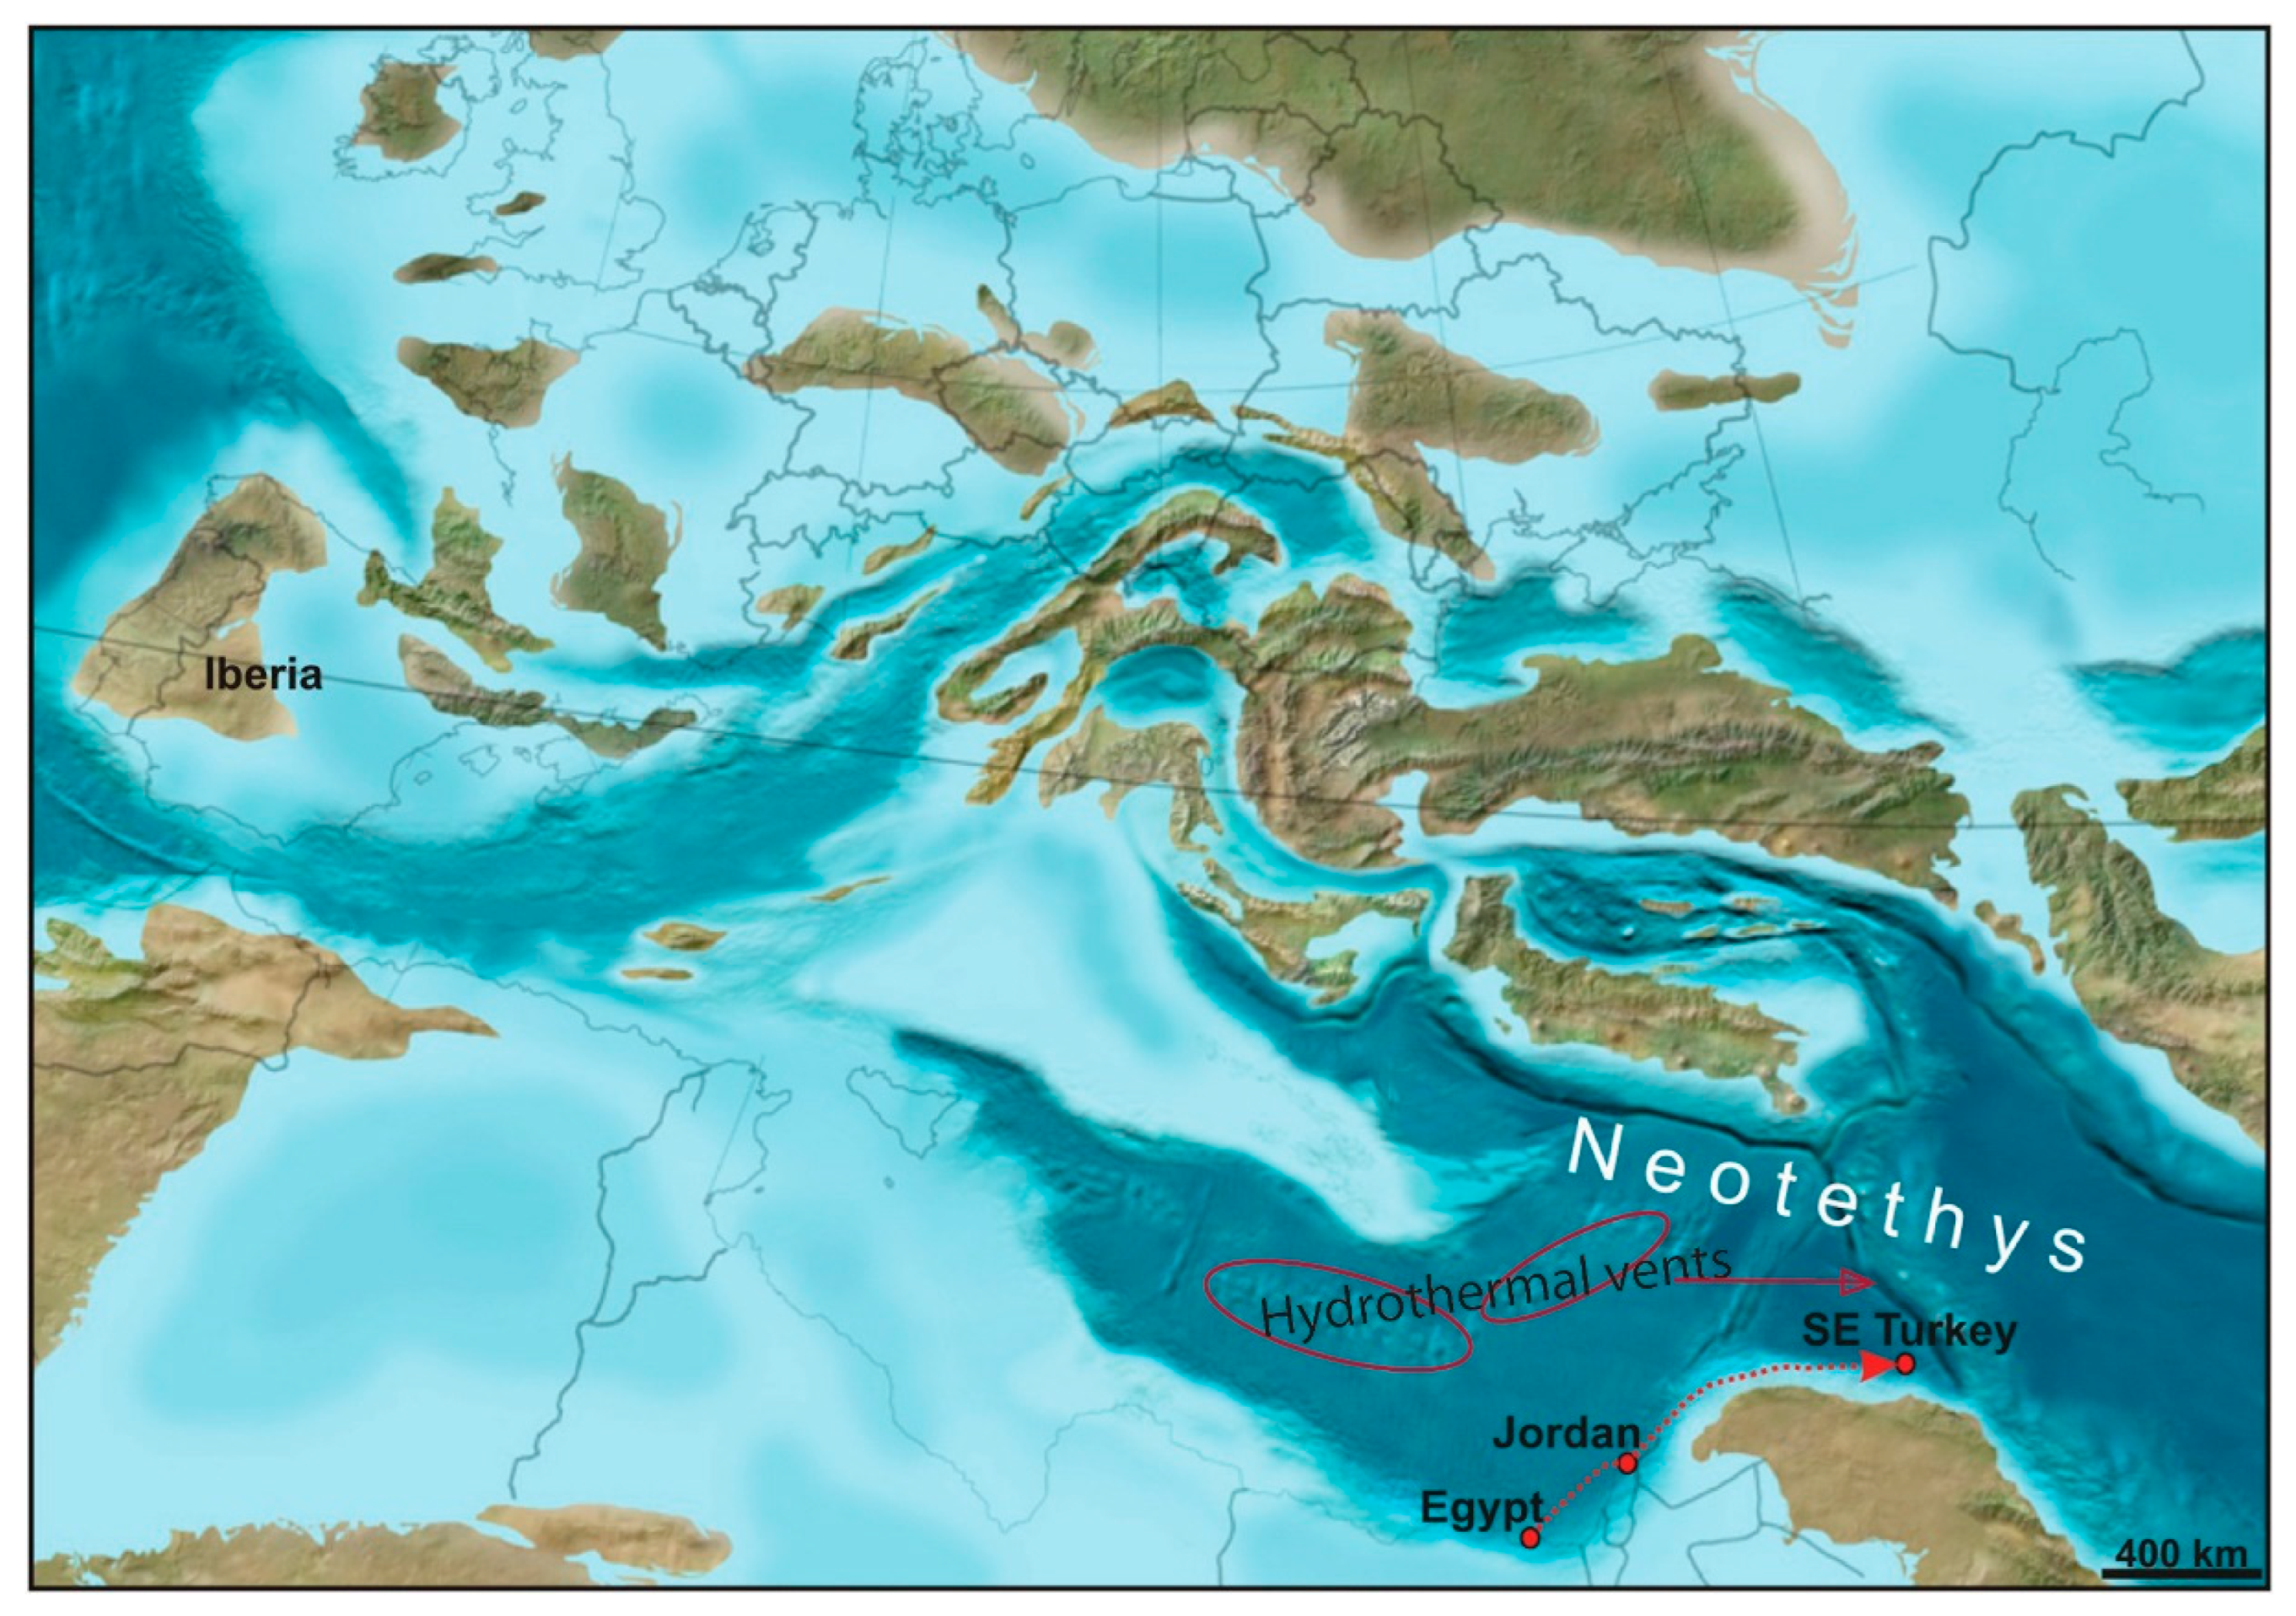
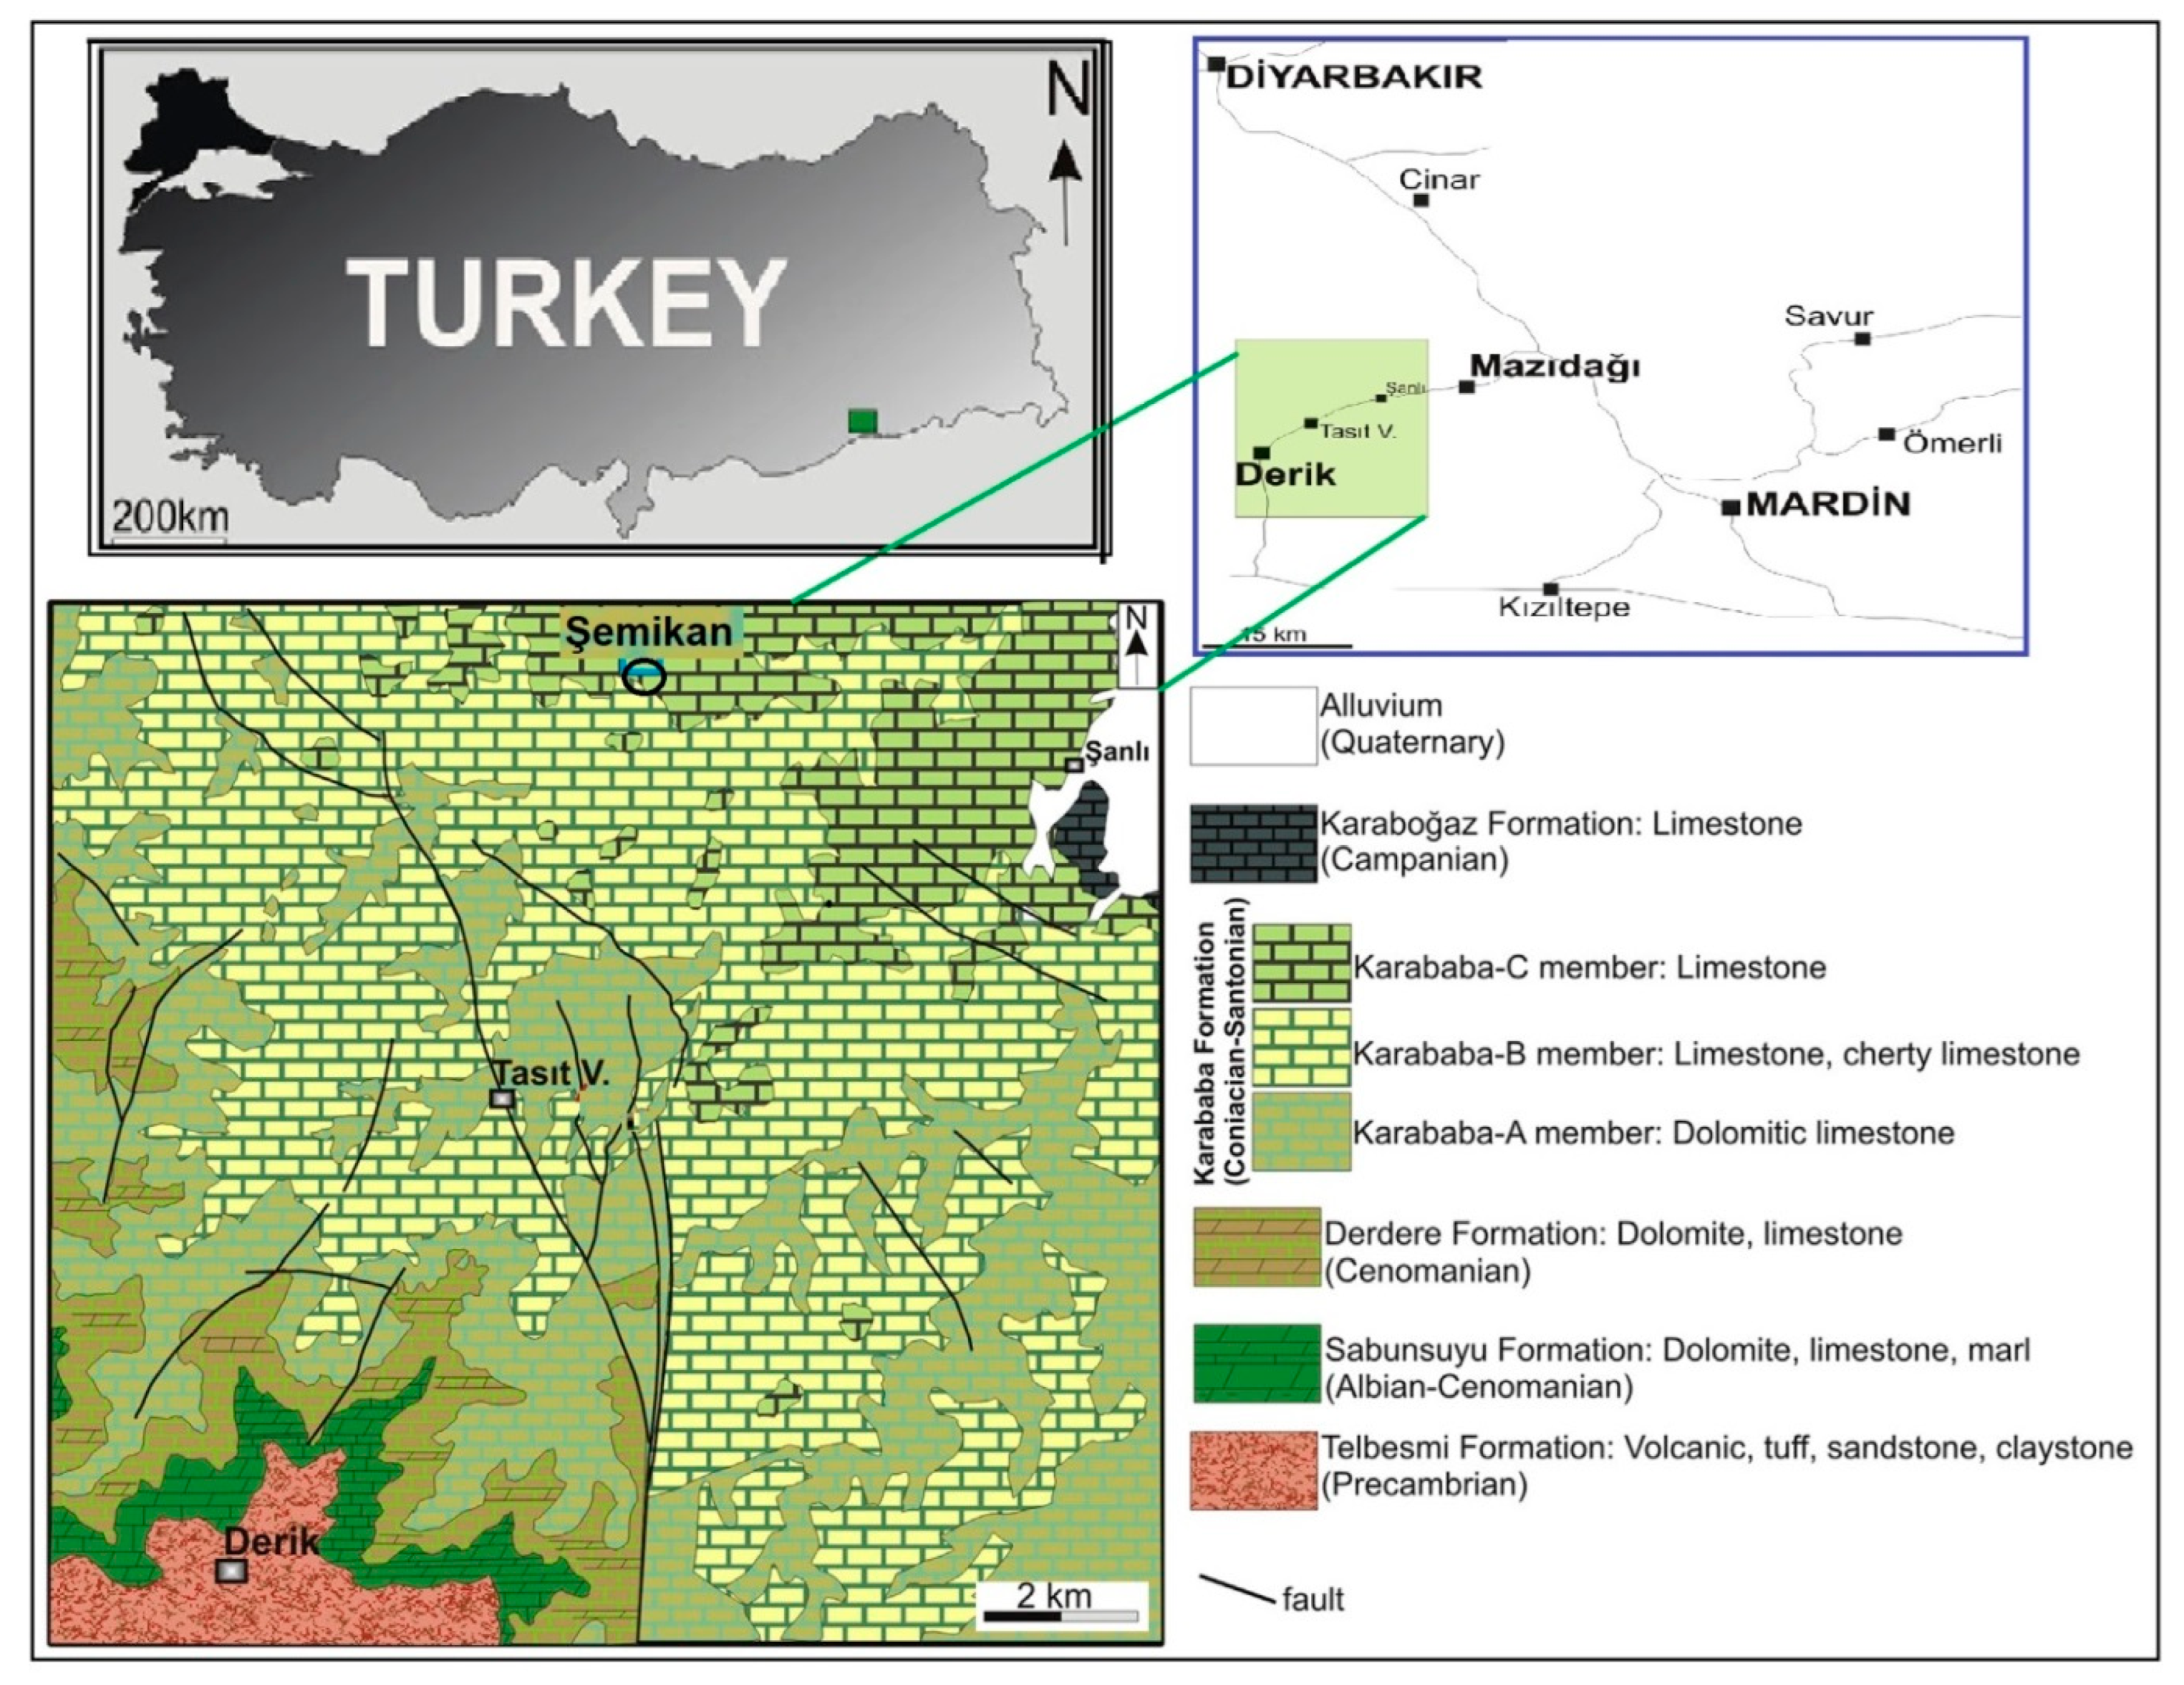
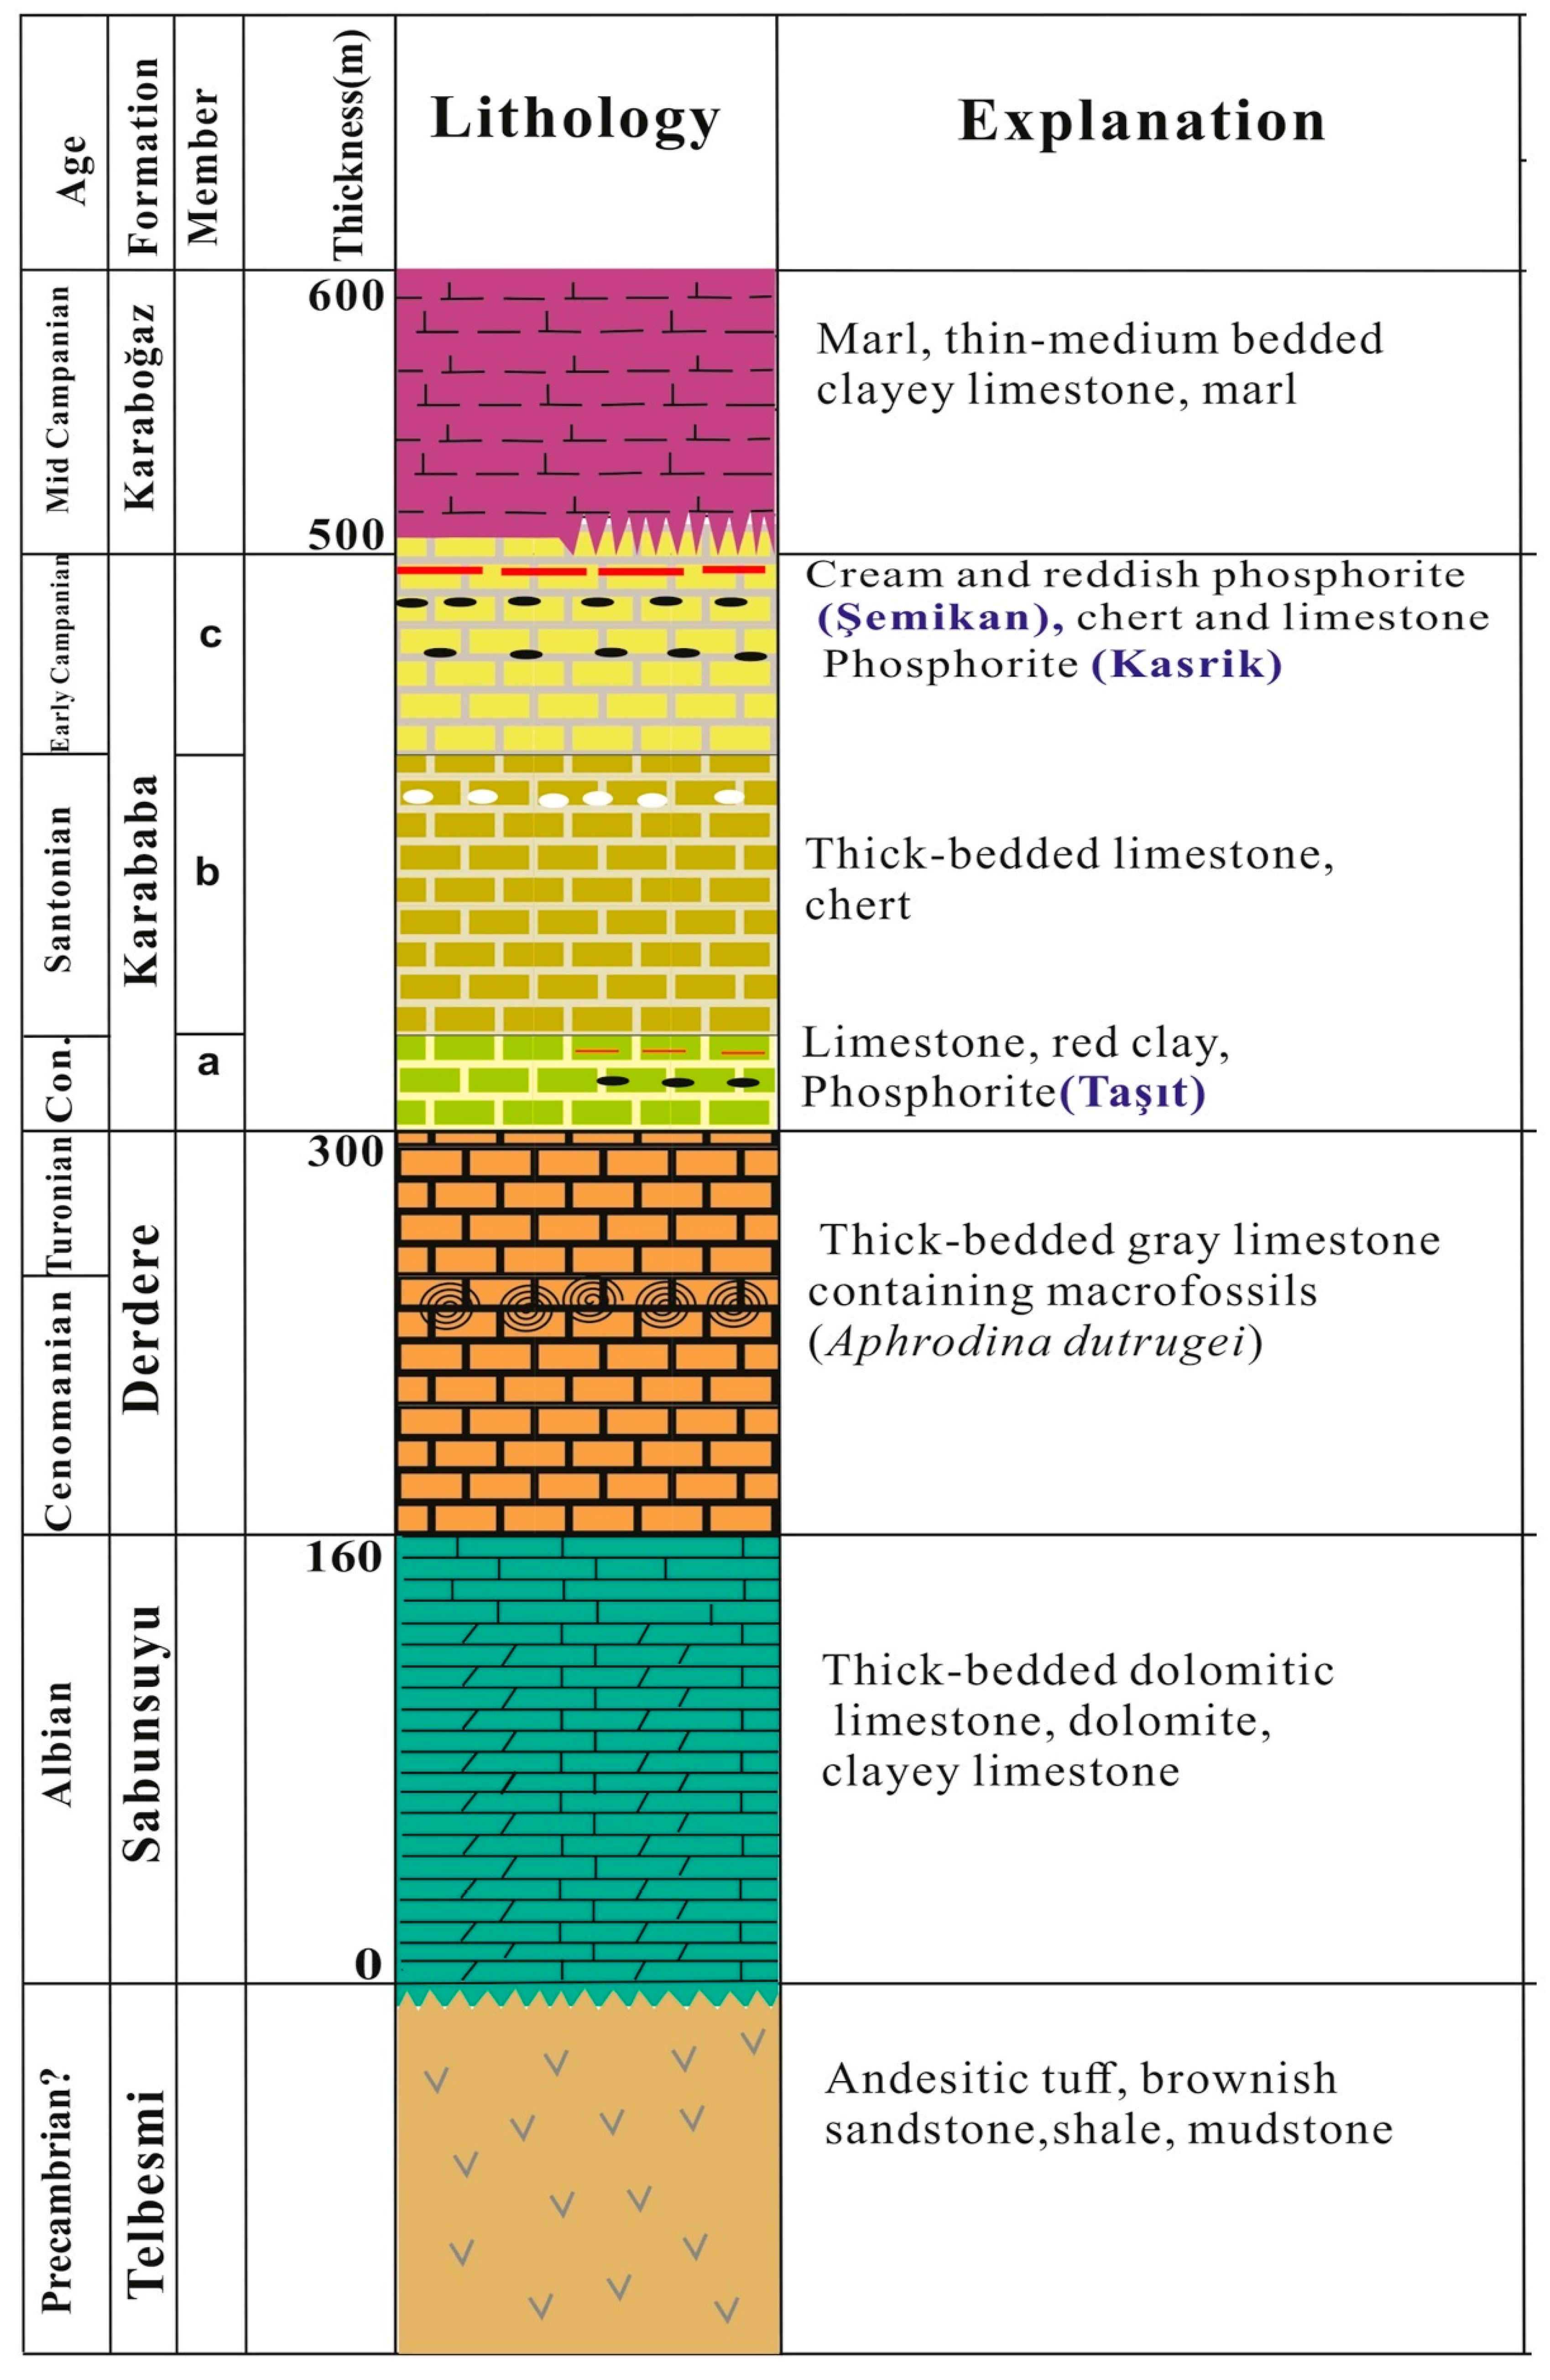
2. Geological Setting
3. Samples and Analytical Methods
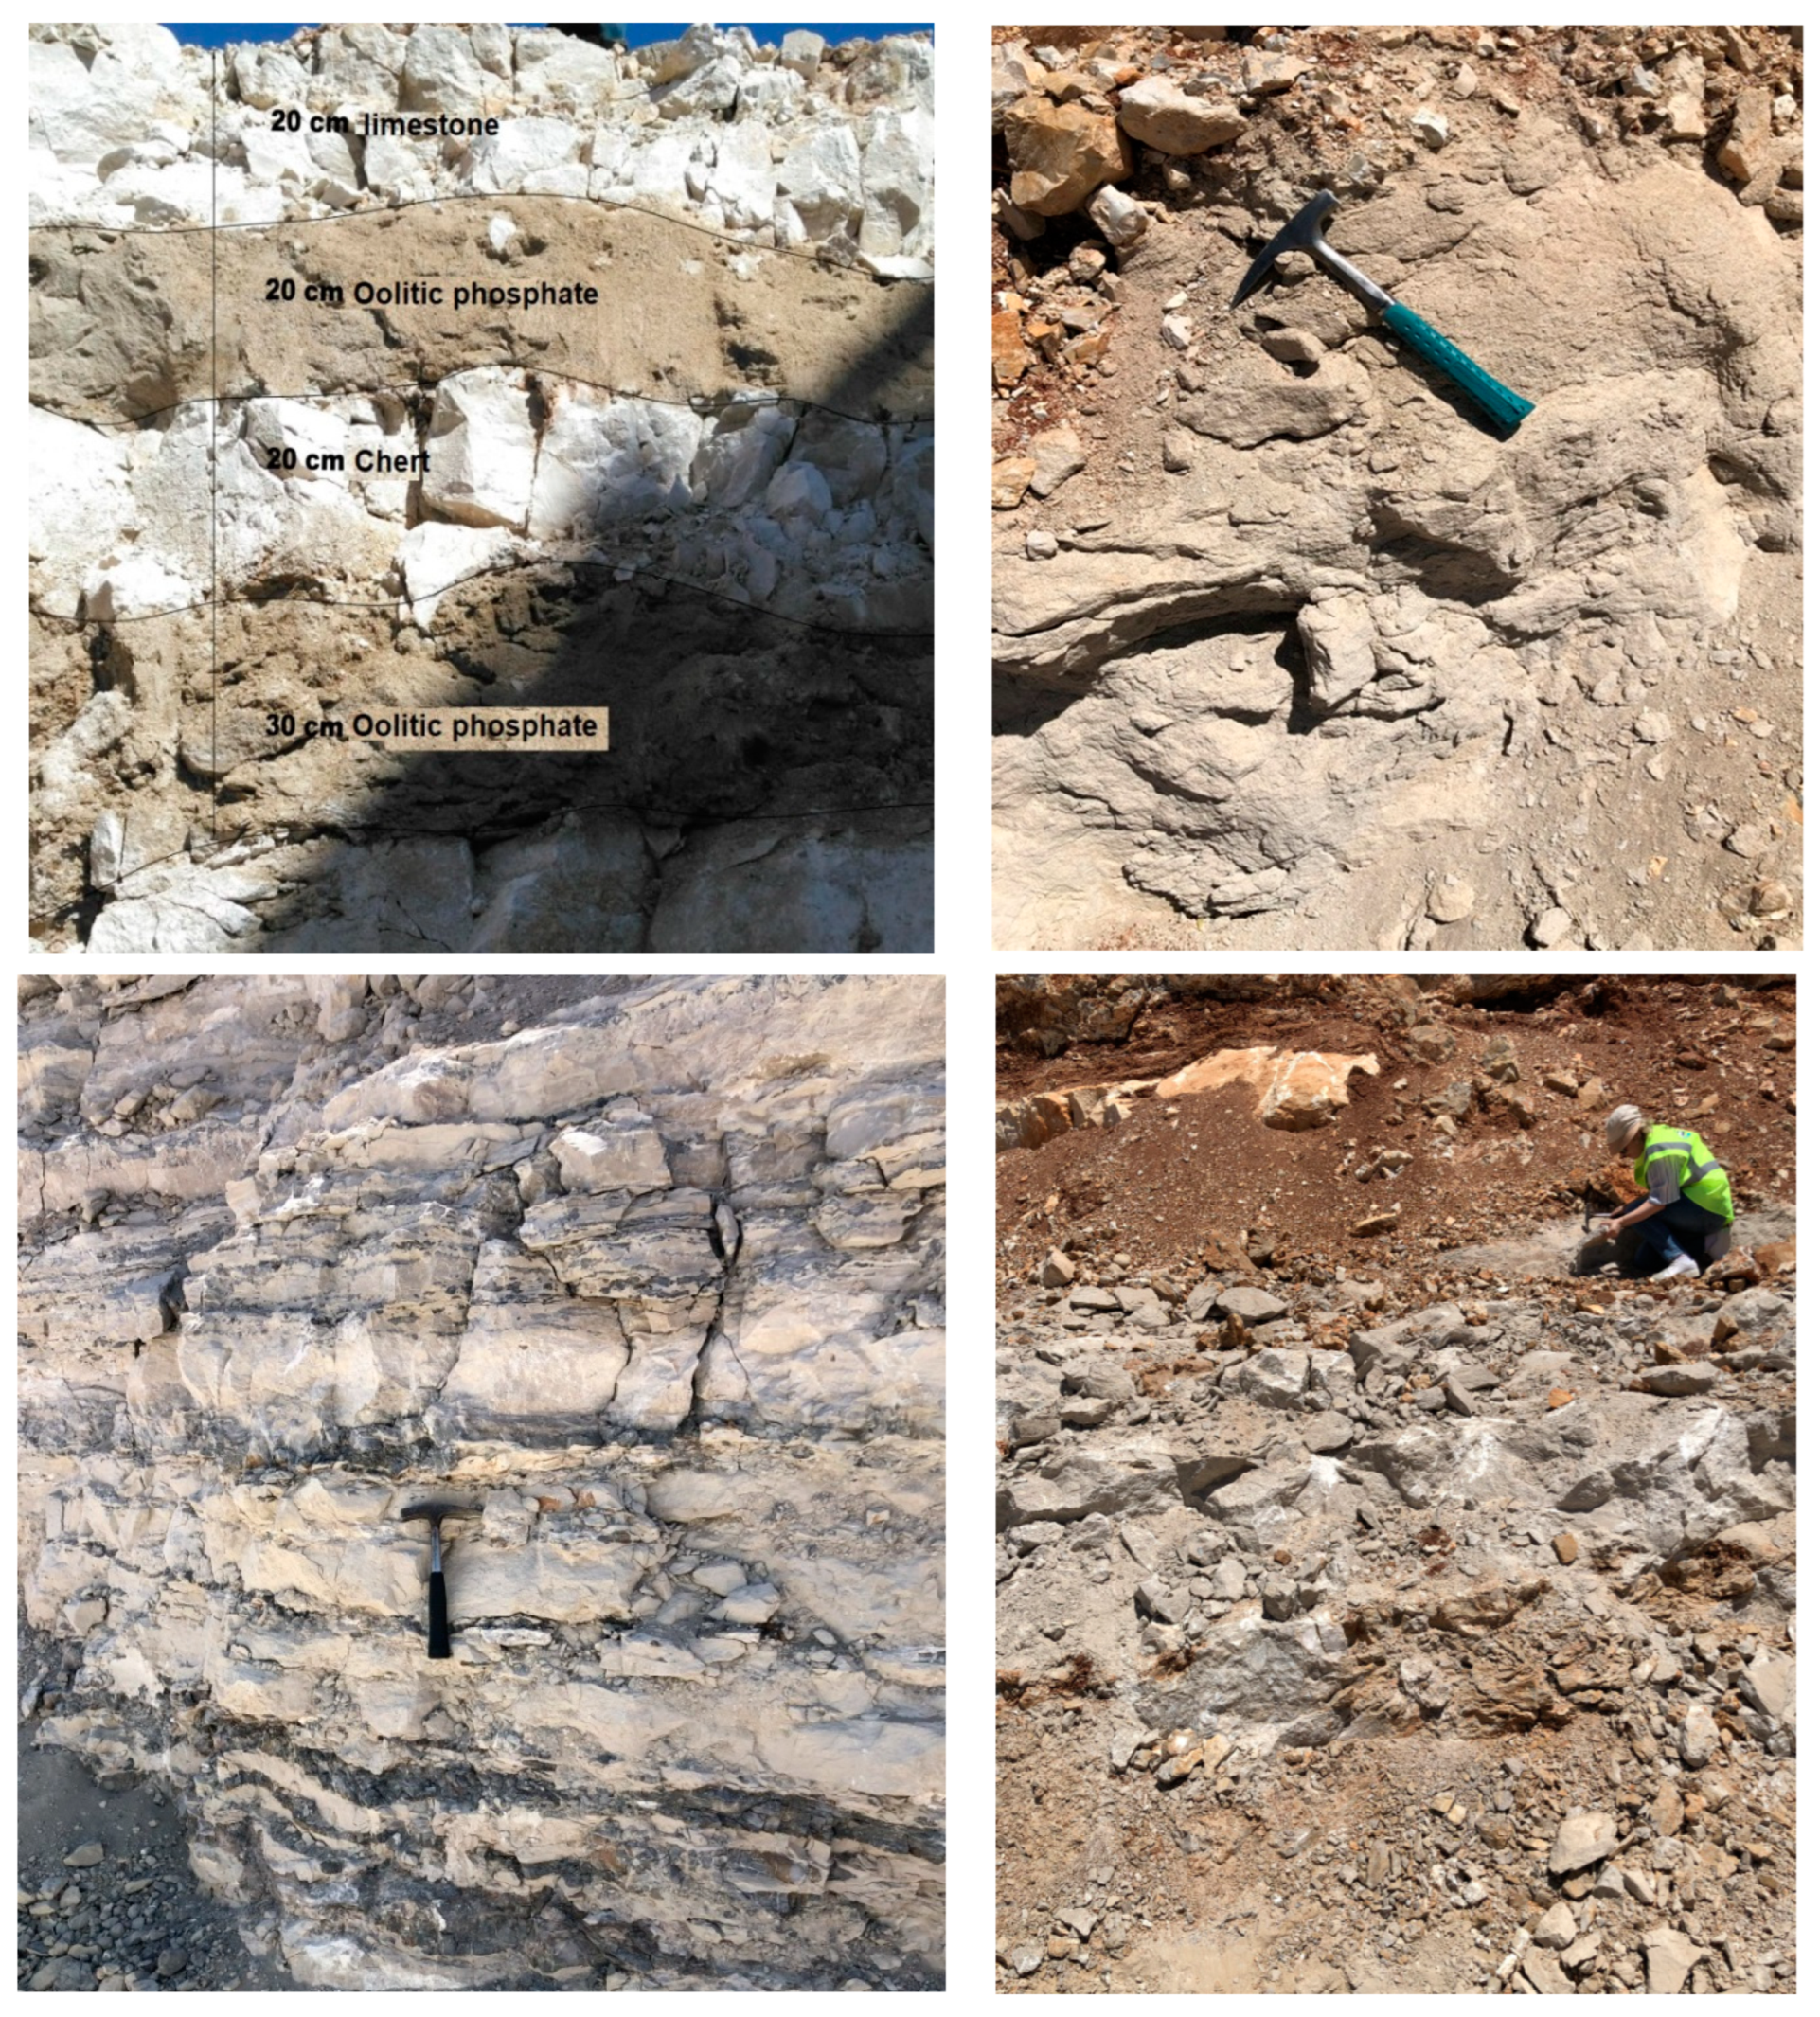
3.1. Samples
3.2. Analytical Methods
3.3. Quality Assurance
4. Results and Discussion
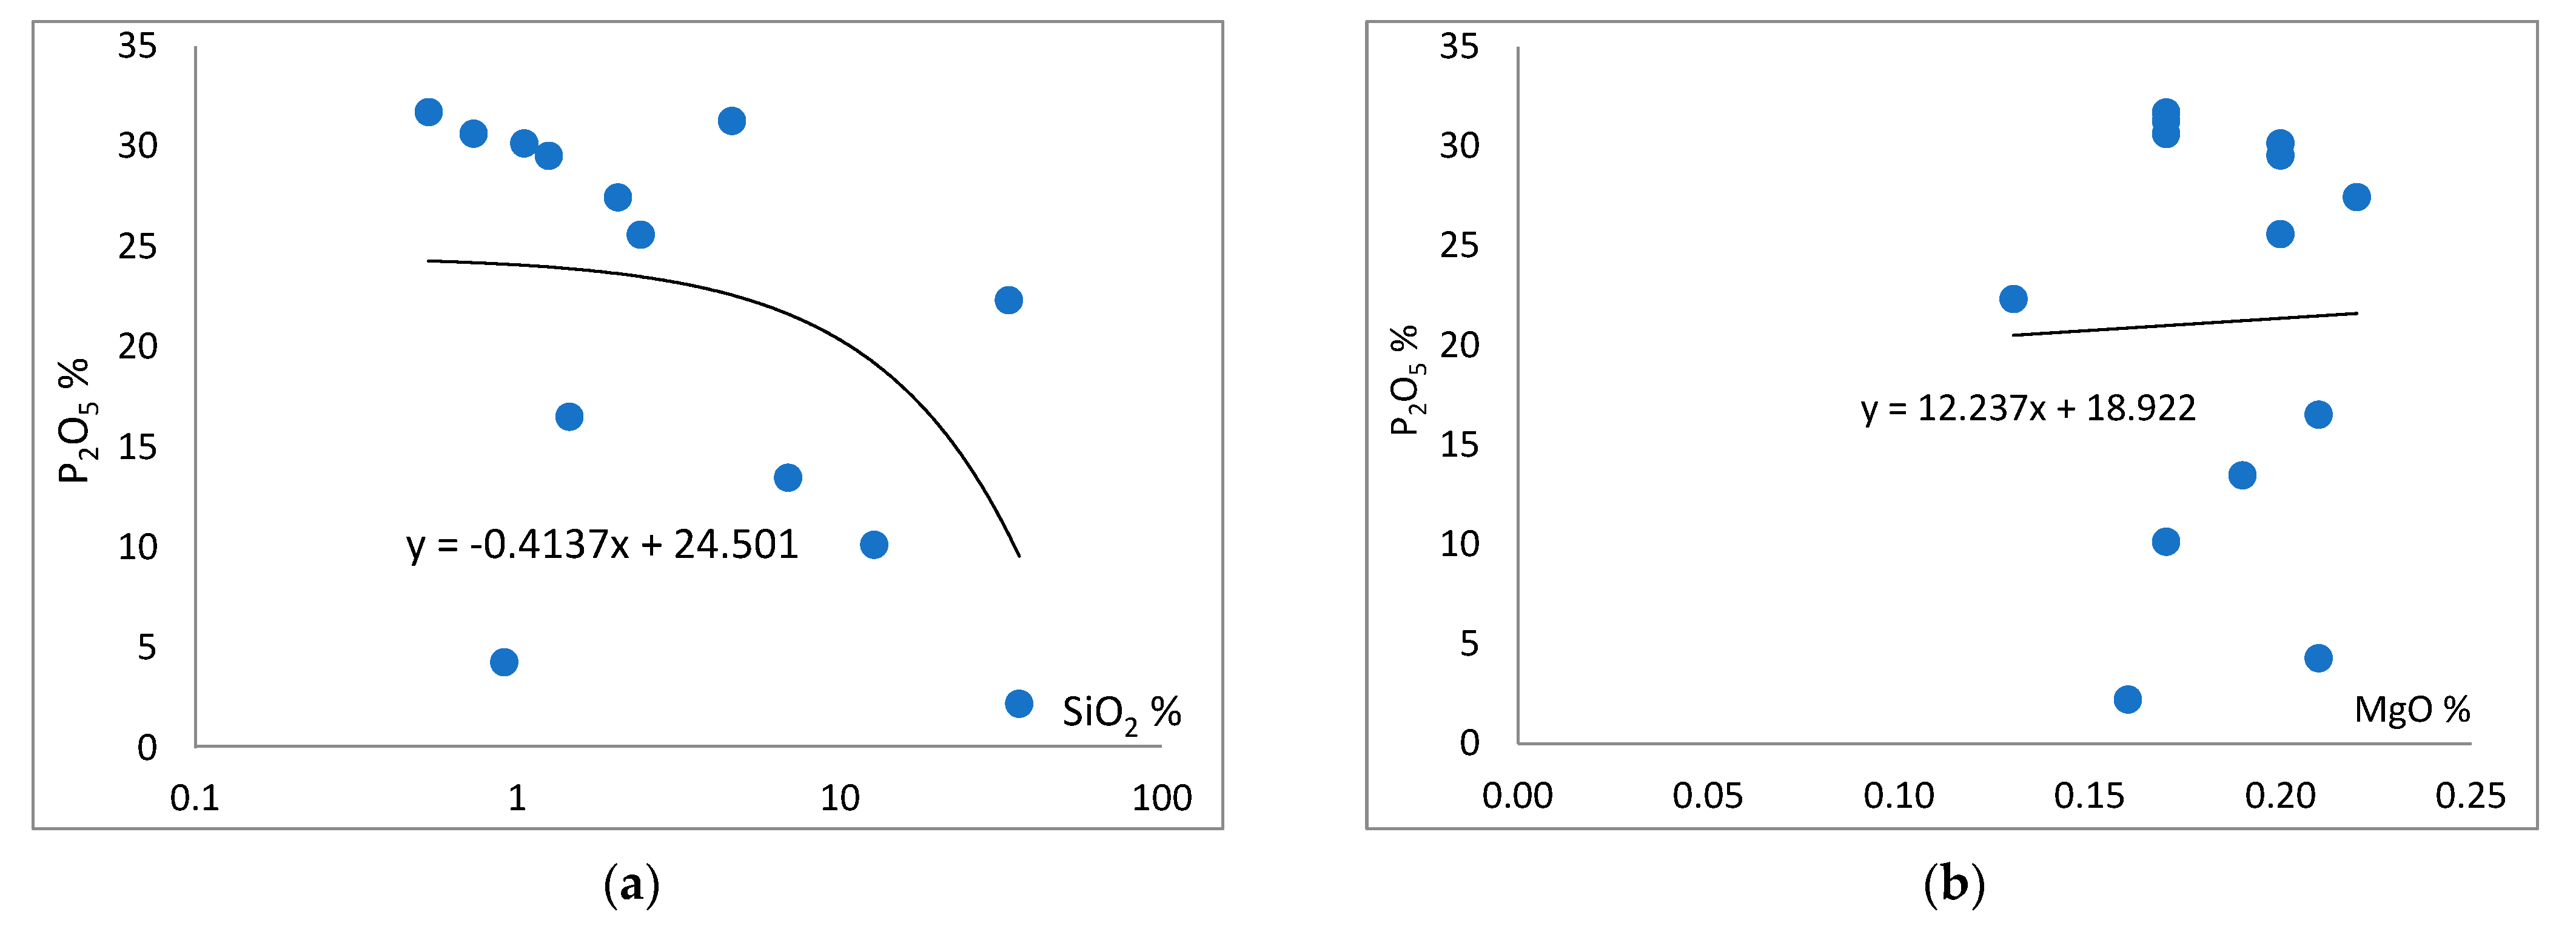
4.1. Major Oxide Geochemistry
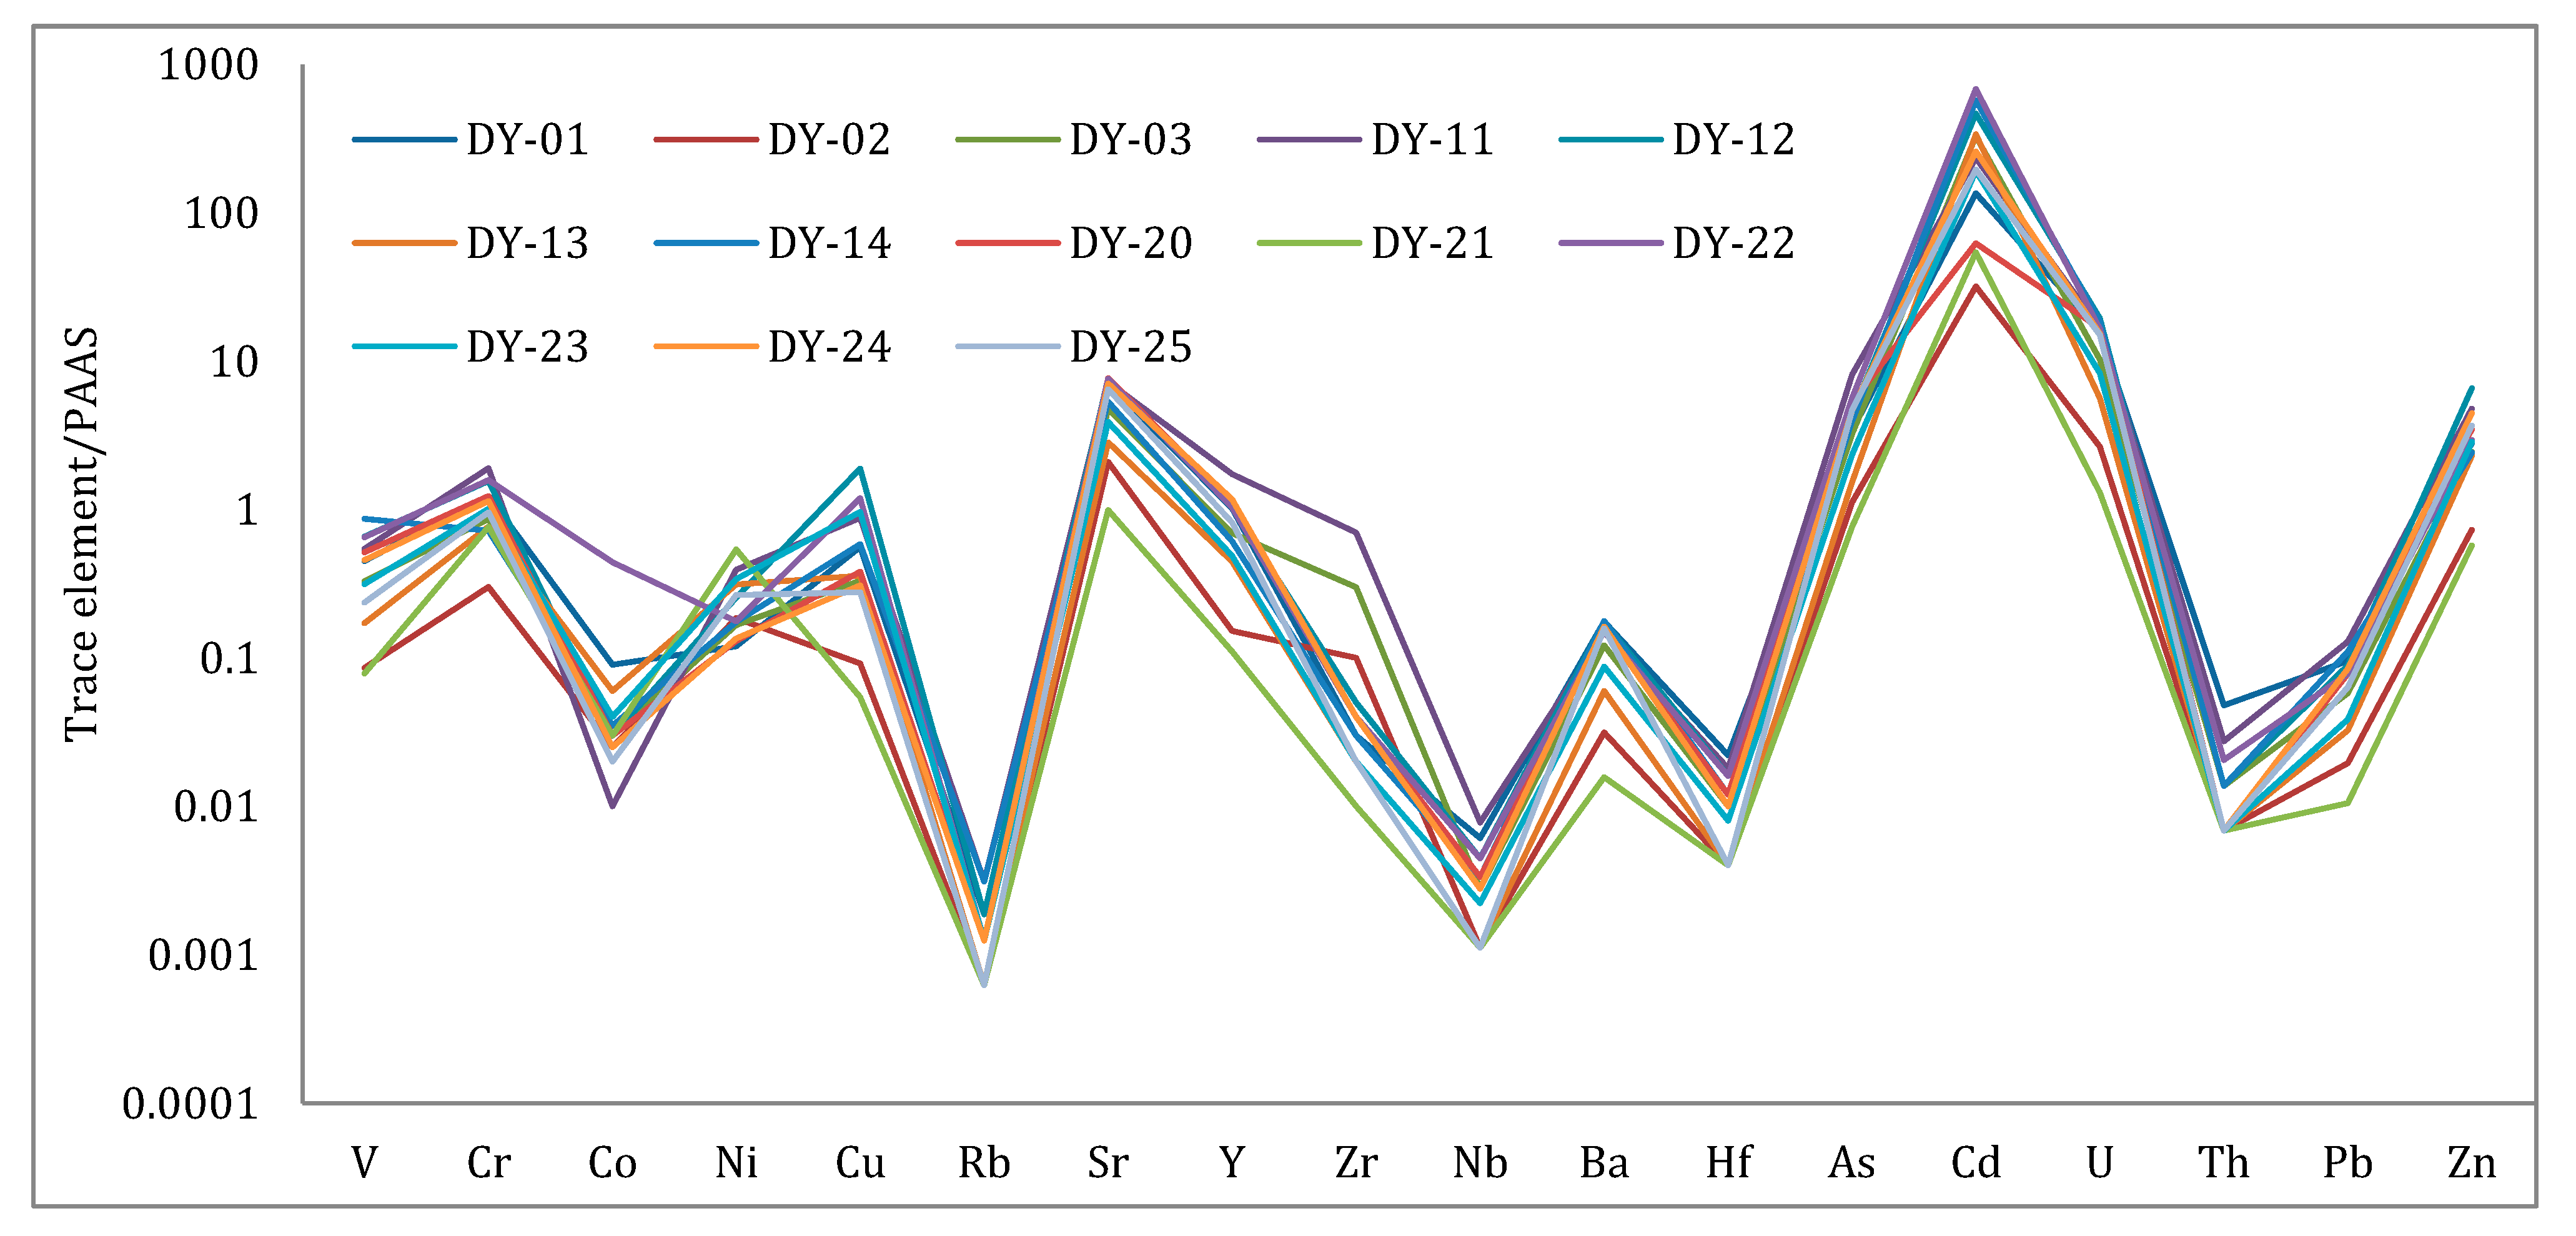
4.2. Trace Element Geochemistry
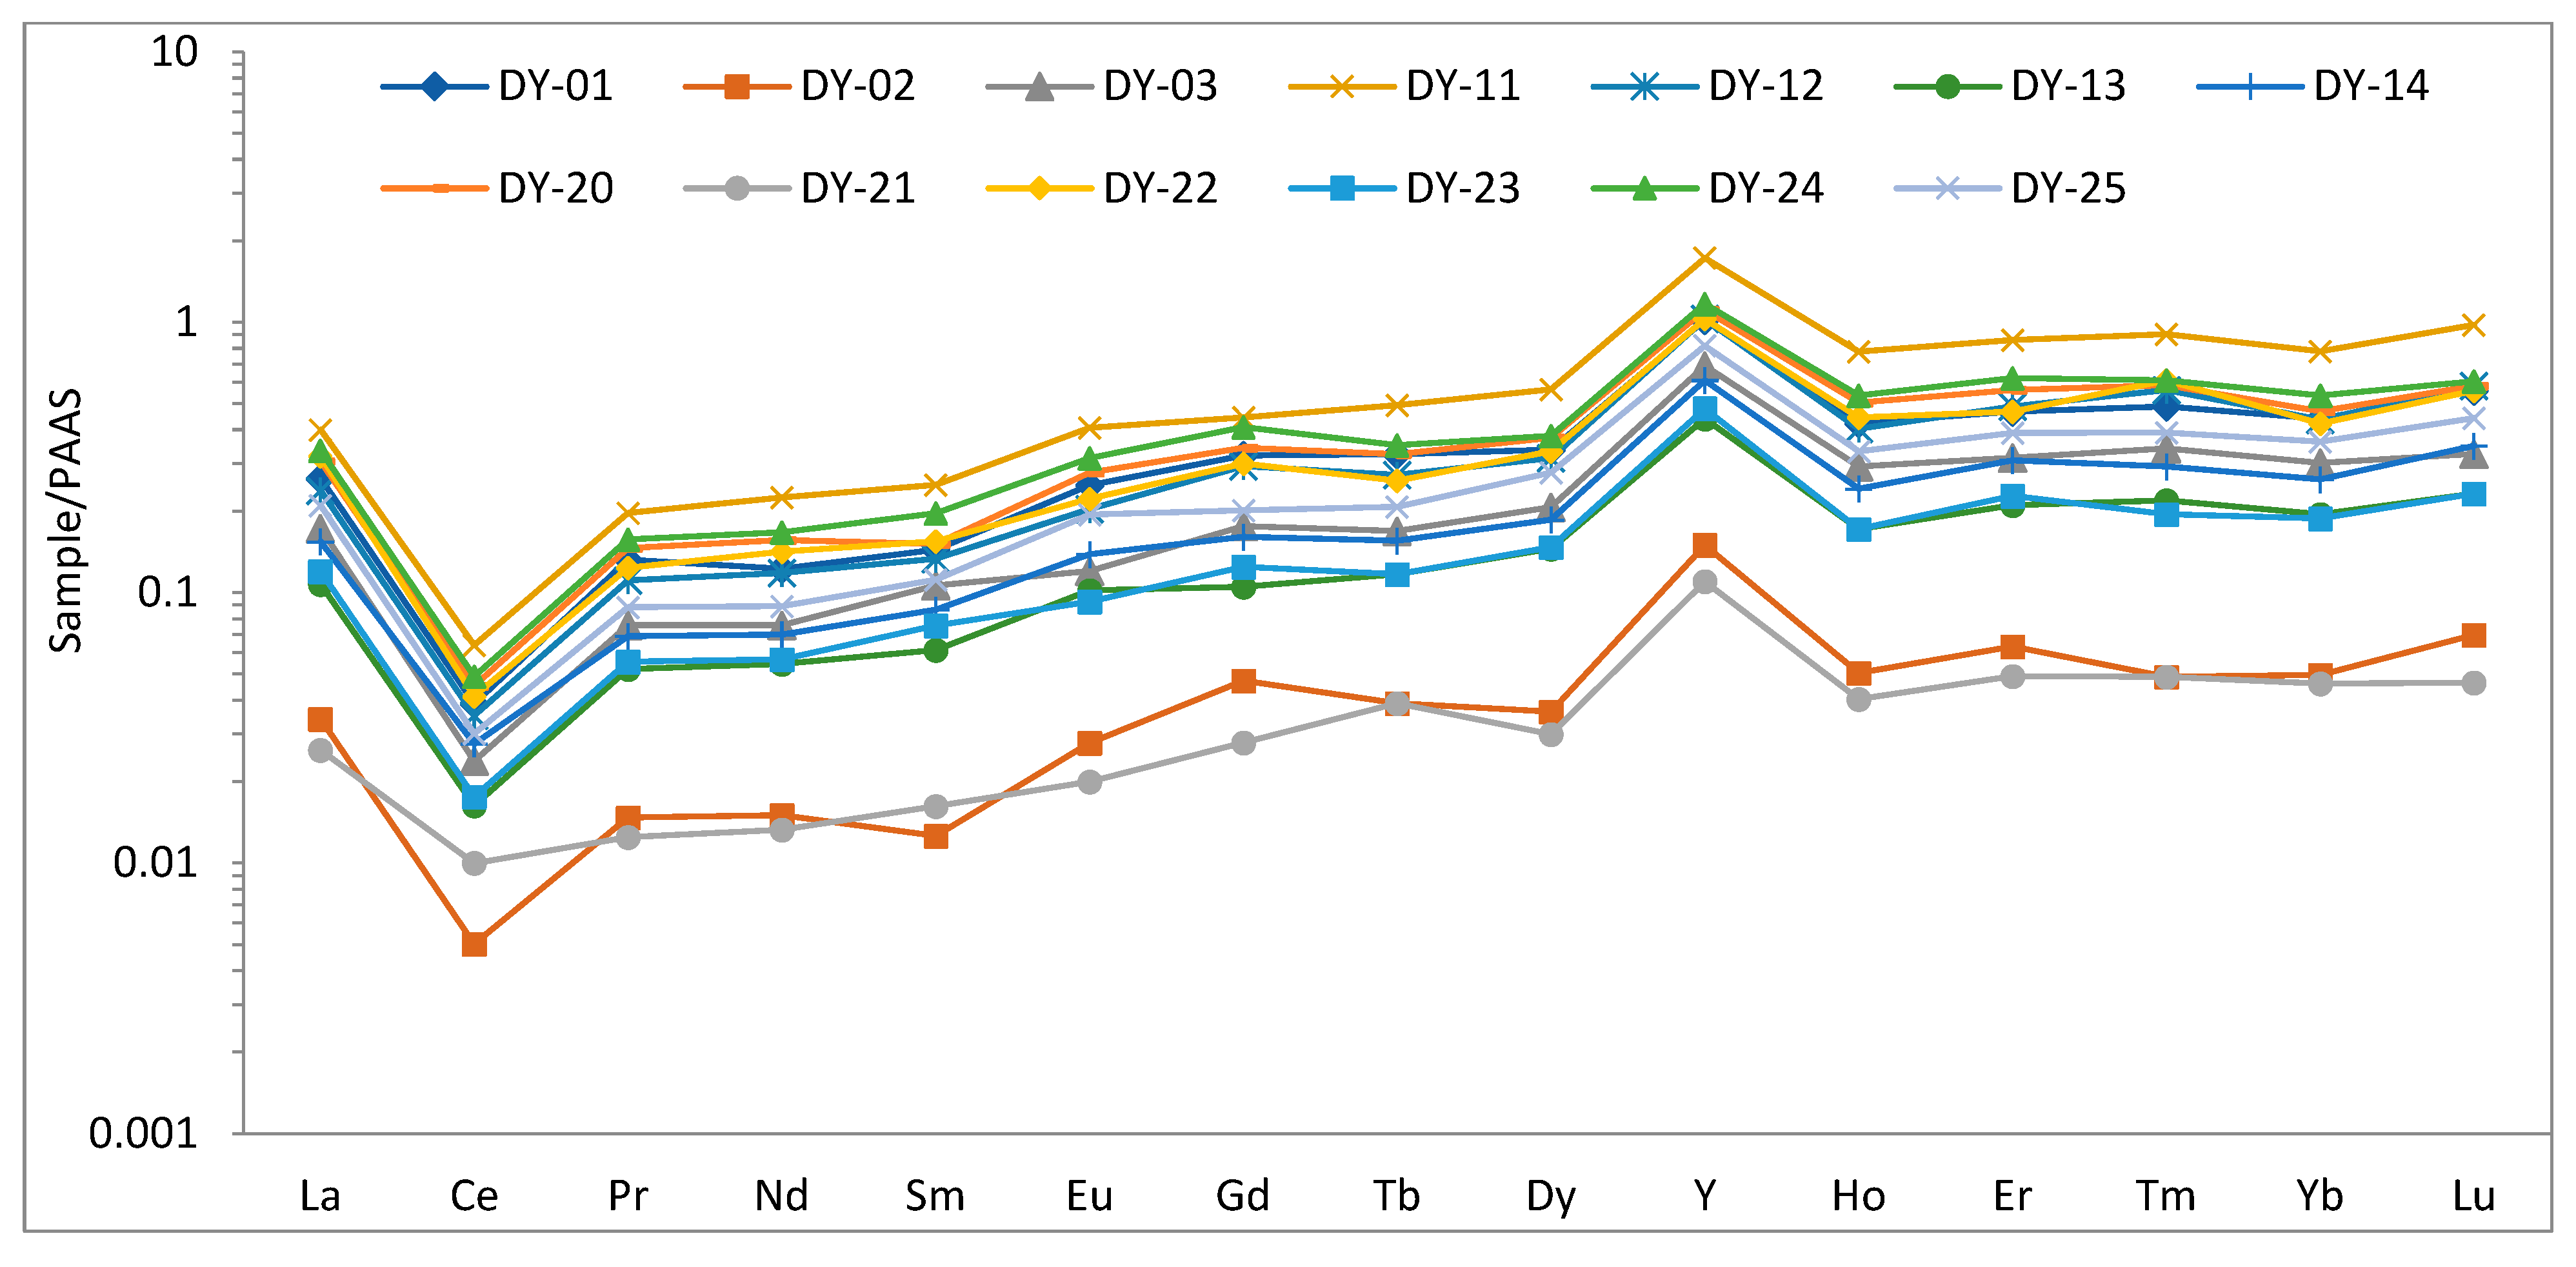
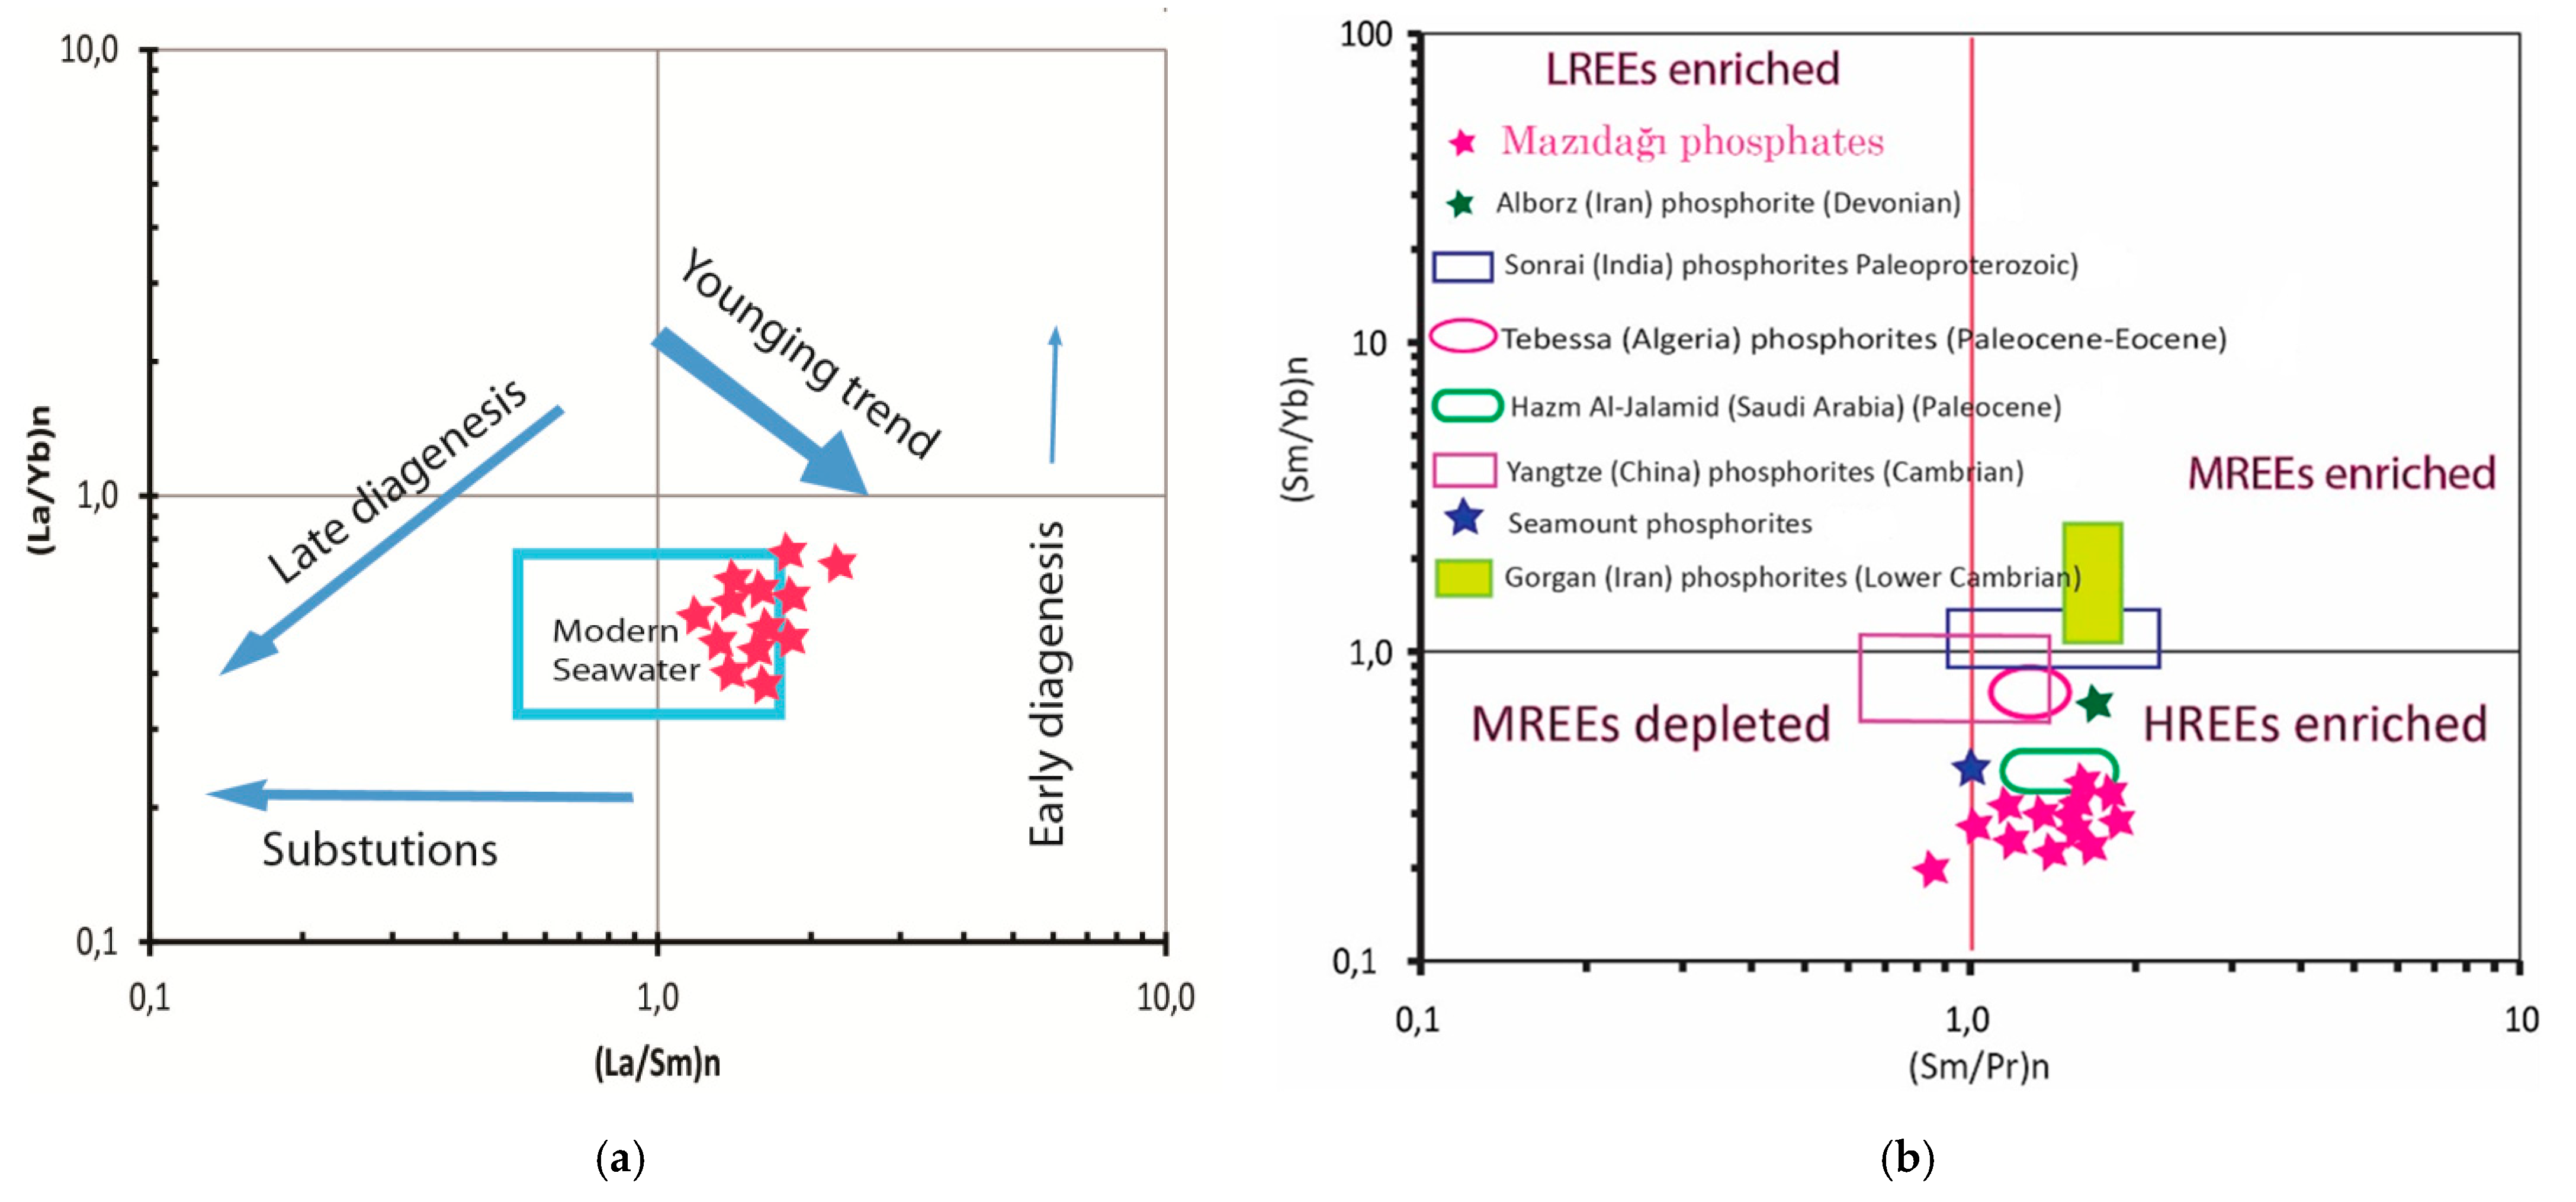
4.3. Rare Earth Element Geochemistry
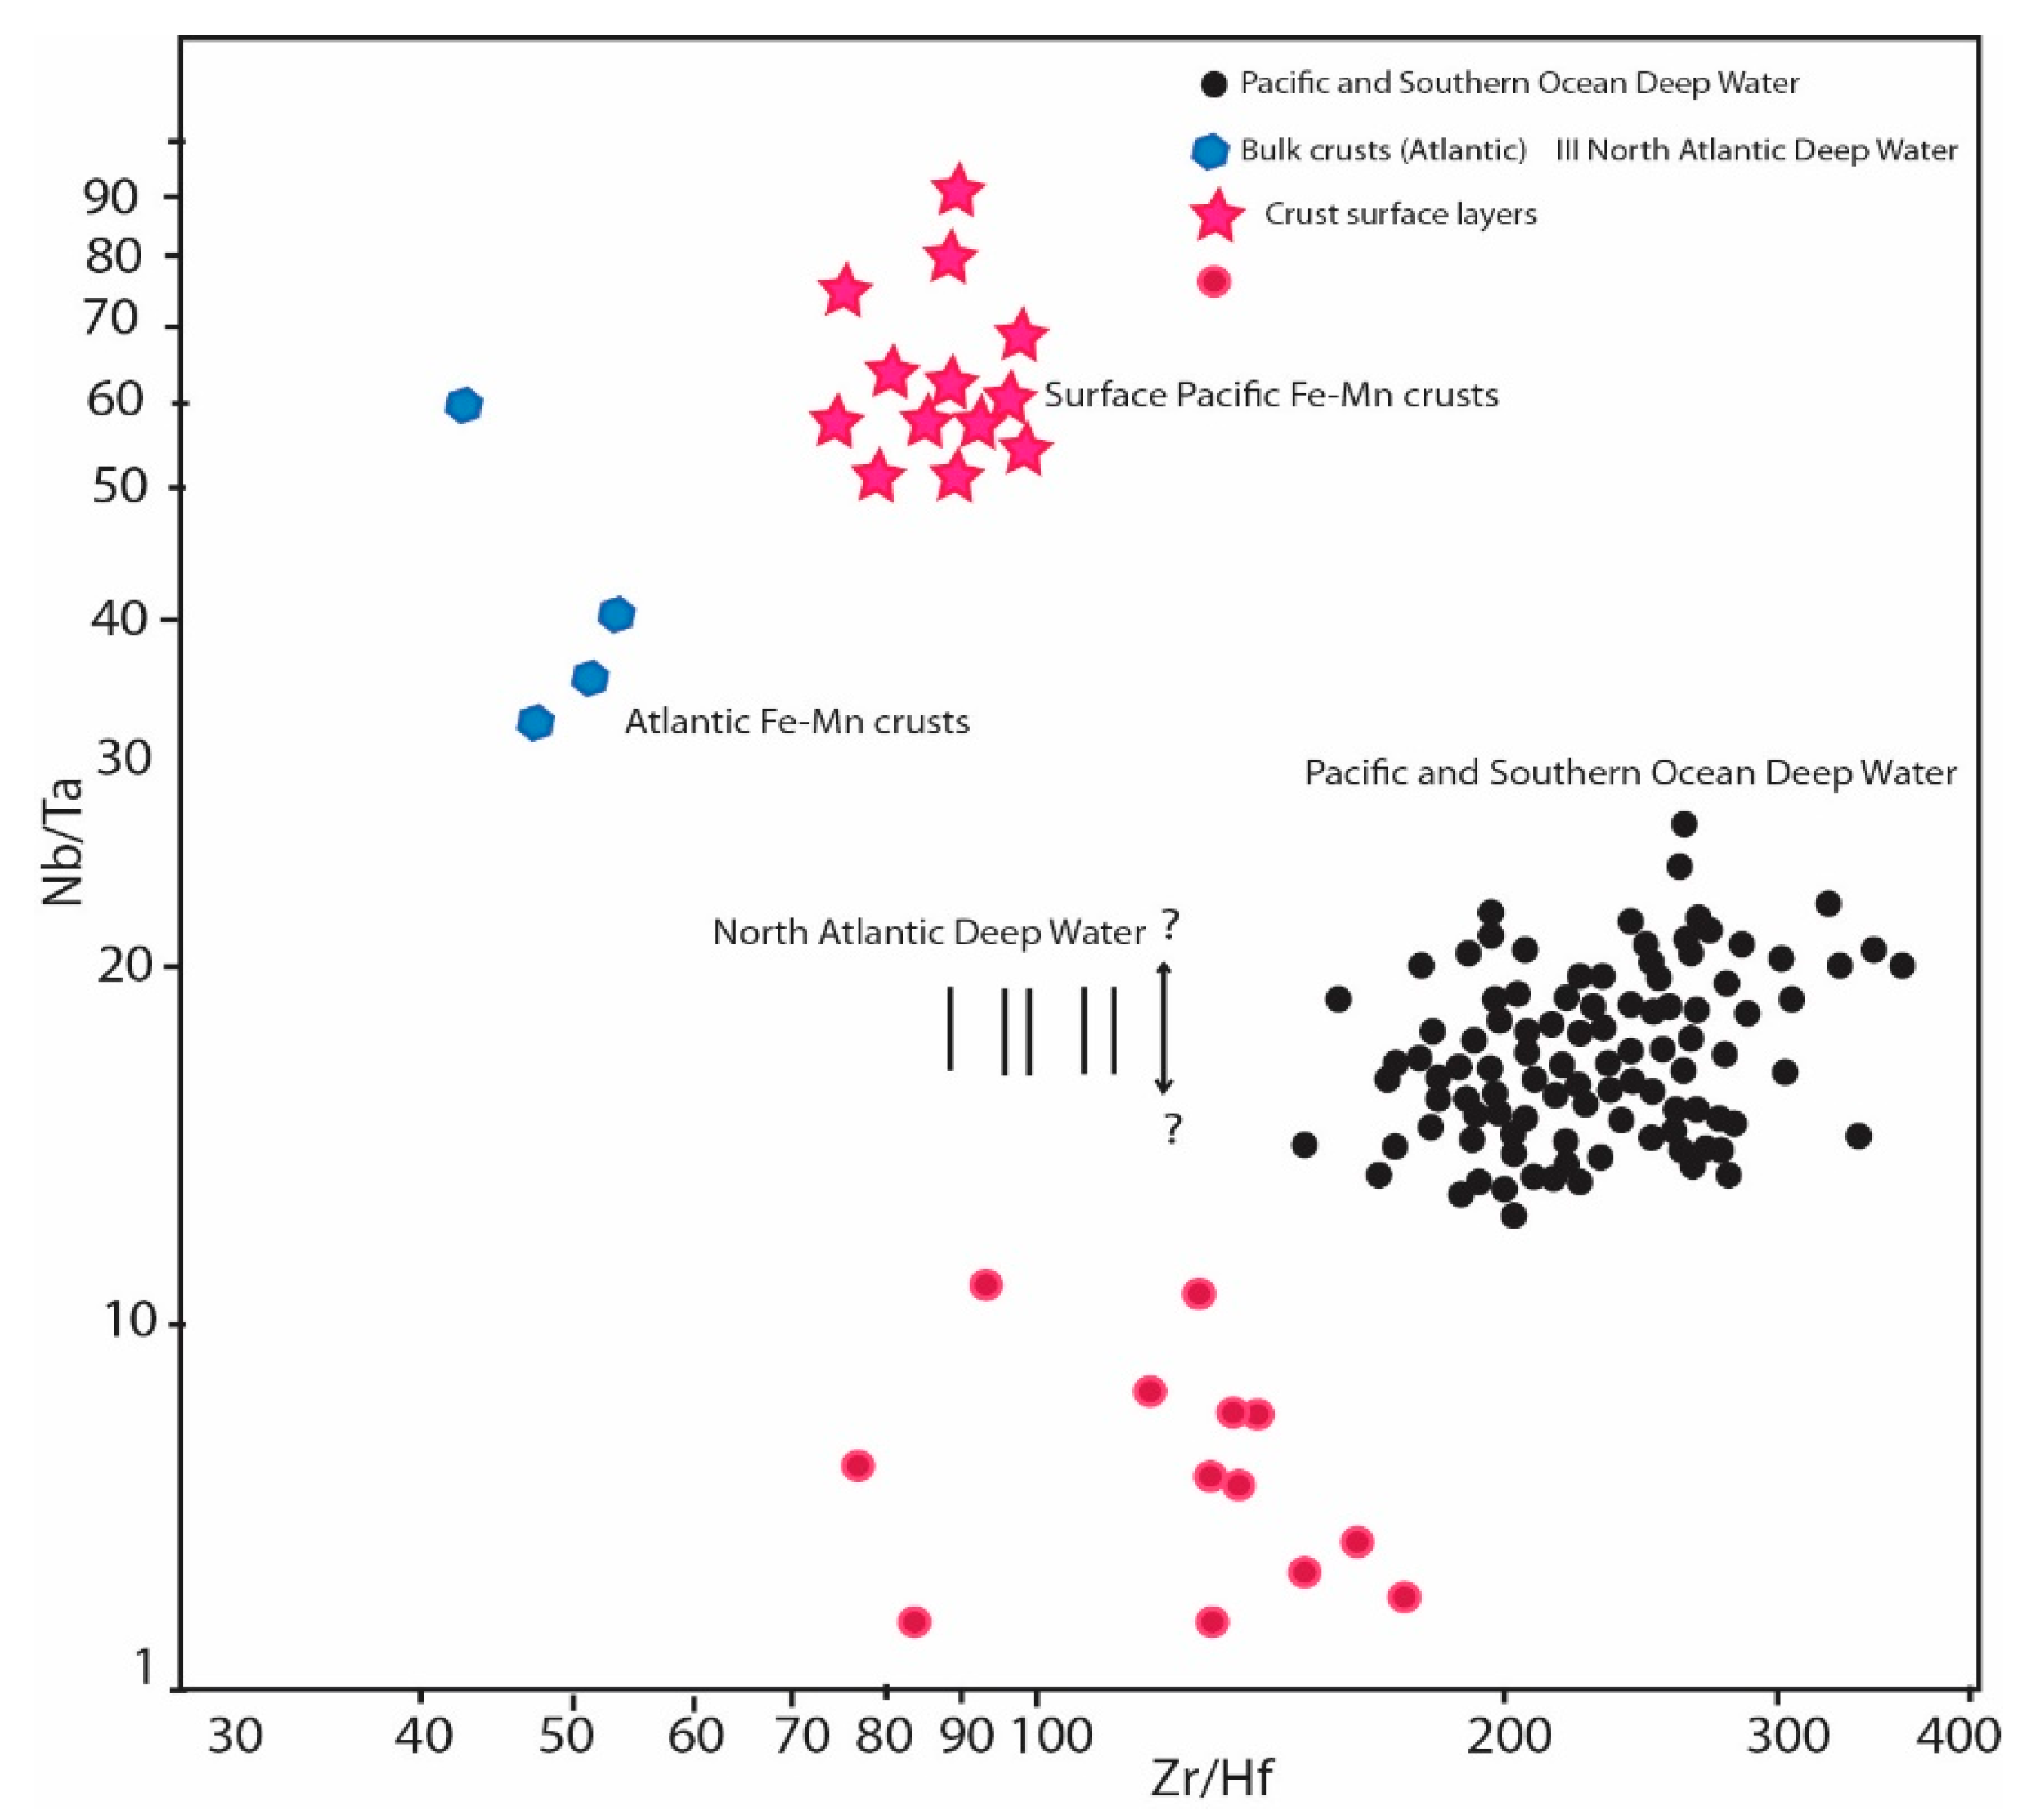
4.4. Source of REE Enrichment in Phosphate Samples
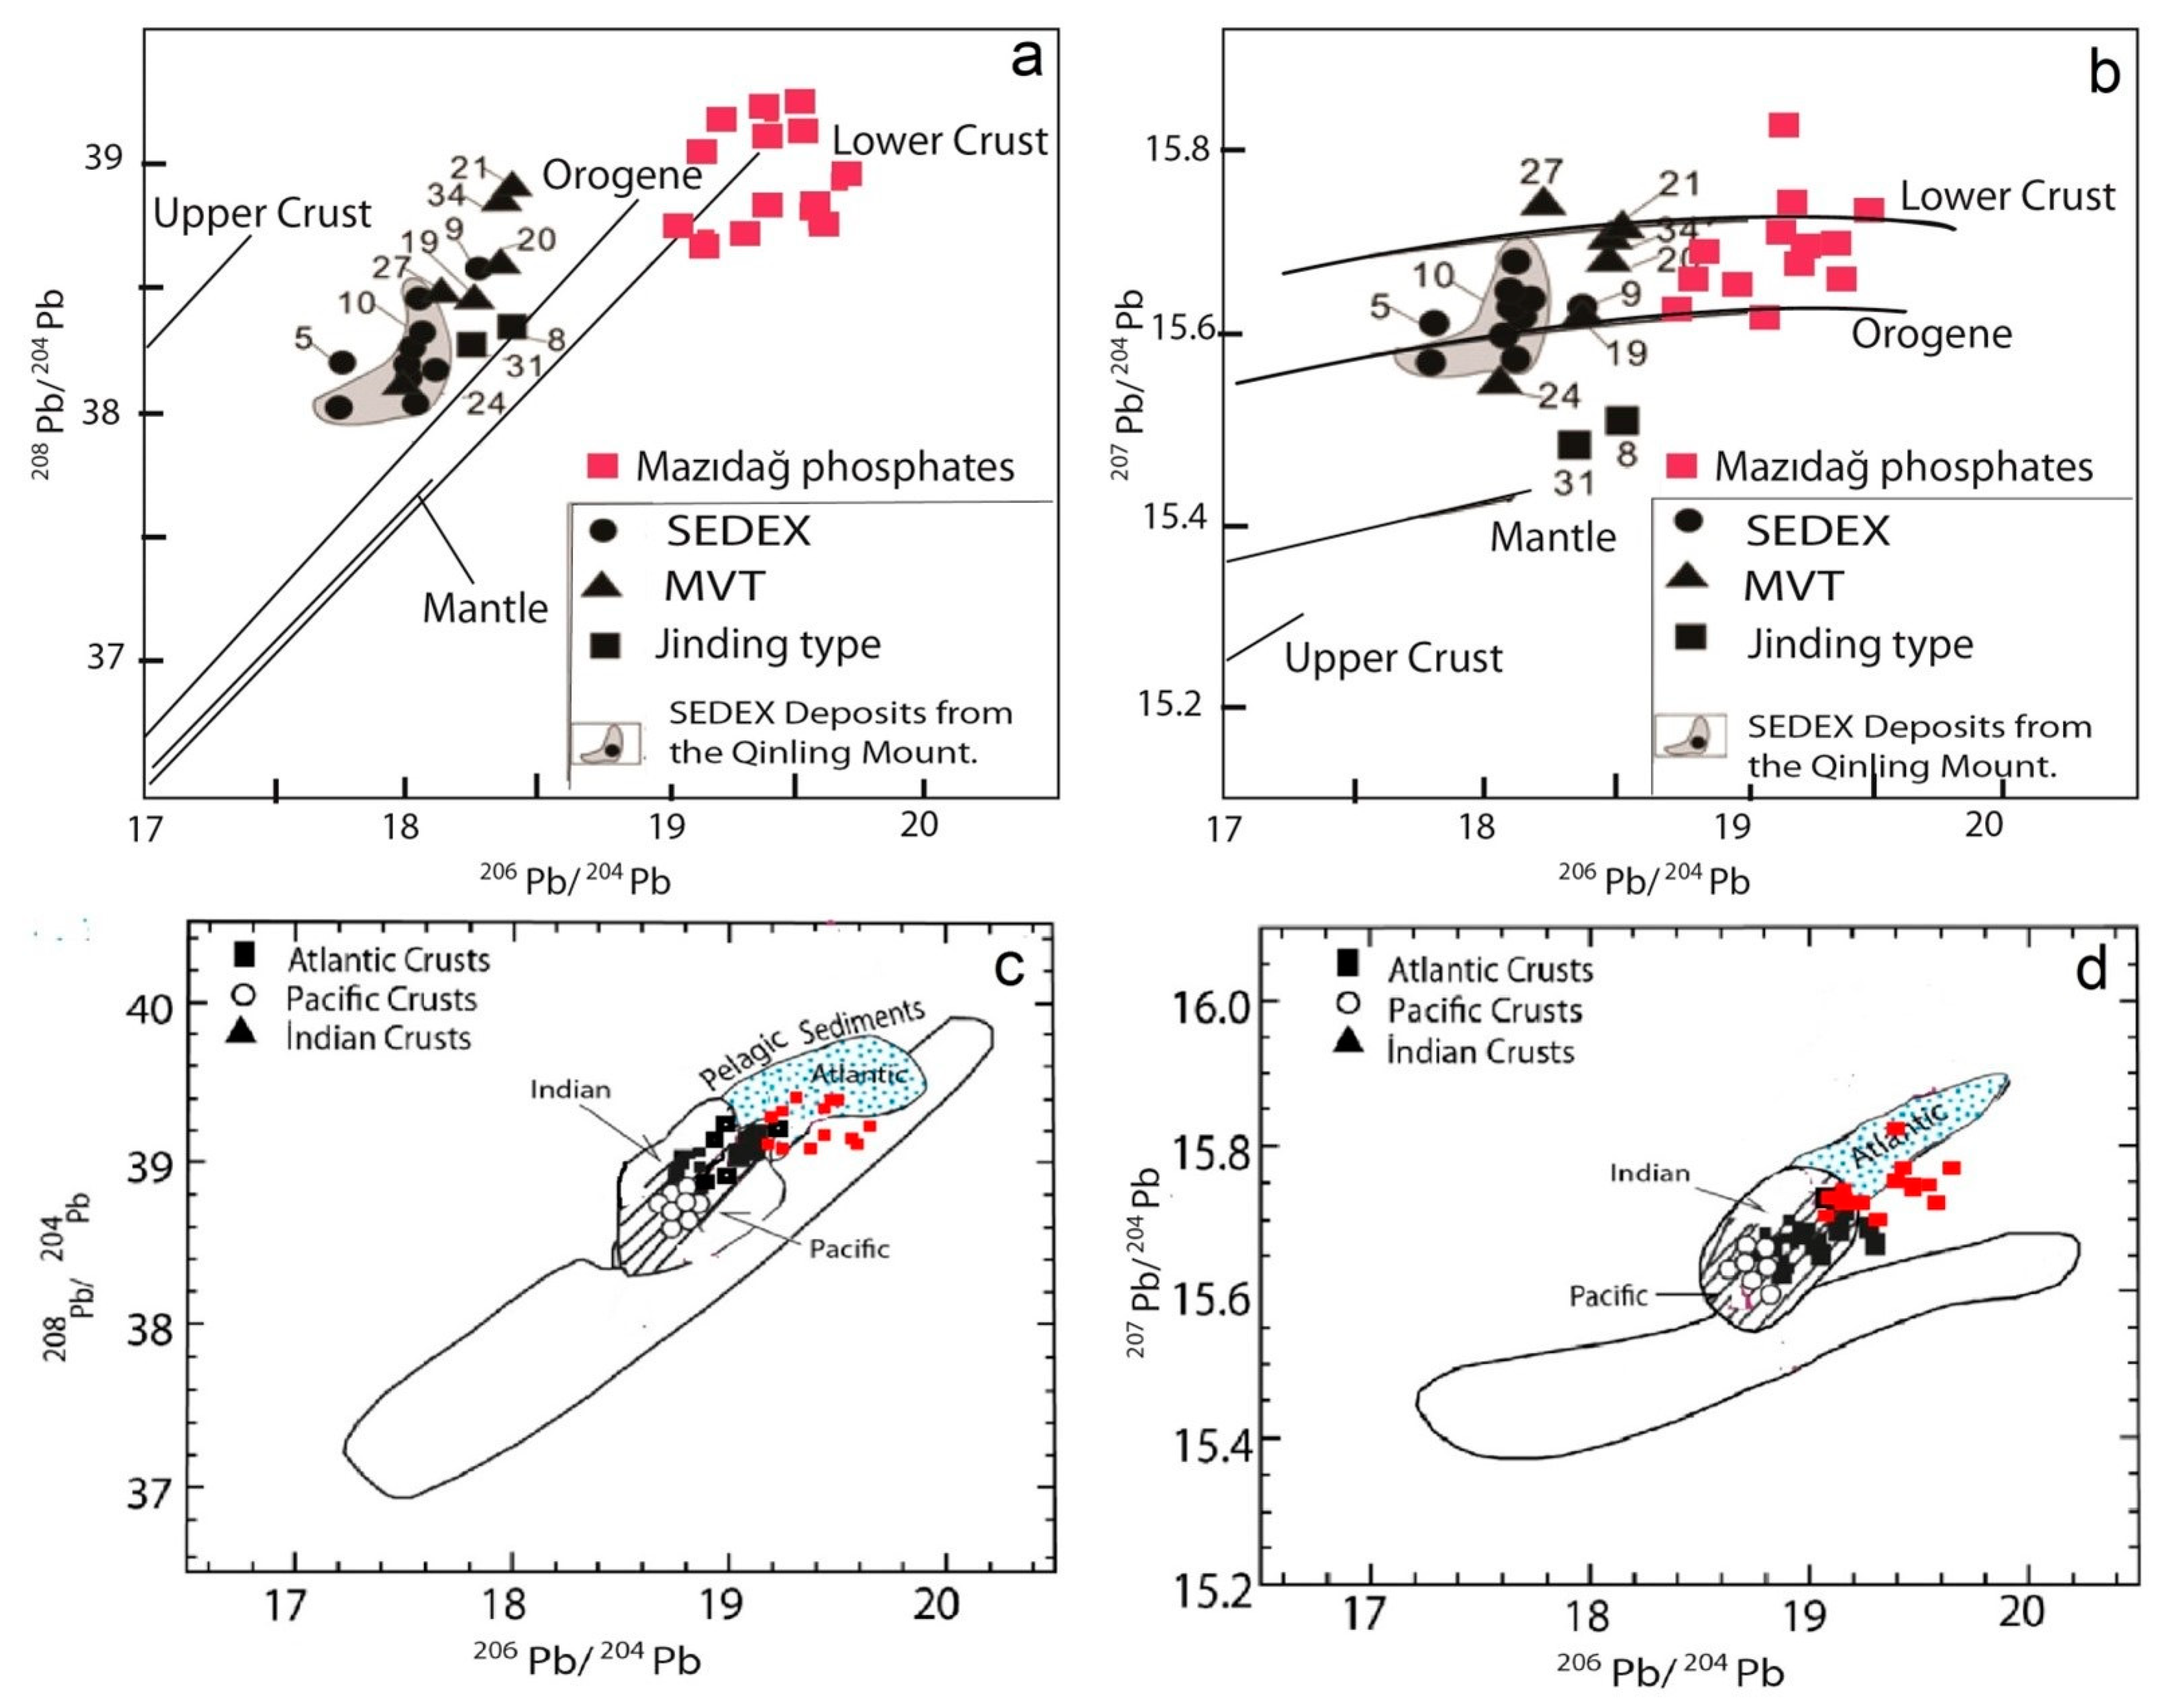
4.5. Pb Isotope Geochemistry
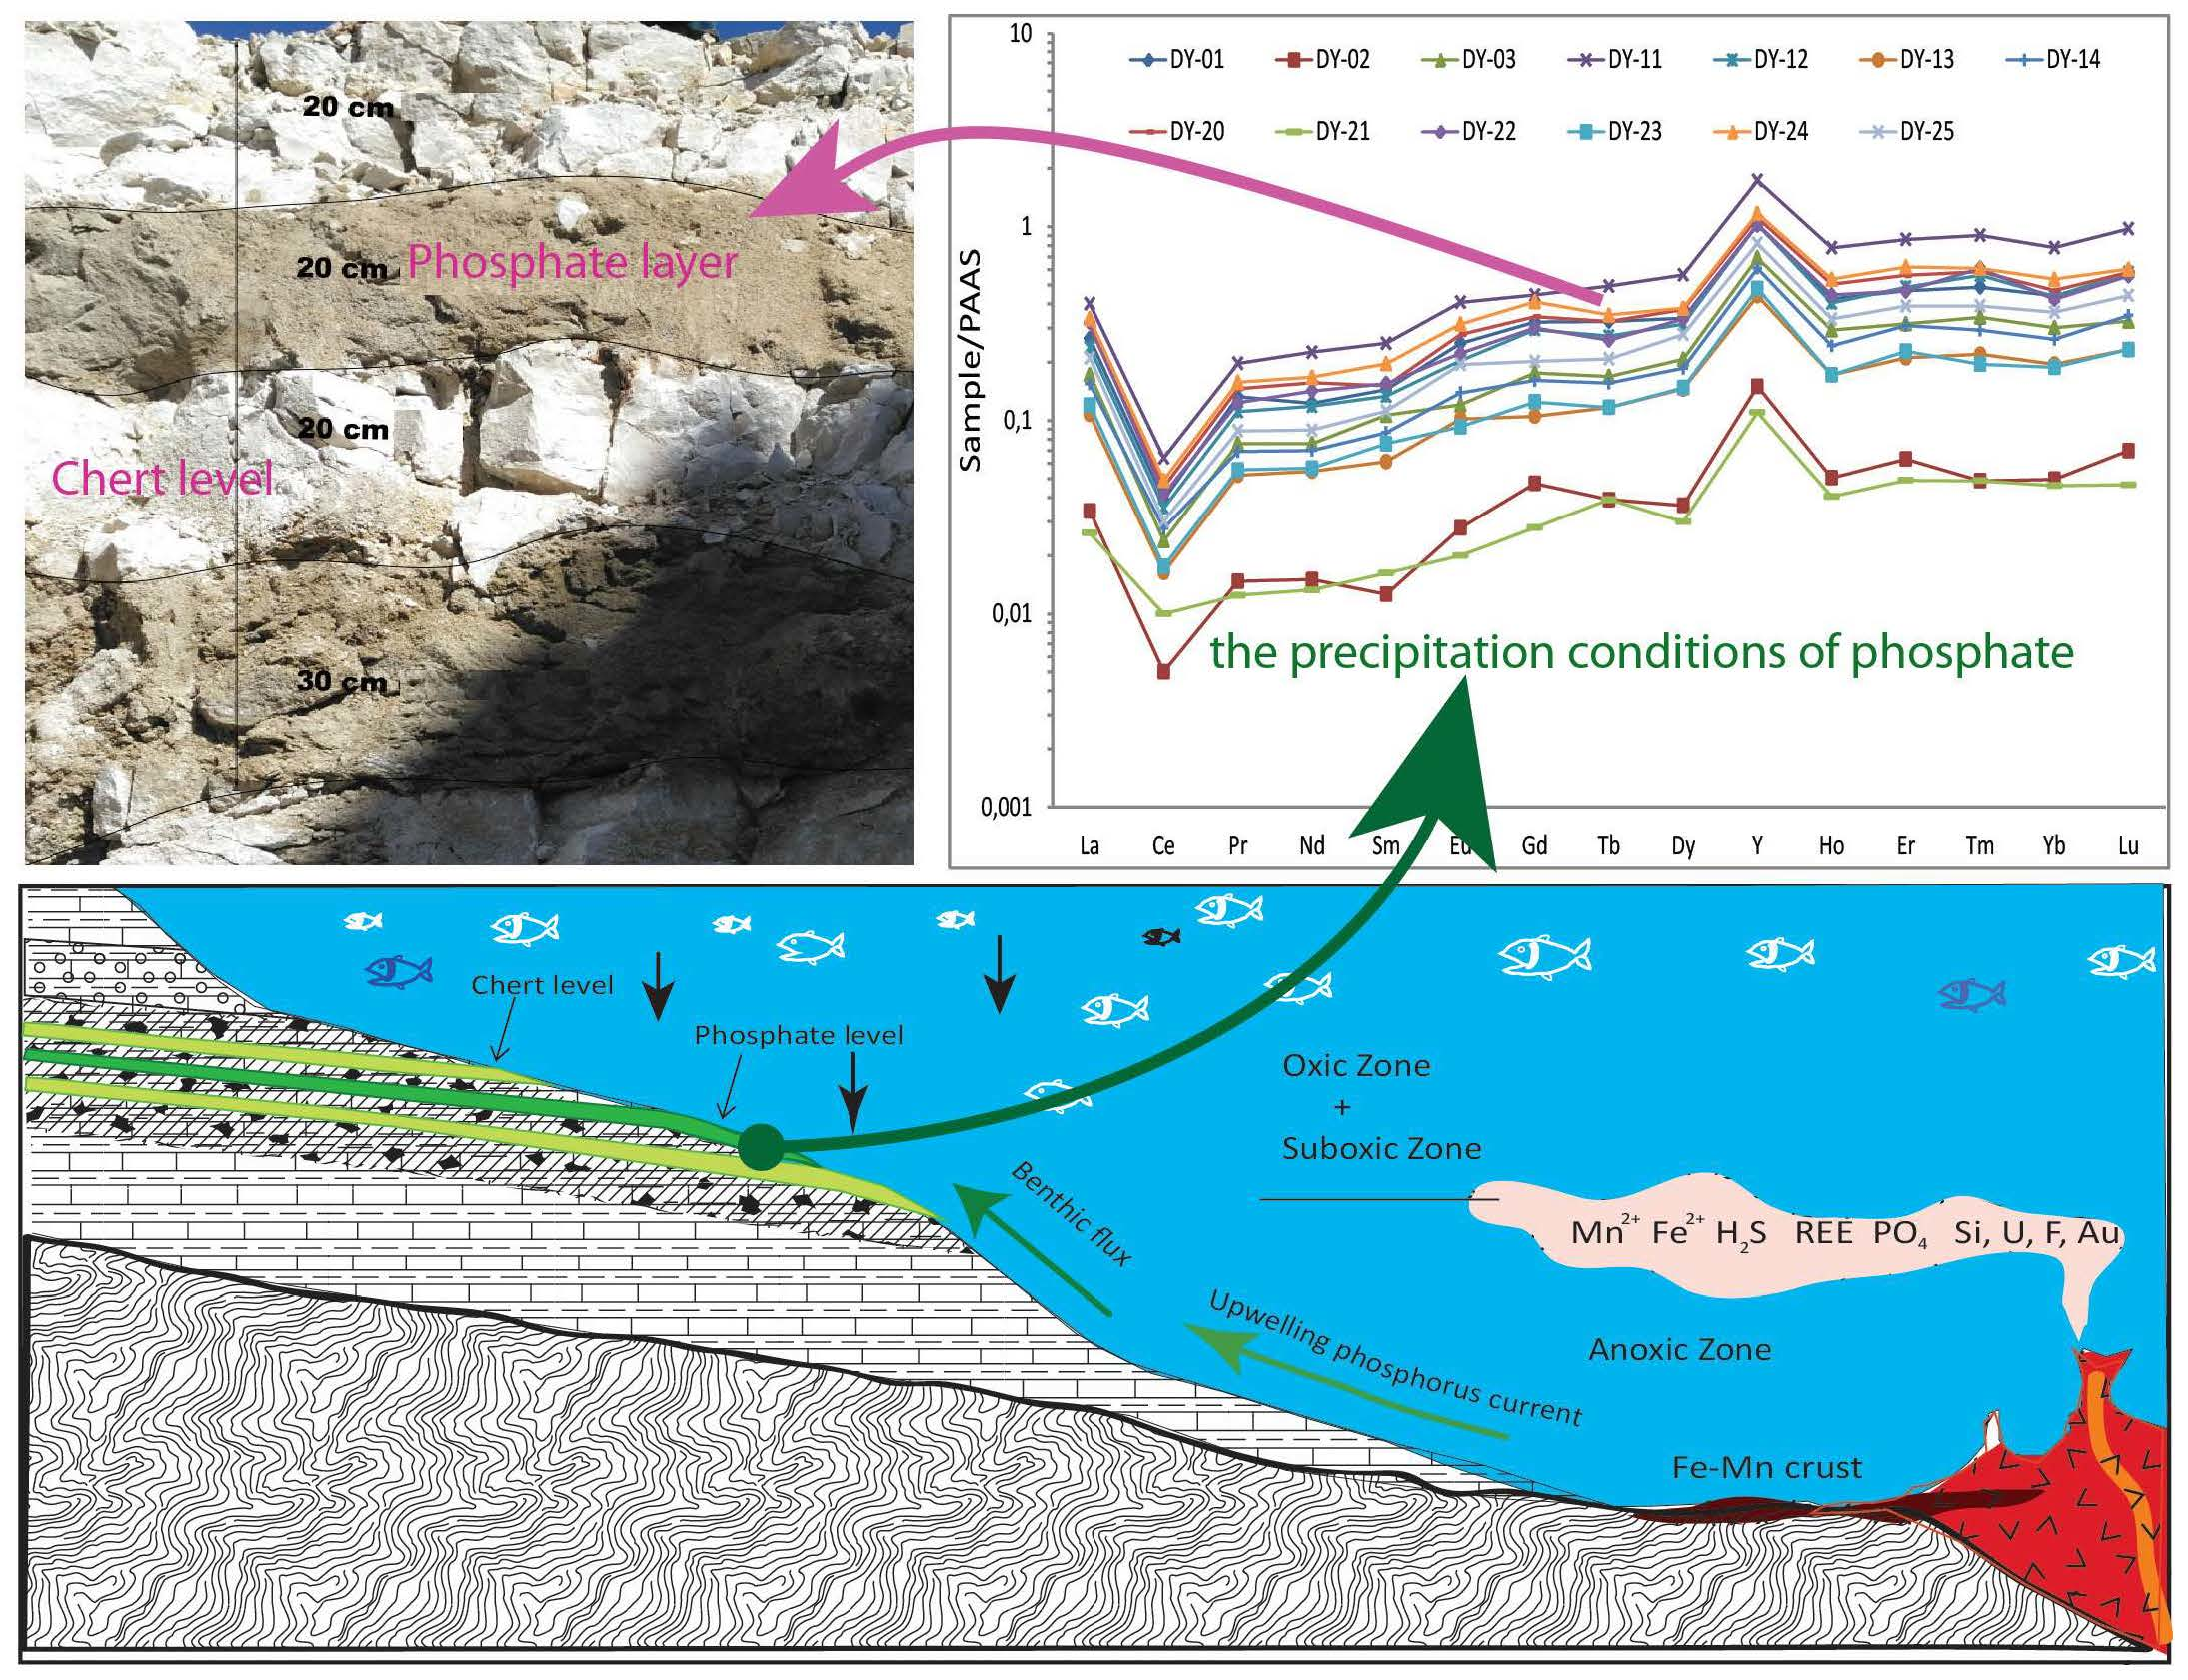
4.6. Origin of the Phosphate and Its Genetic Model
5. Conclusions
Author Contributions
Funding
Acknowledgments
Conflicts of Interest
References
- Nelson, G.J.; Pufahl, P.K.; Hiatt, E.E. Paleoceanographic constraints on Precambrian phosphorite accumulation, Baraga Group, Michigan, USA. Sediment. Geol. 2010, 226, 9–21. [Google Scholar] [CrossRef]
- Dassamiour, M.; Mezghache, H.; Raji, O.; Bodinier, J.L. Depositional environment of the Kef Essennoun phosphorites (northeastern Algeria) as revealed by P2O5 modeling and sedimentary data. Arab. J. Geosci. 2021, 14, 1078. [Google Scholar] [CrossRef]
- Embso, P.; McLaughlin, P.I.; Breit, G.N.; Bray, E.A.; Koenig, A.E. Rare earth element in sedimentary phosphate deposits: Solution to the global REE crisis? Gondwana Res. 2015, 27, 776–785. [Google Scholar]
- Kechiched, R.; Laouar, R.; Bruguier, O.; Salmi-Laouar, S.; Kocsis, L. Glauconite-bearing sedimentary phosphorites from the Tébessa region (eastern Algeria): Evidence of REE enrichment and geo-chemical constraints on their origin. J. Afr. Earth Sci. 2018, 145, 190–200. [Google Scholar] [CrossRef]
- Soudry, D.; Glenn, C.R.; Nathan, Y.; Segal, I.; Vonder Haar, D. Evolution of Tethyan phosphogenesis along the northern edges of the Arabian–African shield during the Cretaceous-Eocene as deduced from temporal variations of Ca and Nd isotopes and rates of P accumulation. Earth Sci. Rev. 2006, 78, 27–57. [Google Scholar] [CrossRef]
- Ghasemian, S.; Ozturk, H.; Cansu, Z. Geochemistry of red and cream phosphorites from the Şemikan phosphorite deposit, SE Turkey: Implication for phosphorite deposition conditions in the Upper Cretaceous. J. Afr. Earth Sci. 2022, 185, 104398. [Google Scholar] [CrossRef]
- Schulz, H.N.; Schulz, H.D. Large sulfur bacteria and the formation of phosphorite. Science 2005, 307, 416–418. [Google Scholar] [CrossRef] [PubMed]
- Creveling, J.R.; Johnston, D.T.; Poulton, S.W.; Kotrc, B.; Marz, C. Phosphorus sources for phosphatic Cambrian carbonates. Geol. Soc. Am. Bull. 2013, 126, 145–163. [Google Scholar] [CrossRef]
- Ling, H.F.; Chen, X.; Li, D.; Wang, D.; Shields-Zhou, G.A. Cerium anomaly variations in Ediacaran–earliest Cambrian carbonates from the Yangtze Gorges area, South China: Implications for oxygenation of coeval shallow seawater. Precambrian Res. 2013, 225, 110–127. [Google Scholar] [CrossRef]
- Jiang, S.Y.; Zhao, H.X.; Chen, Y.-Q.; Yang, T.; Yang, J.-H. Trace and rare earth element geochemistry of phosphate nodules from the lower Cambrian black shale sequence in the Mufu Mountain of Nanjing, Jiangsu province, China. Chem. Geol. 2007, 244, 584–604. [Google Scholar] [CrossRef]
- Chen, D.F.; Dong, W.Q.; Qi, L.; Chen, G.Q.; Chen, X.P. Possible REE constraints on the depositional and diagenetic environment of Doushantuo Formation phosphorites containing the earliest metazoan fauna. Chem. Geol. 2003, 201, 103–118. [Google Scholar] [CrossRef]
- Flicoteaux, R.; Trompette, R. Cratonic and foreland Early Cambrian phosphorites of West Africa: Palaeoceanographical and climatical contexts. Palaeogeogr. Palaeoclimatol. Palaeoecol. 1998, 139, 107–120. [Google Scholar] [CrossRef]
- Bertrand-Sarfati, J.; Flicoteaux, R.; Moussine-Pouchkine, A.; Ait Kaci, A.A. Lower Cambrian apatiticstromatolites and phosphoarenites related to the glacioeustatic cratonic rebound (Sahara, Algeria). J. Sed. Res. 1997, 67, 957–974. [Google Scholar]
- Blot, A.; Affaton, P.; Seddoh, K.F.; Aregba, A.P.; Godonou, S.K. Phosphates du Proterozo€ıque superieur dans la chaıne des Dahomeyides (circa 600 Ma) de la region de Bassar (Nord-Togo, Afrique de l’Ouest). J. Afr. Earth Sci. 1988, 7, 159–166. [Google Scholar] [CrossRef]
- Banerjee, D.M.; Schidlowski, M.; Siebert, F.; Brasier, M.D. Geochemical changes across the Proterozoic-Cambrian transition in the Durmala phosphorite mine section, Mussoorie Hills, Garhwal Himalaya, India. Palaeogeogr. Palaeoclimatol. Palaeoecol. 1997, 132, 183–194. [Google Scholar] [CrossRef]
- Mazumdar, A.; Banerjee, D.M.; Schidlowski, M.; Balaram, V. Rare-earth elements and stable isotope geochemistry of early Cambrian chert-phosphorite assemblage from the Lower Tal Formation of the Krol Belt (Lesser Himalaya, India). Chem. Geol. 1999, 156, 275–297. [Google Scholar] [CrossRef]
- Ilyin, A.V. Phosphorites of the Russian Craton. Earth-Sci. Rev. 1998, 45, 89–101. [Google Scholar] [CrossRef]
- Anderson, R.P.; Macdonald, F.A.; Jones, D.S.; McMahon, S.; Briggs, D.E.G. Dosuhantuo-type microfossils from latest Ediacaran phosphorites of northern Mongolia. GEOL 2017, 45, 1079–1082. [Google Scholar] [CrossRef]
- Wallin, B. Origin of the Lower Cambrian phosphate bed at Vassbo, Sweden. Terra Nova 1989, 1, 274–279. [Google Scholar] [CrossRef]
- Kechiched, R.; Laouar, R.; Bruhuier, O.; Kocsis, L.; Salmi-Laouar, S. Comprehensive REE + Y and sensitive redox trace elements of Algerian phosphorites (Tébessa, eastern Algeria): A geochemical study and depositional environments tracking. J. Geochem. Expl. 2020, 208, 106396. [Google Scholar] [CrossRef]
- Li, M. Evaluation of paired carbon isotopic signals from the Ediacaran Doushantuo phosphorites: Diagenetic or primary? Precambrian Res. 2020, 349, 105502. [Google Scholar] [CrossRef]
- Salama, W.; Khirekesh, Z.; Amini, A.; Bafti, B.S. Diagenetic evolution of the upper Devonian phosphorites, Alborz mountain range, northern Iran. Sediment. Geol. 2018, 376, 90–112. [Google Scholar] [CrossRef]
- Zhu, B.; Jiang, S.Y. A LA-ICP-MS analysis of rare earth elements on phosphatic grains of the Ediacaran Doushantuo phosphorite at Weng’an, South China: Implication for depositional conditions and diagenetic processes. Geol. Mag. 2017, 154, 1391–1397. [Google Scholar] [CrossRef]
- Abou El-Anwar, E.A.; Mekky, H.S.; Abd El Rahim, S.H.; Aita, S.K. Mineralogical, geochemical characteristics and origin of late cretaceous phosphate in Duwi formation (Geble Duwi mine), Red Sea region, Egypt. Egypt. J. Pet. 2017, 26, 157–169. [Google Scholar] [CrossRef] [Green Version]
- Abedini, A.; Calagari, A.A. REEs geochemical characteristics of lower Cambrian phosphatic rocks in the Gorgan-Rasht Zone, northern Iran: Implications for diagenetic effects and depositional conditions. J. Afr. Earth Sci. 2017, 135, 115–124. [Google Scholar] [CrossRef]
- Abed, A.M.; Jaber, O.; Alkuisi, M.; Sadaqah, R. Rare earth elements and uranium geochemistry in the Al-Kora phosphate province, Late Cretaceous, Northwestern Jordan. Arab. J. Geosci. 2016, 9, 187. [Google Scholar] [CrossRef]
- Khan, K.F.; Dar Shamim, A.; Khan Saif, A. Geochemistry of phosphate bearing sedimentary rocks in parts of Sonrai block, Lalitpur district, Uttar Pradesh, India. Chem. Erde. 2012, 72, 117–125. [Google Scholar] [CrossRef]
- Khan, S.A.; Khan, K.F.; Dar, S.A. REE geochemistry of early Cambrian phosphorites of Masrana and Kimoi blocks, Uttarakhand, India. Arab. J. Geosci. 2016, 9, 1–10. [Google Scholar] [CrossRef]
- Xin, H.; Jiang, S.; Yang, J.; Wu, H.; Pi, D. Rare earth element geochemistry of phosphatic rocks in Neoproterozoic Ediacaran Doushantuo Formation inhushan section from the Yangtze Gorges area, South China. J. Earth. Sci. 2016, 27, 204–210. [Google Scholar] [CrossRef]
- Picard, S.; Lecuyer, C.; Bahat, J.; Garciad, J.; Dromart, G. Rare-earth element contents of Jurassic fish and reptile teeth and their potential relation to seawater composition (Anglo-Paris Basin, France and England). Chem Geol. 2002, 18, 1–16. [Google Scholar] [CrossRef]
- Yaomin, Y.; Guangzhi, T.; Ruizhong, H. REE and trace element geochemistry of Yinachang Fe-Ca-REE deposit, Yunuan Province, China. Chin. J. Geochem. 2004, 23, 265–274. [Google Scholar] [CrossRef]
- Berker, E. The Mardin–Mazıdağı–Derik phosphate deposits, south east Turkey. In Phosphate Deposits of the World. Phosphate Rock Resources, 2; Notholt, A.J.G., Sheldon, R.P., Davidson, D.F., Eds.; Cambridge University Press: Cambridge, MA, USA, 1989; pp. 380–386. [Google Scholar]
- Aydin, I.; Imamoglu, S.; Aydin, F.; Saydut, A.; Hamamci, C. Determination of mineral phosphate species in sedimentary phosphate rock in Mardin, SE Anatolia, Turkey by sequential extraction. Microchem. J. 2009, 91, 63–69. [Google Scholar] [CrossRef]
- Varol, B. Sedimentary petrography and origin of phosphate peloids of the Mazıda_g-Derik Area (Mardin, Southeast Turkey). Min. Res. Expl. Bull. 1989, 109, 65–73. [Google Scholar]
- Varol, B.; Shafiri, J.G.J. Üst Kretase glakonilerinin (Kilis, GD Türkiye) sedimenter petrografisi ve çokel ortamları. Turk. J. Earth Sci. 1995, 4, 13–26. [Google Scholar]
- Imamoglu, M.S.; Nathan, Y.; Çoban, H.; Soudry, D.; Glenn, C.R. Geochemical, mineralogical and isotopic signatures of the Şemikan, west Kasrık ‘‘Turkish’’ phosphorites from the derik–mazıdağı–mardin area, SE Anatolia. Int. J. Earth Sci. 2009, 98, 1679–1690. [Google Scholar] [CrossRef]
- Yilmaz, I.O.; Cook, T.D.; Hosgör, I.; Wagreich, M.; Rebman, K.; Murray, A.M. The upper Coniacian to upper Santonian drowned Arabian carbonate platform, the Mardin–Mazıdağı area, SE Turkey: Sedimentological, stratigraphic, and ichthyofaunal records. Cretac. Res. 2018, 84, 153–167. [Google Scholar] [CrossRef]
- Zhu, B.; Jiang, S.; Yang, J.; Pi, D.; Ling, H.; Chen, Y. Rare earth element and Sr–Nd isotope geochemistry of phosphate nodules from the lower Cambrian Niutitang Formation, NW Hunan Province, South China. Palaeogeogr. Palaeoclimatol. Palaeoecol. 2014, 398, 132–14339. [Google Scholar] [CrossRef]
- Şengör, A.M.C.; Yılmaz, Y. Tethyan evolution of Turkey: A plate tectonic approach. Tectonophysics 1981, 75, 181–241. [Google Scholar] [CrossRef]
- Perinçek, D. Sedimentation on the Arabian Shelf under the Control of Tectonic Activity in Taurid Belt. In Proceedings of the 5th Petroleum Geologists Congress, Ankara, Turkey, 1980; pp. 77–93. [Google Scholar]
- Gürsu, S.; Moller, A.; Goncüoglu, M.C.; Koksal, S.; Demircan, H.; Koksal, F.T.; Kozlu, H.; Sunal, G. Neoproterozoic continental arc volcanism at the northern edge of the Arabian Plate, SE Turkey. Precambrian Res. 2015, 258, 208–233. [Google Scholar] [CrossRef]
- Tetiker, S.; Yalçın, H.; Bozkaya, O. Evidence of the diagenetic history of sediment composition in Precambrian-Early Paleozoic rocks: A study from the Southeast Anatolian Autochthon, Mardin (Derik-Kızıltepe), Turkey. Arab. J. Geosci. 2015, 5, 11261–11278. [Google Scholar] [CrossRef]
- Yılmaz, E.; Duran, O. Güneydoğu Anadolu Bölgesi otokton ve allokton birimler stratigrafi adlama sözlüğü ‘Lexicon’; Türkiye Petrolleri Anonim Ortaklığı: Çankaya, Turkey, 1997; p. 460. [Google Scholar]
- Cater, J.M.L.; Gillcrist, J.R. Karstic reservoirs of the mid-Cretaceous Mardin Group, SE Turkey: Tectonic and eustatic controls on their genesis, distribution and preservation. J. Petrol. Geol. 1994, 17, 253–278. [Google Scholar] [CrossRef]
- Lauriente, D.H. Phosphate industry overview. In Chemical Economics Handbook; SRI International: Zurich, Switzerland, 1996; 94p. [Google Scholar]
- Slansky, M. Geology of Sedimentary Phosphate; North Oxford Academic Publishing Company Limited: Oxford, UK, 1986. [Google Scholar]
- Awadalla, G.S. Geochemistry and microprobe investigations of Abu Tartur REE-bearing phosphorite, Western Desert. Egypt. J. Afr. Earth Sci. 2010, 57, 431–443. [Google Scholar] [CrossRef]
- Algeo, T.J.; Liu, J. A re-assessment of elemental proxies for paleoredox analysis. Chem. Geol. 2020, 540, 119549. [Google Scholar] [CrossRef]
- Yao, C.; Guo, W.; Liu, J.; Li, H. Multiple Proxies on the Paleoenvironment of the Early Cambrian Marine Black Rock Series in the Tarim Basin, NW China: Molybdenum Isotope and Trace Element Evidence. Int. J. Geosci. 2017, 8, 965–983. [Google Scholar] [CrossRef]
- Jones, B.J.; Manning, A.C. Comparison of geochemical indices used for the interpretation of palaeoredox conditions in ancient mudstones. Chem. Geol. 1994, 111, 111–129. [Google Scholar] [CrossRef]
- Schmidt, K.; Bau, M.; Hein, J.R.; Koschinsky, A. Fractionation of the geochemical twins Zr/Hf and Nb/Ta during scavenging from sea-water by hydrogenetic ferromanganese crusts. Geochim. Cosmochim. Acta 2014, 140, 468–487. [Google Scholar] [CrossRef]
- Censi, P.; Randazzo, L.A.; Zuddas, P.; Saiano, F.; Aricò, P. Trace element behavior in seawater during Etna’s pyroclastic activity in 2001: Concurrent effects of nutrients and formation of alteration minerals. J. Volcanol. Geotherm. Res. 2010, 193, 106–116. [Google Scholar] [CrossRef]
- Censi, P.; Inguaggiato, C.; Chiavetta, S.; Schembri, C.; Sposito, F. The behavior of zirconium, hafnium and rare earth elements during the crystallization of halite and other salt minerals. Chem. Geol. 2017, 453, 80–91. [Google Scholar] [CrossRef]
- Godfrey, L.V.; Zimmermann, B.; Lee, D.C.; King, R.L.; Vervoort, J.D. Hafnium and neodymium isotope variations in NE Atlantic seawater. Geochem. Geophys. Geosyst. 2009, 10, 1–13. [Google Scholar] [CrossRef]
- Firdaus, M.L.; Minami, T.; Norisuye, K.; Sohrin, Y. Strong elemental fractionation of Zr–Hf and Nb–Ta across the Pacific Ocean. Nat. Geosci. 2011, 4, 227–230. [Google Scholar] [CrossRef]
- Sasmaz, A. The Atbara porphyry gold–copper systems in the Red Sea Hills, Neoproterozoic Arabian–Nubian Shield, NE Sudan. J. Geochem. Expl. 2020, 214, 106539. [Google Scholar] [CrossRef]
- Censi, P.; Raso, M.; Saiano, F.; Zuddas, P.; Oliveri, E. Zr/Hf ratio and REE behavior: A coupled indication of lithogenic input in marginal basins and deep-sea brines. Deep-Sea Res. Part II 2019, 164, 216–223. [Google Scholar] [CrossRef]
- Sasmaz, A.; Zuddas, P.; Cangemi, M.; Piazzese, D.; Ozek, G.; Censi, P. Zirconium and hafnium fractionation and distribution of Rare Earth Elements in neutral–alkaline waters: Case study of Lake Van hydrothermal system, Turkey. J. Geochem. Expl. 2021, 226, 106784. [Google Scholar] [CrossRef]
- Taylor, S.R.; McLennan, S.M. The Continental Crust: Its Composition and Evolution; Blackwell Scientific: Oxford, UK, 1985; p. 312. [Google Scholar]
- Godfrey, L.V.; Mills, R.; Elderfield, H.; Gurvich, E. Lead behavior at TAG hydrothermal vent field, 26°N, Mid-Atlantic ridge. Mar. Chem. 1994, 46, 237–254. [Google Scholar] [CrossRef]
- Godfrey, L.V.; White, W.M.; Salters, V.J.M. Dissolved zirconium and hafnium distributions across a shelf break in the northeastern Atlantic Ocean. Geochim. Cosmochim. Acta 1996, 60, 3995–4006. [Google Scholar] [CrossRef]
- Reynard, B.; Lécuyer, C.; Grandjean, P. Crystal-chemical controls on rare earth element concentrations in fossil biogenic apatite and implications for paleoenvironmental reconstructions. Chem. Geol. 1999, 155, 233–241. [Google Scholar] [CrossRef]
- Shuaib, M.; Khan, K.F.; Hussain, A.; Jawad, M.; Dar, S.A. Rare-earth element (REE) geochemistry of late Paleocene–middle Eocene phosphate nodules in the Subathu Basin of Solan District, Himachal Pradesh, India. J. Sedimen Environ. 2021, 6, 1–12. [Google Scholar] [CrossRef]
- Hein, J.R.; Koschinsky, A.; Mikesell, M.; Mizell, K.; Glenn, C.R.; Wood, R. Marine Phosphorites as Potential Resources for Heavy Rare Earth Elements and Yttrium. Minerals 2016, 6, 88. [Google Scholar] [CrossRef] [Green Version]
- Chen, J.; Yang, R.; Wei, H.; Gao, J. Rare earth element geochemistry of Cambrian phosphorites from Yangtze Region (China). J. Rare Earth Elem. 2013, 31, 101–112. [Google Scholar] [CrossRef]
- Hamelin, B.; Dupre, B.; Allegre, C.J. Lead-strontium isotopic variations along the East Pacific Rise and Mid-Atlantic Ridge: A comparative study. Earth Planet. Sci. Lett. 1984, 67, 340–350. [Google Scholar] [CrossRef]
- Bau, M.; Möller, P. Rare-earth element fractionation in metamorphogenic hydrothermal calcite, magnesite and siderite. Mineral. Petrol. 1992, 45, 231–246. [Google Scholar] [CrossRef]
- Bau, M. Controls on the fractionation of isovalent trace elements in magmatic and aqueous systems: Evidence from Y/Ho, Zr/Hf, and lanthanide tetrad effect. Contrib. Mineral. Petrol. 1996, 123, 323–333. [Google Scholar] [CrossRef]
- Takahashi, Y.; Hirata, T.; Shimizu, H.; Ozaki, T.; Fortin, D. A rare earth element signature of bacteria in natural waters? Chem. Geol. 2007, 244, 569–583. [Google Scholar] [CrossRef]
- Takahashi, Y.; Hayasaka, Y.; Morita, K.; Kashiwabara, T.; Nakada, R.; Marcus, M.A.; Kato, K.; Tanaka, K.; Shimizu, H. Transfer of rare earth elements (REE) from manganese oxides to phosphates during early diagenesis in pelagic sediments inferred from REE patterns, X-ray absorption spectroscopy, and chemical leaching method. Geochem. J. 2015, 49, 653–674. [Google Scholar] [CrossRef]
- Tostevin, R.; Shields, G.A.; Tarbuck, G.M.; He, T.; Clarkson, M.O. Effective use of the cerium anomalies as a redox proxy in carbonate-dominated marine settings. Chem. Geol. 2016, 438, 146–162. [Google Scholar] [CrossRef] [Green Version]
- German, C.R.; Holliday, B.P.; Elderfield, H. Redox cycling of rare earth elements in the suboxic zone of the Black Sea. Geochim. Cosmochim. Acta 1991, 55, 3553–3558. [Google Scholar] [CrossRef]
- Al-Hobaib, A.S.; Baioumy, H.M.; Al-Ateeq, M.A. Geochemistry and origin of the Paleocene phosphorites from the Hazm Al-Jalamid area, northern Saudi Arabia. J. Geochem. Expl. 2013, 132, 15–25. [Google Scholar] [CrossRef]
- Shields, G.A.; Stille, P. Diagenetic constraints on the use of cerium anomalies as palaeoseawater redox proxies: An isotopic and REE study of Cambrian phosphorites. Chem. Geol. 2001, 175, 29–48. [Google Scholar] [CrossRef]
- Bau, M.; Balan, S.; Schmidt, K.; Koschinsky, A. Rare earth elements in mussel shells of the Mytilidae family as tracers for hidden and fossil high–temperature hydrothermal systems. Earth Planet. Sci. Lett. 2010, 299, 310–316. [Google Scholar] [CrossRef]
- Deng, X.H.; Chen, Y.J.; Yao, J.M.; Bagas, L.; Tang, H.S. Fluorite REE-Y (REY) geochemistry of the ca. 850 Ma Tumen molybdenite-fluorite deposit, eastern Qinling, China: Constraints on ore genesis. Ore Geol. Rev. 2014, 63, 532–543. [Google Scholar] [CrossRef]
- Ehya, F. Variation of mineralizing fluids and fractionation of REE during the emplacement of the vein-type fluorite deposit at Bozijan, Markazi Province, Iran. J. Geochem. Explor. 2012, 112, 93–106. [Google Scholar] [CrossRef]
- Roy, A.; Chakrabarti, G.; Shome, D. Geochemistry of the Neoproterozoic Narji limestone, Cuddapah Basin, Andhra Pradesh, India: Implication on palaeoenvironment. Arab. J. Geosci. 2018, 11, 784–796. [Google Scholar] [CrossRef]
- Tobia, F.H. Stable isotope and rare earth element geochemistry of the Baluti carbonates (Upper Triassic), Northern Iraq. Geosci. J. 2018, 22, 975–987. [Google Scholar] [CrossRef]
- Bau, M.; Dulski, P. Distribution of yttrium and rare-earth elements in the Penge and Kuruman iron-formations, Transvaal Supergroup, South Africa. Precambrian Res. 1996, 79, 37–55. [Google Scholar] [CrossRef]
- Fazio, A.M.; Scasso, R.A.; Castro, L.N.; Carey, S. Geochemistry of rare earth elements in early-diagenetic miocenephosphatic concretions of Patagonia, Argentina:Phosphogenetic implications. Deep-Sea Res. II 2007, 54, 1414–1432. [Google Scholar] [CrossRef]
- Zhang, J.; Amakawa, H.; Nosaky, Y. The comparative behavior of Y and lanthanides in seawater on the North Pacific. Geophys. Res. Lett. 1994, 21, 2677–2680. [Google Scholar] [CrossRef]
- Bau, M.; Möller, P.; Dulski, P. Yttrium and lanthanides in eastern Mediterranean seawater and their fractionation during redox-cycling. Mar. Chem. 1997, 56, 123–131. [Google Scholar] [CrossRef]
- Elderfield, H.; Pagett, R. Rare earth elements in ichthyoliths: Variations with redox conditions and depositional environment. Sci. Total Environ. 1986, 49, 175–197. [Google Scholar] [CrossRef]
- Buccione, R.; Kechiched, R.; Mongelli, G.; Sinisi, R. REEs in the North Africa P-Bearing deposits, paleoenvironments, and economic perspectives: A review. Minerals 2021, 11, 214. [Google Scholar] [CrossRef]
- Martin, E.E.; Scher, H.D. Preservation of seawater Sr and Nd isotopes in fossil fish teeth: Bad news and good news. Earth Planet. Sci. Lett. 2004, 220, 25–39. [Google Scholar] [CrossRef]
- Shields, G.A.; Webb, G.E. Has the REE composition of seawater changed over geological time? Chem. Geol. 2004, 204, 103–107. [Google Scholar] [CrossRef]
- Lécuyer, C.; Reynard, B.; Grandjean, P. Rare earth element evolution of Phanerozoic seawater recorded in biogenic apatites. Chem. Geol. 2004, 204, 63–102. [Google Scholar] [CrossRef]
- Bright, C.A.; Cruse, A.M.; Lyons, T.W.; MacLeod, K.G.; Glascock, M.D. Seawater rare-earth element patterns preserved in apatite of Pennsylvanian conodonts? Geochim. Cosmochim. Act 2009, 73, 1609–1624. [Google Scholar] [CrossRef]
- Wang, C.M.; Deng, J.; Carranza, E.J.M.; Lai, X.R. Nature, diversity and temporal–spatial distributions of sediment-hosted Pb–Zn deposits in China. Ore Geol. Rev. 2014, 56, 327–351. [Google Scholar] [CrossRef]
- Zartman, R.E.; Doe, B.R. Plumbotectonics—The model. Tectonophysics 1981, 75, 135–162. [Google Scholar] [CrossRef]
- von Blanckenburg, F.; O’Nions, R.K.; Hein, J.R. Distribution and sources of pre-anthropogenic lead isotopes in deep ocean water from Fe-Mn crusts, Geochim. Cosmochim. Acta 1996, 60, 4936–4957. [Google Scholar] [CrossRef]
- Muiños, S.B.; Frank, M.; Made, C.; Hein, J.R.; van de Flierdt, T. New constraints on the Pb and Nd isotopic evolution of NE Atlantic water masses. Geochem. Geophys. Geosystems 2008, 9, 18. [Google Scholar] [CrossRef] [Green Version]
- Andrieu, A.S.; Honnorez, J.; Lancelot, J. Lead isotope compositions of the TAG mineralization, Mid-Atlantic Ridge, 26°08′N. In Proceedings of the Ocean Drilling Program, Scientific Results, Charleston, SC, USA, 8 January–14 February 1997; Herzig, P.M., Humphris, S.E., Miller, D.J., Zierenberg, R.A., Eds.; Texas: Charleston, SC, USA, 1998. [Google Scholar]
- Bolton, B.R.; Frakes, L.A. Geology and genesis of manganese oolite, Chiatura, Georgia, U.S.S.R. Geol. Soc. Am. Bull. 1985, 96, 1398–1406. [Google Scholar] [CrossRef]
- Sasmaz, A.; Zagnitko, V.M.; Sasmaz, B. Major, trace and rare earth element (REE) geochemistry of the Oligocene stratiform manganese oxide-hydroxide deposits in the Nikopol, Ukraine. Ore Geol. Rev. 2020, 126, 103772. [Google Scholar] [CrossRef]
- Sasmaz, A.; Sasmaz, B.; Hein, J.R. Geochemical approach to the genesis of the Oligocene-stratiform manganese-oxide deposit, Chiatura (Georgia). Ore Geol. Rev. 2021, 128, 103910. [Google Scholar] [CrossRef]
- Burnett, W.C. Geochemistry and origin of phosphorite deposits from off Peru and Chile. Geol. Soc. Am. Bull. 1977, 88, 813–823. [Google Scholar] [CrossRef]
- Elderfield, H.; Greaves, M.J. The rare earth elements in seawater. Nature 1982, 296, 214–219. [Google Scholar] [CrossRef]
- Felitsyn, S.; Morad, S. REE patterns in latest Neoproterozoic early Cambrian phosphate concretions and associated organic matter. Chem. Geol. 2002, 187, 257–265. [Google Scholar] [CrossRef]
- Stalder, M.; Rozendaal, A. Apatite nodules as an indicator of depositional environment and ore genesis for the Mesoproterozoic Broken Hill-type Gamsberg Zn–Pb deposit, Namaqua Province, South Africa. Miner. Dep. 2004, 39, 189–203. [Google Scholar] [CrossRef]
- Tyson, R.V.; Pearson, T.H. Modern and Ancient Continental Shelf Anoxia: An Overview; Geological Society Publications: London, UK, 1991; Volume 58, pp. 1–24. [Google Scholar]
- Trappe, J. Phanerozoic phosphorite depositional systems. In Lecture Notes in Earth Sciences; Springer: Berlin, Germany, 1998; Volume 76. [Google Scholar]
- Slomp, C.P.; Van Capellen, P. The global marine phosphorus cycle: Sensitivity to oceanic circulation. Biogeosciences 2007, 4, 155–171. [Google Scholar] [CrossRef] [Green Version]
- Sasmaz, A.; Onal, A.; Sagiroglu, A.; Onal, M. Origin and nature of the mineralizing fluids of thrust zone fluorites in Çelikhan (Adıyaman, Eastern Turkey): A geochemical approach. Geochem. J. 2005, 39, 131–139. [Google Scholar] [CrossRef]
- Baioumy, H.; Farouk, S. The geochemical and economic significance of REE in the Upper Cretaceous-Eocene Tethyan phosphorites. J. Afr. Earth Sci. 2022, 194, 104635. [Google Scholar] [CrossRef]
- Almogi-Labin, A.; Bein, A.; Sass, E. Late Cretaceous upwelling system along the southern Tethys margin (Israel): Interrelationship between productivity, bottom water environments, and organic matter preservation. Paleoceanography 1993, 8, 671–690. [Google Scholar] [CrossRef]
- Abed, A.M. The eastern Mediterranean phosphorite giants: An interplay between tectonics and upwelling. GeoArabia 2013, 18, 67–94. [Google Scholar] [CrossRef]
- Abed, A.M. Review of Uranium in the Jordanian Phosphorites: Distribution, Genesis and Industry. Jordan J. Earth Environ. Sci. 2011, 4, 35–45. [Google Scholar]
- El Bamiki, R.; Raji, O.; Ouabid, M.; Elghali, A.; Yazami, O.K. Phosphate rocks: A review of sedimentary and igneous occurrences in Morocco. Minerals 2021, 11, 1137. [Google Scholar] [CrossRef]
- Shlewit, H. Treatment of phosphate rocks with hydrochloric acid. J. Radioanal. Nucl. Chem. 2011, 287, 49–54. [Google Scholar] [CrossRef]
- Tlili, A.; Felhi, M.; Montacer, M. Origin and Depositional Environment of Palygorskite and Sepiolite from the Ypresian Phosphatic Series, Southwestern Tunisia. Clays Clay Miner. 2010, 58, 573–584. [Google Scholar] [CrossRef]
- Powell, J.H.; Moh’d, B.K. Early diagenesis of Late Cretaceous chalk-chert-phosphorite hardgrounds in Jordan; Implications for sedimentation on a Coniacian–Campanian pelagic ramp. GeoArabia 2012, 17, 17–38. [Google Scholar] [CrossRef]
- Sasmaz, A.; Kilic, A.D.; Akgul, B.; Sasmaz, B. A spectral approach on mineralogy and geochemistry of garnet skarns in Arc-Type granitoids. Spectrochim. Acta Part A Mol. Biomol. Spectr. 2023, 286, 122037. [Google Scholar] [CrossRef]


| SiO2 | Al2O3 | Fe2O3 | MgO | CaO | Na2O | K2O | TiO2 | P2O5 | MnO | Cr2O3 | CO2 | Sum | CaO/P2O5 | |
|---|---|---|---|---|---|---|---|---|---|---|---|---|---|---|
| DL | 0.01 | 0.01 | 0.04 | 0.01 | 0.01 | 0.01 | 0.01 | 0.01 | 0.01 | 0.01 | 0.002 | −5.1 | ||
| DY-01 | 2.05 | 0.04 | 0.11 | 0.22 | 54.9 | 0.71 | 0.01 | <0.01 | 27.5 | 0.02 | 0.02 | 14.2 | 99.9 | 2.00 |
| DY-02 | 0.91 | 0.01 | <0.04 | 0.21 | 55.3 | 0.11 | 0.01 | <0.01 | 4.29 | <0.01 | 0.01 | 39.1 | 100 | 12.88 |
| DY-03 | 1.45 | 0.01 | 0,07 | 0.21 | 55.4 | 0.43 | 0.01 | <0.01 | 16.5 | <0.01 | 0.02 | 25.7 | 99.9 | 3.35 |
| DY-11 | 4.63 | 0,11 | 0.25 | 0.17 | 53.7 | 0.71 | 0.02 | 0.01 | 31.3 | <0.01 | 0.03 | 8.8 | 99.9 | 1.72 |
| DY-12 | 1.05 | 0.05 | 0.10 | 0.20 | 55.5 | 0.74 | 0.01 | <0.01 | 30.2 | <0.01 | 0.03 | 11.8 | 99.8 | 1.84 |
| DY-13 | 12.80 | 0.02 | 0.10 | 0.17 | 48.8 | 0.26 | 0.01 | <0.01 | 10.1 | <0.01 | 0.01 | 27.5 | 99.9 | 4.81 |
| DY-14 | 33.50 | 0.14 | 0.22 | 0.13 | 37.0 | 0.46 | 0.02 | <0.01 | 22.3 | <0.01 | 0.01 | 5.9 | 99.9 | 1.66 |
| DY-20 | 0.53 | 0.01 | 0.01 | 0.17 | 56.3 | 0.74 | 0.01 | <0.01 | 31.7 | <0.01 | 0.02 | 10.2 | 99.9 | 1.77 |
| DY-21 | 36.1 | 0.03 | 0.16 | 0.16 | 35.6 | 0.06 | 0.01 | <0.01 | 2.22 | <0.01 | 0.02 | 25.6 | 100 | 16.05 |
| DY-22 | 1.25 | 0.04 | 0.06 | 0.20 | 55.5 | 0.73 | 0.01 | <0.01 | 29.5 | <0.01 | 0.03 | 12.3 | 99.9 | 1.88 |
| DY-23 | 6.92 | 0.03 | 0.09 | 0.19 | 52.0 | 0.33 | 0.01 | <0.01 | 13.5 | <0.01 | 0.02 | 26.7 | 99.9 | 3.86 |
| DY-24 | 0.73 | 0.02 | 0.01 | 0.17 | 56.1 | 0.69 | 0.01 | <0.01 | 30.6 | <0.01 | 0.02 | 11.2 | 99.9 | 1.83 |
| DY-25 | 2.41 | 0.01 | 0.08 | 0.20 | 55.0 | 0.60 | 0.01 | <0.01 | 25.6 | <0.01 | 0.02 | 15.8 | 99.9 | 2.15 |
| Avrg | 8.03 | 0.04 | 0.11 | 0.18 | 51.6 | 0.51 | 0.01 | 0.01 | 21.2 | 0.02 | 0.02 | 18.1 | 99.9 | 4.29 |
| SiO2 | Al2O3 | Fe2O3 | MgO | CaO | Na2O | K2O | TiO2 | MnO | CO2 | V | Cr | Co | Ni | Cu | |
|---|---|---|---|---|---|---|---|---|---|---|---|---|---|---|---|
| P2O5 | −0.48 | 0.27 | −0.04 | 0.03 | 0.50 | 0.99 | 0.23 | 0.06 | −0.05 | −0.88 | 0.75 | 0.79 | 0.22 | −0.49 | 0.50 |
| Rb | Sr | Y | Zr | Nb | Ba | Hf | As | Cd | U | Th | Pb | Zn | Au | ∑REE | |
| P2O5 | 0.52 | 0.99 | 0.91 | 0.79 | 0.69 | 0.93 | 0.69 | 0.89 | 0.37 | 0.95 | 0.40 | 0.87 | 0.81 | 0.49 | 0.92 |
| V | Cr | Co | Ni | Cu | Rb | Sr | Zr | Nb | Ba | Hf | As | Cd | U | Th | Pb | Zn | Au | Sc | ∑TE | Th/U | Ni/Co | V/Sc | V/Cr | |
|---|---|---|---|---|---|---|---|---|---|---|---|---|---|---|---|---|---|---|---|---|---|---|---|---|
| DY-01 | 63 | 123 | 1.8 | 7.2 | 28.0 | 0.30 | 1418 | 6.4 | 0.11 | 112 | 0.11 | 5.8 | 13.6 | 48.6 | 0.7 | 1.91 | 237 | 0.089 | 1.7 | 2062 | 0.014 | 4.00 | 37 | 0.51 |
| DY-02 | 12 | 30 | 0.5 | 11.1 | 4.6 | 0.10 | 418 | 1.4 | 0.02 | 20 | 0.02 | 1.9 | 3.2 | 8.2 | 0.1 | 0.39 | 62 | 0.085 | 0.2 | 574 | 0.012 | 22.2 | 60 | 0.40 |
| DY-03 | 46 | 86 | 0.6 | 10.0 | 16.6 | 0.20 | 951 | 6.5 | 0.05 | 77 | 0.05 | 5.5 | 32.9 | 31.8 | 0.2 | 1.16 | 209 | 0.065 | 1.1 | 1475 | 0.006 | 16.7 | 42 | 0.53 |
| DY-11 | 76 | 189 | 0.2 | 23.6 | 43.9 | 0.50 | 1443 | 15.3 | 0.14 | 95 | 0.14 | 13.8 | 23.4 | 51.6 | 0.4 | 2.58 | 407 | 0.056 | 3.5 | 2396 | 0.008 | 118 | 22 | 0.40 |
| DY-12 | 92 | 155 | 0.6 | 15.3 | 94.4 | 0.30 | 1531 | 9.8 | 0.08 | 112 | 0.08 | 7.5 | 46.6 | 60.2 | 0.2 | 1.78 | 557 | 0.098 | 1.7 | 2684 | 0.003 | 25.5 | 54 | 0.59 |
| DY-13 | 24 | 77 | 1.2 | 18.8 | 17.9 | 0.10 | 567 | 3.6 | 0.02 | 38 | 0.02 | 2.6 | 33.9 | 17.4 | 0.1 | 0.65 | 196 | 0.047 | 0.7 | 998 | 0.006 | 15.7 | 34 | 0.31 |
| DY-14 | 121 | 72 | 0.7 | 10.5 | 29.2 | 0.50 | 1064 | 7.0 | 0.06 | 113 | 0.06 | 6.7 | 57.3 | 57.3 | 0.2 | 2.20 | 206 | 0.076 | 1.9 | 1748 | 0.003 | 15.0 | 64 | 1.68 |
| DY-20 | 72 | 123 | 0.6 | 7.8 | 19.1 | 0.20 | 1535 | 7.4 | 0.06 | 98 | 0.06 | 9.0 | 6.3 | 51.7 | 0.1 | 1.56 | 296 | 0.066 | 1.2 | 2228 | 0.002 | 13.0 | 60 | 0.58 |
| DY-21 | 11 | 76 | 0.6 | 32.3 | 2.7 | 0.10 | 198 | 0.8 | 0.02 | 10 | 0.02 | 1.3 | 5.41 | 4.0 | 0.1 | 0.21 | 49 | 0.023 | 0.2 | 392 | 0.025 | 53.8 | 55 | 0.14 |
| DY-22 | 91 | 158 | 8.8 | 10.6 | 59.7 | 0.20 | 1517 | 7.7 | 0.08 | 96 | 0.08 | 9.6 | 68.3 | 51.0 | 0.3 | 1.56 | 249 | 0.061 | 1.6 | 2327 | 0.006 | 1.20 | 57 | 0.58 |
| DY-23 | 44 | 101 | 0.8 | 20.4 | 48.1 | 0.20 | 778 | 4.6 | 0.04 | 56 | 0.04 | 4.0 | 19.2 | 25.7 | 0.1 | 0.77 | 243 | 0.037 | 1.0 | 1346 | 0.004 | 25.5 | 44 | 0.44 |
| DY-24 | 64 | 114 | 0.5 | 8.1 | 15.4 | 0.20 | 1414 | 7.6 | 0.05 | 103 | 0.05 | 7.9 | 25.9 | 47.5 | 0.1 | 1.69 | 379 | 0.144 | 1.5 | 2190 | 0.002 | 16.2 | 43 | 0.56 |
| DY-25 | 33 | 96 | 0.4 | 15.9 | 13.9 | 0.10 | 1294 | 4.1 | 0.02 | 101 | 0.02 | 8.0 | 19.6 | 46.6 | 0.1 | 1.27 | 313 | 0.148 | 1.6 | 1946 | 0.002 | 39.8 | 21 | 0.35 |
| Avrg | 58 | 108 | 1.33 | 14.7 | 30.3 | 0.23 | 1087 | 6.32 | 0.06 | 79.2 | 0.06 | 6.43 | 27.4 | 39 | 0.21 | 1.36 | 262 | 0.08 | 1.38 | 1720 | 0.007 | 28.2 | 45.5 | 0.54 |
| Indicator | Oxic | Suboxic | Anoxic | Euxinic | The Studied Phoshates |
|---|---|---|---|---|---|
| H2S | No free H2S in the water column | Free H2S present in the water column | |||
| O2 concentration in bottom waters | O2 > 2 | 0.2 < O2 < 2 | O2 < 0.2 | O2 = 0 | |
| Th/U | >7 | 2–7 | 0–2 | - | 0.88 |
| V/Cr | <2 | 2–4.25 | >4.25 | >4.25 | 0.49 |
| Ni/Co | <5 | 5–7 | >7 | - | 3.69 |
| V/Sc | - | - | - | >24 | 45.5 |
| Sample No | Dedection Limit | DY-01 | DY-02 | DY-03 | DY-11 | DY-12 | DY-13 | DY-14 | DY-20 | DY-21 | DY-22 | DY-23 | DY-24 | DY-25 |
|---|---|---|---|---|---|---|---|---|---|---|---|---|---|---|
| La | 0.5 | 10.1 | 1.30 | 6.60 | 15.4 | 9.10 | 4.10 | 5.90 | 11.7 | 1.00 | 10.5 | 4.40 | 12.8 | 7.60 |
| Ce | 0.1 | 3.10 | 0.40 | 1.90 | 5.10 | 2.80 | 1.30 | 2.20 | 3.60 | 0.30 | 3.30 | 1.40 | 3.90 | 2.40 |
| Pr | 0.02 | 1.17 | 0.13 | 0.67 | 1.74 | 0.98 | 0.46 | 0.61 | 1.29 | 0.11 | 1.09 | 0.49 | 1.39 | 0.78 |
| Nd | 0.02 | 4.16 | 0.51 | 2.57 | 7.63 | 4.01 | 1.85 | 2.37 | 5.31 | 0.45 | 4.81 | 1.92 | 5.67 | 3.02 |
| Sm | 0.02 | 0.80 | 0.07 | 0.59 | 1.39 | 0.74 | 0.34 | 0.48 | 0.84 | 0.09 | 0.86 | 0.42 | 1.09 | 0.62 |
| Eu | 0.02 | 0.27 | 0.03 | 0.13 | 0.44 | 0.22 | 0.11 | 0.15 | 0.30 | 0.02 | 0.24 | 0.10 | 0.34 | 0.21 |
| Gd | 0.02 | 1.50 | 0.22 | 0.82 | 2.07 | 1.37 | 0.49 | 0.75 | 1.60 | 0.13 | 1.40 | 0.58 | 1.99 | 0.94 |
| Tb | 0.02 | 0.25 | 0.03 | 0.13 | 0.38 | 0.21 | 0.09 | 0.12 | 0.25 | 0.03 | 0.20 | 0.09 | 0.27 | 0.16 |
| Dy | 0.02 | 1.58 | 0.17 | 0.97 | 2.64 | 1.47 | 0.68 | 0.87 | 1.75 | 0.14 | 1.56 | 0.69 | 1.78 | 1.30 |
| Y | 0.02 | 27.4 | 4.12 | 18.7 | 46.8 | 27.9 | 12.0 | 16.5 | 29.9 | 3.00 | 27.8 | 13.1 | 31.6 | 22.1 |
| Ho | 0.02 | 0.42 | 0.05 | 0.29 | 0.77 | 0.40 | 0.17 | 0.24 | 0.50 | 0.04 | 0.44 | 0.17 | 0.53 | 0.33 |
| Er | 0.02 | 1.33 | 0.18 | 0.90 | 2.45 | 1.39 | 0.60 | 0.88 | 1.60 | 0.14 | 1.33 | 0.65 | 1.77 | 1.11 |
| Tm | 0.02 | 0.20 | 0.02 | 0.14 | 0.37 | 0.23 | 0.09 | 0.12 | 0.24 | 0.02 | 0.25 | 0.08 | 0.25 | 0.16 |
| Lu | 0.02 | 0.24 | 0.03 | 0.14 | 0.42 | 0.22 | 0.10 | 0.15 | 0.25 | 0.02 | 0.24 | 0.10 | 0.26 | 0.19 |
| Yb | 0.02 | 1.24 | 0.14 | 0.85 | 2.20 | 1.23 | 0.55 | 0.74 | 1.32 | 0.13 | 1.19 | 0.53 | 1.51 | 1.02 |
| ∑REE | - | 53.8 | 7.42 | 35.4 | 89.9 | 57.3 | 22.9 | 32.1 | 60.5 | 5.62 | 55.2 | 24.7 | 35.1 | 41.9 |
| Y/Ho | - | 65 | 82 | 65 | 61 | 70 | 71 | 69 | 60 | 74 | 63 | 77 | 60 | 67 |
| (Ce/Ce*)n | - | 0.21 | 0.16 | 0.18 | 0.20 | 0.20 | 0.18 | 0.21 | 0.22 | 0.39 | 0.19 | 0.17 | 0.22 | 0.19 |
| (Eu/Eu*)n | - | 1.90 | 2.23 | 1.22 | 1.85 | 1.67 | 1.72 | 1.69 | 2.01 | 1.25 | 1.58 | 1.29 | 1.81 | 1.84 |
| (Y/Y*)n | - | 3.22 | 4.20 | 3.49 | 3.46 | 3.49 | 3.14 | 3.41 | 3.22 | 3.70 | 3.31 | 3.37 | 3.34 | 3.11 |
| (Pr/Pr)n | - | 3.46 | 2.94 | 3.22 | 3.19 | 3.21 | 3.22 | 2.53 | 3.31 | 1.25 | 3.05 | 3.18 | 3.30 | 2.97 |
| (La/Yb)n | - | 0.60 | 0.69 | 0.57 | 0.51 | 0.55 | 0.55 | 0.59 | 0.65 | 0.57 | 0.76 | 0.64 | 0.63 | 0.55 |
| ((Gd/Yb)n | - | 0.73 | 0.95 | 0.58 | 0.57 | 0.67 | 0.54 | 0.61 | 0.73 | 0.61 | 0.71 | 0.66 | 0.77 | 0.68 |
| (Sm/Pr)n | - | 1.00 | 0.06 | 0.06 | 0.05 | 0.06 | 0.05 | 0.06 | 0.06 | 0.06 | 0.04 | 0.05 | 0.05 | 0.06 |
| (Sm/Yb)n | - | 0.33 | 0.25 | 0.35 | 0.32 | 0.31 | 0.31 | 0.33 | 0.32 | 0.35 | 0.37 | 0.40 | 0.37 | 0.31 |
| 204Pb | 206Pb | 207Pb | 208Pb | 206Pb/204Pb | 207Pb/204Pb | 208Pb/204Pb | |
|---|---|---|---|---|---|---|---|
| DL | 0.01 | 0.01 | 0.01 | 0.01 | |||
| DY-01 | 0.035 | 0.68 | 0.550 | 1.36 | 19.40 | 15.71 | 38.86 |
| DY-02 | 0.020 | 0.39 | 0.315 | 0.78 | 19.53 | 15.75 | 39.00 |
| DY-03 | 0.025 | 0.48 | 0.393 | 0.98 | 19.20 | 15.72 | 39.20 |
| DY-11 | 0.033 | 0.62 | 0.516 | 1.28 | 18.80 | 15.64 | 38.80 |
| DY-12 | 0.028 | 0.54 | 0.468 | 1.10 | 19.30 | 15.70 | 39.30 |
| DY-13 | 0.016 | 0.31 | 0.266 | 0.62 | 19.10 | 15.63 | 38.75 |
| DY-14 | 0.038 | 0.73 | 0.602 | 1.48 | 19.20 | 15.84 | 38.90 |
| DY-20 | 0.036 | 0.68 | 0.564 | 1.41 | 18.90 | 15.67 | 39.17 |
| DY-21 | 0.028 | 0.54 | 0.440 | 1.10 | 19.30 | 15.71 | 39.30 |
| DY-22 | 0.020 | 0.39 | 0.315 | 0.79 | 19.25 | 15.75 | 39.35 |
| DY-23 | 0.018 | 0.35 | 0.282 | 0.72 | 19.44 | 15.67 | 38.80 |
| DY-24 | 0.040 | 0.76 | 0.628 | 1.55 | 18.90 | 15.70 | 38.75 |
| DY-25 | 0.030 | 0.57 | 0.470 | 1.18 | 19.00 | 15.67 | 39.33 |
| Avrg | 0.028 | 0.54 | 0.447 | 1.102 | 19.18 | 15.70 | 39.04 |
Publisher’s Note: MDPI stays neutral with regard to jurisdictional claims in published maps and institutional affiliations. |
© 2022 by the authors. Licensee MDPI, Basel, Switzerland. This article is an open access article distributed under the terms and conditions of the Creative Commons Attribution (CC BY) license (https://creativecommons.org/licenses/by/4.0/).
Share and Cite
Gundogar, D.Y.; Sasmaz, A. Geochemical Approach to Determine the Possible Precipitation Parameters of the Coniacian–Santonian Mazıdağı Phosphates, Mardin, Turkey. Minerals 2022, 12, 1544. https://doi.org/10.3390/min12121544
Gundogar DY, Sasmaz A. Geochemical Approach to Determine the Possible Precipitation Parameters of the Coniacian–Santonian Mazıdağı Phosphates, Mardin, Turkey. Minerals. 2022; 12(12):1544. https://doi.org/10.3390/min12121544
Chicago/Turabian StyleGundogar, Derya Yildirim, and Ahmet Sasmaz. 2022. "Geochemical Approach to Determine the Possible Precipitation Parameters of the Coniacian–Santonian Mazıdağı Phosphates, Mardin, Turkey" Minerals 12, no. 12: 1544. https://doi.org/10.3390/min12121544