Application of Mobile Mapping System to a Cable-Stayed Bridge in Thailand

Abstract
:1. Introduction
2. Mobile Mapping System
3. Research Methodology
4. Experimental Results
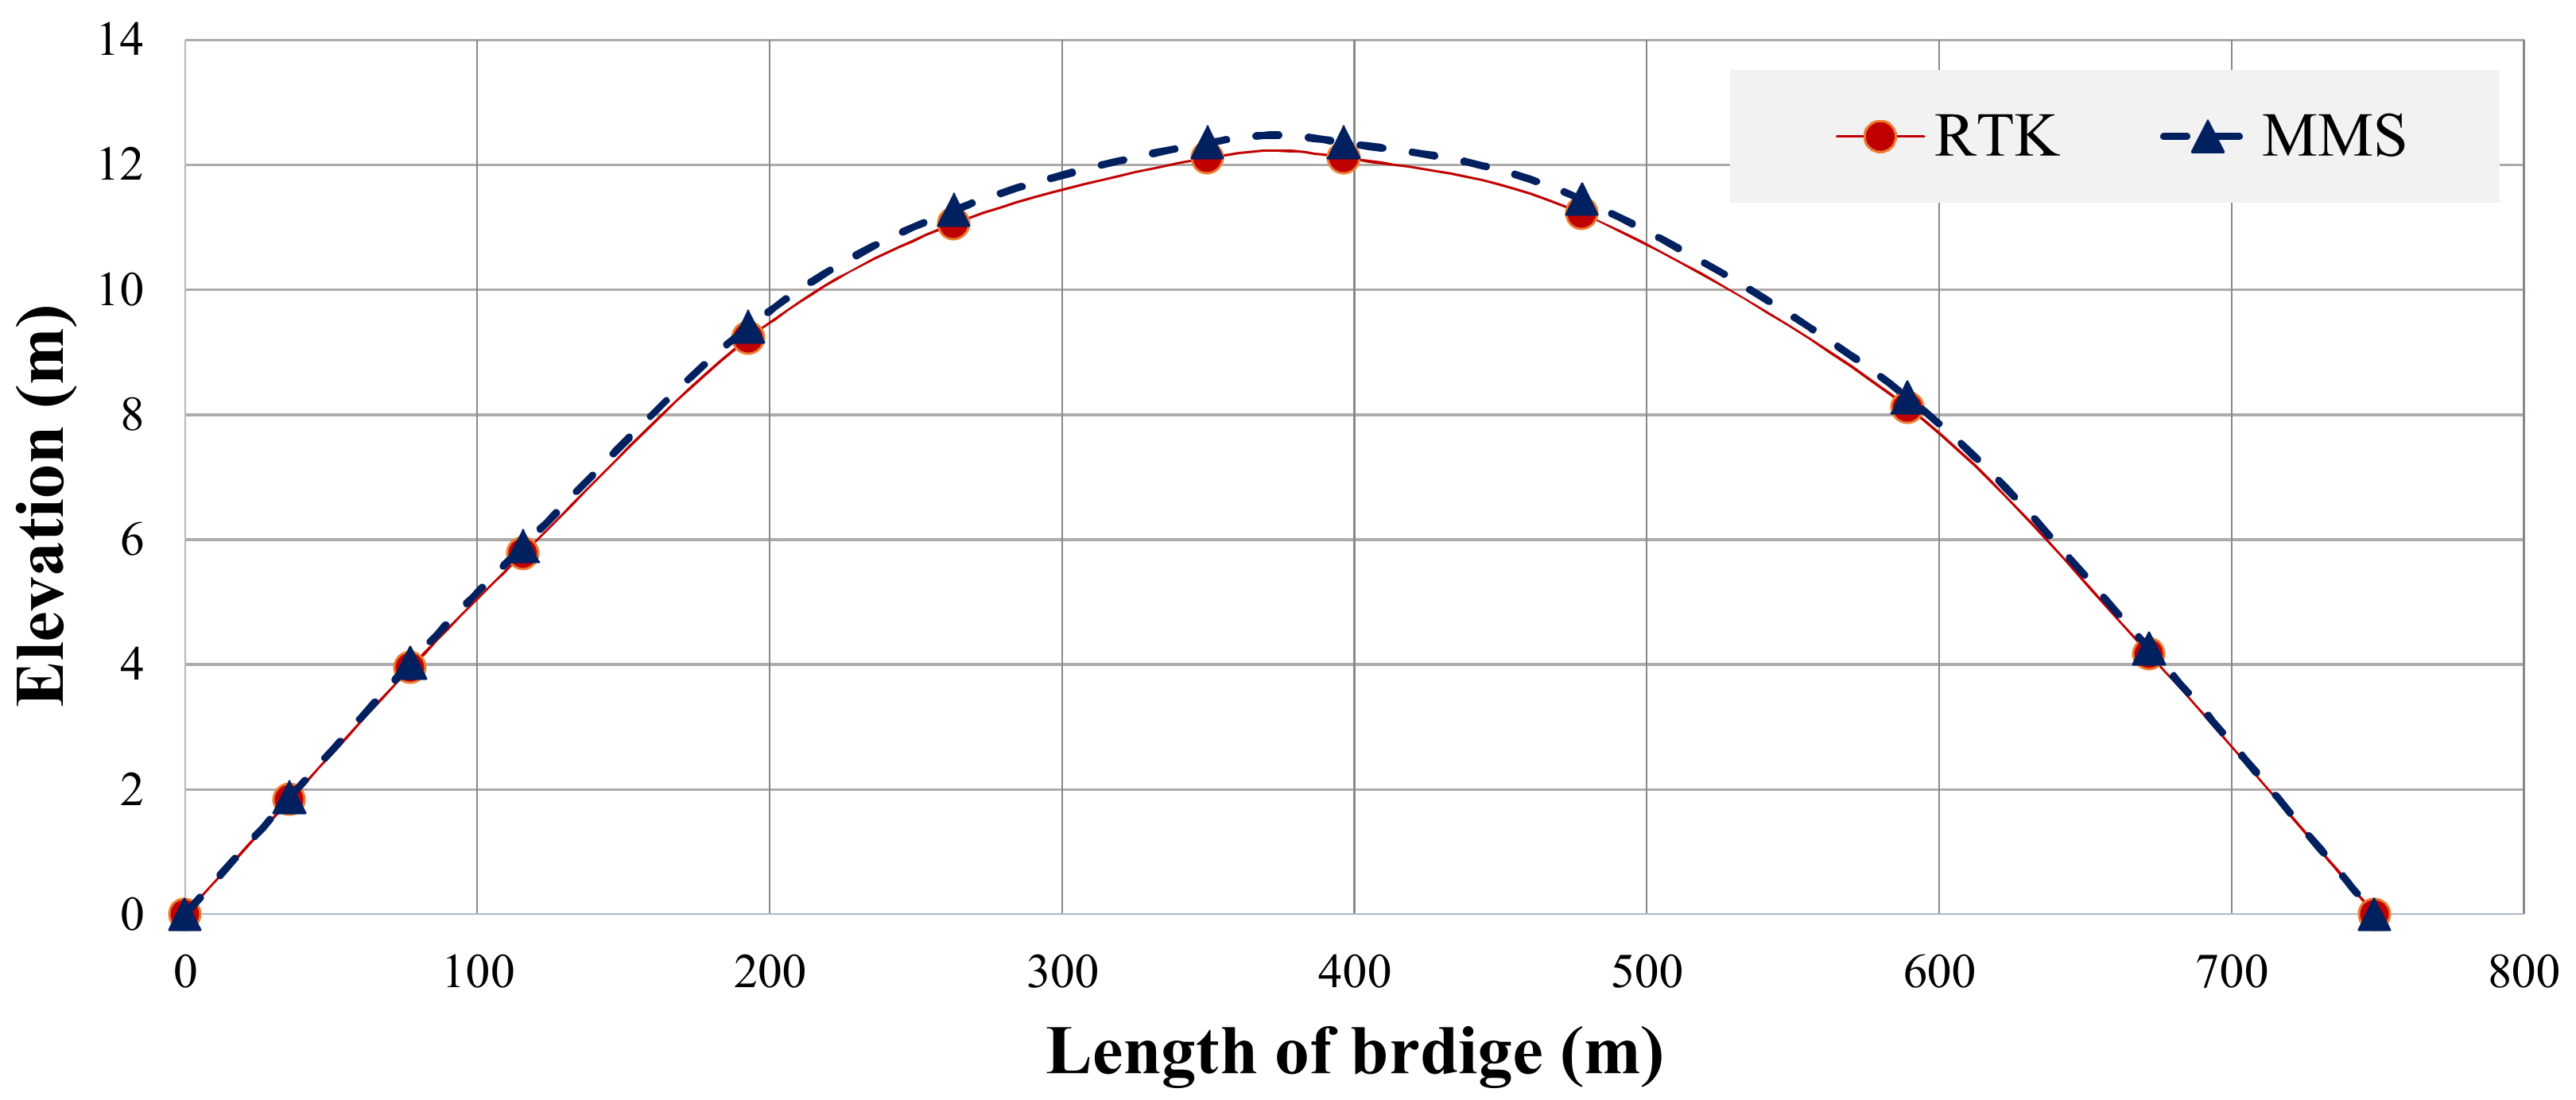
4.1. Validation of Bridge Profile Measurement
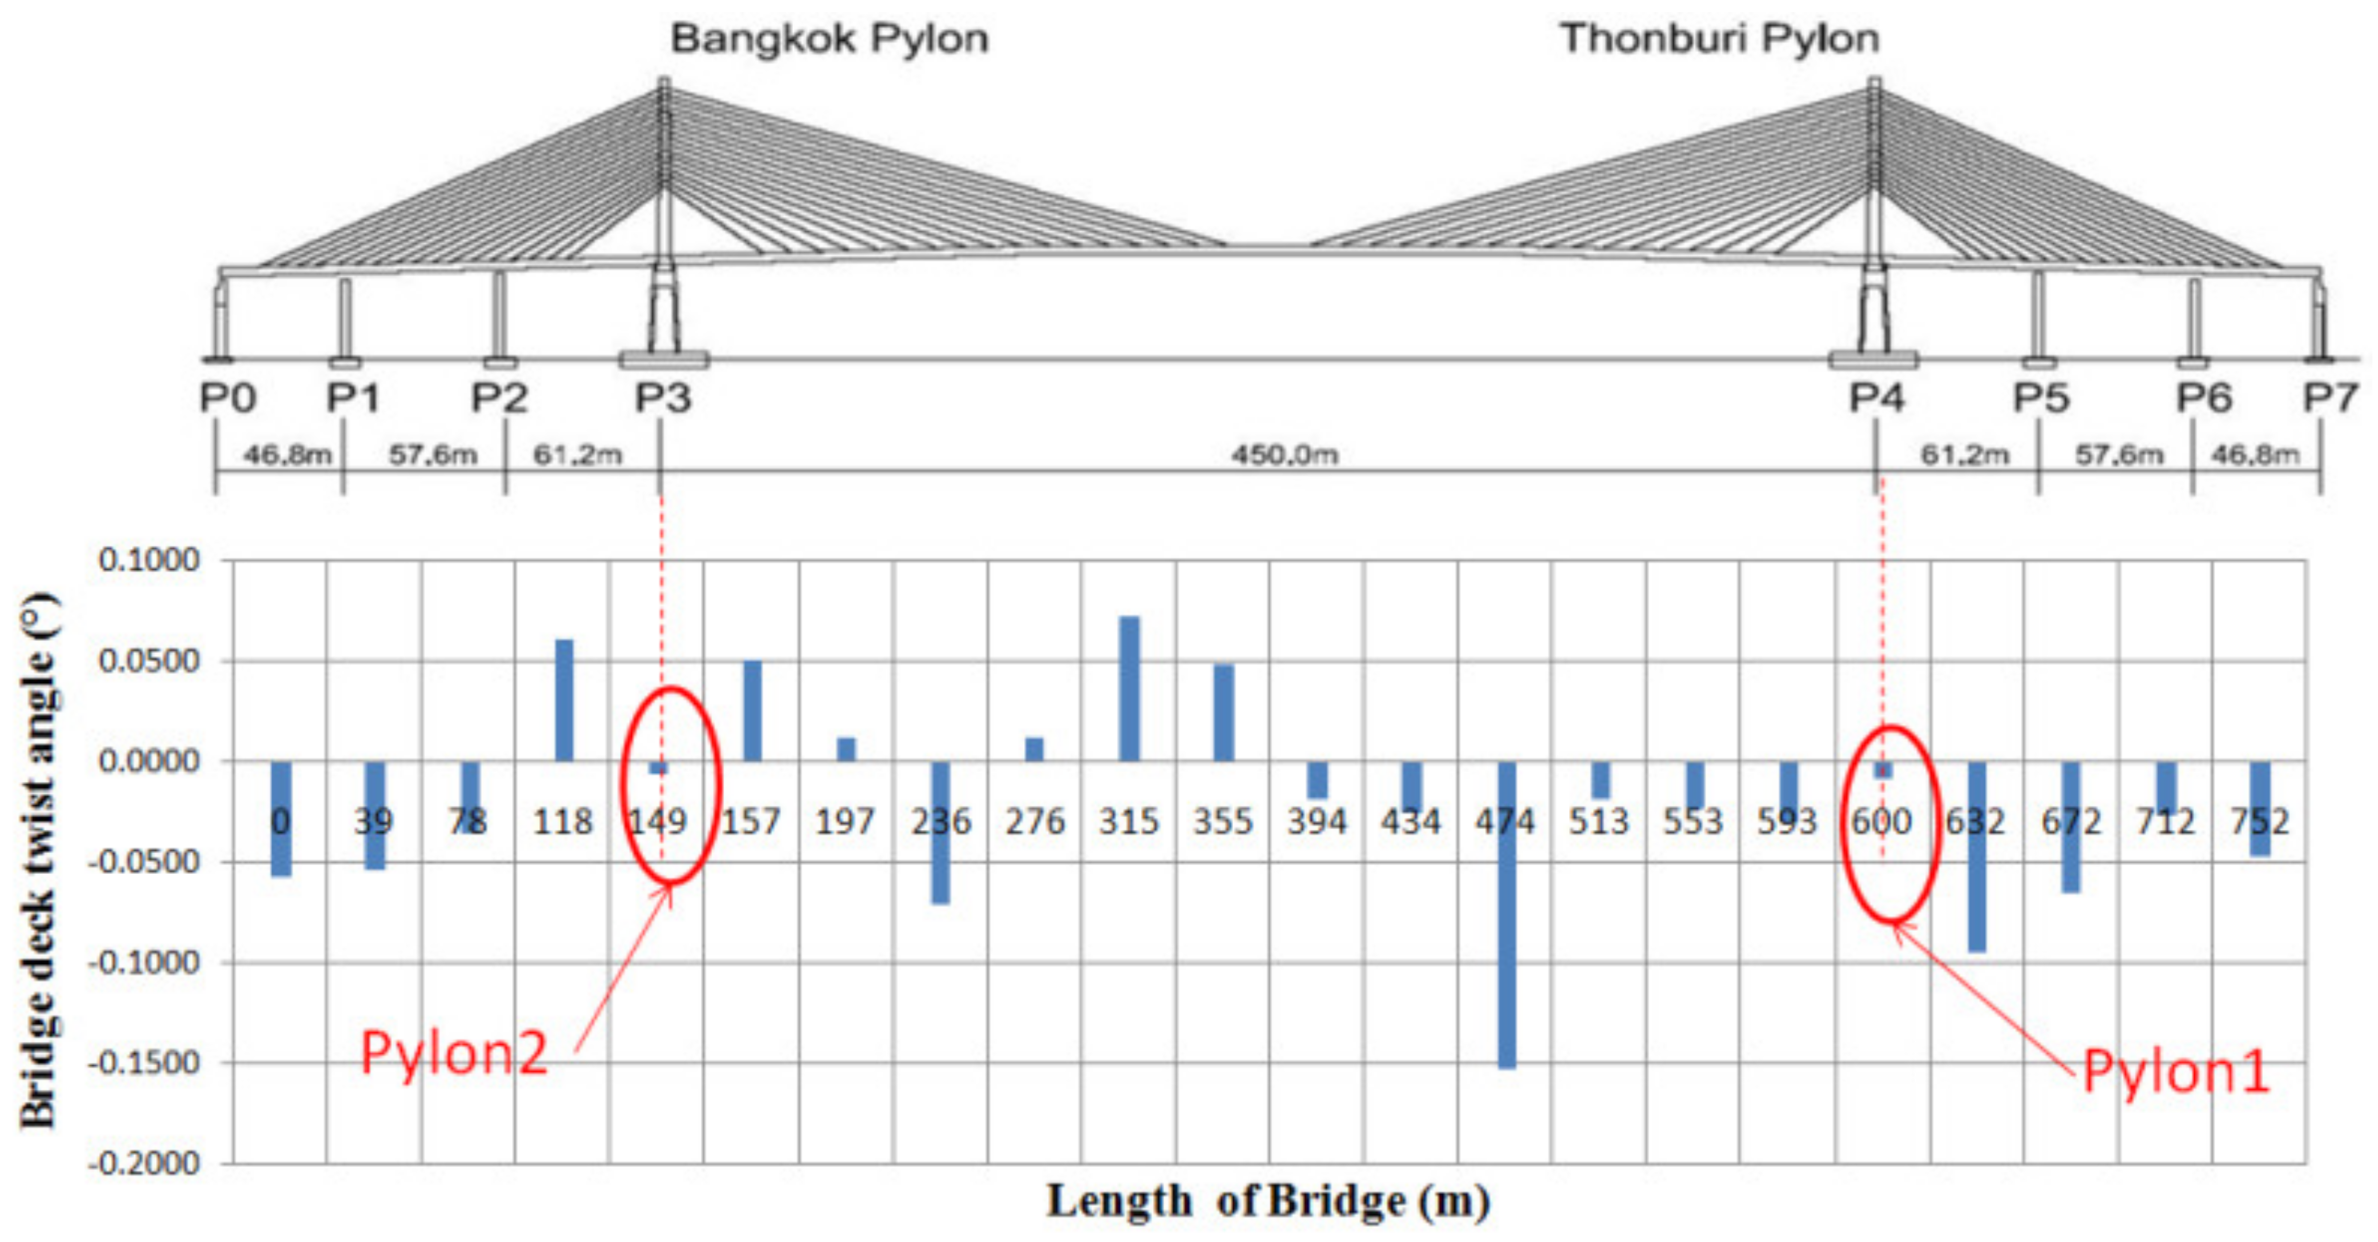
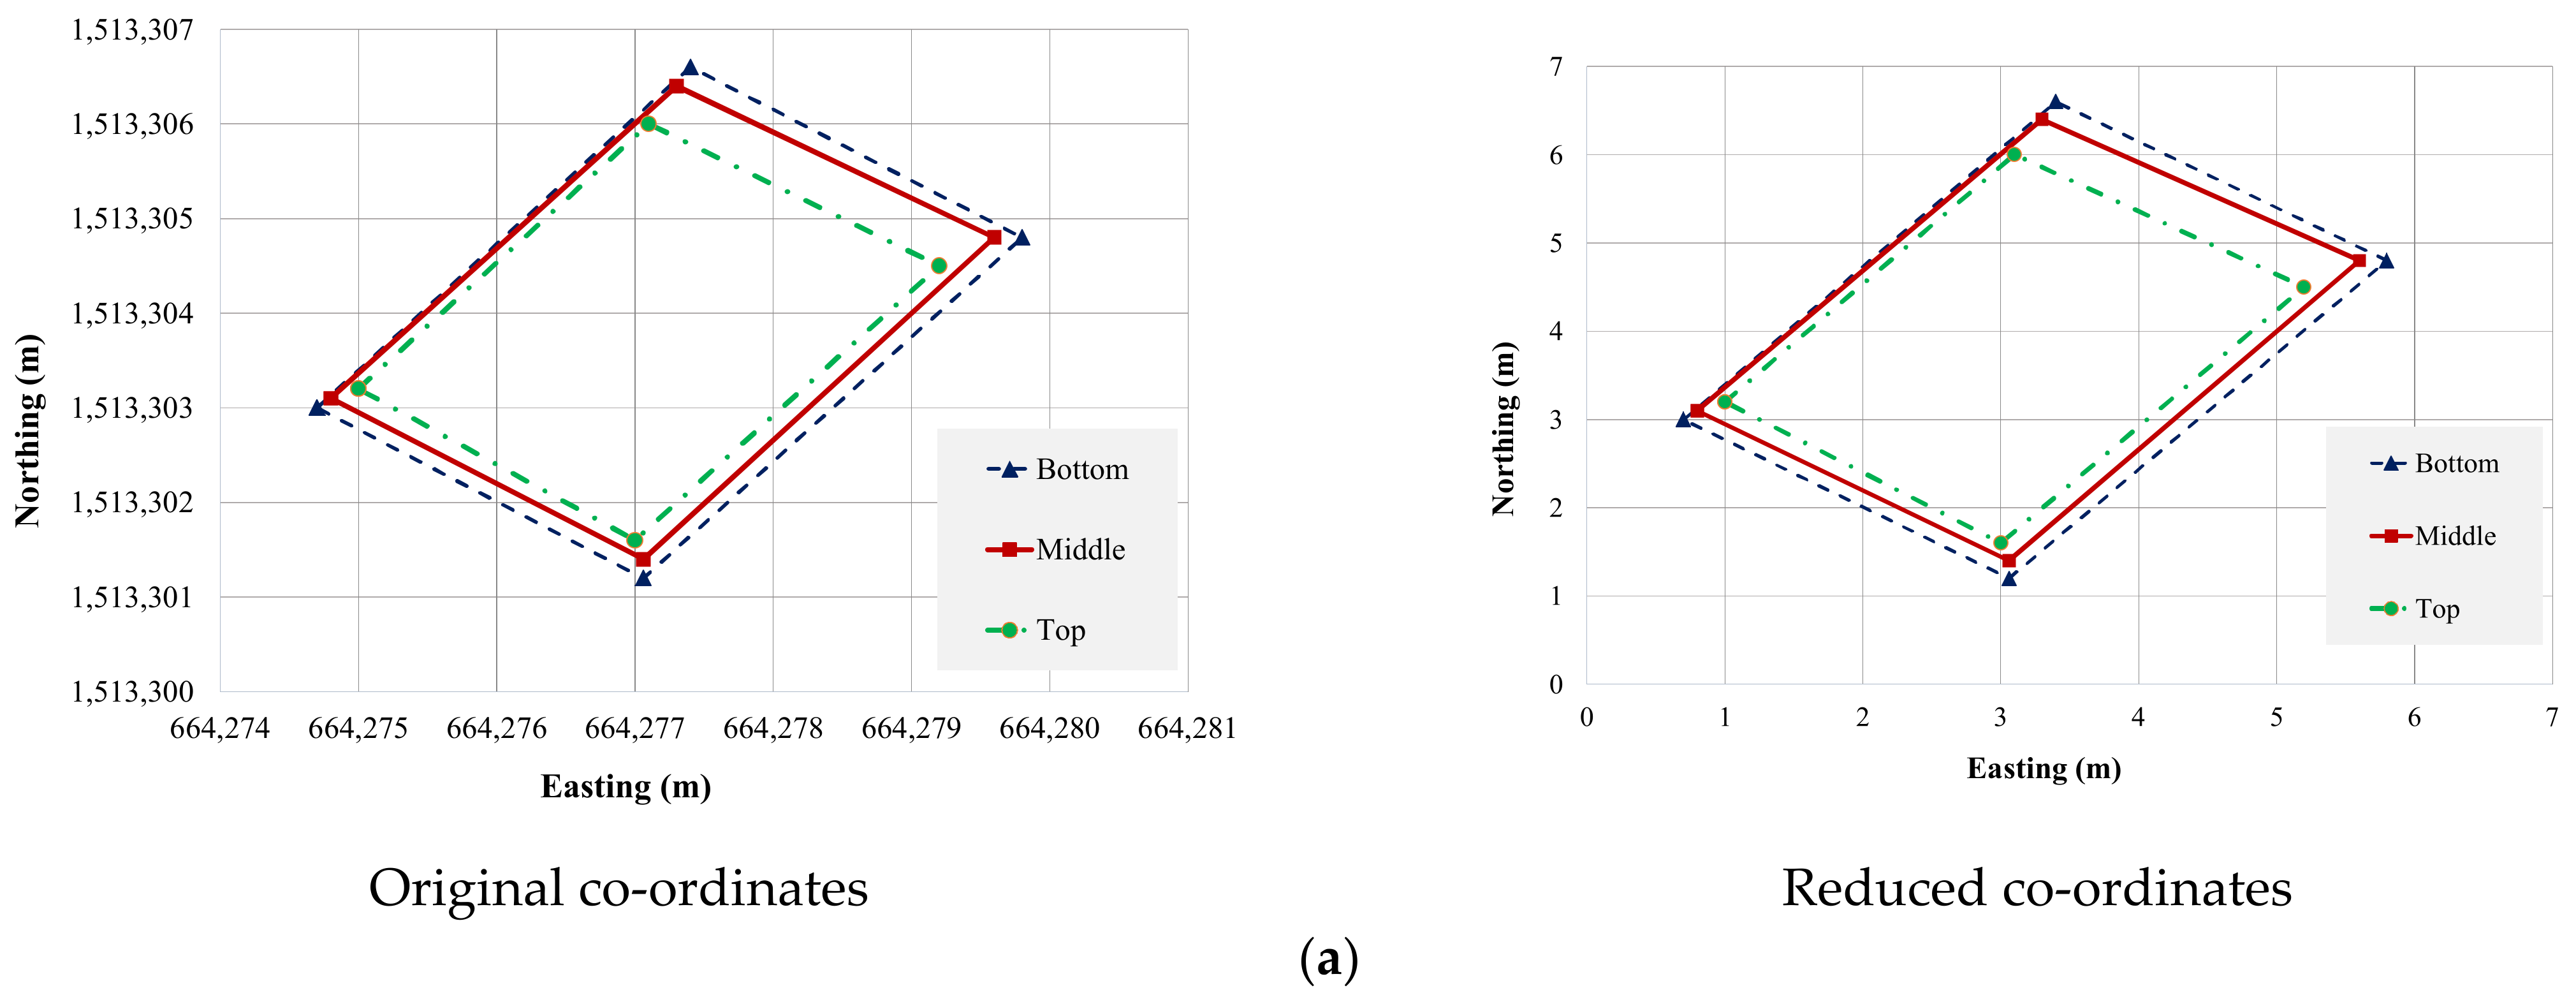
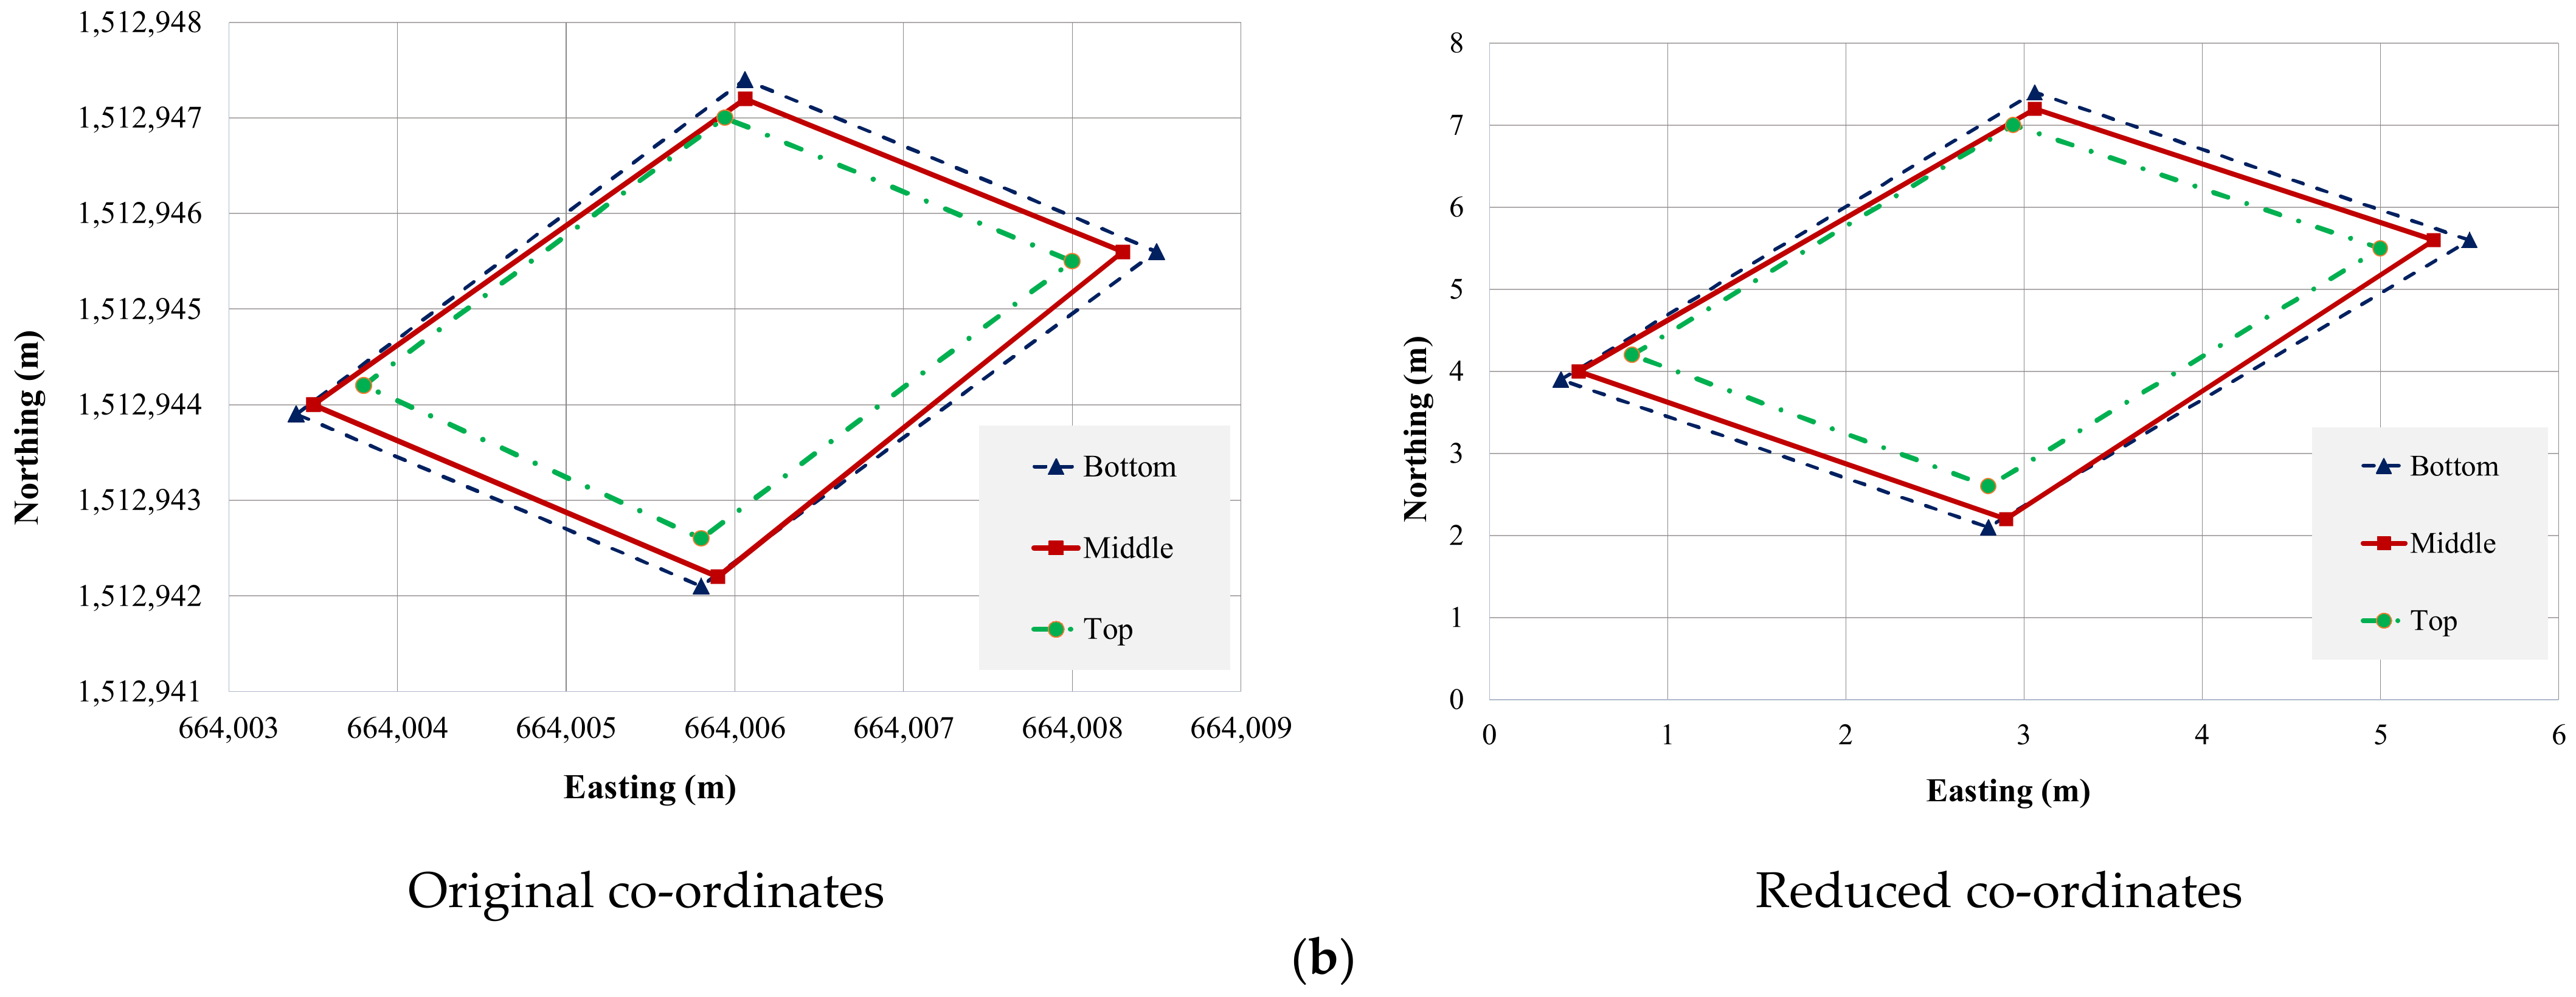
4.2. Bridge Deck Twist Angle
4.3. Pylon Deflections
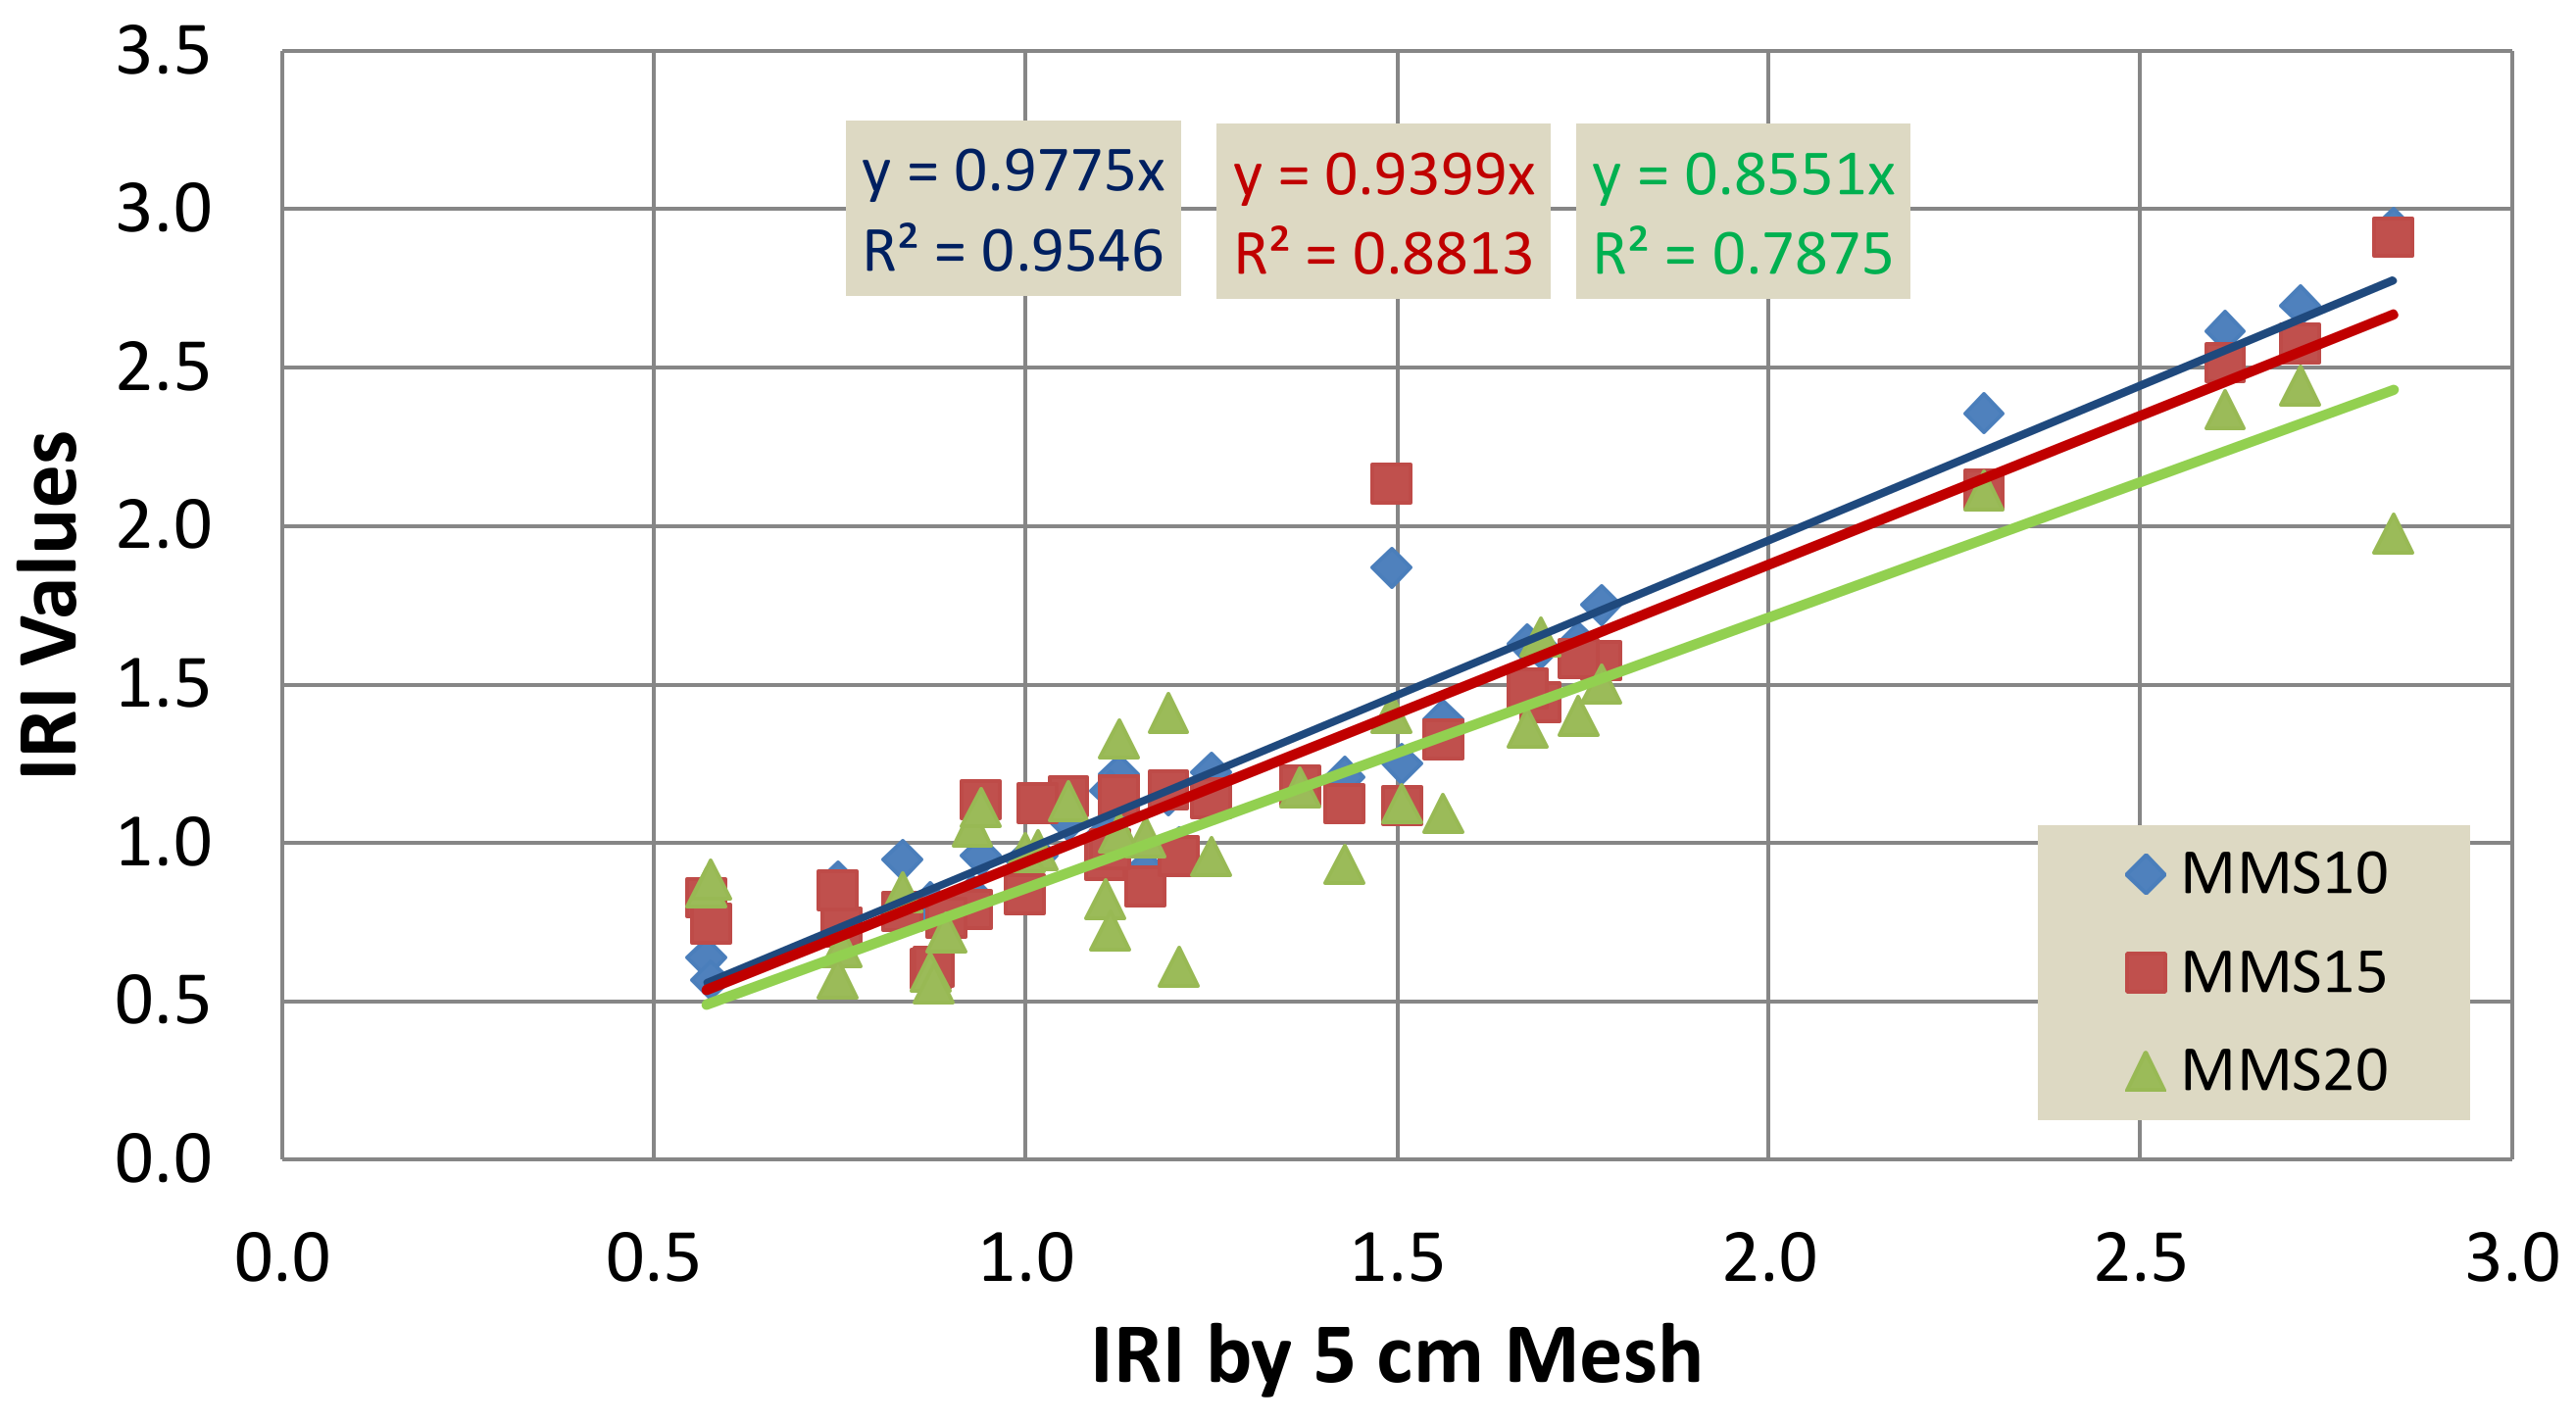
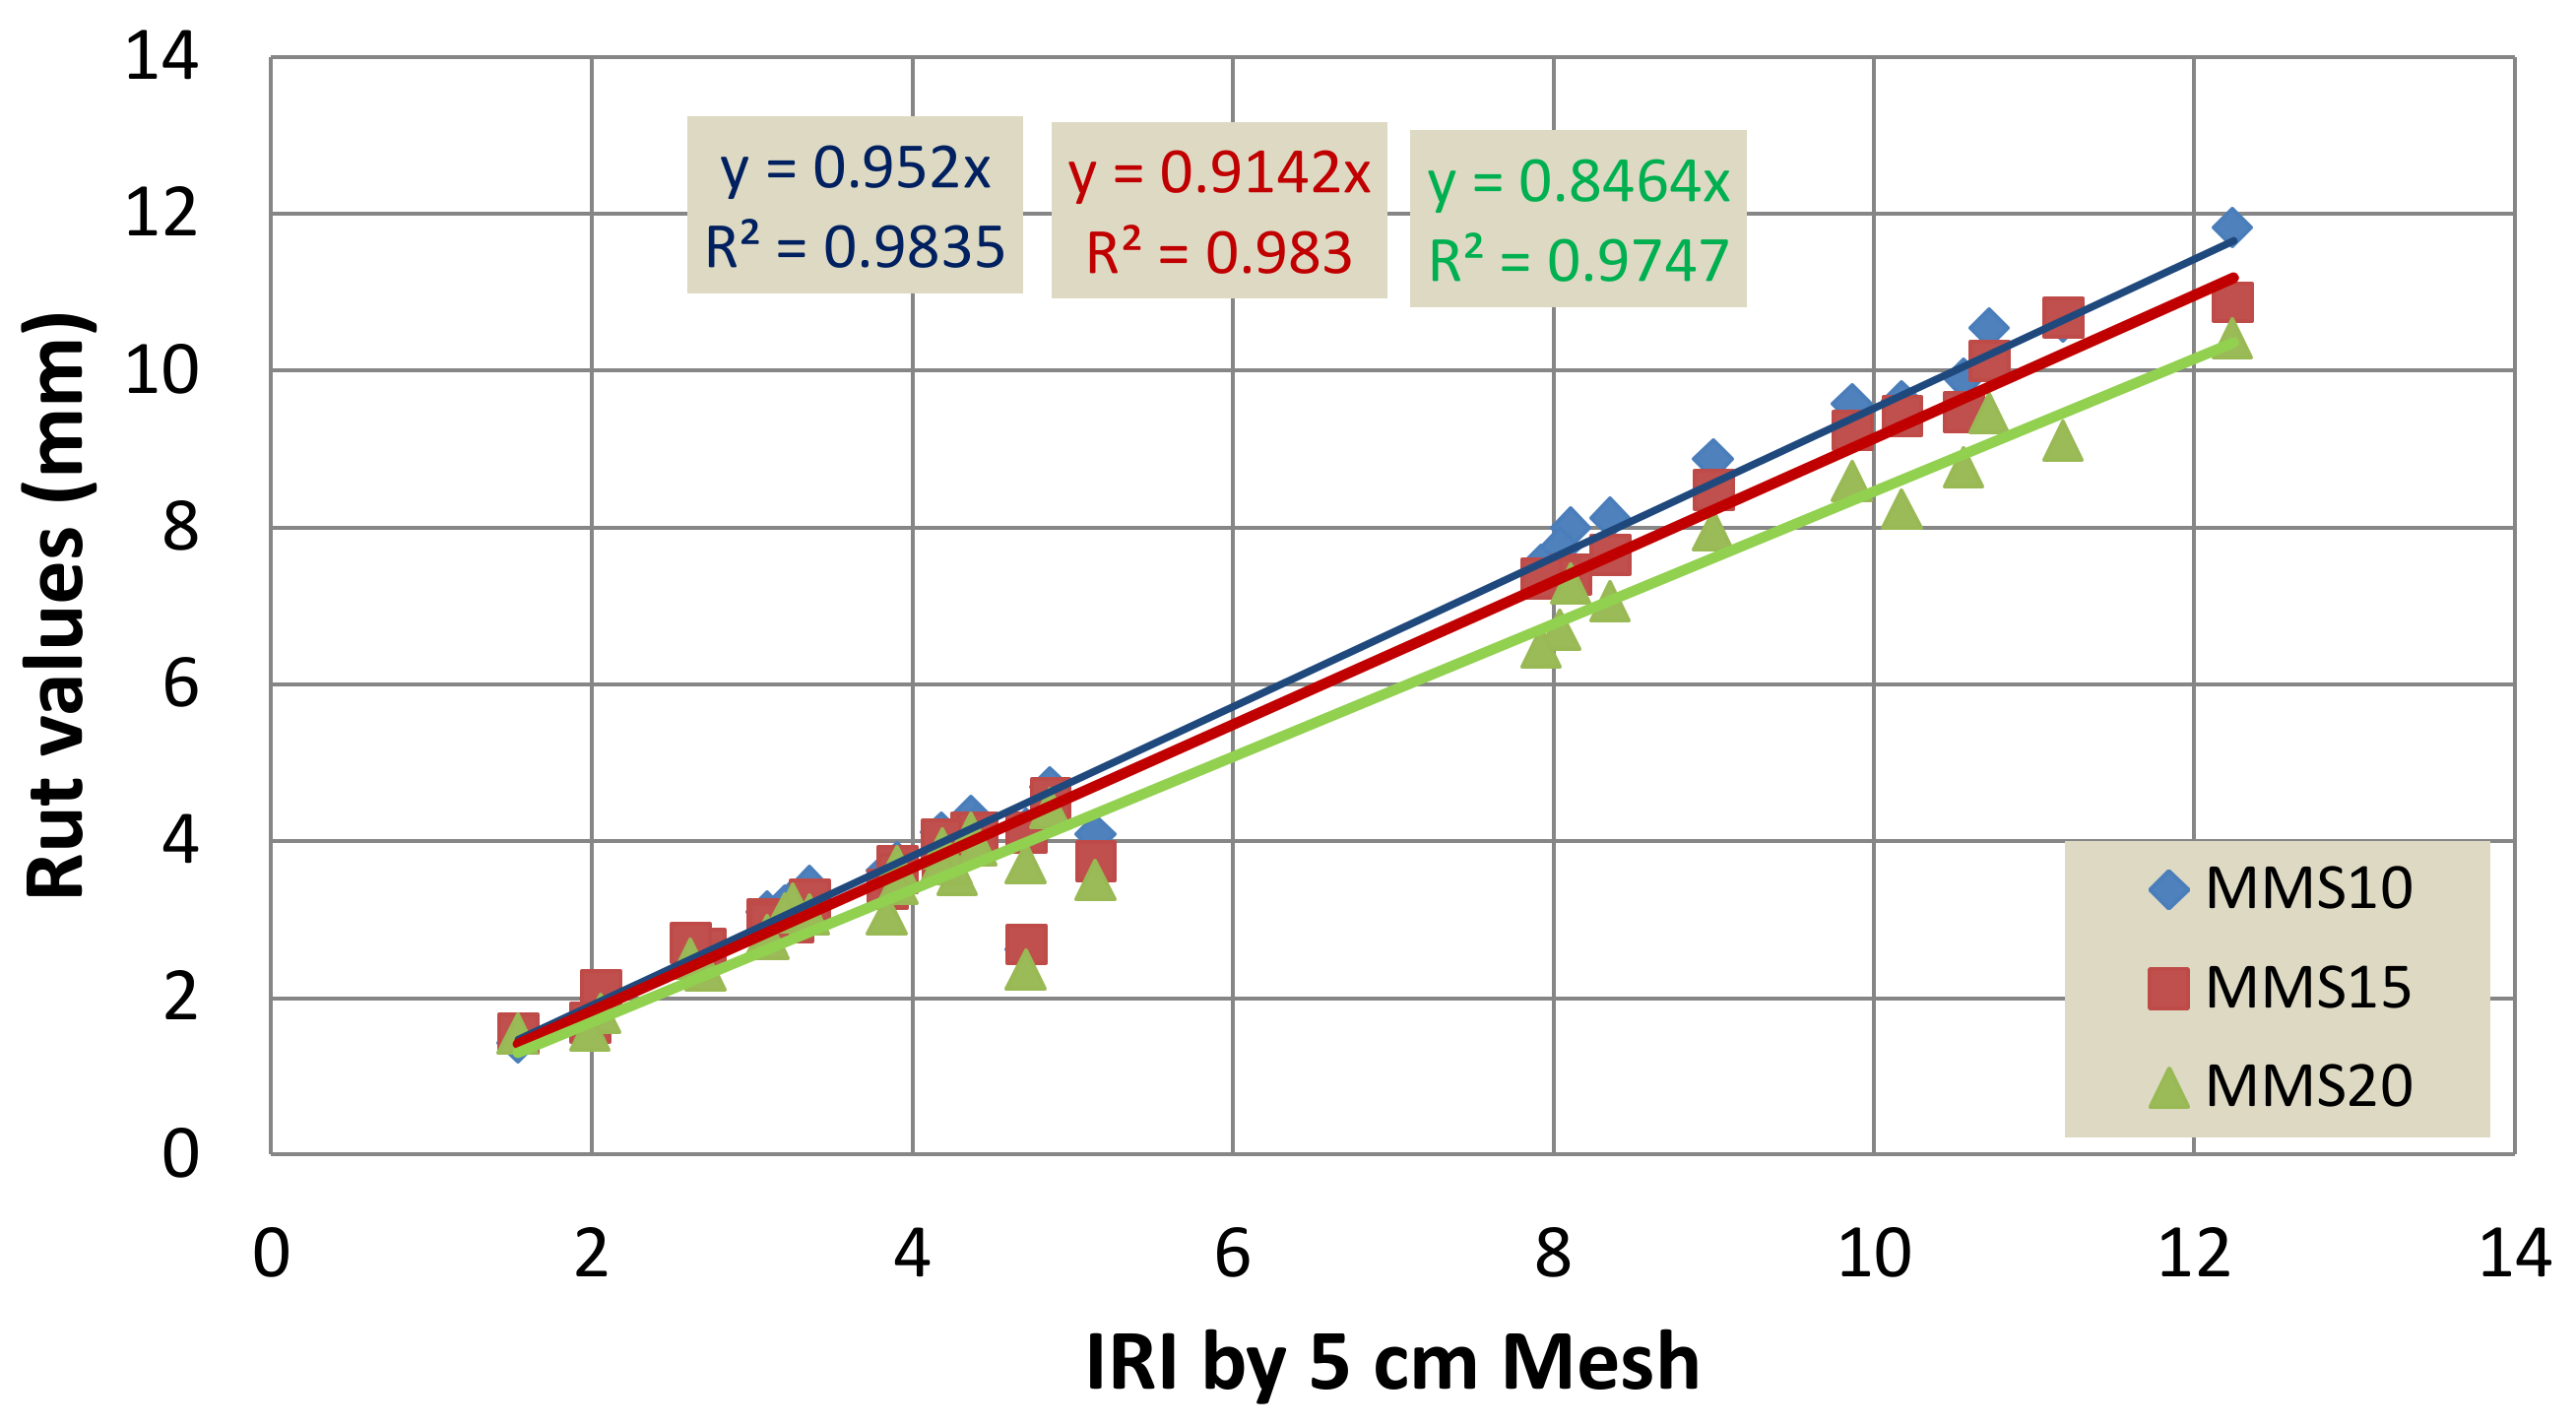
4.4. Effect of Mesh Size on Measured International Roughness Index
4.5. Comparison of IRI and Rutting Depth Measured by MLS and Profilometer
4.5.1. Comparison of IRI
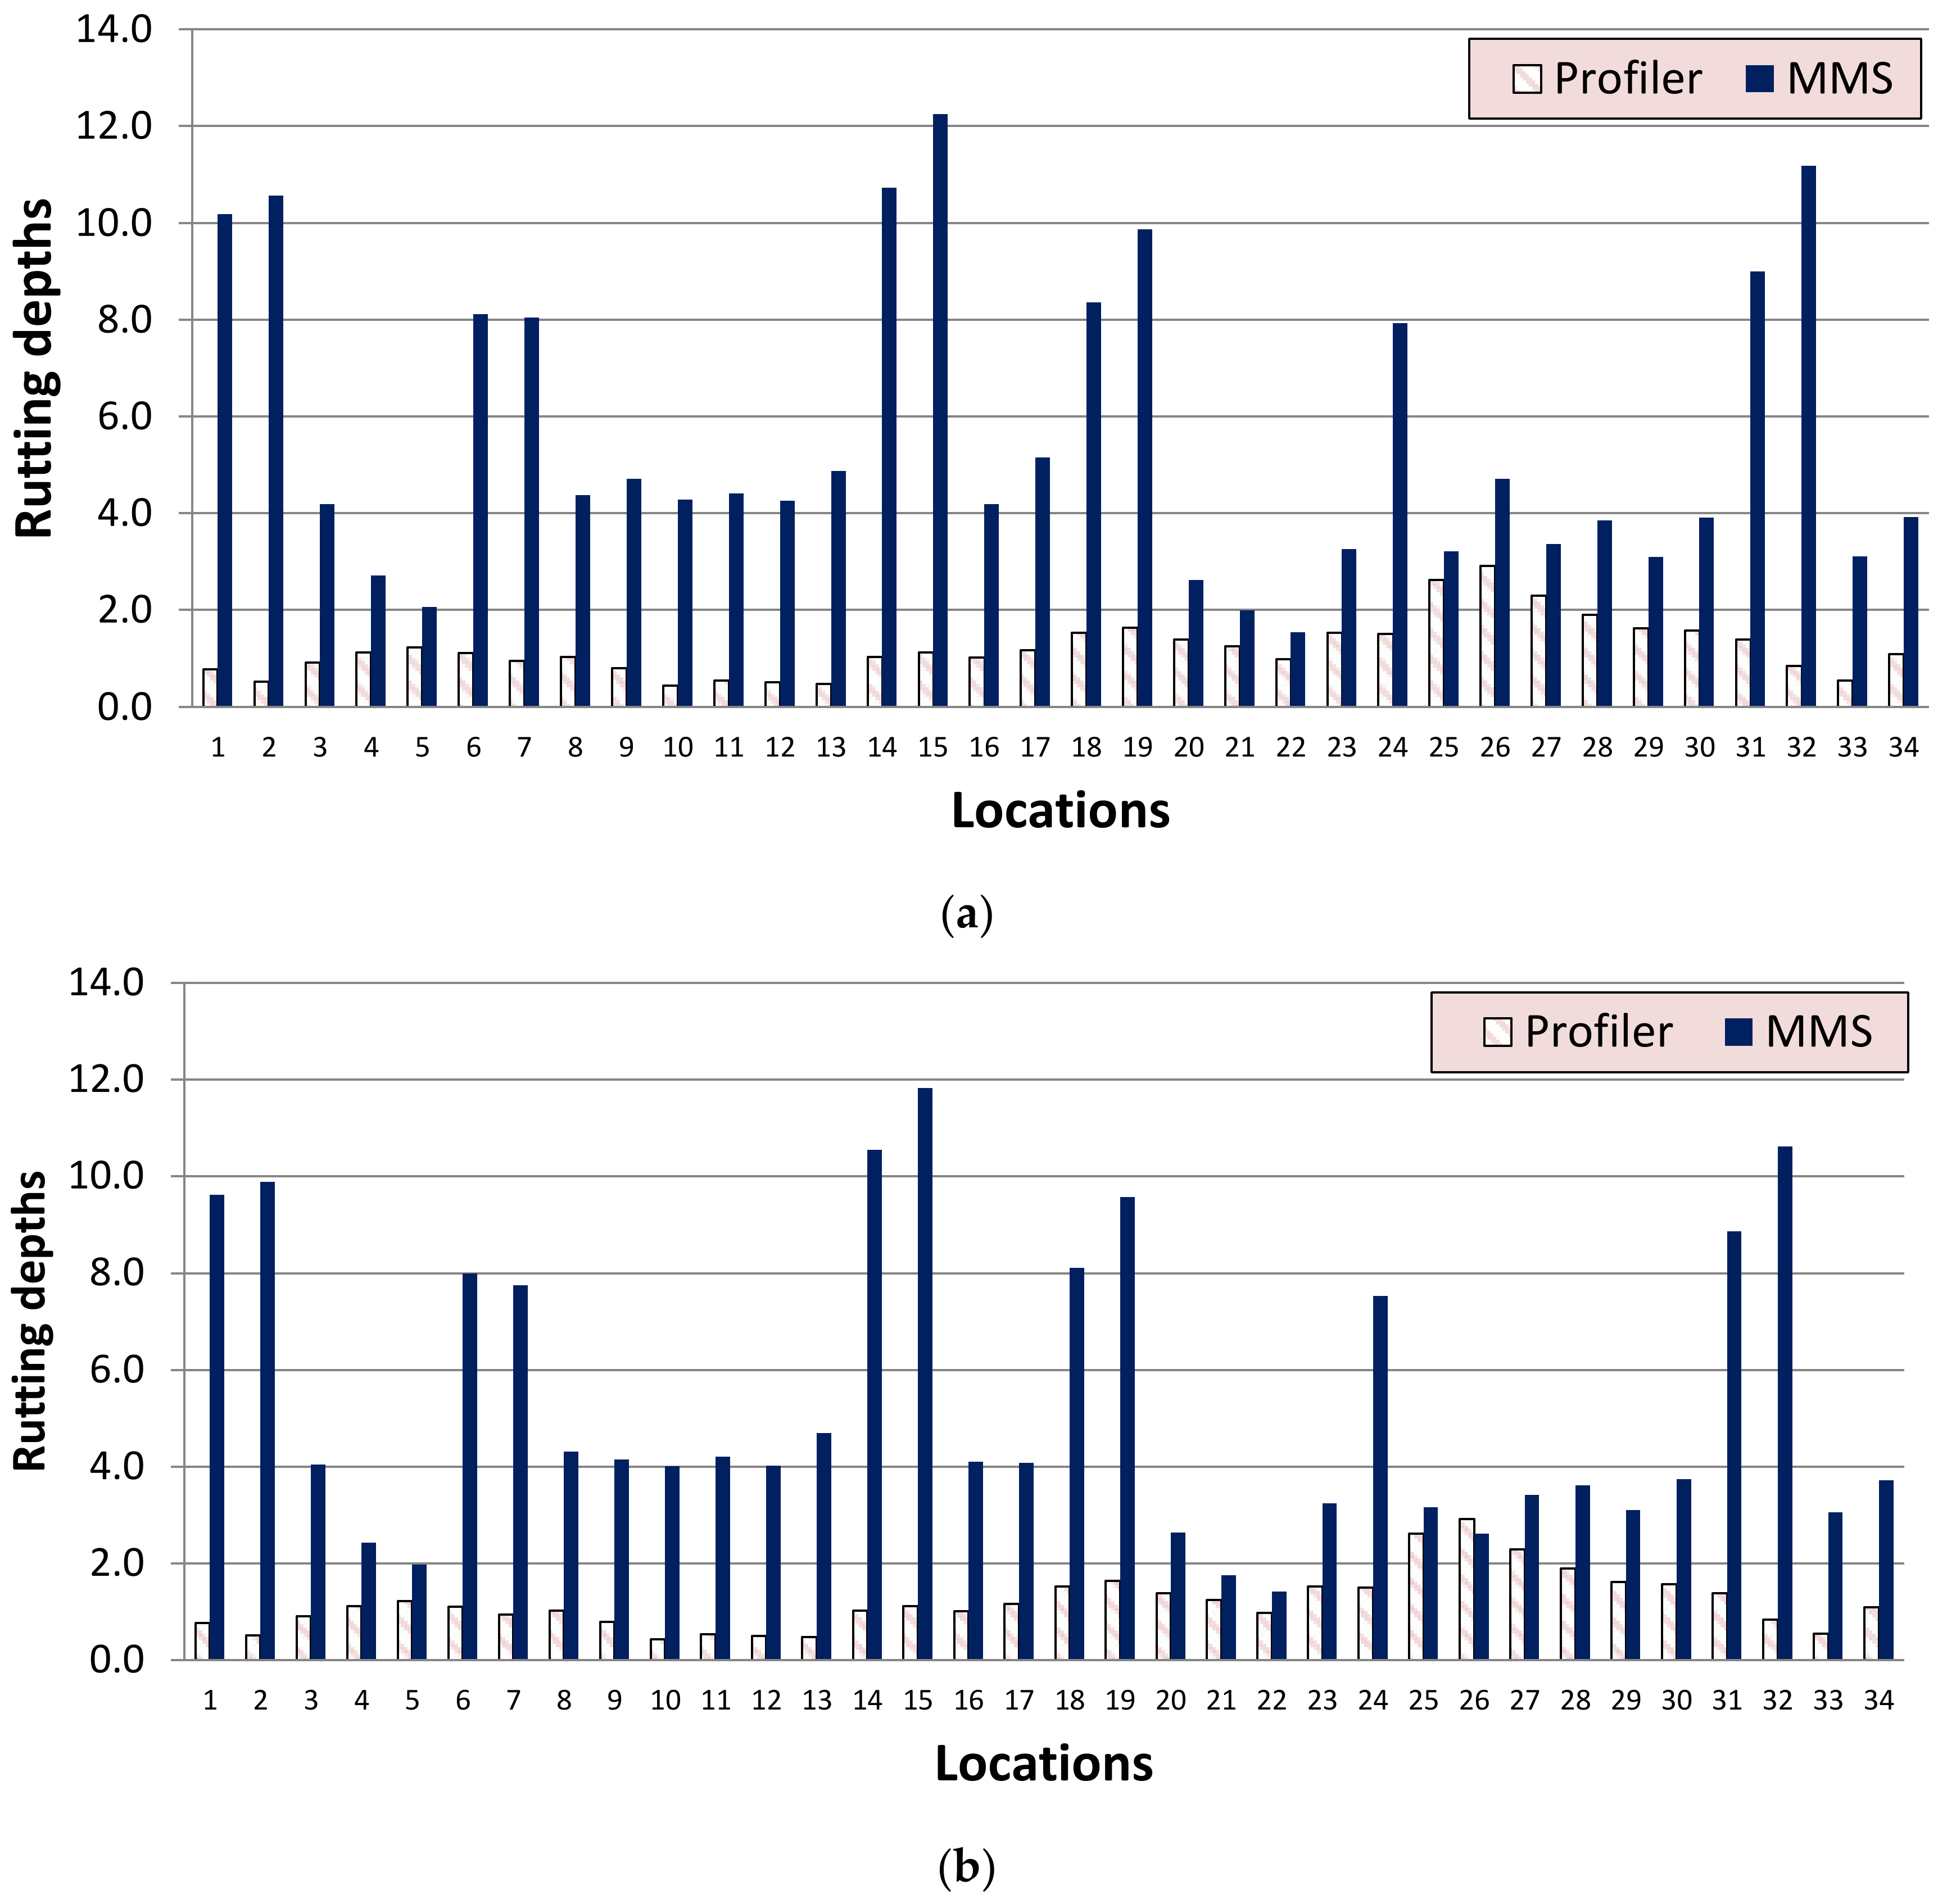
4.5.2. Comparison of Rutting Depths
4.6. Uncertainty Analysis
5. Conclusions
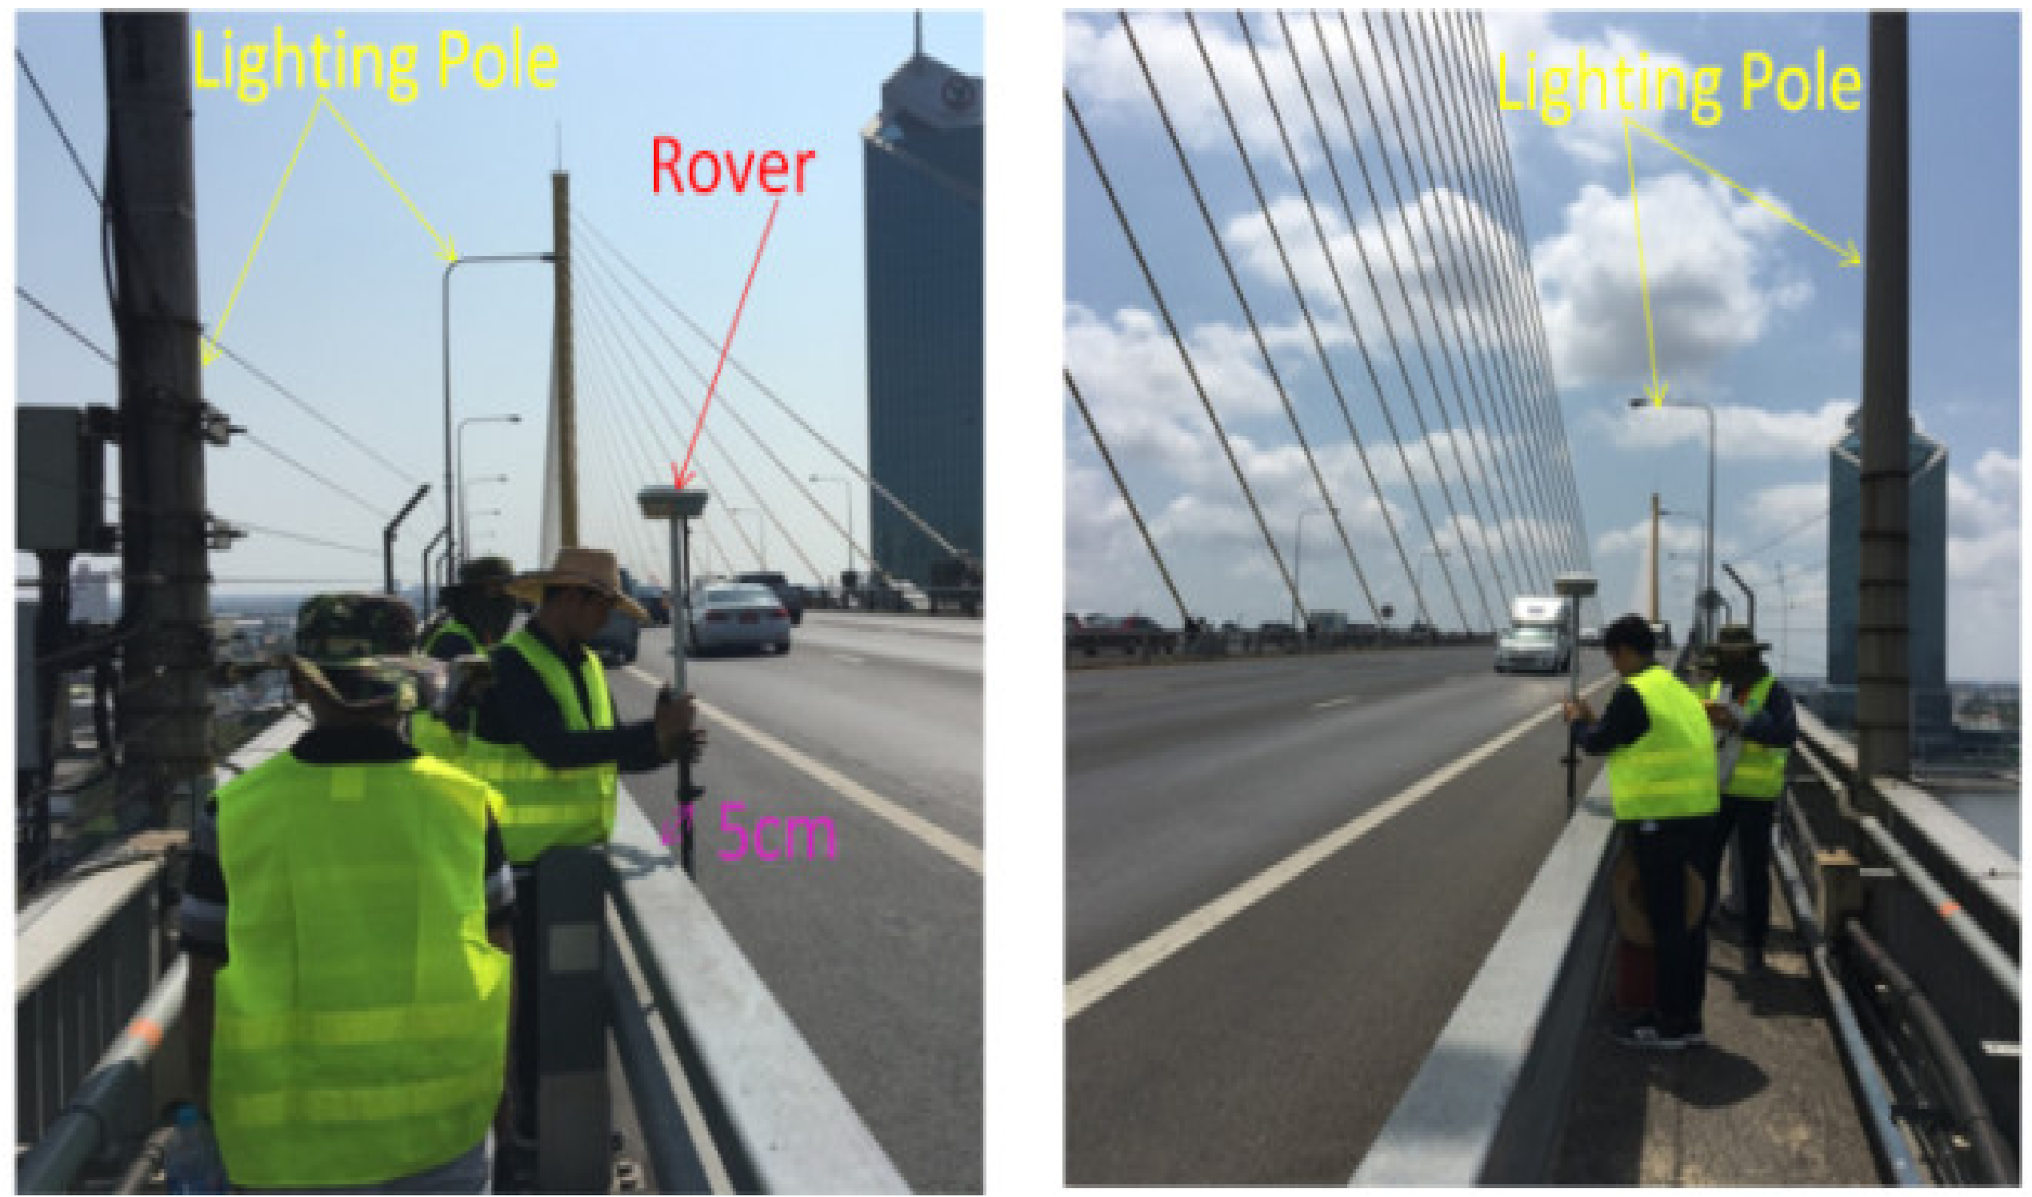
- The MLS measurement can be performed within a 20 km radius of the base station. Thus, a single base station was established in the Bangkok center. MLS measurement took a short time (5 days for 5 locations), but data preparation needed some time. Data must be rectified for correct position, clean unwanted points, and combine several scanning data. This data registration process took 2–3 months. Two kilometers of road scanning produced about 33.5 GB of data. So, enough storage and powerful point cloud management software should be prepared in advance.
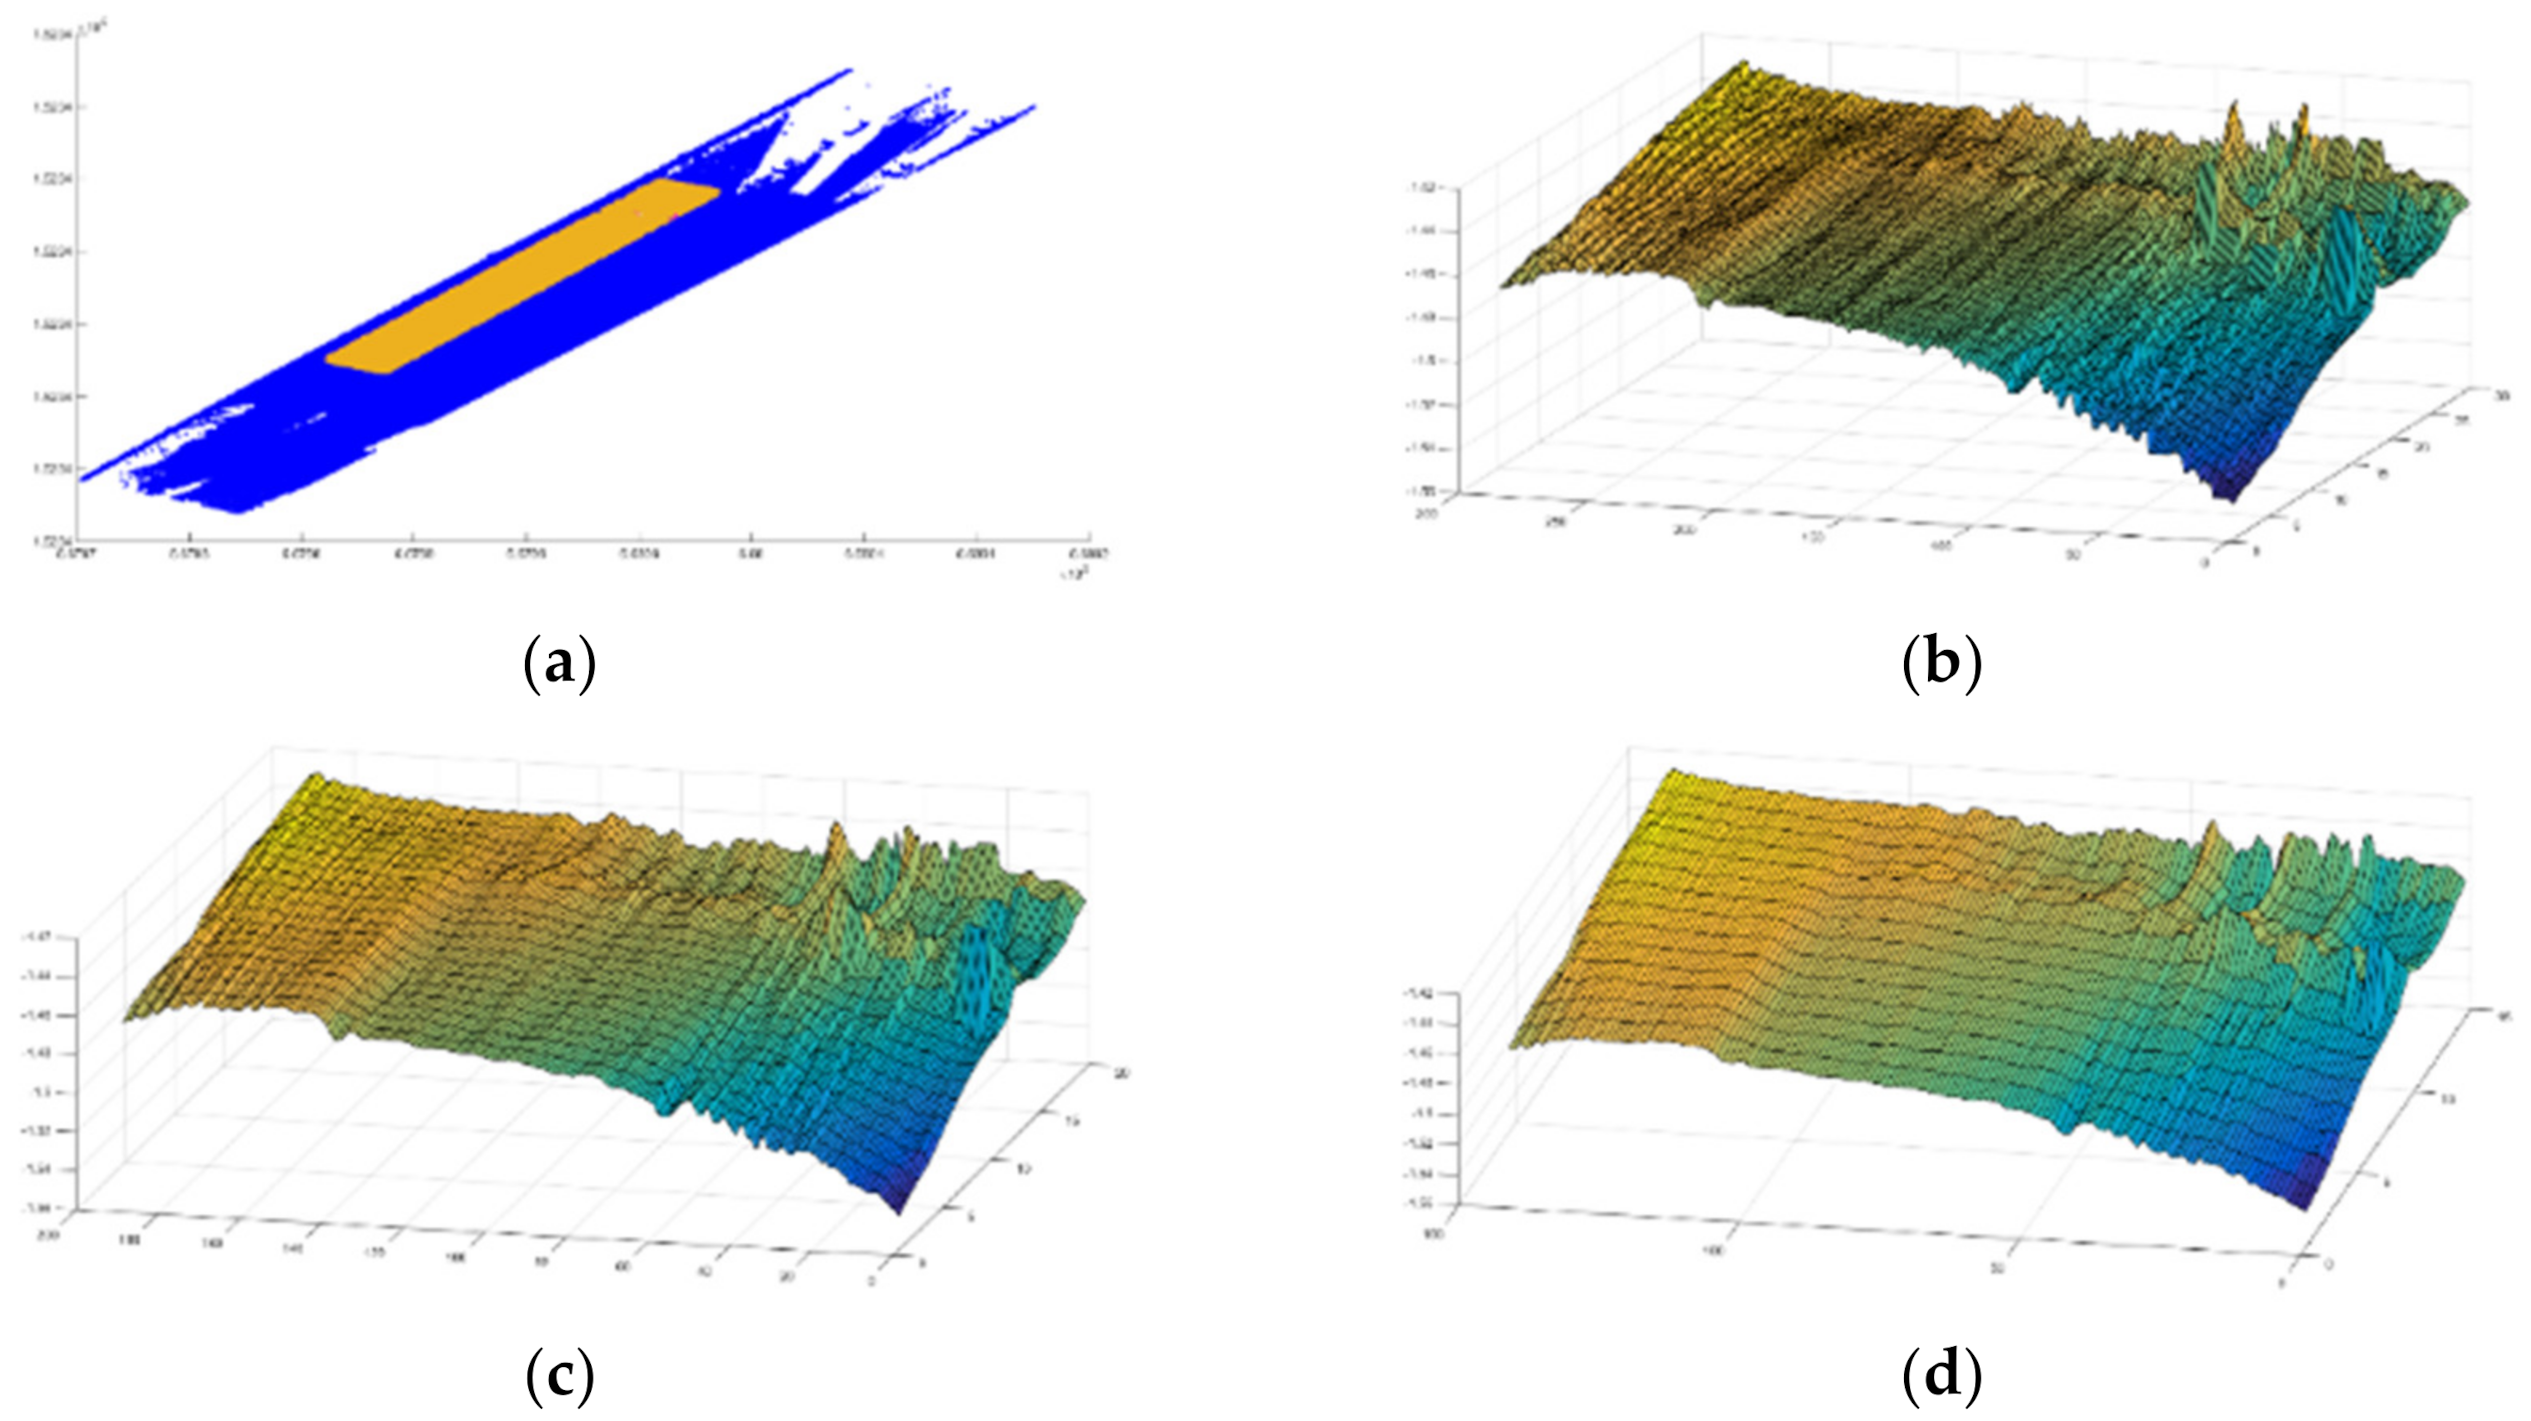
- A good agreement between elevations of the Rama XI bridge in Bangkok measured by point cloud data using MMS and by RTK was obtained. It was proven that MMS is a fast and accurate acquisition method to gather structure geometry that can be used for the health monitoring system.
- From the point cloud data, bridge profile, twist angles of the deck, and lateral movements of pylons were assessed. The results showed that most of the measured twist angles were within the acceptable limits (±0.05°). No sign of a permanent twist was observed for the deck. The top movement of the west and east pylon was 104 mm and 138 mm, respectively. However, a periodic inspection was suggested due to the absence of initial readings of the pylon.
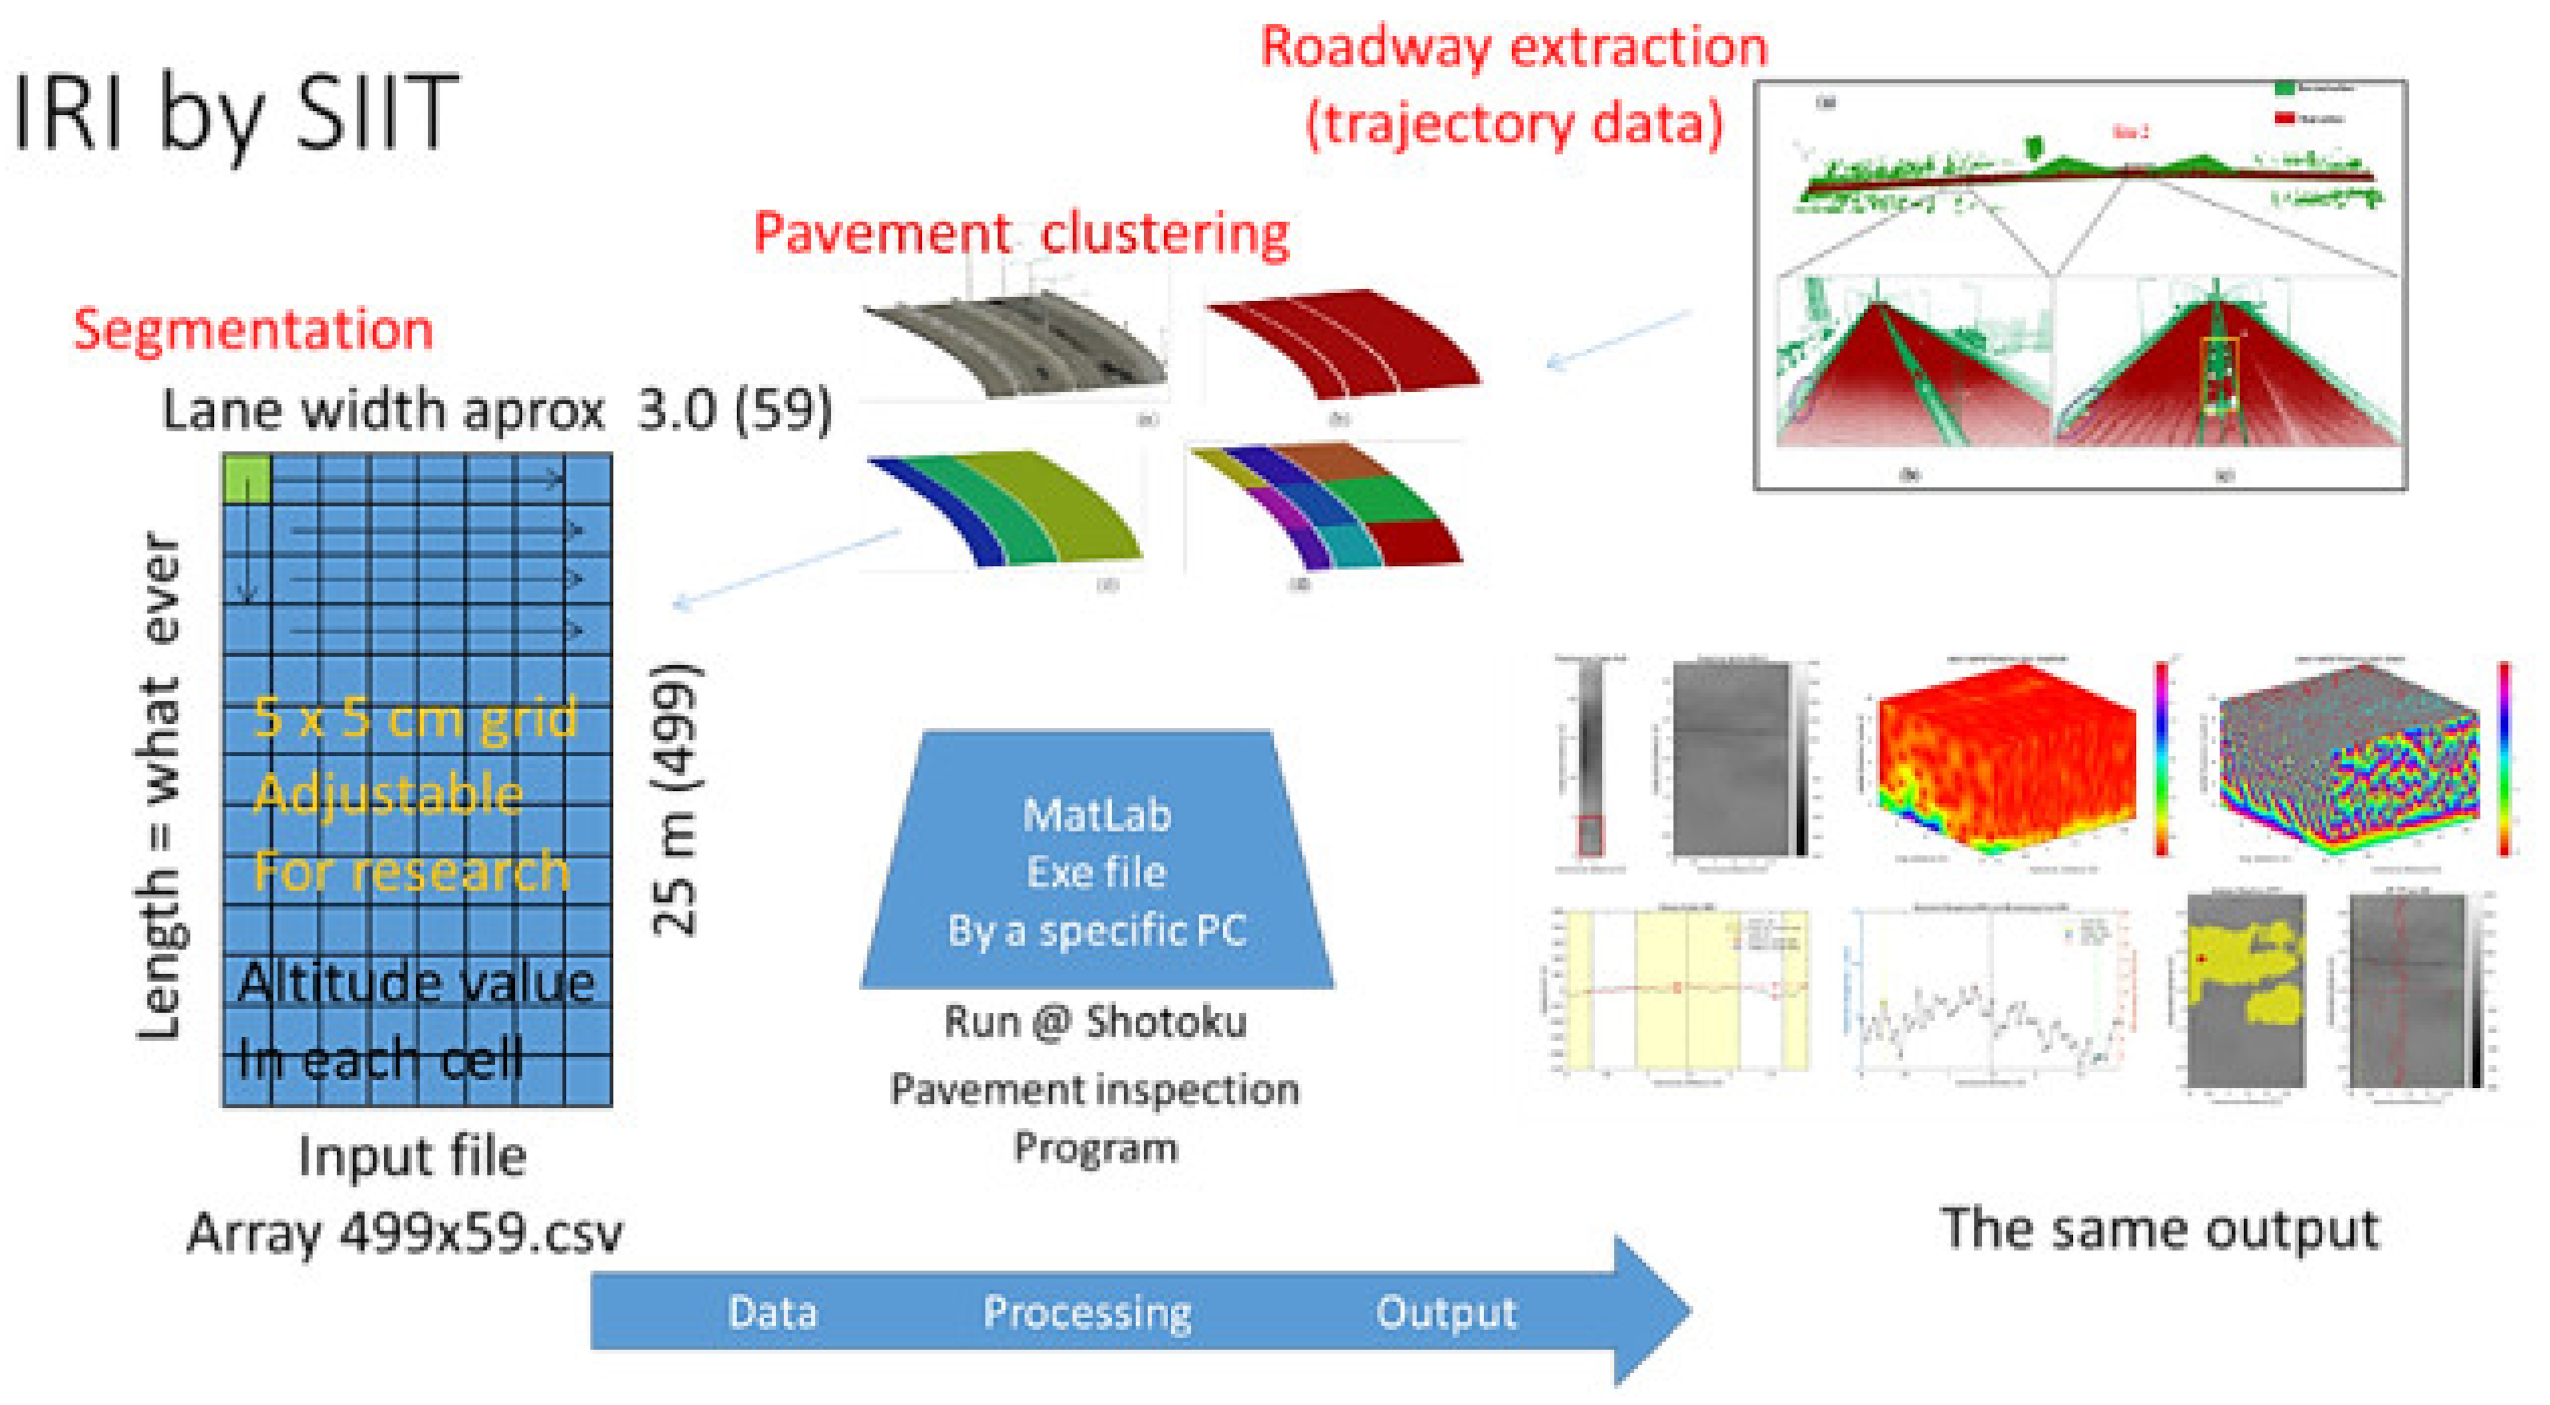
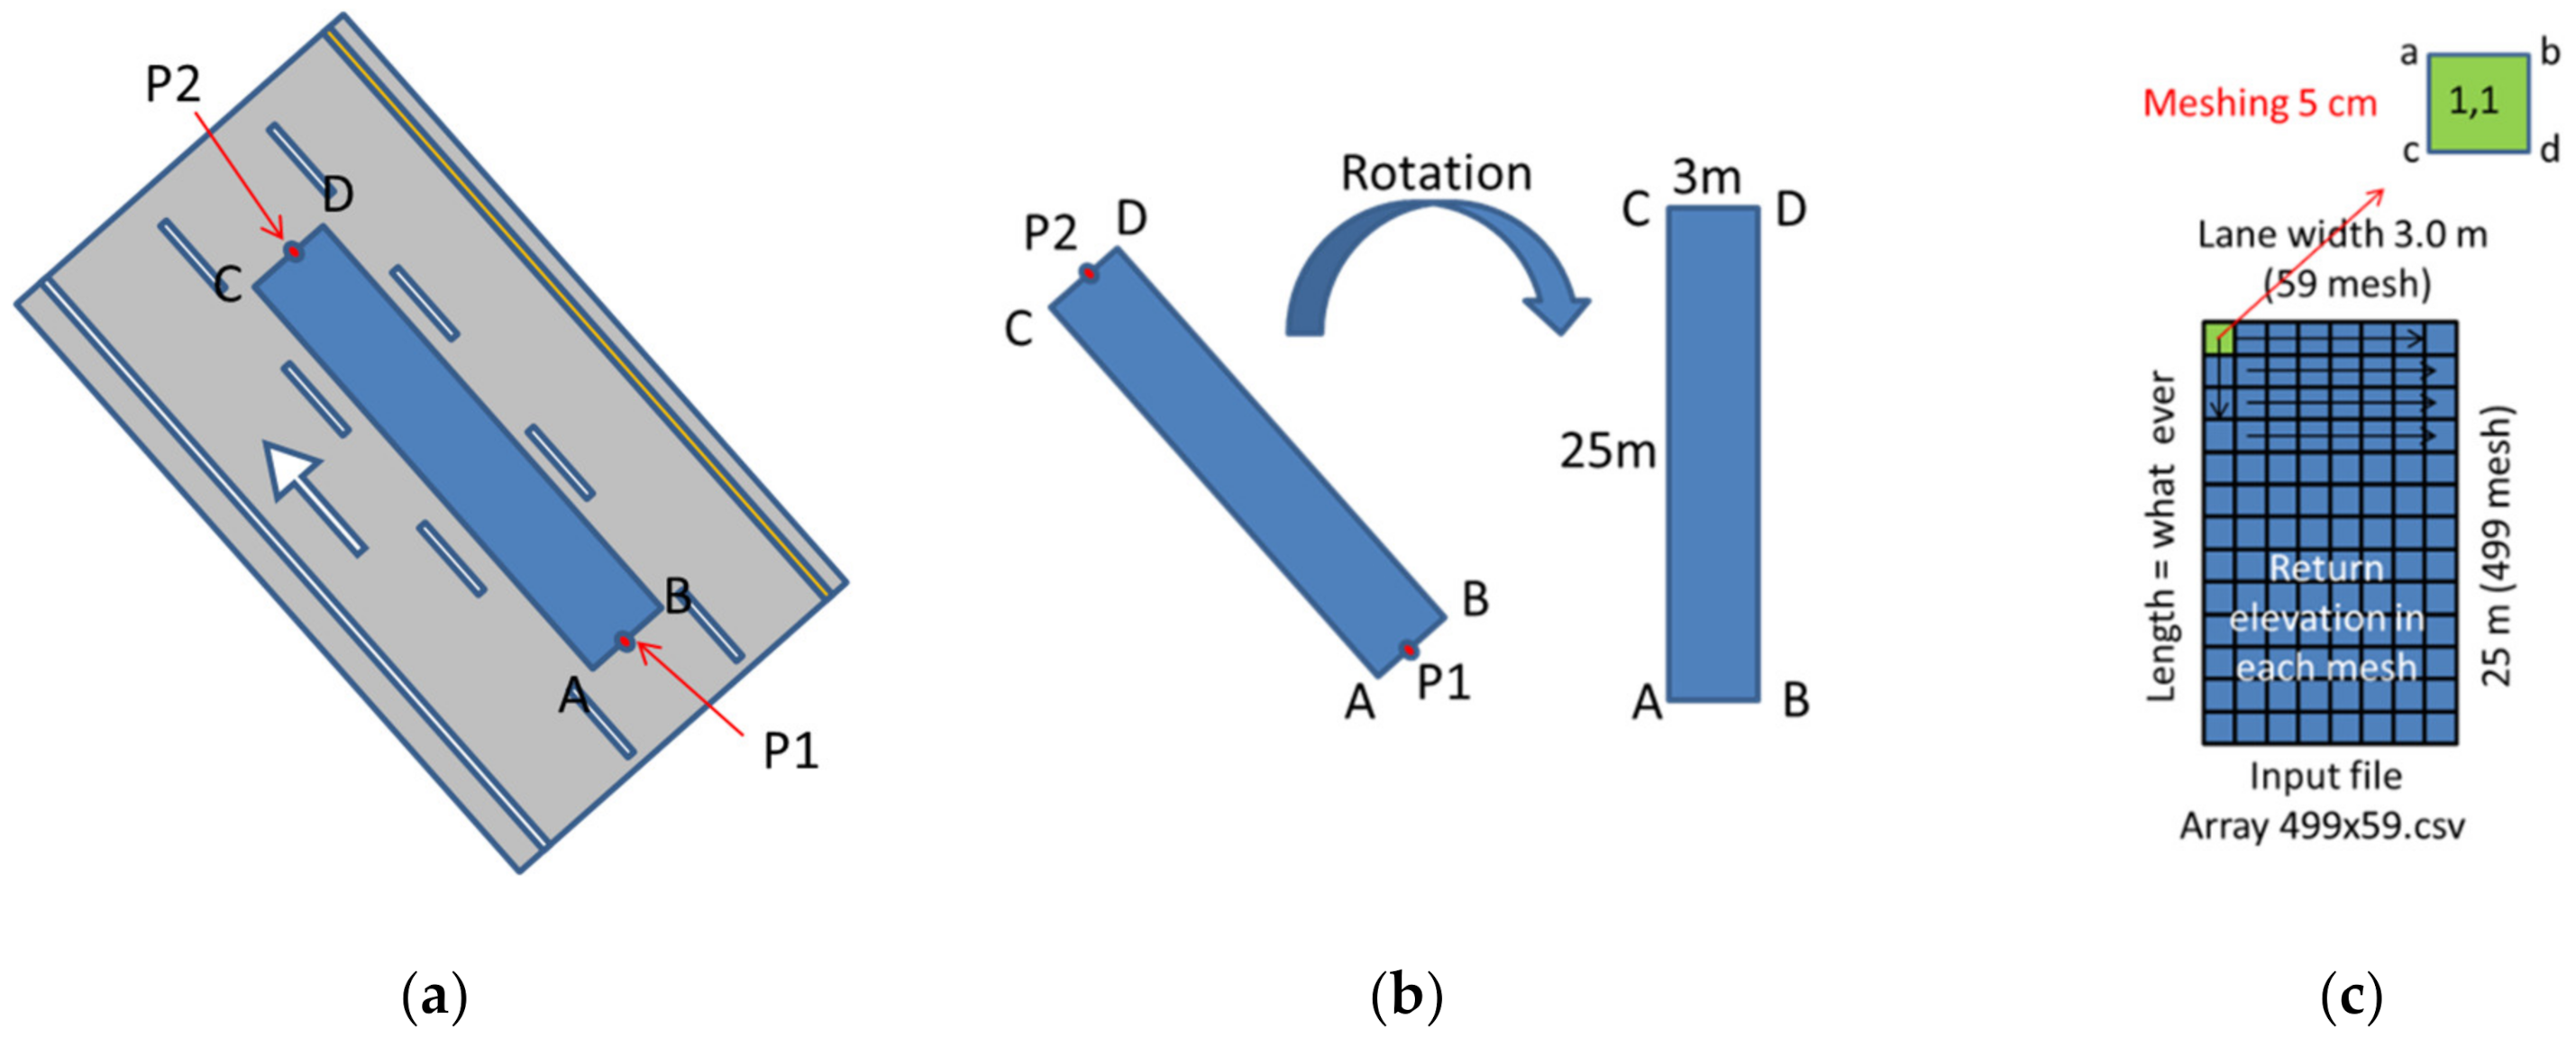
- Point cloud needs to be meshed during input file creation. A mesh size of 5 cm × 5 cm is the finest. A mesh size of 10 cm × 10 cm reduced computation time by 75% but reduced the accuracy slightly. Three more mesh sizes, 10 cm × 10 cm, 15 cm × 15 cm, and 20 cm × 20 cm were studied. The results obtained were compared to the mesh size of 5 cm × 5 cm. It was found the mesh size of 10 cm, 15 cm, and 20 cm resulted in values of 0.992, 0.979, and 0.969 when compared with the results of the mesh size of 5 cm. A mesh size of 10 cm resulted in a reduction of IRI by 95%.
- IRI values by profilometer were used as a benchmark. In order to convert the IRI value obtained by MLS to IRI values obtained by a profilometer, empirical correlations between the two methods were proposed. An of up to 0.933 for the value of IRI over 1.50–3.0 m/km was obtained from the comparison of IRI values obtained by MLS and profilometer. To convert the IRI value obtained from MLS to the corresponding profilometer value, a conversion value of 0.7597 should be used.
- It was found that the rutting values obtained from MLS measurements were significantly higher than those obtained from the profilometer.
Author Contributions
Funding
Institutional Review Board Statement
Informed Consent Statement
Acknowledgments
Conflicts of Interest
References
- AASHTO. Bridging the Gap: Restoring and Rebuilding the Nation’s BRIDGES; AASHTO: Washington, DC, USA, 2008. [Google Scholar]
- FHWA (Federal Highway Administration). Bridge Inspector’s Reference Manual; FHWA: Washington, DC, USA, 2012.
- Moore, M.; Phares, B.; Graybeal, B.; Rolander, D.; Washer, G. Reliability of Visual Inspection for Highway Bridges; Turner-Fairbank Highway Research Center: Washington, DC, USA, 2001. [Google Scholar]
- Phares, B.M. Highlights of Study of Reliability of Visual Inspection. In Proceedings of the Annual Meeting of TRB Subcommittee A2C05 (1): Nondestructive Evaluation of Structures, FHWA Report No FHWARD-01-020 and FHWA-RD-01-0212001, Proceedings of the Structural Materials Technology NDT Conference, Atlantic City, NJ, USA, 28 February–3 March 2000; Federal Highway Administration, New York State Department of Transportation, American Society for Nondestructive Testing, Eds.; Technomic Pub: Lancaster, PA, USA, 2001. [Google Scholar]
- Kashif Ur Rehman, S.; Ibrahim, Z.; Memon, S.A.; Jameel, M. Nondestructive Test Methods for Concrete Bridges: A Review. Constr. Build. Mater. 2016, 107, 58–86. [Google Scholar] [CrossRef] [Green Version]
- Dyke, S.J.; Bernal, D.; Beck, J.L.; Ventura, C. An Experimental Benchmark Problem in Structural Health Monitoring. In Proceedings of the Third International Workshop on Structural Health Monitoring, Stanford, CA, USA, 12–14 September 2001. [Google Scholar]
- Thurgood, T.; Halling, M.W.; Barr, P.J. Structural Health Monitoring of the Cherry Hill Bridge. Proc. Struct. Congr. Expo. 2006, 2006, 1–8. [Google Scholar] [CrossRef]
- Agdas, D.; Rice, J.A.; Martinez, J.R.; Lasa, I.R. Comparison of Visual Inspection and Structural-Health Monitoring As Bridge Condition Assessment Methods. J. Perform. Constr. Facil. 2016, 30, 04015049. [Google Scholar] [CrossRef] [Green Version]
- Feng, Z.; Liang, M.; Chu, F. Recent Advances in Time–Frequency Analysis Methods for Machinery Fault Diagnosis: A Review with Application Examples. Mech. Syst. Signal Process. 2013, 38, 165–205. [Google Scholar] [CrossRef]
- Staszewski, W.J.; Robertson, A.N. Time-Frequency and Time-Scale Analyses for Structural Health Monitoring. Philos. Trans. R. Soc. A Math. Phys. Eng. Sci. 2007, 365, 449–477. [Google Scholar] [CrossRef]
- Breña, S.F.; Jeffrey, A.E.; Civjan, S.A. Evaluation of a Noncomposite Steel Girder Bridge through Live-Load Field Testing. J. Bridge Eng. 2013, 18, 690–699. [Google Scholar] [CrossRef]
- Chajes, M.J.; Mertz, D.R.; Commander, B. Experimental Load Rating of a Posted Bridge. J. Bridge Eng. 1997, 2, 1–10. [Google Scholar] [CrossRef]
- Lovas, T.; Barsi, A.; Detrekoi, A.; Dunai, L.; Csak, Z.; Polgar, A.; Berenyi, A.; Kibedy, Z.; Szocs, K. Terrestrial Laser Scanning in Deformation Measurements of Structures. Int. Arch. Photogramm. Remote Sens. 2008, 37, 527–531. [Google Scholar]
- Zogg, H.; Ingensand, H. Terrestrial Laser Scanning for Deformation Monitoring: Load Tests on the Felsenau Viaduct (CH). Int. Arch. Photogramm. Remote Sens. Spat. Inf. Sci. 2008, 37, 555–562. [Google Scholar]
- Truong-Hong, A.; Chi Minh City, H.; Truong-Hong, L.; Falter, H.; Lennon, D.; Laefer, D.F. Framework for Bridge Inspection with Laser Scanning. In Proceedings of the EASEC-14 Structural Engineering and Construction, Ho Chi Minh City, Vietnam, 6–8 January 2016. [Google Scholar]
- Lin, Y.C.; Liu, J.; Cheng, Y.T.; Hasheminasab, S.M.; Wells, T.; Bullock, D.; Habib, A. Processing Strategy and Comparative Performance of Different Mobile LiDAR System Grades for Bridge Monitoring: A Case Study. Sensors 2021, 21, 7550. [Google Scholar] [CrossRef] [PubMed]
- Erdélyi, J.; Kopáčik, A.; Kyrinovič, P. Spatial Data Analysis for Deformation Monitoring of Bridge Structures. Appl. Sci. 2020, 10, 8731. [Google Scholar] [CrossRef]
- Harmening, C.; Neuner, H. A Spatio-Temporal Deformation Model for Laser Scanning Point Clouds. J. Geod. 2020, 94, 1–25. [Google Scholar] [CrossRef]
- Liu, Z.; van Oosterom, P.; Balado, J.; Swart, A.; Beers, B. Detection and reconstruction of static vehicle-related ground occlusions in point clouds from mobile laser scanning. Autom. Constr. 2022, 141, 104461. [Google Scholar] [CrossRef]
- Schlögl, M.; Dorninger, P.; Kwapisz, M.; Ralbovsky, M.; Spielhofer, R. Remote Sensing Techniques for Bridge Deformation Monitoring at Millimetric Scale: Investigating the Potential of Satellite Radar Interferometry, Airborne Laser Scanning and Ground-Based Mobile Laser Scanning. PFG–J. Photogramm. Remote Sens. Geoinf. Sci. 2022, 90, 391–411. [Google Scholar] [CrossRef]
- Elhashash, M.; Albanwan, H.; Qin, R. A Review of Mobile Mapping Systems: From Sensors to Applications. Sensors 2022, 22, 4262. [Google Scholar] [CrossRef] [PubMed]


| Length of Bridge | RTK | MLS | Differences |
|---|---|---|---|
| 0 | 0.00 | 0.00 | 0.000 |
| 36 | 1.83 | 1.87 | 0.037 |
| 77 | 3.94 | 4.02 | 0.079 |
| 116 | 5.78 | 5.89 | 0.116 |
| 193 | 9.22 | 9.41 | 0.184 |
| 263 | 11.06 | 11.28 | 0.221 |
| 350 | 12.11 | 12.35 | 0.242 |
| 397 | 12.11 | 12.35 | 0.242 |
| 478 | 11.22 | 11.45 | 0.224 |
| 589 | 8.11 | 8.27 | 0.162 |
| 672 | 4.17 | 4.25 | 0.083 |
| 0 | 0.00 | 0.00 | 0.000 |
| IRI Values | Rutting Depth Values | |||||
|---|---|---|---|---|---|---|
| Profilometer | MMS 5 | MMS 10 | Profilometer | MMS 5 | MMS 10 | |
| UA | 0.0822 | 0.0991 | 0.1026 | 0.1000 | 0.5271 | 0.5151 |
Publisher’s Note: MDPI stays neutral with regard to jurisdictional claims in published maps and institutional affiliations. |
© 2022 by the authors. Licensee MDPI, Basel, Switzerland. This article is an open access article distributed under the terms and conditions of the Creative Commons Attribution (CC BY) license (https://creativecommons.org/licenses/by/4.0/).
Share and Cite
Lueangvilai, E.; Chaisomphob, T. Application of Mobile Mapping System to a Cable-Stayed Bridge in Thailand. Sensors 2022, 22, 9625. https://doi.org/10.3390/s22249625
Lueangvilai E, Chaisomphob T. Application of Mobile Mapping System to a Cable-Stayed Bridge in Thailand. Sensors. 2022; 22(24):9625. https://doi.org/10.3390/s22249625
Chicago/Turabian StyleLueangvilai, Ekarin, and Taweep Chaisomphob. 2022. "Application of Mobile Mapping System to a Cable-Stayed Bridge in Thailand" Sensors 22, no. 24: 9625. https://doi.org/10.3390/s22249625
APA StyleLueangvilai, E., & Chaisomphob, T. (2022). Application of Mobile Mapping System to a Cable-Stayed Bridge in Thailand. Sensors, 22(24), 9625. https://doi.org/10.3390/s22249625