
Rasch Model of the COVID-19 Symptom Checklist—A Psychometric Validation Study

 , , , ,
  ,
,
Abstract
:1. Introduction
2. Materials and Methods
2.1. Design and Participants
2.2. Data Collection
2.3. Statistical Analysis
2.3.1. Fit to the Rasch Measurement Model
2.3.2. Unidimensionality
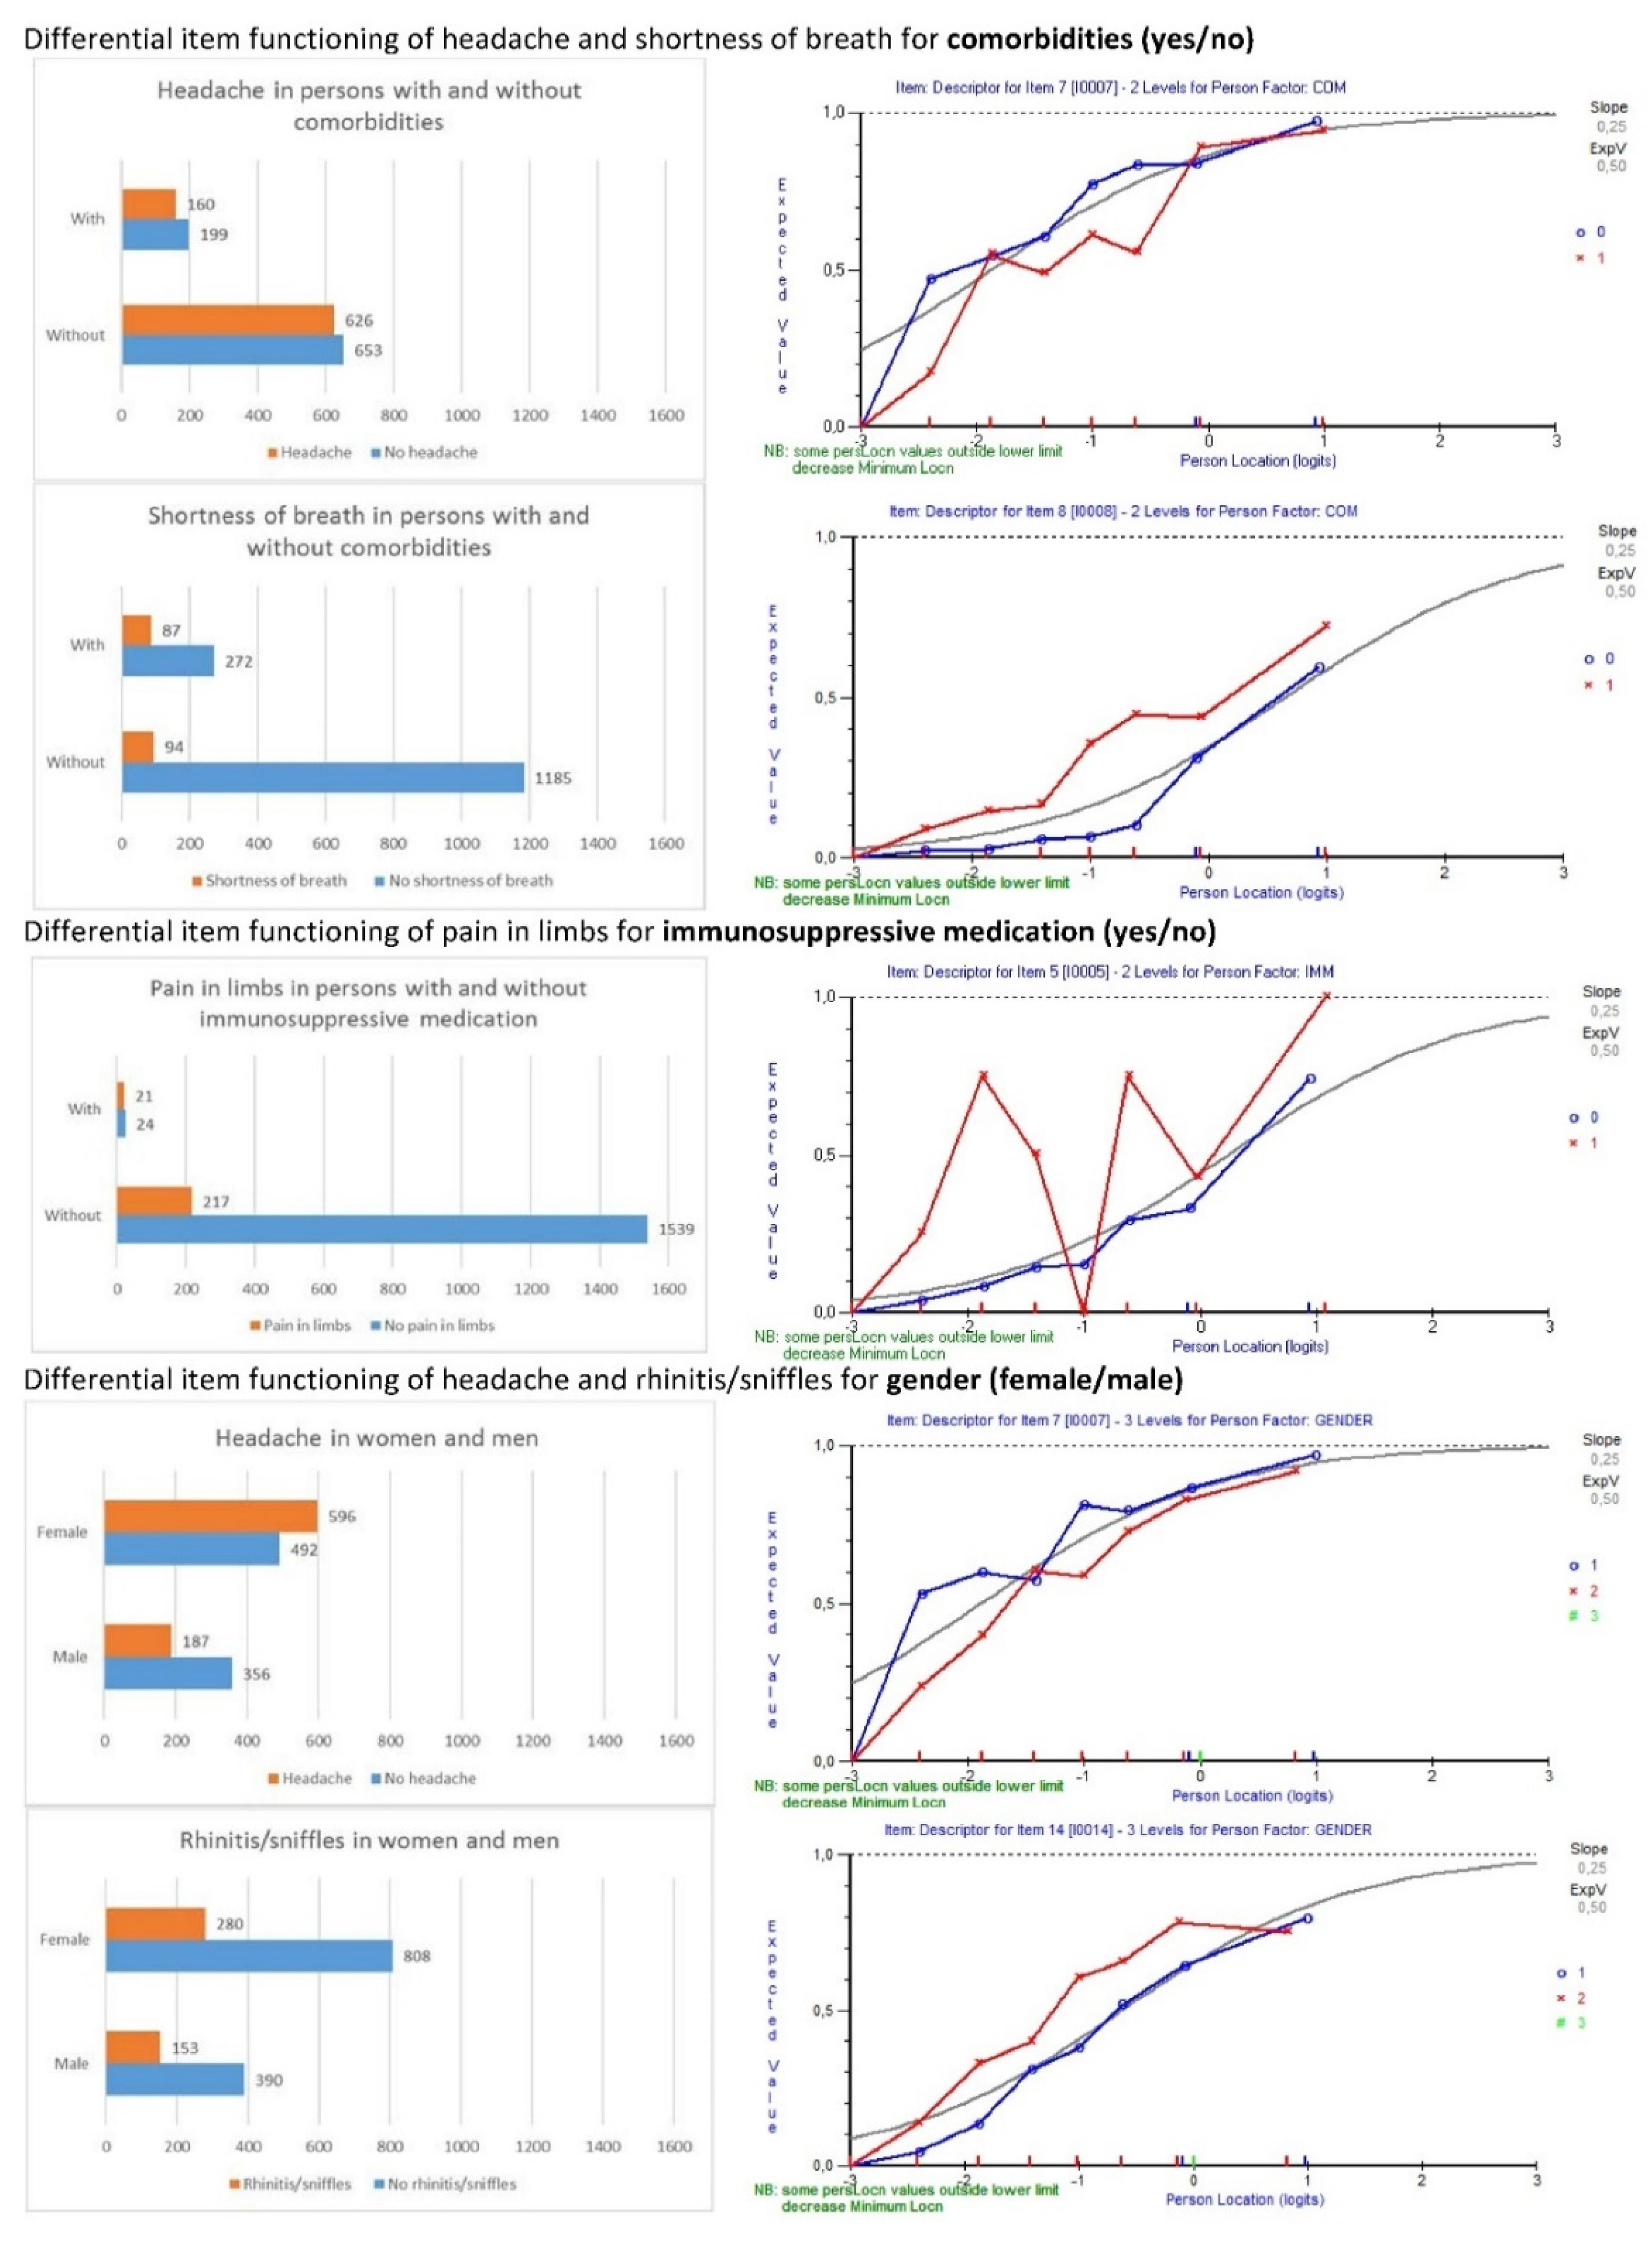
2.3.3. Differential Item Functioning
2.3.4. Person-Item Targeting
2.3.5. Transformation to a Metric Interval Scale
2.3.6. Sample Size Considerations
2.3.7. Additional Aspects of the Analyses and Reporting of the Results
3. Results
3.1. Diagnosis of Measurement Problems
3.2. Adjustment for Differential Item Functioning
3.3. Local Dependency in Relation to Item Fit
3.4. Person Item Targeting
3.5. Transformation to a Metric Interval Scale
4. Discussion
5. Conclusions
Supplementary Materials
Author Contributions
Funding
Institutional Review Board Statement
Informed Consent Statement
Data Availability Statement
Acknowledgments
Conflicts of Interest
References
- Zhu, N.; Zhang, D.; Wang, W.; Li, X.; Yang, B.; Song, J.; Zhao, X.; Huang, B.; Shi, W.; Lu, R.; et al. A Novel Coronavirus from Patients with Pneumonia in China, 2019. N. Engl. J. Med. 2020, 382, 727–733. [Google Scholar] [CrossRef] [PubMed]
- World Health Organization. Clinical Management of Severe Acute Respiratory Infection When Novel Coronavirus (2019-nCoV) Infection is Suspected—Interim Guidance. 2020. Available online: https://www.who.int/publications-detail/clinical-management-of-severe-acute-respiratory-infection-when-novel-coronavirus-(ncov)-infection-is-suspected (accessed on 5 April 2020).
- Menni, C.; Valdes, A.M.; Freidin, M.B.; Sudre, C.; Nguyen, L.H.; Drew, D.A.; Ganesh, S.; Varsavsky, T.; Cardoso, M.J.; Moustafa, J.S.E.-S.; et al. Real-time tracking of self-reported symptoms to predict potential COVID-19. Nat. Med. 2020, 26, 1037–1040. [Google Scholar] [CrossRef] [PubMed]
- Boulos, M.N.K.; Geraghty, E.M. Geographical tracking and mapping of coronavirus disease COVID-19/severe acute res-piratory syndrome coronavirus 2 (SARS-CoV-2) epidemic and associated events around the world: How 21st century GIS technologies are supporting the global fight against outbreaks and epidemics. Int. J. Health Geogr. 2020, 11, 1–12. [Google Scholar]
- Basch, E.; Deal, A.M.; Kris, M.G.; Scher, H.I.; Hudis, C.A.; Sabbatini, P.; Rogak, L.; Bennett, A.V.; Dueck, A.C.; Schrag, D.; et al. Symptom monitoring with patient-reported outcomes during routine cancer treatment: A randomised controlled trial. J. Clin. Oncol. 2016, 34, 557. [Google Scholar] [CrossRef]
- Bastiani, L.; Fortunato, L.; Pieroni, S.; Bianchi, F.; Adorni, F.; Prinelli, F.; Giacomelli, A.; Pagani, G.; Maggi, S.; Trevisan, C.; et al. Rapid COVID-19 Screening Based on Self-Reported Symptoms: Psychometric Assessment and Validation of the EPICOVID19 Short Diagnostic Scale. J. Med. Internet Res. 2021, 23, e23897. [Google Scholar] [CrossRef]
- Jokovic, A.; Locker, D.; Guyatt, G. Short forms of the Child Perceptions Questionnaire for 11–14-year-old children (CPQ11–14): Development and initial evaluation. Health Qual. Life Outcomes 2006, 4, 4. [Google Scholar] [CrossRef] [Green Version]
- Jokovic, A.; Locker, D.; Stephens, M.; Kenny, D.; Tompson, B.; Guyatt, G. Validity and Reliability of a Questionnaire for Measuring Child Oral-health-related Quality of Life. J. Dent. Res. 2002, 81, 459–463. [Google Scholar] [CrossRef]
- Jokovic, A.; Locker, D.; Tompson, B.; Guyatt, G. Questionnaire for measuring oral health-related quality of life in eight- to ten-year-old children. Pediatr. Dent. 2005, 26, 512–518. [Google Scholar]
- Thomson, W.M.; Foster Page, L.A.; Robinson, P.G.; Do, L.G.; Traebert, J.; Mohamed, A.R.; Turton, C.; McGrath, K.; Bekes, C.; Baker, S.R.; et al. Psychometric assessment of the short-form Child Perceptions Questionnaire: An international collaborative study. Community Dent. Oral Epidemiol. 2016, 44, 549–556. [Google Scholar] [CrossRef] [Green Version]
- Rasch, G. On General Laws and Meaning of Measurement. In Psychology, Proceedings of the Fourth Berkley Symposium on Mathematical Statistics and Probability; University of California Press: Oakland, CA, USA, 1961; Volume 5, pp. 321–333. [Google Scholar]
- Tutz, G.; Schauberger, G. A Penalty Approach to Differential Item Functioning in Rasch Models. Psychometrika 2013, 80, 21–43. [Google Scholar] [CrossRef] [Green Version]
- Heene, M.; Kyngdon, A.; Sckopke, P. Detecting Violations of Unidimensionality by Order-Restricted Inference Methods. Front. Appl. Math. Stat. 2016, 2, 3. [Google Scholar] [CrossRef] [Green Version]
- Struyf, T.; Deeks, J.J.; Dinnes, J.; Takwoingi, Y.; Davenport, C.; Leeflang, M.M.; Spijker, R.; Hooft, L.; Emperador, D.; Dittrich, S.; et al. Signs and symptoms to determine if a patient presenting in primary care or hospital outpatient settings has COVID-19 disease. Cochrane Database Syst. Rev. 2020, 2020, CD013665. [Google Scholar] [CrossRef]
- Mokkink, L.B.; Terwee, C.B.; Patrick, D.L.; Alonso, J.; Stratford, P.; Knol, D.L.; Bouter, L.; de Vet, H.C. The COSMIN study reached international consensus on taxonomy, terminology, and definitions of measurement properties for health-related patient-reported outcomes. J. Clin. Epidemiol. 2010, 63, 737–745. [Google Scholar] [CrossRef] [PubMed] [Green Version]
- Pollak, M.; Kowarz, N.; Partheymüller, J. Chronology of the Corona Crisis in Austria–Part 1: Background, the Way to the Lockdown, the Acute Phase and Economic Consequences. 2020. Available online: https://viecer.univie.ac.at/en/projects-and-cooperations/austrian-corona-panel-project/corona-blog/corona-blog-beitraege/blog51/ (accessed on 30 August 2020).
- World Health Organisation. Report of the WHO-China Joint Mission on COVID-19, 16–24 February 2020; World Health Organization: Geneva, Switzerland, 2020. [Google Scholar]
- Tennant, A.; Pallant, J. Unidimensionality matters! (A Tale of Two Smiths?). Rasch Meas. Trans. 2006, 20, 1048–1051. [Google Scholar]
- Caplan, D.J.; Slade, G.D.; Gansky, S.A. Complex Sampling: Implications for Data Analysis. J. Public Health Dent. 1999, 59, 52–59. [Google Scholar] [CrossRef] [PubMed]
- Andrich, D. Rasch Models for Measurement; SAGE Publications Ltd.: New York, NY, USA, 1988; Volume 68. [Google Scholar]
- Tennant, A.; Conaghan, P.G. The Rasch measurement model in rheumatology: What is it and why use it? When should it be applied, and what should one look for in a Rasch paper? Arthritis Rheum. 2007, 57, 1358–1362. [Google Scholar] [CrossRef]
- Smith, E.V., Jr. Understanding Rasch measurement: Detecting and evaluating the impact of multidimenstionality using item fit statistics and principal component analysis of residuals. J. Appl. Meas. 2002, 3, 205–231. [Google Scholar]
- Stamm, T.A.; Omara, M.; Bakerc, S.R.; Page, L.D.F.; Thomson, W.M.; Benson, P.E.; Broomhead, T.; Aguilar-Diaz, F.; Do, L.; Gibson, B.J.; et al. Rasch model of the child perceptions questionnaire in multi-country data. J. Dent. 2020, 93, 103267. [Google Scholar] [CrossRef]
- Smith, A.B.; Rush, R.; Fallowfield, L.J.; Velikova, G.; Sharpe, M. Rasch fit statistics and sample size considerations for polytomous data. BMC Med. Res. Methodol. 2008, 8, 33. [Google Scholar] [CrossRef] [PubMed] [Green Version]
- Streiner, D.L.; Kottner, J. Recommendations for reporting the results of studies of instrument and scale development and testing. J. Adv. Nurs. 2014, 70, 1970–1979. [Google Scholar] [CrossRef]
- Omara, M.; Stamm, T.; Boecker, M.; Ritschl, V.; Mosor, E.; Salzberger, T.; Hirsch, C.; Bekes, K. Rasch model of the Child Perceptions Questionnaire for oral health-related quality of life: A step forward toward accurate outcome measures. J. Am. Dent. Assoc. 2019, 150, 352–361. [Google Scholar] [CrossRef] [PubMed] [Green Version]
- Shirazi, S.; Stanford, C.M.; Cooper, L.F. Testing for COVID-19 in dental offices: Mechanism of action, application and interpretation of laboratory and point-of-care screening tests. J. Am. Dent. Assoc. 2021, 152, 514–525.e8. [Google Scholar] [CrossRef] [PubMed]


| Personal Factors/Characteristics | Frequencies |
|---|---|
| Total Number of Participants N (%) | 1638 (100%) |
| Gender n (%) | |
| Female | 1088 (66.4%) |
| Male | 543 (33.2%) |
| Divers/other | 7 (0.4%) |
| Pregnancy (women only) n (%) | 17 (1.6% of the women) |
| Age Groups n (%) | |
| ≤9 Years | 21 (1.3%) |
| 10–19 Years | 31 (1.9%) |
| 20–29 Years | 421 (25.7%) |
| 30–39 Years | 451 (27.5%) |
| 40–49 Years | 262 (16.0%) |
| 50–59 Years | 264 (16.1%) |
| 60–69 Years | 137 (8.4%) |
| 70–79 Years | 40 (2.4%) |
| 80–89 Years | 10 (0.6%) |
| ≥90 Years | 1 (0.1%) |
| Highest Education n (%) | |
| Unfinished compulsory education | 37 (2.3%) |
| Completed compulsory education | 30 (1.8%) |
| Completed apprenticeship | 140 (8.5%) |
| Completed post-secondary non-tertiary education | 453 (27.7%) |
| Completed first stage of tertiary education | 718 (43.8%) |
| Completed second stage of tertiary education | 260 (15.9%) |
| COVID-19 Tested n (%) | |
| Positive | 16 (1%) |
| Negative | 187 (11.4%) |
| Not tested | 1435 (87.6%) |
| Comorbidities n (%) | |
| Yes | 359 (21.9%) |
| No | 1279 (78.1%) |
| Immunosuppressive Medication n (%) | |
| Yes | 45 (2.7%) |
| No | 1593 (97.3%) |
| Model Fit Statistics | Unidimensionality Analysis | ||||||||||
|---|---|---|---|---|---|---|---|---|---|---|---|
| Mean Item Location (±SD) | Mean Item Fit Residual (±SD) | Mean Person Location (±SD) | Mean Person Fit Residual (±SD) | Person Separa-tion Index (PSI) | Cron-Bach’s α | Root Mean Square Error of Approx-Imation (RMSEA) | Number of Sign. t-tests | Sample | % of Sign. t-tests | Lower Bound of 95% CI | |
| Model 1. “First” | 0 (±1.42) | −1.19 (±2.33) | −2.89 (±1.04) | −0.3 (±0.52) | −0.06 | 0.68 | 0.052 | 14 | 1638 | 0.9% | −0.2% |
| Model 2. “Ever” | 0 (±1.59) | −0.86 (±1.49) | −1.91 (±1.37) | −0.26 (±0.57) | 0.60 | 0.75 | 0.027 | 43 | 1638 | 2.6% | 1.6% |
| Item Number | Description | Location | Standard Error | Fit Residual | F-Stat | p-Value | ChiSq | p-Value | DIF for |
|---|---|---|---|---|---|---|---|---|---|
| 2 | Fatigue | −2.47 | 0.06 | −0.47 | 0.41 | 0.9284 | 4.45 | 0.7271 | Age; educational status |
| 7 | Headache | −1.87 | 0.06 | 0.11 | 1.70 | 0.0839 | 14.29 | 0.0463 | Gender; comorbidities |
| 13 | Sneezing | −1.75 | 0.06 | 1.28 | 2.02 | 0.0342 | 17.95 | 0.0122 | Pollen allergy |
| 12 | Nasal congestion | −1.26 | 0.06 | −1.96 | 2.63 | 0.0051 | 20.61 | 0.0044 | Pollen allergy |
| 6 | Sore throat | −0.84 | 0.06 | 0.11 | 0.68 | 0.7264 | 7.23 | 0.4056 | - |
| 14 | Sniffles/rhinitis | −0.62 | 0.07 | −2.59 | 2.96 | 0.0017 | 23.54 | 0.0014 | Gender |
| 3 | Cough | −0.60 | 0.07 | −3.55 | 4.73 | 0.0000 | 38.43 | 0.0000 | - |
| 11 | Diarrhea | −0.15 | 0.07 | 1.61 | 1.38 | 0.1928 | 15.32 | 0.0322 | - |
| 5 | Pain in limbs | 0.24 | 0.08 | −1.55 | 1.78 | 0.0667 | 17.71 | 0.0134 | Age |
| 8 | Shortness of breath | 0.65 | 0.08 | −2.37 | 1.24 | 0.2688 | 13.35 | 0.0641 | Comorbidities |
| 10 | Vomiting | 1.01 | 0.09 | −1.41 | 1.17 | 0.3094 | 12.41 | 0.0879 | Pregnancy |
| 15 | Smell and taste disorders | 1.21 | 0.10 | 0.47 | 1.33 | 0.2188 | 14.21 | 0.0475 | COVID-19 test |
| 9 | Chills | 1.44 | 0.11 | −1.73 | 0.92 | 0.5077 | 9.67 | 0.2081 | - |
| 4 | Dry cough/no sputum production | 1.47 | 0.11 | −1.10 | 1.16 | 0.3164 | 11.26 | 0.1275 | Age |
| 1 | Fever | 3.55 | 0.25 | 0.24 | 0.98 | 0.4555 | 10.44 | 0.1652 |
| All—O Split | COM | IMM | Gender | Education Level | ||||||
|---|---|---|---|---|---|---|---|---|---|---|
| Raw Score | Metric Scale | Zero to Ten | With | Without | With | Without | Female | Male | Lower Than Post Secondary | ≥Post Secondary |
| 0 | −4.02 | 0.55 | 0.06 | −0.06 | −0.08 | 0.08 | −0.08 | 0.08 | 0.25 | −0.25 |
| 1 | −3.10 | 1.56 | 0.06 | −0.06 | −0.09 | 0.09 | −0.07 | 0.07 | 0.19 | −0.19 |
| 2 | −2.40 | 2.34 | 0.04 | −0.04 | −0.11 | 0.11 | −0.05 | 0.05 | 0.15 | −0.15 |
| 3 | −1.87 | 2.93 | 0.02 | −0.02 | −0.13 | 0.13 | −0.02 | 0.02 | 0.11 | −0.11 |
| 4 | −1.42 | 3.43 | 0 | 0 | −0.14 | 0.14 | 0 | 0 | 0.08 | −0.08 |
| 5 | −1.01 | 3.88 | −0.03 | 0.03 | −0.16 | 0.16 | 0.02 | −0.02 | 0.06 | −0.06 |
| 6 | −0.62 | 4.31 | −0.06 | 0.06 | −0.16 | 0.16 | 0.03 | −0.03 | 0.05 | −0.05 |
| 7 | −0.24 | 4.73 | −0.09 | 0.09 | −0.16 | 0.16 | 0.04 | −0.04 | 0.03 | −0.03 |
| 8 | 0.13 | 5.15 | −0.11 | 0.11 | −0.15 | 0.15 | 0.03 | −0.03 | 0.03 | −0.03 |
| 9 | 0.51 | 5.57 | −0.12 | 0.12 | −0.14 | 0.14 | 0.03 | −0.03 | 0.02 | −0.02 |
| 10 | 0.91 | 6.01 | −0.13 | 0.13 | −0.12 | 0.12 | 0.03 | −0.03 | 0.01 | −0.01 |
| 11 | 1.34 | 6.48 | −0.12 | 0.12 | −0.09 | 0.09 | 0.02 | −0.02 | 0.01 | −0.01 |
| 12 | 1.82 | 7.02 | −0.11 | 0.11 | −0.07 | 0.07 | 0.02 | −0.02 | 0.01 | −0.01 |
| 13 | 2.42 | 7.68 | −0.09 | 0.09 | −0.05 | 0.05 | 0.01 | −0.01 | 0 | 0 |
| 14 | 3.28 | 8.63 | −0.06 | 0.06 | −0.03 | 0.03 | 0.01 | −0.01 | 0 | 0 |
| 15 | 4.52 | 10 | 0 | 0 | 0 | 0 | 0 | 0 | 0 | 0 |
Publisher’s Note: MDPI stays neutral with regard to jurisdictional claims in published maps and institutional affiliations. |
© 2021 by the authors. Licensee MDPI, Basel, Switzerland. This article is an open access article distributed under the terms and conditions of the Creative Commons Attribution (CC BY) license (https://creativecommons.org/licenses/by/4.0/).
Share and Cite
Stamm, T.A.; Ritschl, V.; Omara, M.; Andrews, M.R.; Mevenkamp, N.; Rzepka, A.; Schirmer, M.; Walch, S.; Salzberger, T.; Mosor, E. Rasch Model of the COVID-19 Symptom Checklist—A Psychometric Validation Study. Viruses 2021, 13, 1762. https://doi.org/10.3390/v13091762
Stamm TA, Ritschl V, Omara M, Andrews MR, Mevenkamp N, Rzepka A, Schirmer M, Walch S, Salzberger T, Mosor E. Rasch Model of the COVID-19 Symptom Checklist—A Psychometric Validation Study. Viruses. 2021; 13(9):1762. https://doi.org/10.3390/v13091762
Chicago/Turabian StyleStamm, Tanja A., Valentin Ritschl, Maisa Omara, Margaret R. Andrews, Nils Mevenkamp, Angelika Rzepka, Michael Schirmer, Siegfried Walch, Thomas Salzberger, and Erika Mosor. 2021. "Rasch Model of the COVID-19 Symptom Checklist—A Psychometric Validation Study" Viruses 13, no. 9: 1762. https://doi.org/10.3390/v13091762
APA StyleStamm, T. A., Ritschl, V., Omara, M., Andrews, M. R., Mevenkamp, N., Rzepka, A., Schirmer, M., Walch, S., Salzberger, T., & Mosor, E. (2021). Rasch Model of the COVID-19 Symptom Checklist—A Psychometric Validation Study. Viruses, 13(9), 1762. https://doi.org/10.3390/v13091762