Abstract
Background: Immune response assessed by the quantification of neutralizing antibodies (nAbs) and predictors associated with immunogenicity after the prime-boost ChAdOx1 (Oxford–AstraZeneca) COVID-19 vaccine in hemodialysis (HD) patients remains unclear. Methods: This prospective study enrolled 174 HD patients and 67 healthy subjects to evaluate antibodies against the spike protein 1 and receptor-binding domain of severe acute respiratory syndrome coronavirus type 2 after prime-booster vaccination, by using enzyme-linked immunosorbent assay and applied spline-based generalized additive model regression analysis to predict 50% neutralization titer (NT50). The correlation between HD parameters and NT50 was analyzed. Results: NT50 was lower in HD patients compared with healthy controls after the prime-boost dose (p < 0.001). The geometric mean titer ratios were higher in first-dose seronegative than in the seropositive subgroup in HD patients and healthy controls (6.96 vs. 2.36, p = 0.002, and 9.28 vs. 1.26, p = 0.011, respectively). After two doses of ChAdOx1, one-way ANOVA showed that Ca × P was positively associated with NT50 (p trend = 0.043) and multiple linear regression showed the similar results (p = 0.021). Kt/V (a quantification of dialysis adequacy) (OR = 20.295, p = 0.005) could independently predict seroconversion (NT50 ≥ 35.13 IU/mL). Conclusion: Adequacy of hemodialysis could independently predict seroconversion in HD subjects vaccinated with prime-boost doses of ChAdOx1.
1. Introduction
Severe acute respiratory syndrome coronavirus type 2 (SARS-CoV-2) infection, has been a worldwide pandemic upsetting 442 million people, and continues to provoke a tremendous global burden [1]. Even though vaccination with prime and booster doses were performed in most developed countries, breakthrough infection frequently happened under the ravages of delta and omicron variants [2,3]. Uremic patients are often elderly, concomitant of comorbidities, micro-inflamed and immunocompromised, which might increase susceptibility to coronavirus disease 2019 (COVID-19) [4,5]. In-center hemodialysis (HD) patients usually necessitate permanent attendance at crowded dialysis facilities and often have considerably mitigated immune responses to vaccine. Combining the above unfavorable factors, rapid transmission of COVID-19 in HD facilities had occurred and contributed to a grave mortality in HD patients [6].
The immunogenicity of COVID-19 vaccines in HD cohorts was significantly inferior to the general population, and this under-response was consistent for both mRNA or adenoviral-vector vaccines [7,8,9,10]. For examples, a neutralization assessment in HD patients indicated that a single dose of ChAdOx1 (Oxford–AstraZeneca) would show a 23% positive humoral response rate, and a single dose of mRNA-1273 (Moderna) can result in a 46.2% positive humoral response rate in HD patients. On the other hand, the seroconversion rate was 18–53% after the first dose and 70–96% after the second dose, respectively, in a pooled estimate of healthy controls [7,8]. Measures to increase the immune response of vaccination in HD patients are urgently needed but remains unclear to date.
The COVID-19 vaccines has been proved to be safe and efficacious to prevent severe COVID-19 in HD patients and the inoculation was strongly recommended by the Advisory Committee on Immunization Practices (ACIP) of Taiwan and Taiwan Society of Nephrology [11]. The first large-scale outbreak of COVID-19 has occurred in northern Taiwan since 14 May 2021. At that time, the vaccine was extremely lacking and overall coverage rate of the first dose was only 1.5% in HD patients; consequently, numerous clusters of contraction developed in northern area HD facilities contributed to grave morbidities and mortalities. Furthermore, vaccination has been prioritized for HD patients as well as other immunocompromised cohorts and the ChAdOx1 vaccine was the mandatory first dose option for these patients. Our previous study has demonstrated that cardiothoracic ratio and age would independently predict neutralizing antibody (nAb) titer after a single dose of ChAdOx1 [8]. However, immune responses to repeated doses of vaccine and predictors for low immunogenicity in HD patients are incompletely understood.
Due to the semi-mandatory inoculation policy, the majority of HD subjects have been vaccinated with the second dose of ChAdOx1. To continue tracking the immune response and explore the characteristics of seronegative subgroup, we performed an observation cohort study to compare the titers of nAb between HD patients and healthy controls who have been fully vaccinated with ChAdOx1, and further demarcated the possible dialysis-related factors affecting the production of nAbs. This result may help us to optimize dialysis program and formulate an effective vaccination strategy in HD subjects.
2. Materials and Methods
2.1. The Study Design and Patient Characteristics
This observational, prospective and single-center study assessed the nAb response in HD patients and healthy controls after the standard prime-booster dose of the ChAdOx1 COVID-19 vaccination implemented in Chang Gung Memorial Hospital Keelung Branch in Taiwan. ChAdOx1 vaccines were uniformly supplied to HD facilities for injection, in accordance with the COVID-19 inoculation policy promulgated by the national health authorities and Taiwan Society of Nephrology. Participants who completed the two doses of vaccination were included to the study. HD patients, who had an active major illness (uncontrolled malignancy, unstable cardiovascular disease, Child–Pugh liver cirrhosis score worse than A), a history of prior infection with SARS-CoV-2 or unwilling to receive repeated doses of ChAdOx1 vaccine or to participate in the assessment were excluded. The eligible HD patients who have symptoms of a cough, sore throat, diarrhea and loss of taste or smell had to undergo a rapid antigen test before enrollment. The healthy control group (normal renal function people) were recruited from the healthcare staff and out-patient clinics of the hospital, in compliance with the same enrollment criteria. SARS-CoV-2 rapid antigen tests were obligatory in all of our HD patients once weekly, and misjudged the false positive humoral response due to previous infection. Due to the shortage of the vaccine, the second dose vaccination was postponed to the 16th week after first dose. The differences of evolution of nAb titers between HD patients and healthy controls were evaluated. In addition, predictors of the immunogenicity to the first dose vaccination between two groups, as well as indicators correlated to the trajectory of nAb titers after two doses of vaccination, were analyzed. This study was performed in accordance with the Declaration of Helsinki and was approved by the Ethics Committee of the Institutional Review Board at Chang Gung Memorial Hospital (IRB: 202001041A3C604 and 202100854B0A3). Written informed consent was obtained from all study participants.
2.2. Sample Collection
Blood samples were collected after overnight fasting and were delivered immediately (within 4 h of collection) to the laboratory for biochemical analyses, complete blood counts and antibody titers. Blood samples of HD patients were collected via venous chamber before a single dialysis treatment. A fraction of the samples was relocated to chilled tubes and centrifuged at 3000× g for 10 min at 4 °C to obtain the sera. Lipemic or hemolyzed sera were discarded.
2.3. Humoral Response Assessment
Humoral response was assessed by measuring nAb response on day 56 after the prime dose and day 35 after the booster dose of ChAdOx1 COVID-19 vaccine in HD patients and on a median of 30 (26–50) days after the prime dose and 21 (17–28) days after the booster dose of ChAdOx1 COVID-19 vaccine in healthy controls, using the Formosa Biomedical Technology MeDiPro SARS-CoV-2 Antibody ELISA assay, which detects antibodies against SARS-CoV-2 viral spike protein 1 (S1) and receptor-binding domain (RBD). MeDiPro is a kit for quantifying neutralizing antibodies, which was technology transferred from Research Center for Emerging Viral Infections, Chang Gung University and has been approved by Taiwan Food and Drug Administration (No. 1106803303). The data for S1 and RBD fusion proteins can precisely predict the SARS-CoV-2 50% neutralization titer (NT50) under a two-variable generalized additive model and WHO international unit conversion. The assay has a 92.2% (95% CI, 84.0%–96.4%) sensitivity and 93% (95% CI, 81.4%–97.6%) specificity [12].
2.4. Quantifying nAbs by a Two-Variable Generalized Additive Model
In our previous study, we have demonstrated the correlation between the nAb titer and the S1 and RBD antibody responses, respectively, obtained from a pseudotyped SARS-CoV-2 spike lentivirus neutralization test (NT) in biosafety level 3 laboratory [13]. The binding of S1 (R2 = 0.830) and the RBD (R2 = 0.870) was well correlated with the log-transformed actual NT titer. We further applied a spline-based generalized additive model (GAM) regression analysis to predict NT50. The GAM using S1 and the RBD as two variables gets the highest R2 value of 0.917, between the binding capacity and actual NT50. The MeDiPro SARS-CoV-2 antibody ELISA was technology transferred from the Research Center for Emerging Viral Infections, Chang Gung University, Taiwan. The MeDiPro using enzyme-linked immuno-sorbent assay (ELISA) was developed to disclose SARS-CoV-2 nAbs in the serum, through the binding affinity of S1 and RBD to antibodies. The nAbs mainly bind to the RBD, which has been universally covered by S1. S1 also appears in several other regions and is imperative for nAb binding. The assay conglomerates each of the S1 and RBD ELISA unit (EU) values, and applies a GAM regression analysis (using S1 and RBD as two predictors) to predict NT50 by combining multiple smooth functions [13].
2.5. WHO International Standard Unit (IU) Conversion
For the purpose of facilitating the conversion of geometric mean titers (GMTs) of NT50 to international units, WHO international standard (IS) sera (20/130, 20/136, and 20/268) were obtained from the National Institute for Biological Standards and Control (NIBSC). IS sera were used to obtain nAb titers in IU/mL. The NT50 values for WHO IS sera were determined by a live virus microneutralization assay. Each standard serum sample was tested in duplicate, except for 20/130. For the conversion of NT50 to IU/mL, a neutralizing assay was designed to calculate the GMTs of the NIBSC serum samples. Values of <12.31 IU/mL (neutralizing titer < 2.56) were defined as a negative humoral response, values between 12.31 and 35.13 IU/mL (2.56 ≤ neutralizing titer < 8) were defined as a weakly positive humoral response, and values > 35.13 IU/mL (neutralizing titer > 8) were defined as a positive humoral response. NT50 ≥ 35.13 IU/mL was also defined as seropositive and NT50 < 35.13 defined as seronegative. When we enter the value of the ELISA’s limitation of detection (LOD) into the model, a NT50 cutoff value of 12.31 IU/mL was obtained. The cutoff value of 35.13 IU/mL was from converting the lowest neutralizing titer to IU/mL. In clinical practice, the serial dilutions of the virus neutralization assay commenced from 1:8, because any lower dilution of serum was toxic to the cells and resulted in bias in determining the titer. When inputting the neutralizing titer = 8 to the model, a value of 35.13 IU/mL is obtained.
2.6. Statistical Analysis
Continuous variables were tested for normal distribution using skewness, kurtosis, and the Kolmogorov–Smirnov test. Normally distributed variables, with values expressed as means (standard deviations), were compared by one-way analysis of variance (ANOVA); while categorical variables were tested using the chi-squared test. The nonparametric independent Kruskal–Wallis test was performed to compare the non-normally distributed variables, expressed as medians (interquartile ranges).
Geometric mean fold increase in titers (GMT ratio) was used to compare nAb responses after the prime and booster dose between HD patients and healthy controls. Seroconversion was compared using a Student’s t-test, and humoral response were compared by the nonparametric independent Mann–Whitney U test. Simple linear regression was applied to examine the association between independent variables and NT50 after the booster dose of ChAdOx1 vaccination. The non-normally distributed variables were log- transformed as appropriate. Multiple regression was used to adjust all the confounding factors (model 1) or all these factors, excluding anti-S1 and anti-RBD antibodies (model 2). Univariate, followed by multivariable logistic regression analysis (enter method) was used to assess the odds ratio of clinically variables associated with positive humoral response (NT50 cutoff value over 35.13 IU/mL) after the second doses of vaccination in those HD patients were formerly seronegative to the prime dose.
The receiver operating characteristic (ROC) curves were plotted to predict the probability of a binary outcome, including Ca × P vs. positive humoral response and age vs. positive humoral response. Differences were examined using the area under the receiver operating characteristic (AUROC) curve. All statistical analyses were two-tailed, and a value of p < 0.05 was considered statistically significant. Data were analyzed using the Statistical Package for the Social Sciences (SPSS, Inc., Chicago, IL, USA) version 26.0 for Mac. GraphPad Prism version 9 (GraphPad Software, Inc., La Jolla, CA, USA) was used to calculate GMTs with 95% confidence intervals (CIs), and to generate all of the graphs.
3. Results
3.1. Study Design and Subject Characteristics
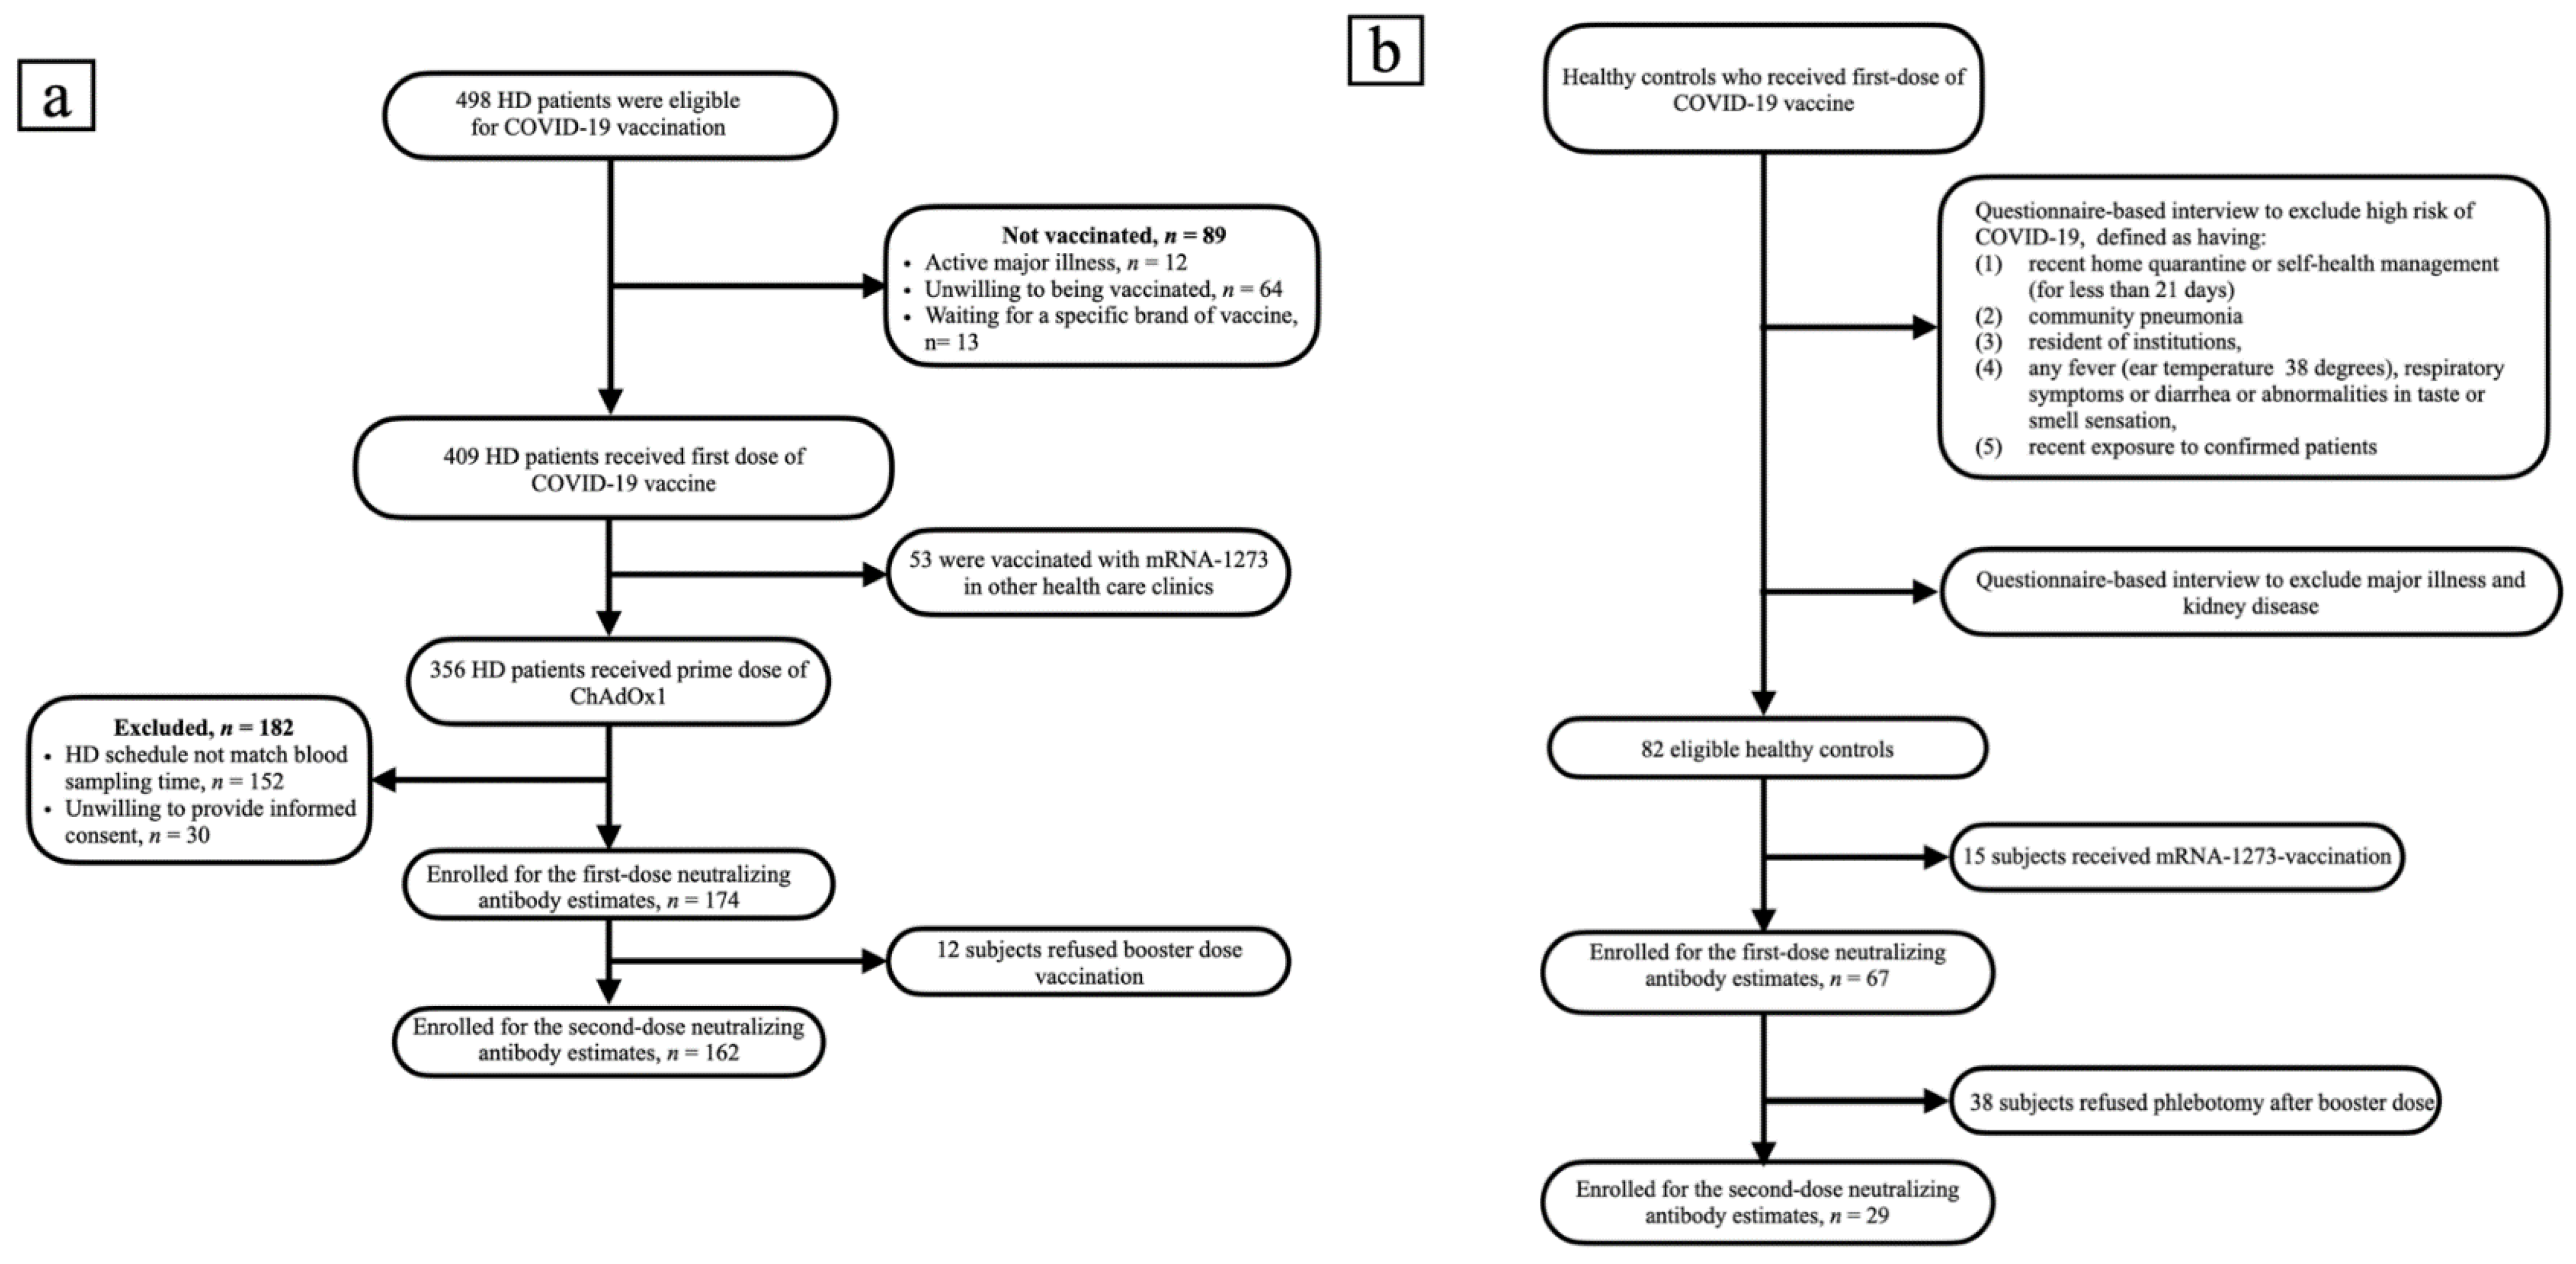
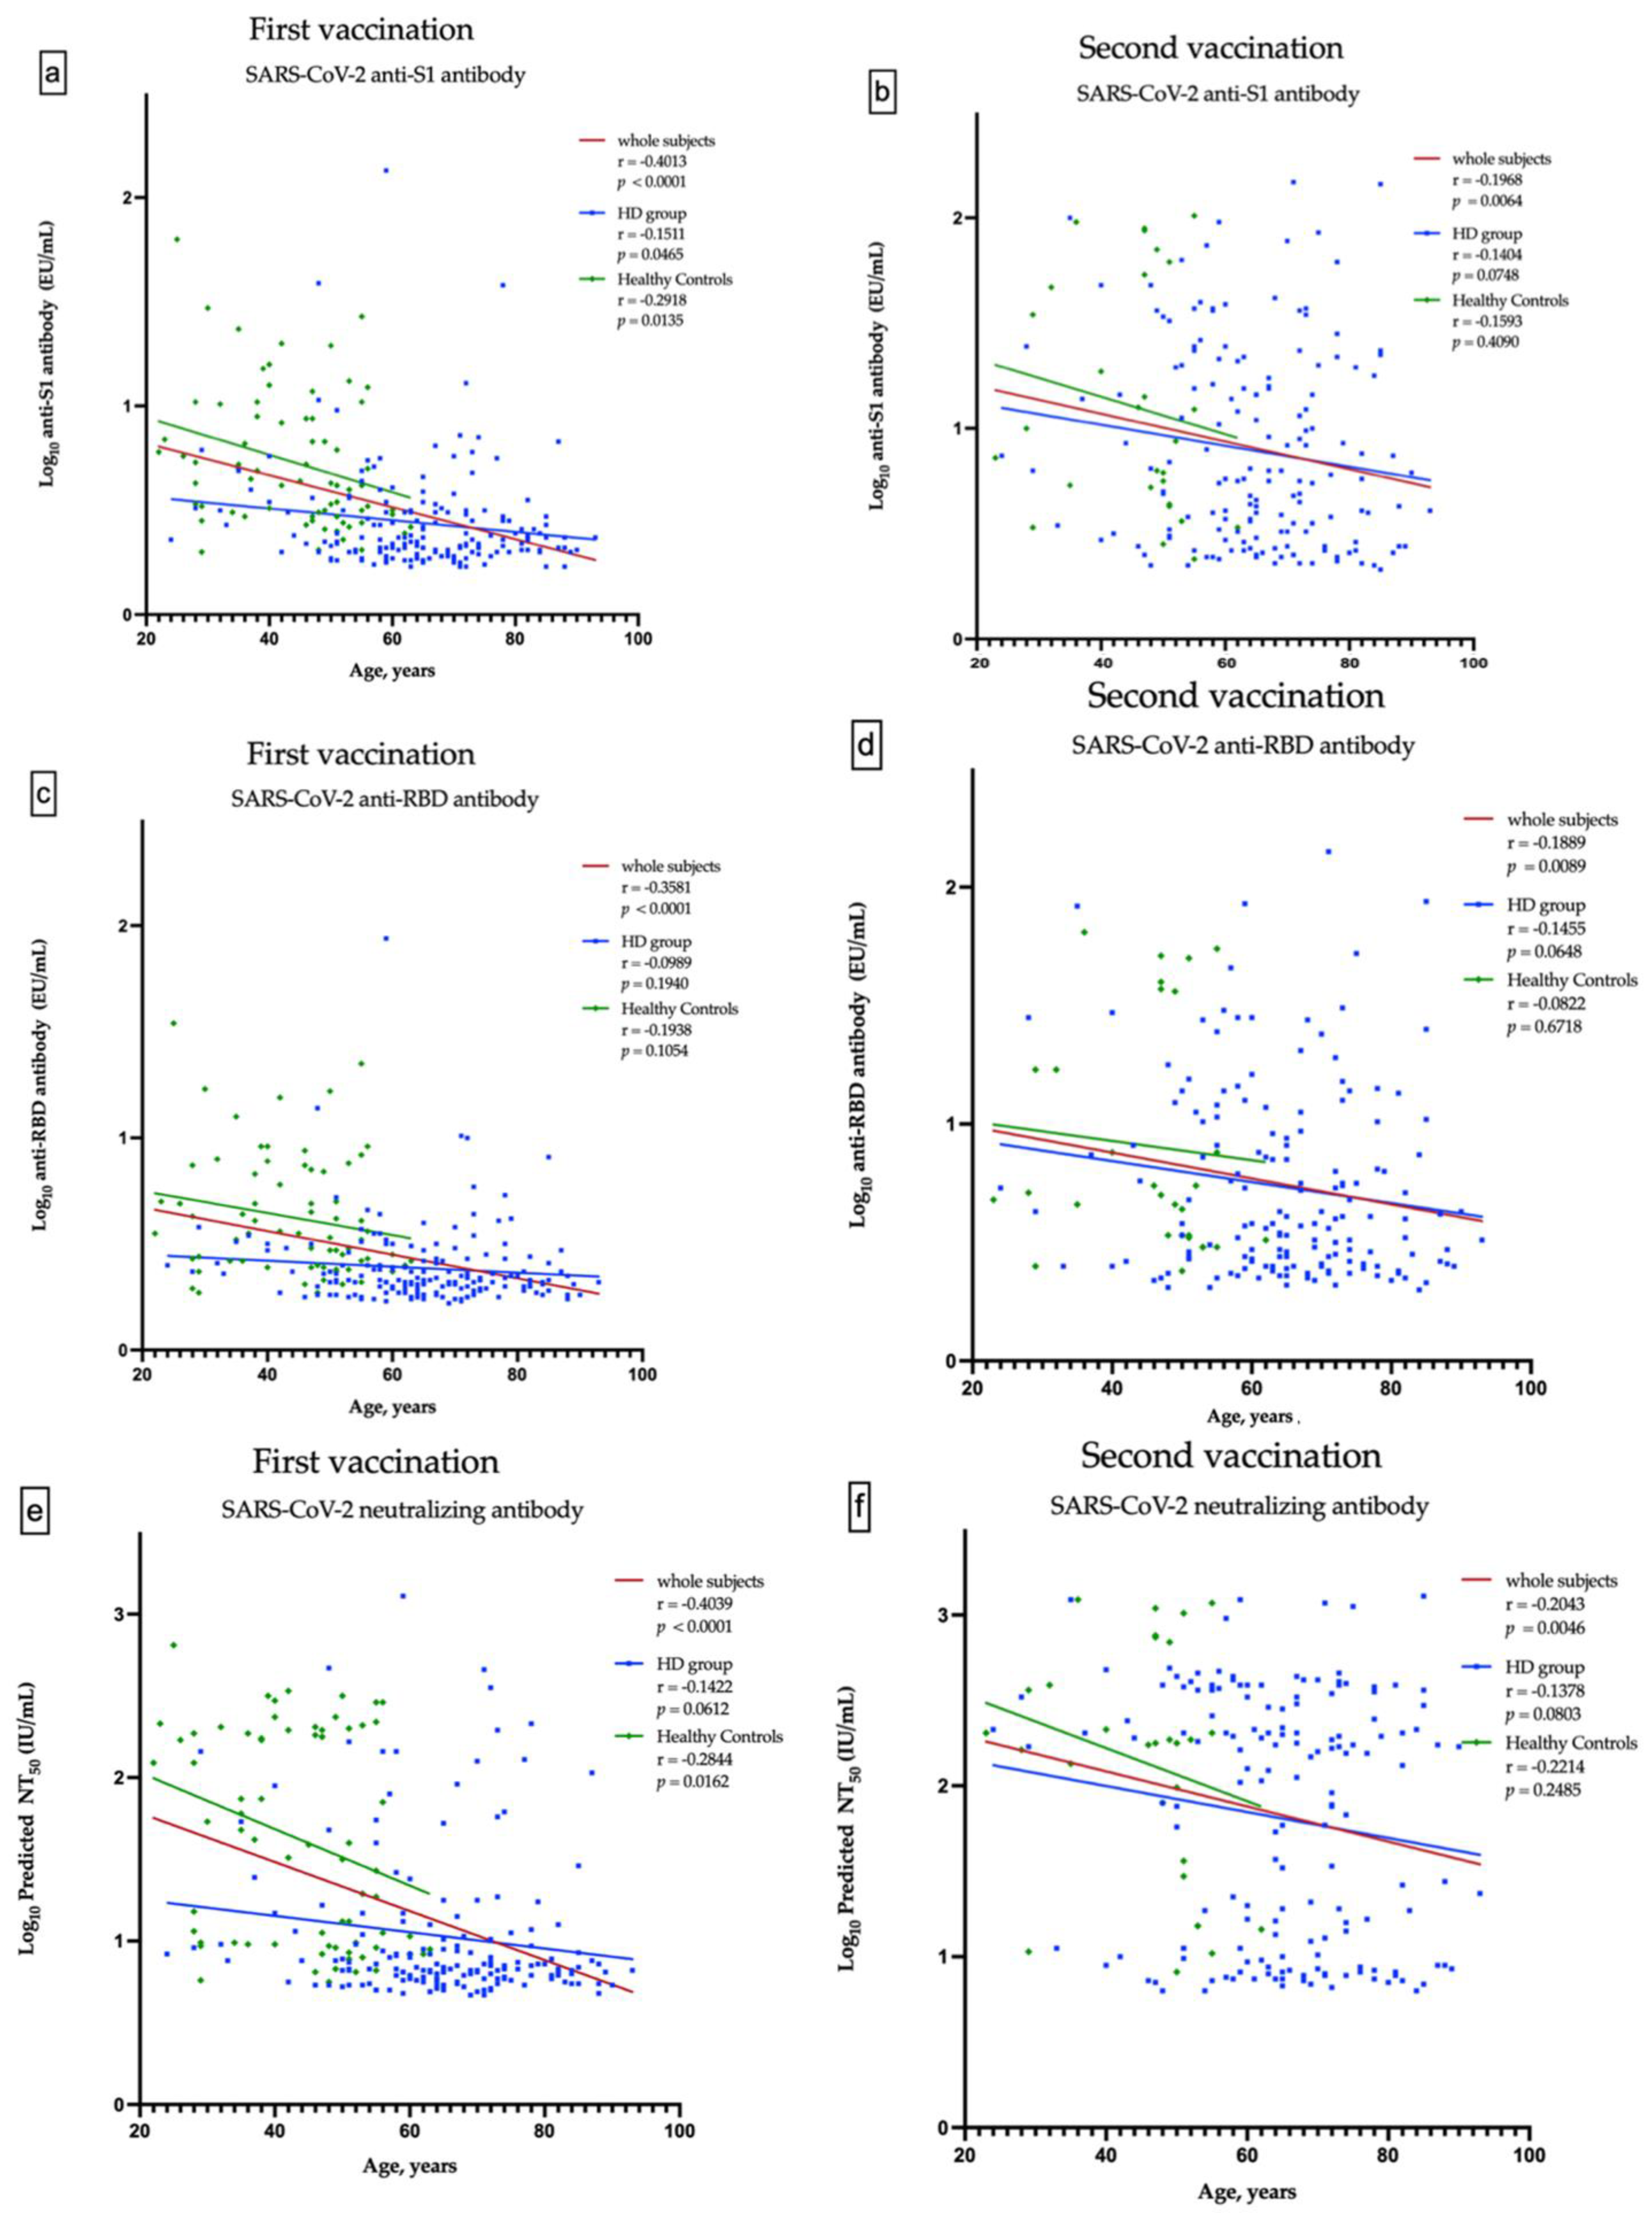
A total of 498 HD patients were screened. From them, 174 patients, who received the first dose of ChAdOx1, were enrolled into the study. Subsequently, 162 patients completed two doses of vaccination (Figure 1a). The healthy control group consisted of 67 subjects, who received the first dose of ChAdOx1 vaccine. Only 29 of them had the second dose of vaccine and have completed nAbs assessment (Figure 1b). The enrolled fully vaccinated HD subjects had comparable age, gender, albumin, Kt/V, Ca × P product and cardiothoracic ratio to non-enrolled HD subjects (Table S1). The Pearson’s correlation coefficients (r) between age and anti-S1 were −0.1511 and −0.1404 (p = 0.0465 and p = 0.0748) in the first dose and the prime-boost doses vaccinated HD subjects, respectively (Figure 2a,b); anti-RBD were −0.989 and −0.1455 (p = 0.1940 and p = 0.0648), respectively (Figure 2c,d); and NT50 were −0.1422 and −0.1378 (p = 0.0612 and p = 0.0803), respectively (Figure 2e,f). Overall, the values of NT50 appear to be distributed in a descending manner from low age to high age (r = −0.2043, p = 0.0046) (Figure 2f).
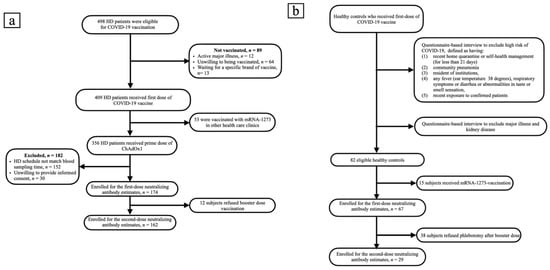
Figure 1.
(a) Flow chart of patients on hemodialysis selected for neutralizing antibody measurement. (b) Flow chart of recruitment of healthy controls.
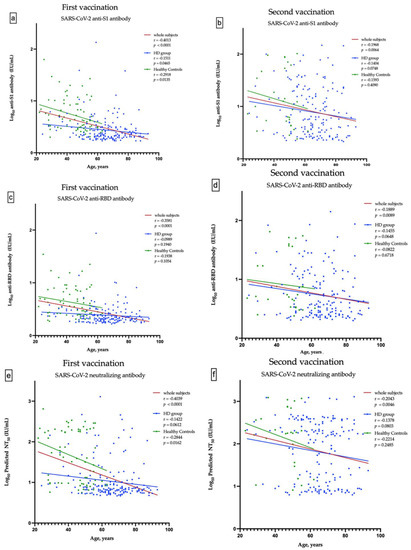
Figure 2.
Correlation between the age and anti-S1 antibody after the first and second vaccination (a,b), between the age and anti-RBD antibody after the first and second vaccination (c,d), and between the age and predicted SARS-CoV-2 50% neutralization titer (NT50) after the first and second vaccination (e,f).
3.2. Comparison of Demographics and Clinical Characteristics between the Groups with Various Humoral Response to Two Doses of ChAdOx1
HD patients who have received standard prime-booster dose of ChAdOx1 vaccination were stratified according to NT50 of nAbs. In parallel with the increase of levels of anti-S1 and anti-RBD antibodies, the values of Ca × P product (p trend = 0.043) and P (p trend = 0.043) ascended monotonically from the low titer group to high titer group (Table 1). Based on the humoral responses after first and second dose of vaccination, we divided HD patients into three groups: all seronegatives (−/−), first negative but second positive (−/+) or all seropositives (+/+) (Table 2). The dual seropositive patients (group 3) have a higher proportion of cerebrovascular disease (p trend = 0.005), a lower proportion of congestive heart failure (p trend = 0.006) and a younger age (p trend = 0.04). In addition, cardiothoracic ratio tends to be lower and Ca × P product tends to be high in dual seropositive (p trend = 0.071 and p trend = 0.057, respectively) (Table 2).

Table 1.
Comparison of demographics and clinical characteristics between the groups with various humoral responses after two doses of ChAdOx1.
Table 2.
Comparison of factors associated with dynamic changes of humoral responses after two doses of ChAdOx1.
3.3. NT50 and Clinical Characteristics of Prime-Boost ChAdOx1 Vaccinated HD Patients
Simple linear regression analysis for factors associated with NT50 showed that anti-S1 and anti-RBD antibodies (β ± SE: 1.125 ± 0.209, p < 0.001; and β ± SE: 1.448 ± 0.274, p < 0.001, respectively) were positively associated with NT50. Multiple linear regression analysis with a backward stepwise selection method was performed to assess factors associated with NT50 (Table 3). After adjusting all variables (Model 1), time average urea concentration (β ± SE: −0.006 ± 0.002, p = 0.008) was significantly and negatively associated with NT50, while anti-Si antibodies (β ± SE: 1.396 ± 0.052, p < 0.001), hemoglobin (β ± SE: 0.076 ± 0.032, p = 0.018), alanine transaminase (β ± SE: 0.287 ± 0.111, p = 0.011) and Ca × P product (β ± SE: 0.005 ± 0.002, p = 0.007) were positively associated with NT50. Although CRP is not statistically significant, it still deserves our attention (β ± SE: −0.079 ± 0.041, p = 0.055). Furthermore, multiple linear regression analysis was conducted with all variables, excluding anti-S1 and anti-RBD antibodies (Model 2), and found that Ca × P product (β ± SE: 0.010 ± 0.004, p = 0.021) were positively associated with NT50, while serum creatinine (β ± SE: −0.062 ± 0.029, p = 0.034) were negatively associated with NT50. Age tends to be negatively associated with NT50 (β ± SE: −0.009 ± 0.005, p = 0.079) (Table 3). Figure S1 shows a receiver operating characteristic curve illustrating the performance of Ca × P (AUC: 59%), age (AUC: 43%), and the combination obtained by Ca × P dividing age (AUC: 60%) in predicting the development of nAb titers over 35.13 IU/mL after prime-boost doses of ChAdOx1 vaccination.
Table 3.
β-coefficient between NT50 and independent variables.
3.4. Predictors Associated with Seroconversion after Second Vaccination in Previously First-Dose Seronegative HD Patients
Binary univariate followed by multiple logistic regression analyses were used to appraise the risk of clinical and dialysis-related parameters linked to seroconversion (NT50 over 35.13 IU/mL) in the subgroup of previously seronegative (first-dose seronegative) HD patients after the first vaccination (Table 4). The multiple logistic regression (enter method, Model 1) found that male (OR: 0.185, 95% CI: 0.048–0.709, p = 0.014) was independently negatively related to seroconversion and Kt/V (OR: 20.295, 95% CI: 2.486–165.683, p = 0.005) was independently positively linked to seroconversion after adjusting all variables. Model 2 multiple logistic regression (backward: Wald method) shows similar results (Kt/V, OR: 7.469, 95% CI: 1.283–43.484, p = 0.025). The results suggested that adequacy of dialysis might contribute to immunogenicity in first-dose seronegative subjects.
Table 4.
Logistic regression analysis of factors associated with positive humoral response (NT50 > 35.13 IU/mL) to booster dose in first-dose seronegative HD patients.
3.5. Differences of Humoral Responses between HD Patients and Healthy Controls
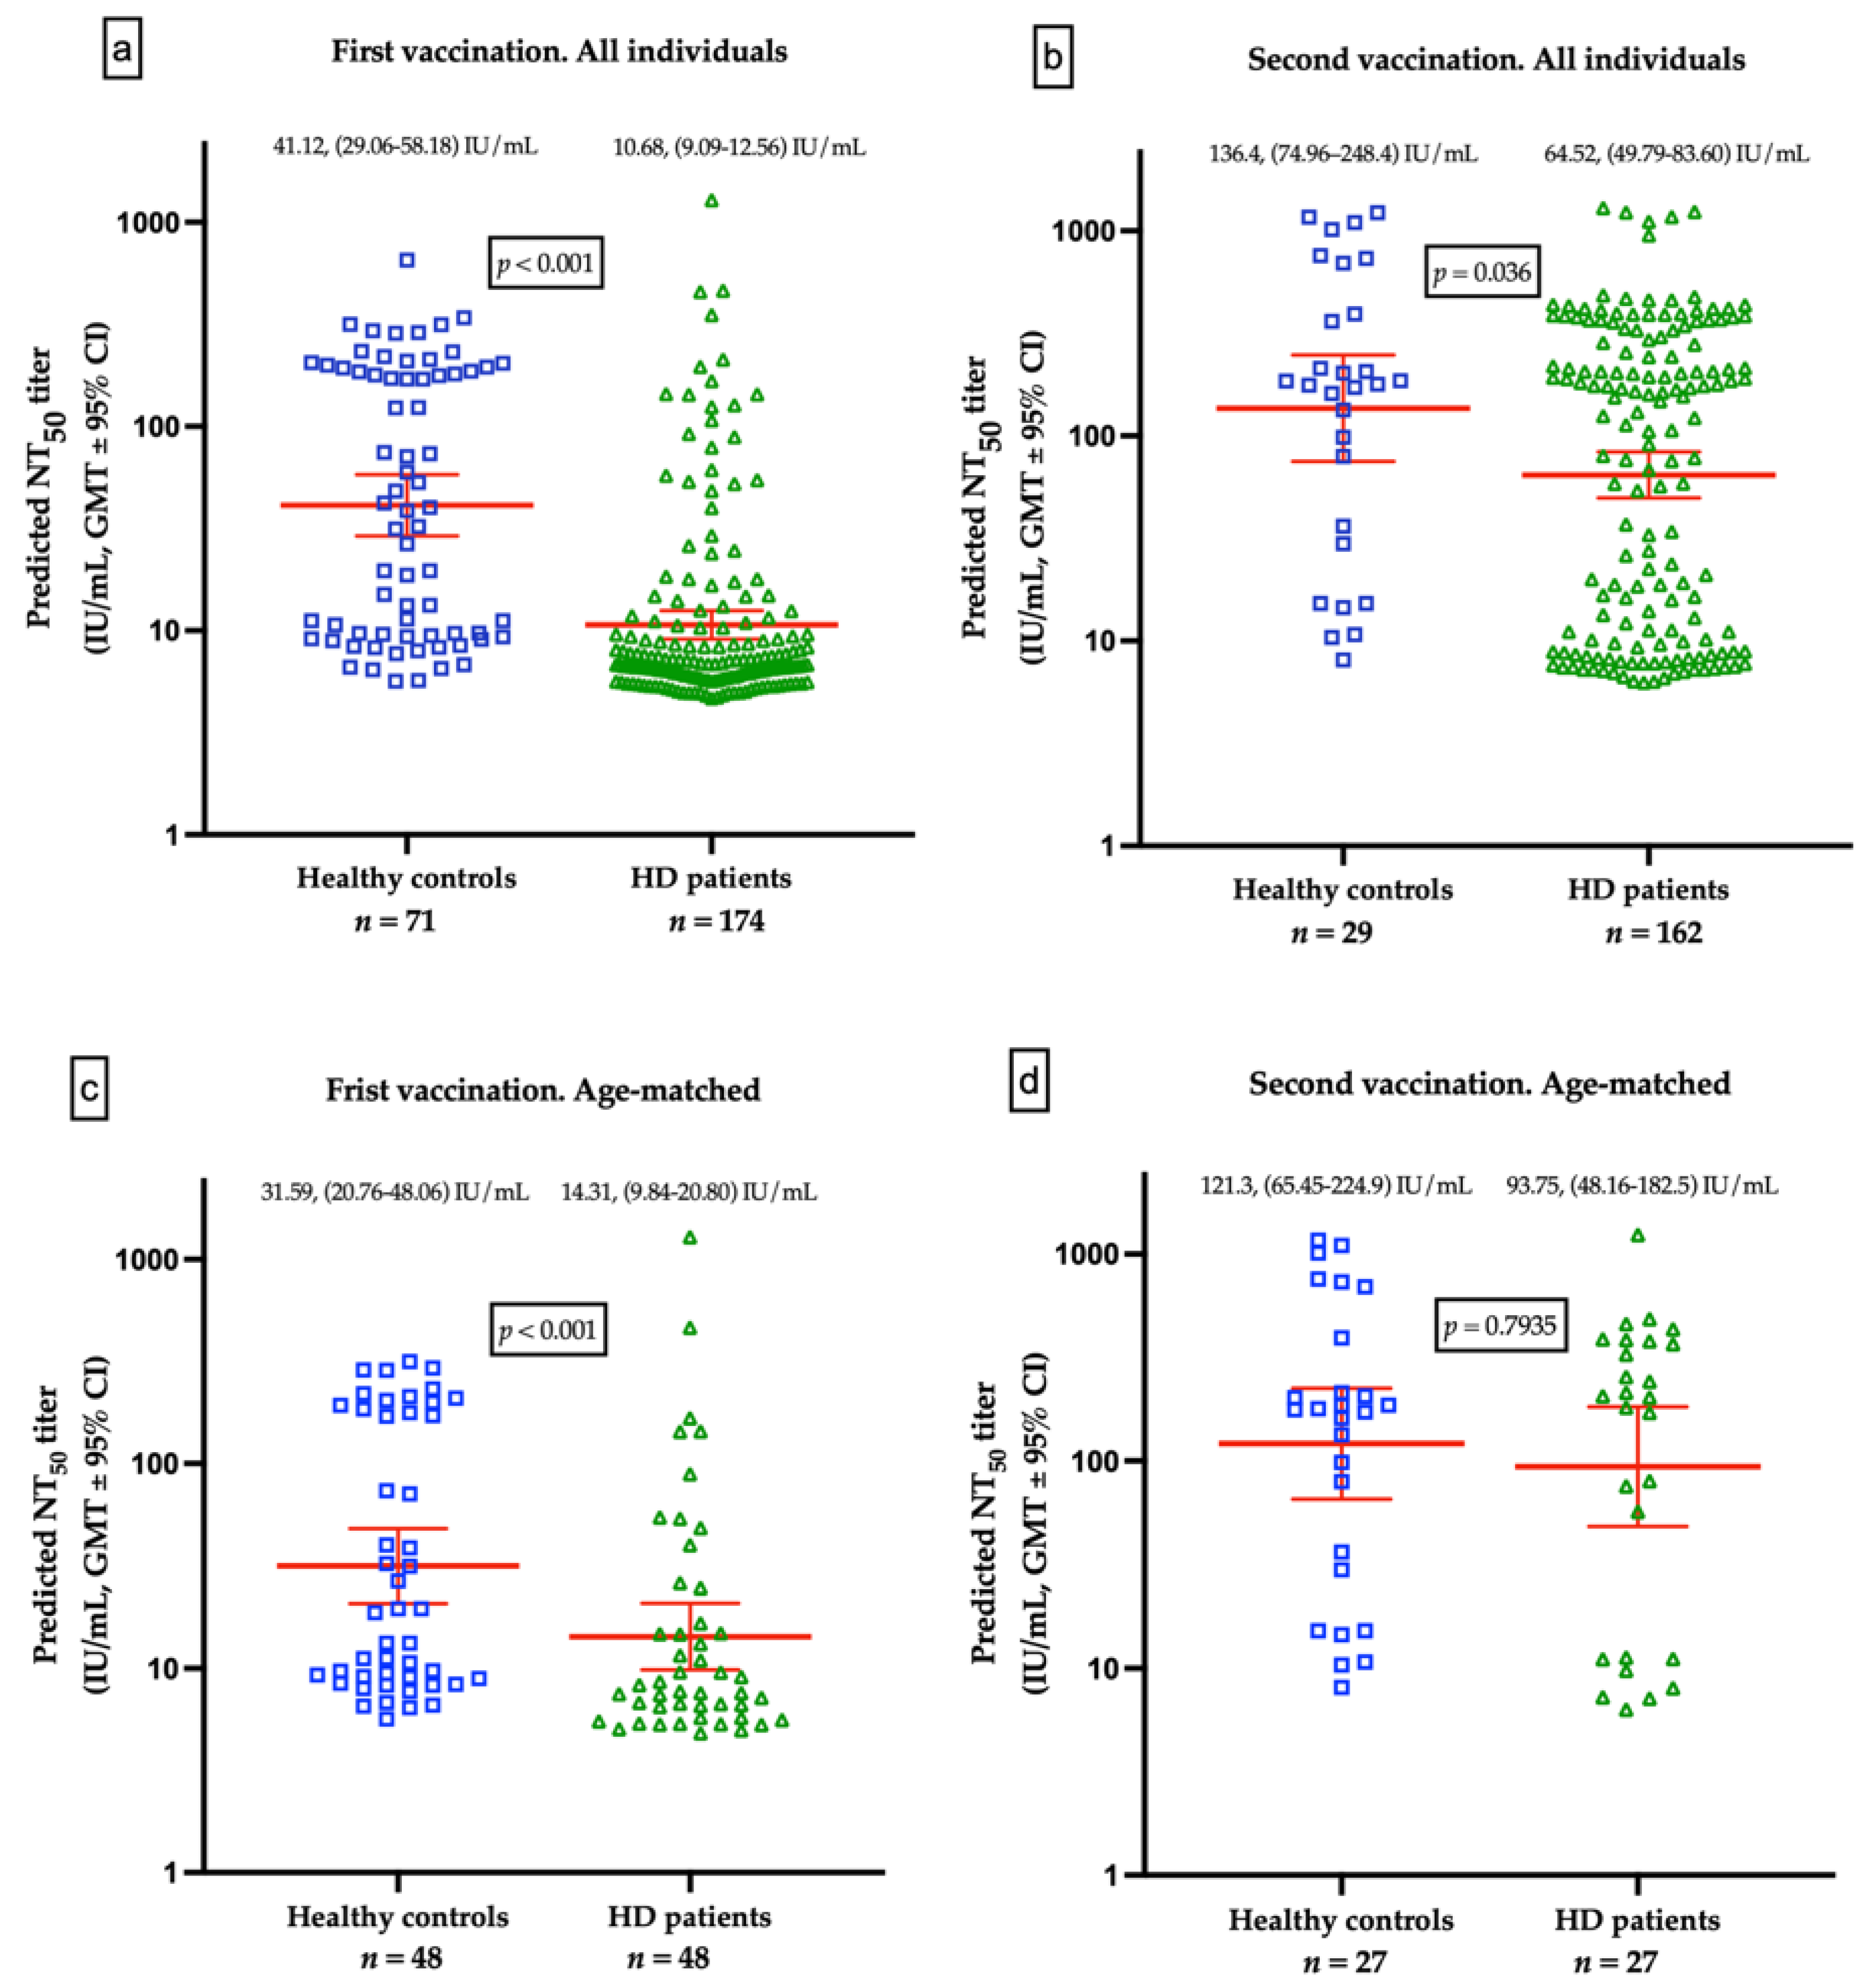
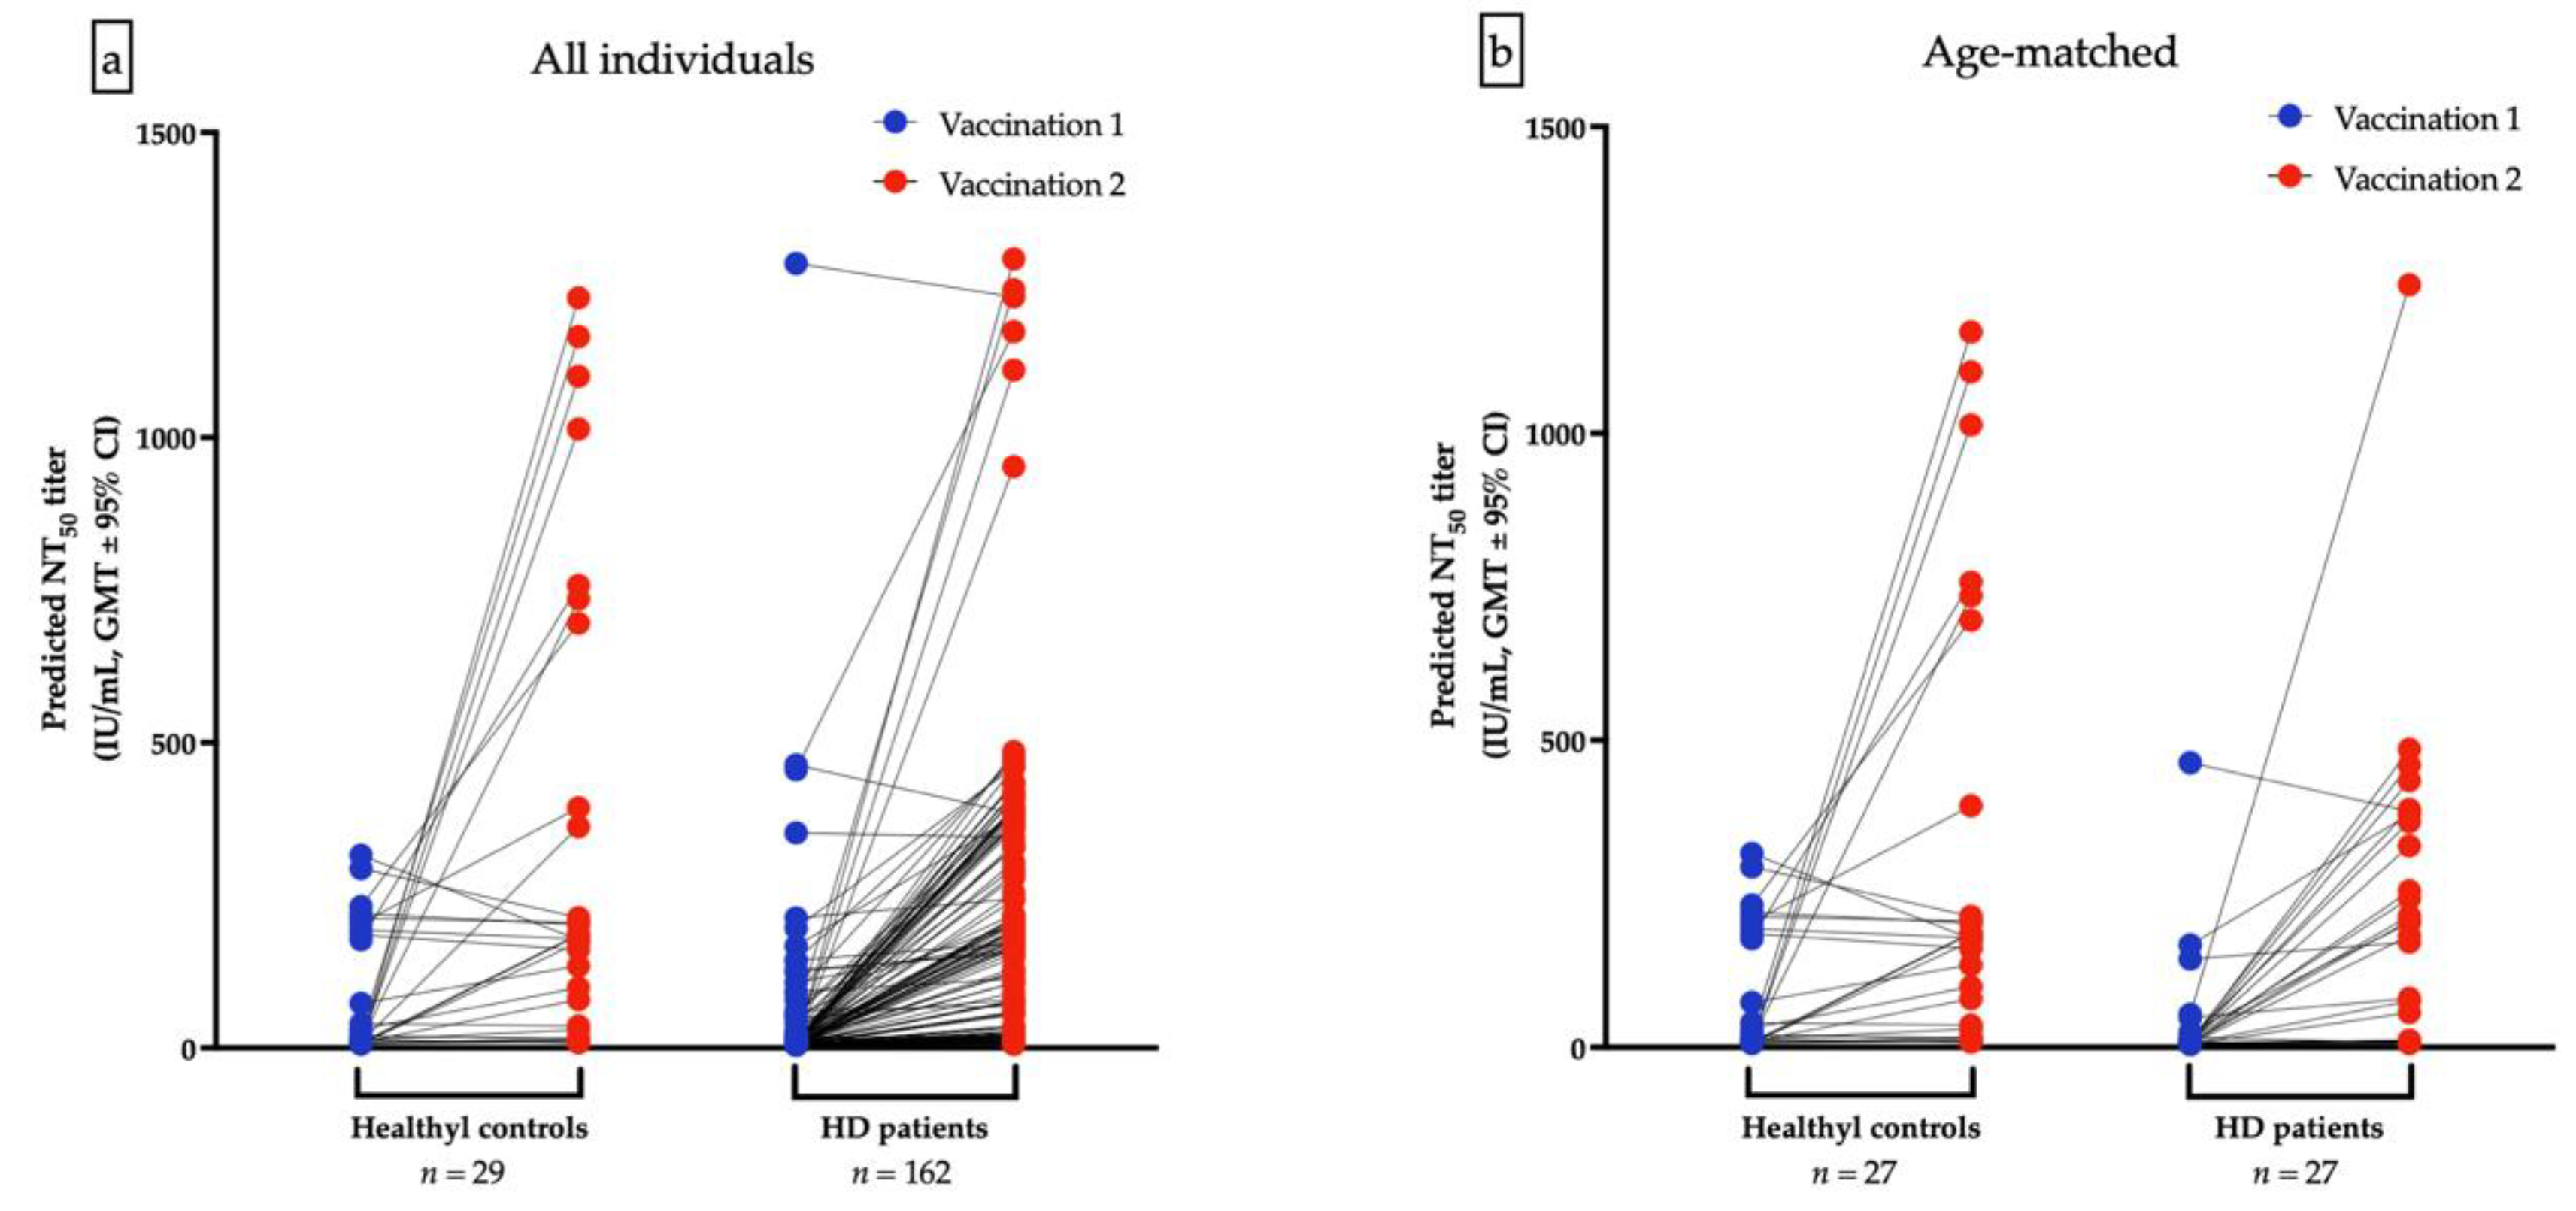
The GMTs for nAbs of ChAdOx1-vaccinated were lower in HD patients than the healthy control after the first dose (10.68 IU/mL vs. 41.12 IU/mL, p < 0.001, Figure 3a) and after second dose of ChAdOx1-vaccination (64.52 IU/mL vs. 136.4 IU/mL, p = 0.036), respectively (Figure 3b). Due to the significant variance of age between HD and healthy controls, a resampling subset of patients with individual match in age (±2 years) was built. Again, we found that healthy controls had higher GMTs for nAbs than HD patients after receiving the first dose of ChAdOx1 (31.59 vs. 14.31 IU/mL, p < 0.001). However, the GMTs after the second dose were not significantly different between the two groups (121.3 vs. 93.75 IU/mL, p = 0.7935, Figure 3c,d). The discrepancy may attribute in part to the relatively small sample size and shorter interval between blood sampling and the second dose in healthy controls. Individual NT50 courses in all and in age-matched individuals after the first and after the second ChAdOx1 vaccination are illustrated in Figure 4a,b, respectively. The seroconversion rate of HD patients and healthy controls are 13.2% vs. 58.0% (p < 0.001) and 50.7% vs. 75.9% (p < 0.001) after the first dose and after the second dose, respectively (Table 5). GMT ratio of HD patients is non-inferior to that of healthy controls (geometric mean: 6.01, 95% CI: 4.72–7.66 vs. geometric mean 4.35, 95% CI: 2.14–8.82, p = 0.135) (Table 5). Specifically, the finding suggested that although attenuation of humoral response after a single dose in uremic patients, the potential soaring NT50 after the second dose in HD patients was noteworthy, especially in younger subjects.

Figure 3.
(a) Comparison of geometric mean titers (GMTs) for neutralizing antibodies (nAbs) between healthy controls and hemodialysis (HD) patients vaccinated with a first dose of ChAdOx1. (b) Comparison of GMTs for nAbs between healthy controls and HD patients after prime-booster doses of ChAdOx1. (c) Comparison of GMTs for nAbs from age-matched healthy controls and HD patients vaccinated with a first dose of ChAdOx1. (d) Comparison of GMTs for nAbs from age-matched healthy controls and HD patients after prime-booster doses of ChAdOx1.
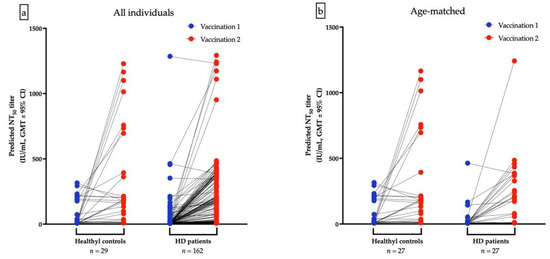
Figure 4.
Individual NT50 courses in all and in age-matched individuals after the first and after the second ChAdOx1 vaccination are illustrated (a,b), respectively.
Table 5.
Humoral responses evolution of prime-booster vaccination of ChAdOx1 (Oxford–AstraZeneca).
3.6. Evolution of nAbs Amount Analyzed by Whether Seroconversion or Not after the Prime Dose
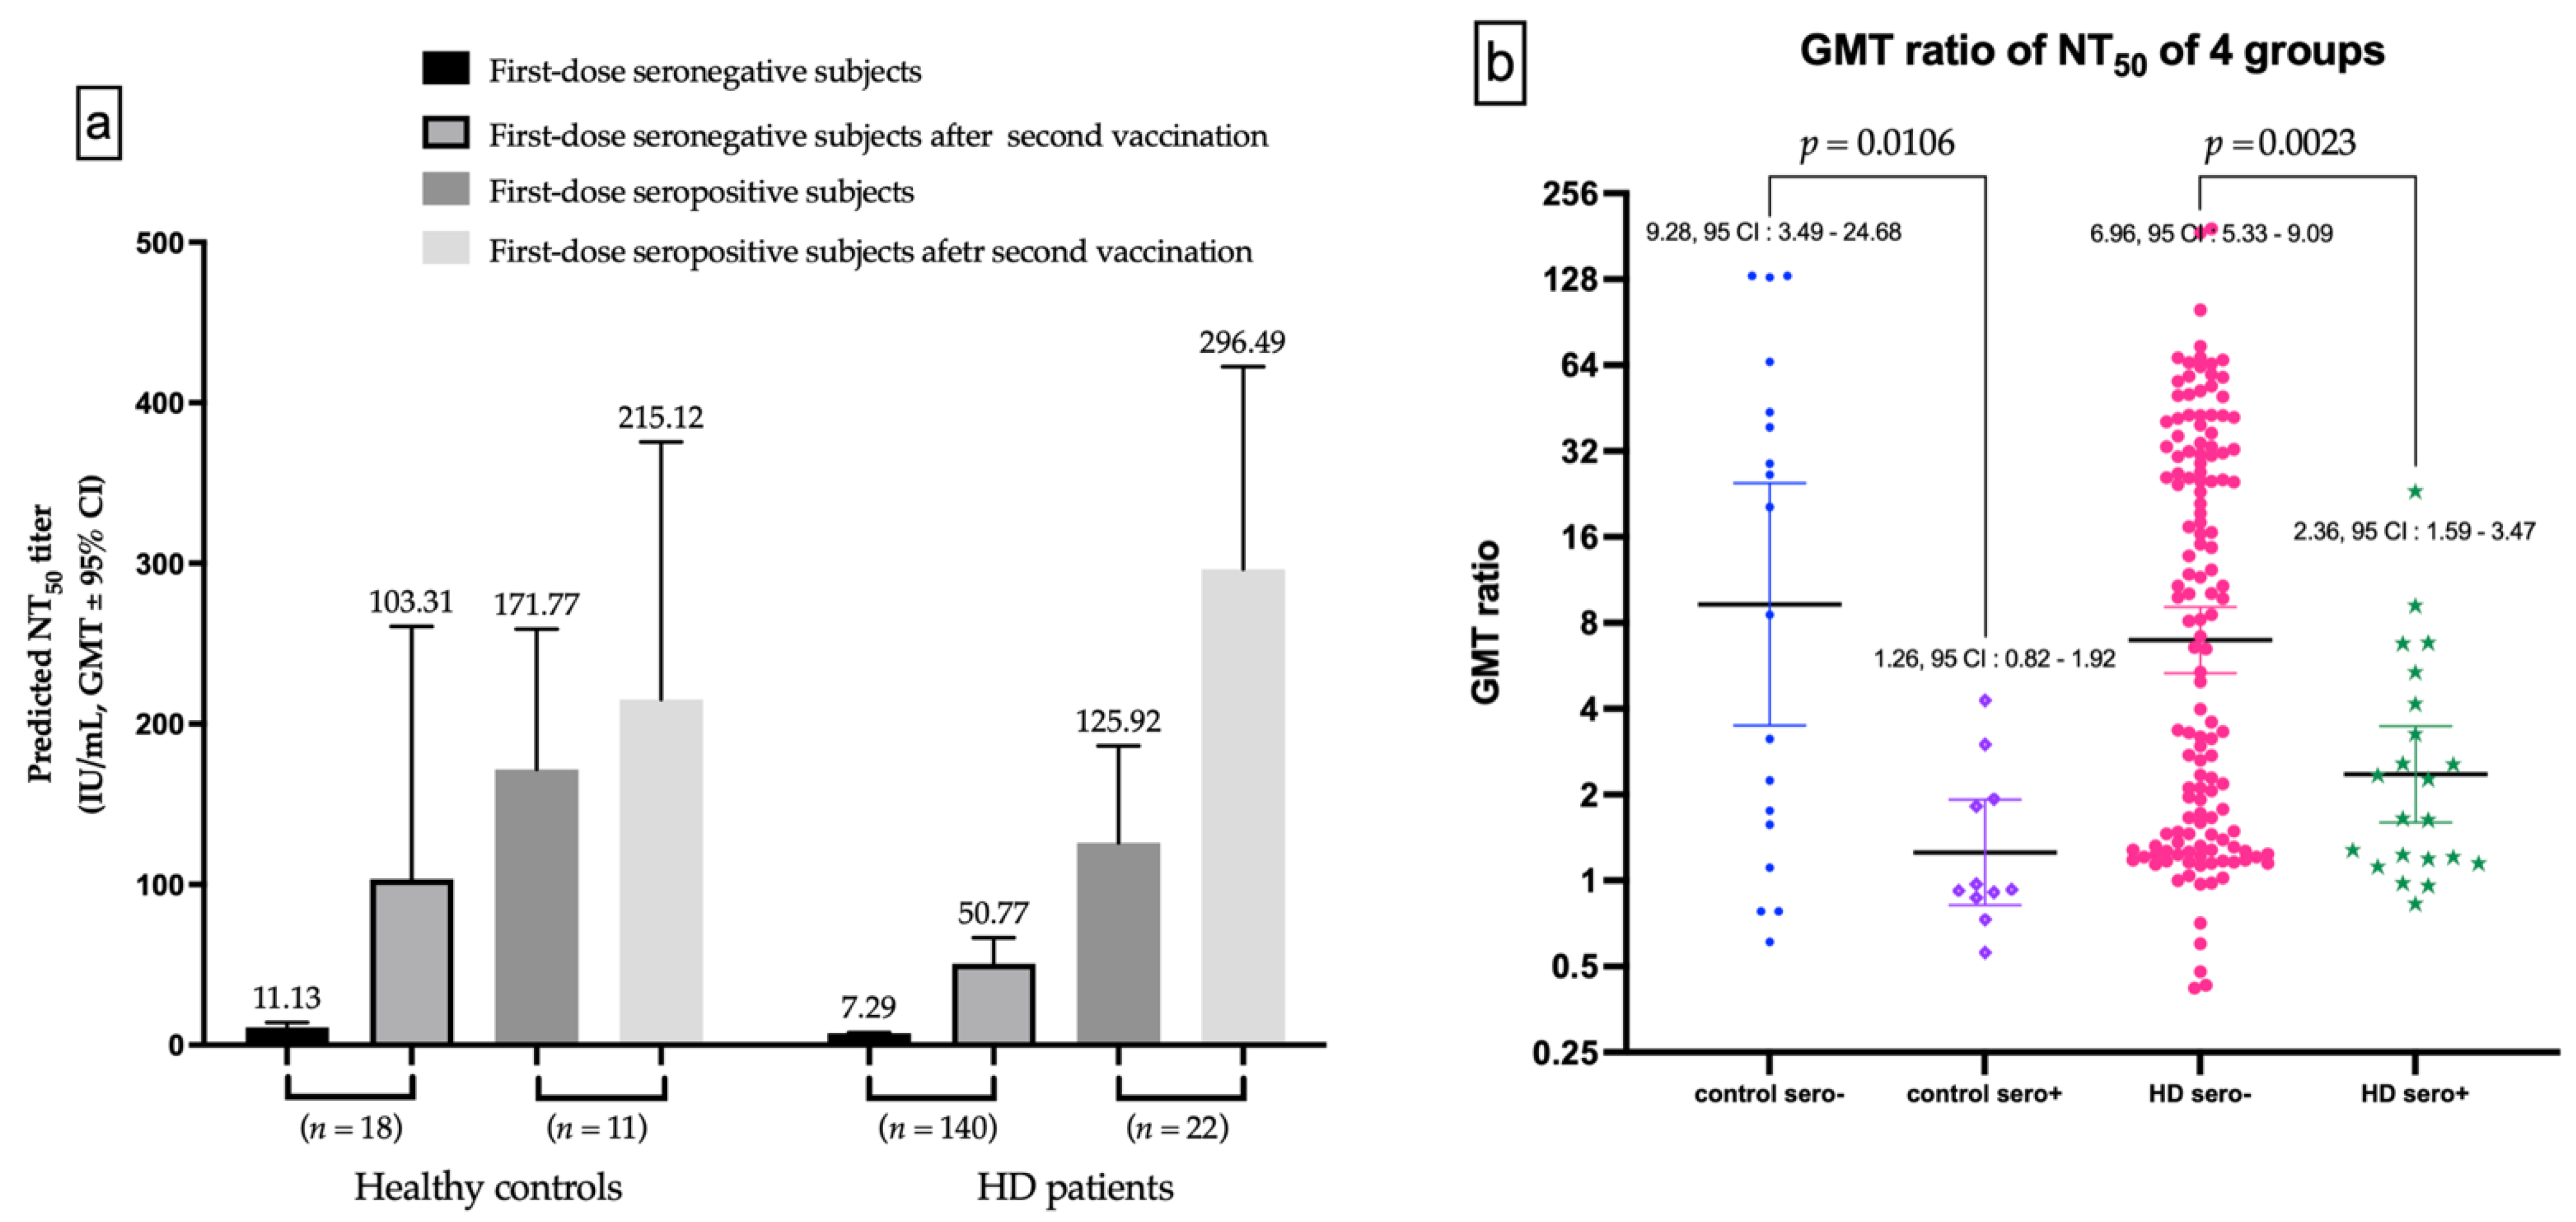
The seronegative subgroup after the first dose vaccination has substantial increased in GMT for nAbs after the second vaccination, in both healthy controls and HD subjects (Figure 5a). The GMT ratio of first-dose seronegative controls was higher than first-dose seropositive controls (9.289 vs. 1.255, p = 0.0106), as well as for HD subjects (6.964 vs. 2.355, p = 0.0023, Figure 5b).
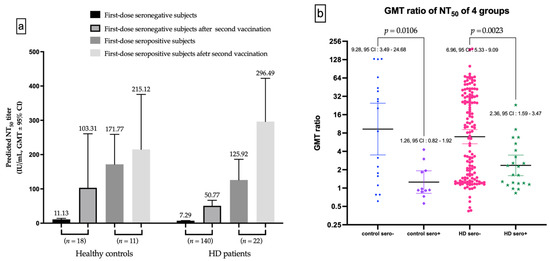
Figure 5.
(a) The Difference of NT50 evolutions in first-dose seronegative and first-dose seropositive subgroup. (b) The difference of gemetric mean titer (GMT) ratio between first-dose seronegative and first-dose seropositive controls, and between first-dose seronegative and first-dose seropositive hemodialysis (HD) patients.
4. Discussion
In this prospective observational single-center study, we demonstrated that dialysis adequacy (Kt/V) can independently predict seroconversion after two doses of the ChAdOx1 prime-booster vaccination in first-dose seronegative HD patients. The relationship remained significant after adjusting for albumin, gender, diabetes and immunosuppressant usage. The seroconversion rate of HD patients was lower than that of healthy controls. Furthermore, the GMT ratio for nAbs of the first-dose seronegative subgroup was significantly higher than that of the seropositive subgroup, in both HD subjects and healthy controls.
Previous studies have showed that mRNA vaccines could elicit a more prominent humoral response than the vector-based vaccines in dialysis cohorts, and the humoral response wanes over time according to initial antibody titers elicited by different types of vaccine [8,14,15,16,17]. Although dialysis patients were also proved to generate attenuated nAbs compared with general population after COVID-19 vaccination, full vaccination with prime-booster doses can also provide protection against infection, severe disease, hospitalization and mortality [8,18,19,20]. Especially, El Karoui et al. found a lower relative incidence for dialysis patients, suggesting an effect of vaccination coverages and preventive measures [21]. The results of our study have confirmed a substantial increase in nAbs titer in immunocompromised HD subjects after the second dose.
Several investigations evaluated humoral responses of vaccination, by estimating the anti-S1 or anti-RBD IgG or IgM as a surrogate for nAbs; however, the exact viral neutralization test in uremic cohort remains limited. A UK study used live virus neutralization in seronegative HD patients to compare the humoral response of ChAdOx1 (n = 53) and BNT162b2 (n = 55). They found that the mRNA vaccine provokes comparable nAb titers between HD subjects and controls; nevertheless, the ChAdOx1 elicited lower nAb quantity in HD patients against all variants of concern [15]. Our study identified the concentration of both anti-S1 and anti-RBD antibodies including IgG, IgM and IgA by ELISA procedure and the results were computed by a spline-based two-variable GAM to predict real NT50 for nAbs. The robustness of the correlation between predicted and actual virus neutralization titers was validated, which was as high as 0.917 [13], and was superior to many widely used commercial assays, such as Roche and Abbott RBD antibody titers [12]. To our knowledge, this study is the first attempt to explore NT50 in an extensive HD cohort inoculated with prime-booster ChAdOx1 using the International Unit.
High Ca × P product had been proposed as a predictor of soft tissue or vascular calcification, and mortality. A target below 55 has been recommended by the 2003 National Kidney Foundation Kidney Disease Outcomes Quality Initiative (K/DOQI) practice guideline [22]. However, the clinical value of Ca × P product has been controversial and an updated 2009 Kidney Disease: Improving Global Outcomes (KDIGO) clinical practice guideline has suggested to evaluate serum Ca and P individually, instead of tracking Ca × P [23,24]. Our study results indicated Ca × P was significantly positively associated with NT50 in both multiple linear regression and one-way ANOVA analyses. The explanation to this phenomenon remains unclear, however, the best cut-off value to induce an appropriate humoral response was 42.92, below the value recommended by the K/DOQI. The Ca2+ plays crucial role in the signaling of lymphocytes; the P was considered as part of an integrated approach to support immune functions and sustain a steady microbial ecosystem in the gut; and the Ca × P probably had mutual influence on the regulation of the immune system [25,26]. Further animal experiments are needed to elucidate the relationship between immunogenicity to COVID vaccine and Ca × P in HD patients.
The Kt/V has been used as an indicator of the quantification of dialysis adequacy and was derived by applying the following formula: dialysis clearance of urea (K) multiplied by dialysis time (t), divided by the volume of distribution of urea (V). The delivered dose of dialysis could be adjusted by dialyzer, dialysis time, dialysate flow, blood flow and patient body size. Kt/V has become the preferred method for estimating a delivered dialysis dose because it adequately reflects urea removal and also can be applied to modify the dialysis prescription for those still having residual renal function. The National Cooperative Dialysis Study (NCDS) have demonstrated a strong effect of Kt/V on short-term outcome and led to the widespread deliberation of Kt/V as a standard for evaluating dialysis adequacy. A minimal single-pool Kt/V of 1.2 was developed on the basis of the NCDS and another observational data set, while a Kt/V of lower than 0.8 related to a worse outcome [27,28]. The Hemodialysis (HEMO) Study confirmed that a dose of dialysis significantly greater (Kt/V of 1.71) than Kt/V of 1.2 failed to offer extra survival benefit in HD patients [29]. Our study showed that the quality of the HD assessed by the Kt/V was linked to a seroconversion after the second vaccination, suggesting that uremic toxin plays a crucial role in the immunogenicity after vaccination, especially in previous seronegative HD patients [30]. The phenomenon was also observed in virus-unexposed non-immunosuppressed HD cohorts [9]. In the uremic milieu, defects of innate and adaptive immunity were found with antigen presenting cell dysfunction and attenuated antibody production by damaged differentiated B cell [31,32,33,34]. The impairment of the antigen-presenting capability of the immune system of uremic patients can impede recognition of pathogens and interfere with production of downstream adaptive immunity [35,36]. It has been suggested that end-stage renal disease may be associated with an impaired antibody production post vaccination. In fact, lower Kt/V has been associated with tempered humoral response to hepatitis B vaccine in HD patients [37,38]. Therefore, it is reasonable to conclude that enhancing uremic toxin removal could improve immunogenicity after vaccination.
Albumin, C-reactive protein, transferrin saturation and normalized protein catabolic rate were imperative indicators of clinical outcome in HD patients; however, these parameters were not correlated with levels of NT50 in our study. The findings were consistent with a study from Mexico’s healthcare workers, indicating that gender and comorbidities (such as diabetes, obesity and hypertension) have not been linked to low titers of nAbs. A relative homogenous status regarding nutrition, inflammation and administered dialysis dosage might also show this [39,40].
The GMT ratios were calculated from titers after the booster dose, dividing titers after the prime dose. We observed that HD patients have a comparable GMT ratio to that of healthy controls, while the Folegatti et al. also found the similar GMT ratio of approximate 4-fold after prime-boost ChAdOx1 vaccination [41]. Rincon-Arevalo et al. have demonstrated that the responses of B and plasma cells were delayed 3–4 weeks post a booster dose of an mRNA COVID-19 vaccine [42]. Here, our first-dose seronegative HD and healthy controls both had significantly higher GMT ratios than those of first-dose seropositive subjects. This suggests that the first-dose seronegative individuals might have delayed humoral response that could be immensely stimulated by a boost dose. Our findings suggest that full prime-boost vaccination is necessary, especially in immunocompromised individuals such as HD patients.
This study has several limitations. First, we did not estimate nAbs before vaccination and the presence of a previous occult infection was not clear. However, there was almost no domestic transmission before May 2021 in Taiwan, and there was no laboratory confirmed cases in our HD facility in the period of research. The preventive measure of our facility has included SARS-CoV-2 rapid antigen testing on a weekly basis and may have avoided the presence of asymptomatic infection in our HD patients [43]. Second, the clinical characteristics of healthy controls in this single-center study was lacking and the HD patients and healthy controls are heterogenous in the timing of nAbs assessment. For the convenience of HD patients and to improve compliance with the study, the timing of nAbs measurement must match their monthly scheduled phlebotomy. Third, we did not perform baseline laboratory testing for healthy controls, because they were generally fair, and we simply obtained blood samples for measurement of nAbs. Fourth, the case numbers of healthy controls were less than the HD patients and the loss of a substantial number of healthy controls to obtain blood samples after booster dose might affect the final statistics of comparing with HD patients. Immunogenicity of COVID-19 vaccination in the general population has been extensively investigated in the literature. For this reason, we have emphasized immune reaction in HD patients. The timing and vaccine resource were subjects to national public health policies and could not be controlled even in academia. We have employed a resampling subset of patients, in terms of age, to minimize possible confounding factors as much as possible. Finally, we did not obtain NT50 titers from real neutralization testing; however, our methodology has been proven to be superior to other commercial serological tests [12]. Further, a large multi-ethnic cohort is needed to validate the results of present study.
5. Conclusions
This prospective study has established the association between hemodialysis adequacy and positive humoral response in a first-dose seronegative HD cohort vaccinated with prime-boost doses of ChAdOx1 COVID-19 vaccine. Significant increases of GMT ratios were seen after booster dose in first-dose seronegative patients. Ca × P product was significantly associated with NT50. We also noticed that higher Kt/V was associated with a positive immune response of the boost dose of vaccination in patients who were previously first-dose seronegative. The results of the present study suggest that double dose vaccination is necessary in HD cohorts and pursuit of appropriate dialysis adequacy might contribute to better humoral response post vaccination.
Supplementary Materials
The following supporting information can be downloaded at: https://www.mdpi.com/article/10.3390/v14061149/s1, Table S1: Demographics and clinical characteristics comparisons between enrolled and non-enrolled patients on hemodialysis; Figure S1: Receiver operating characteristic curve illustrating the performance of Ca × P (AUC: 59%), Age (AUC: 43%), and the combination obtained by Ca × P dividing age (AUC: 60%) in predicting the development of NT50 over 35.13 IU/mL after prime-boost doses of ChAdOx1 vaccination.
Author Contributions
C.-Y.C.: writing—original draft, formal analysis, project administration, resources; K.-T.L.: soft-ware, methodology, data curation, validation; S.-R.S.: conceptualization, visualization, resources, supervision; J.-J.Y., Y.-T.C., C.-K.H., H.-C.P., H.-J.H., C.-Y.S. and C.-C.L. (Chin-Chan Lee): investigations; C.-Y.W.: investigations, methodology; C.-C.L. (Chi-Chun Lai): visualization, supervision; I.-W.W.: supervision, conceptualization, writing—review and editing, project administration, funding acquisition. All authors have read and agreed to the published version of the manuscript.
Funding
This research was funded by research grants from the Chang Gung Memorial Hospital (CMRPG2L0231) and the National Institutes of Health USA grant U01 AI151698 for the United World Arbovirus Research Network (UWARN).
Institutional Review Board Statement
This study was performed in accordance with the Declaration of Helsinki, and was approved by the Ethics Committee of the Institutional Review Board at Chang Gung Medical Foundation. The approval number is 202001041A3C604 and 202100854B0A3.
Informed Consent Statement
Informed consent was obtained from all subjects involved in the study.
Data Availability Statement
Not applicable.
Acknowledgments
We wish to express our deepest gratitude to all of the people who participated in this study. We also express our gratitude to all of the nephrology medical and nursing staff members for their dedicated efforts during the COVID-19 epidemic; to the Research Center for Emerging Viral Infections, for diligent, excellent, and rapid quantification of neutralizing antibodies; to the Committee of Infection Control, for suggestions of infection prevention; and to the Department of Administration, for excellent support in terms of medical equipment, manpower, and resource allocation.
Conflicts of Interest
The authors declare no conflict of interest.
References
- WHO Coronavirus Disease (COVID-19) Dashboard. Available online: https://covid19.who.int (accessed on 4 March 2022).
- Yi, S.; Choe, Y.J.; Kim, J.; Kim, Y.Y.; Kim, R.K.; Jang, E.J.; Lim, D.S.; Byeon, H.R.; Lee, S.; Park, E.; et al. SARS-CoV-2 Breakthrough Infections after introduction of 4 COVID-19 Vaccines, South Korea, 2021. Emerg. Infect. Dis. 2022, 28, 753–756. [Google Scholar] [CrossRef] [PubMed]
- Ai, J.; Zhang, H.; Zhang, Y.; Lin, K.; Zhang, Y.; Wu, J.; Wan, Y.; Huang, Y.; Song, J.; Fu, Z.; et al. Omicron variant showed lower neutralizing sensitivity than other SARS-CoV-2 variants to immune sera elicited by vaccines after boost. Emerg. Microbes. Infect. 2022, 11, 337–343. [Google Scholar] [CrossRef] [PubMed]
- Zhou, F.; Yu, T.; Du, R.; Fan, G.; Liu, Y.; Liu, Z.; Xiang, J.; Wang, Y.; Song, B.; Gu, X.; et al. Clinical course and risk factors for mortality of adult inpatients with COVID-19 in Wuhan, China: A retrospective cohort study. Lancet 2020, 395, 1054–1062. [Google Scholar] [CrossRef]
- Rao, K.S.; Suryaprakash, V.; Senthilkumar, R.; Preethy, S.; Katoh, S.; Ikewaki, N.; Abraham, S.J.K. Role of Immune Dysregulation in Increased Mortality among a Specific Subset of COVID-19 Patients and Immune-Enhancement Strategies for Combatting through Nutritional Supplements. Front. Immunol. 2020, 11, 1548. [Google Scholar] [CrossRef] [PubMed]
- Chen, C.Y.; Shao, S.C.; Chen, Y.T.; Hsu, C.K.; Hsu, H.J.; Lee, C.C.; Sun, C.Y.; Chen, Y.C.; Hung, M.J.; Wu, I.W. Incidence and Clinical Impacts of COVID-19 Infection in Patients with Hemodialysis: Systematic Review and Meta-Analysis of 396,062 Hemodialysis Patients. Healthcare 2021, 9, 47. [Google Scholar] [CrossRef] [PubMed]
- Carr, E.J.; Kronbichler, A.; Graham-Brown, M.; Abra, G.; Argyropoulos, C.; Harper, L.; Lerma, E.V.; Suri, R.S.; Topf, J.; Willicombe, M.; et al. Review of Early Immune Response to SARS-CoV-2 Vaccination among Patients with CKD. Kidney Int. Rep. 2021, 6, 2292–2304. [Google Scholar] [CrossRef]
- Chen, C.Y.; Liu, K.T.; Shih, S.R.; Ye, J.J.; Chen, Y.T.; Pan, H.C.; Hsu, H.J.; Sun, C.Y.; Lee, C.C.; Wu, C.Y.; et al. Neutralization Assessments Reveal High Cardiothoracic Ratio and Old Age as Independent Predictors of Low Neutralizing Antibody Titers in Hemodialysis Patients Receiving a Single Dose of COVID-19 Vaccine. J. Pers. Med. 2022, 12, 68. [Google Scholar] [CrossRef]
- Espi, M.; Charmetant, X.; Barba, T.; Koppe, L.; Pelletier, C.; Kalbacher, E.; Chalencon, E.; Mathias, V.; Ovize, A.; Cart-Tanneur, E.; et al. The ROMANOV study found impaired humoral and cellular immune responses to SARS-CoV-2 mRNA vaccine in virus-unexposed patients receiving maintenance hemodialysis. Kidney Int. 2021, 100, 928–936. [Google Scholar] [CrossRef]
- Mulhern, J.G.; Fadia, A.; Patel, R.; Ficociello, L.H.; Willetts, J.; Dahne-Steuber, I.A.; Pollan, M.C.; Mullon, C.; DeLisi, J.; Johnson, C.; et al. Humoral Response to mRNA versus an Adenovirus Vector-Based SARS-CoV-2 Vaccine in Dialysis Patients. Clin. J. Am. Soc. Nephrol. 2021, 16, 1720–1722. [Google Scholar] [CrossRef]
- Taiwan Society of Nephrology Taiwan Society of Nephrology. Statement from the Taiwan Society of Nephrology: Regarding the Administration of COVID-19 Vaccines for Dialysis Facilities and Renal Patients. Available online: https://www.tsn.org.tw/hemodialysis_covid19_detail.html?id=4d4766eb-2fda-48d6-b140-0ea470d8ee04 (accessed on 4 March 2022).
- Kung, Y.A.; Huang, C.G.; Huang, S.Y.; Liu, K.T.; Huang, P.N.; Yu, K.Y.; Yang, S.L.; Chen, C.P.; Cheng, C.Y.; Lin, Y.T.; et al. Antibody titers measured by commercial assays are correlated with neutralizing antibody titers calibrated by international standards. medRxiv 2021. [Google Scholar] [CrossRef]
- Liu, K.-T.; Gong, Y.-N.; Huang, C.-G.; Huang, P.-N.; Yu, K.-Y.; Lee, H.-C.; Lee, S.-C.; Chiang, H.-J.; Kung, Y.-A.; Lin, Y.-T. Quantifying Neutralizing Antibodies in Patients with COVID-19 by a Two-Variable Generalized Additive Model. mSphere 2022, 7, e00883-21. [Google Scholar] [CrossRef] [PubMed]
- Garcia, P.; Anand, S.; Han, J.; Montez-Rath, M.E.; Sun, S.; Shang, T.; Parsonnet, J.; Chertow, G.M.; Schiller, B.; Abra, G. COVID-19 Vaccine Type and Humoral Immune Response in Patients Receiving Dialysis. J. Am. Soc. Nephrol. 2022, 33, 33–37. [Google Scholar] [CrossRef] [PubMed]
- Carr, E.J.; Wu, M.; Harvey, R.; Wall, E.C.; Kelly, G.; Hussain, S.; Howell, M.; Kassiotis, G.; Swanton, C.; Gandhi, S.; et al. Neutralising antibodies after COVID-19 vaccination in UK haemodialysis patients. Lancet 2021, 398, 1038–1041. [Google Scholar] [CrossRef]
- Clarke, C.L.; Martin, P.; Gleeson, S.; Thomson, T.; Edwards, H.; Mortimer, P.; McIntyre, S.; Deborah, J.; Cox, A.; Pickard, G.; et al. Comparison of immunogenicity between BNT162b2 and ChAdOx1 SARS-CoV-2 vaccines in a large haemodialysis population. medRxiv 2021. [Google Scholar]
- Hsu, C.M.; Weiner, D.E.; Manley, H.J.; Aweh, G.N.; Ladik, V.; Frament, J.; Miskulin, D.; Argyropoulos, C.; Abreo, K.; Chin, A.; et al. Seroresponse to SARS-CoV-2 Vaccines among Maintenance Dialysis Patients over 6 Months. Clin. J. Am. Soc. Nephrol. 2022, 17, 403–413. [Google Scholar] [CrossRef]
- Simon, B.; Rubey, H.; Treipl, A.; Gromann, M.; Hemedi, B.; Zehetmayer, S.; Kirsch, B. Haemodialysis patients show a highly diminished antibody response after COVID-19 mRNA vaccination compared with healthy controls. Nephrol. Dial. Transplant. 2021, 36, 1709–1716. [Google Scholar] [CrossRef]
- Schrezenmeier, E.; Bergfeld, L.; Hillus, D.; Lippert, J.D.; Weber, U.; Tober-Lau, P.; Landgraf, I.; Schwarz, T.; Kappert, K.; Stefanski, A.L.; et al. Immunogenicity of COVID-19 Tozinameran Vaccination in Patients on Chronic Dialysis. Front. Immunol. 2021, 12, 690698. [Google Scholar] [CrossRef]
- Manley, H.J.; Aweh, G.; Hsu, C.M.; Weiner, D.E.; Miskulin, D.; Harford, A.M.; Johnson, D.; Lacson, E.K. SARS-CoV-2 vaccine effectiveness and breakthrough infections in maintenance dialysis patients. medRxiv 2021. [Google Scholar] [CrossRef]
- El Karoui, K.; Hourmant, M.; Ayav, C.; Glowacki, F.; Couchoud, C.; Lapidus, N.; Registry, R. Vaccination and COVID-19 Dynamics in Dialysis Patients. Clin. J. Am. Soc. Nephrol. 2022, 17, 395–402. [Google Scholar] [CrossRef]
- Massry, S.G.; Coburn, J.W.; Chertow, G.M.; Hruska, K.; Langman, C.; Malluche, H.; Martin, K.; McCann, L.M.; McCarthy, J.T.; Moe, S.; et al. K/DOQI clinical practice guidelines for bone metabolism and disease in chronic kidney disease. Am. J. Kidney Dis. 2003, 42 (Suppl. 3), S1–S201. [Google Scholar]
- O’Neill, W.C. The fallacy of the calcium-phosphorus product. Kidney Int. 2007, 72, 792–796. [Google Scholar] [CrossRef] [PubMed] [Green Version]
- Kidney Disease: Improving Global Outcomes (KDIGO) CKD-MBD Work Group. KDIGO clinical practice guideline for the diagnosis, evaluation, prevention, and treatment of Chronic Kidney Disease-Mineral and Bone Disorder (CKD-MBD). Kidney Int. Suppl. 2009, 113, S1–S130. [Google Scholar]
- Vig, M.; Kinet, J.P. Calcium signaling in immune cells. Nat. Immunol. 2009, 10, 21–27. [Google Scholar] [CrossRef] [PubMed] [Green Version]
- Heyer, C.M.; Weiss, E.; Schmucker, S.; Rodehutscord, M.; Hoelzle, L.E.; Mosenthin, R.; Stefanski, V. The impact of phosphorus on the immune system and the intestinal microbiota with special focus on the pig. Nutr. Res. Rev. 2015, 28, 67–82. [Google Scholar] [CrossRef] [PubMed] [Green Version]
- Gotch, F.A.; Sargent, J.A. A mechanistic analysis of the National Cooperative Dialysis Study (NCDS). Kidney Int. 1985, 28, 526–534. [Google Scholar] [CrossRef] [PubMed] [Green Version]
- Hemodialysis Adequacy Work, G. Clinical practice guidelines for hemodialysis adequacy, update 2006. Am. J. Kidney Dis. 2006, 48 (Suppl. 1), S2–S90. [Google Scholar]
- Eknoyan, G.; Beck, G.J.; Cheung, A.K.; Daugirdas, J.T.; Greene, T.; Kusek, J.W.; Allon, M.; Bailey, J.; Delmez, J.A.; Depner, T.A.; et al. Effect of dialysis dose and membrane flux in maintenance hemodialysis. N. Engl. J. Med. 2002, 347, 2010–2019. [Google Scholar] [CrossRef]
- Espi, M.; Koppe, L.; Fouque, D.; Thaunat, O. Chronic Kidney Disease-Associated Immune Dysfunctions: Impact of Protein-Bound Uremic Retention Solutes on Immune Cells. Toxins 2020, 12, 300. [Google Scholar] [CrossRef]
- Sharif, M.R.; Chitsazian, Z.; Moosavian, M.; Raygan, F.; Nikoueinejad, H.; Sharif, A.R.; Einollahi, B. Immune disorders in hemodialysis patients. Iran J. Kidney Dis. 2015, 9, 84–96. [Google Scholar]
- Eleftheriadis, T.; Antoniadi, G.; Liakopoulos, V.; Kartsios, C.; Stefanidis, I. Disturbances of acquired immunity in hemodialysis patients. Semin. Dial. 2007, 20, 440–451. [Google Scholar] [CrossRef]
- Syed-Ahmed, M.; Narayanan, M. Immune Dysfunction and Risk of Infection in Chronic Kidney Disease. Adv. Chronic. Kidney Dis. 2019, 26, 8–15. [Google Scholar] [CrossRef] [PubMed]
- Pahl, M.V.; Gollapudi, S.; Sepassi, L.; Gollapudi, P.; Elahimehr, R.; Vaziri, N.D. Effect of end-stage renal disease on B-lymphocyte subpopulations, IL-7, BAFF and BAFF receptor expression. Nephrol. Dial. Transplant. 2010, 25, 205–212. [Google Scholar] [CrossRef]
- Hou, Y.C.; Lu, K.C.; Kuo, K.L. The Efficacy of COVID-19 Vaccines in Chronic Kidney Disease and Kidney Transplantation Patients: A Narrative Review. Vaccines 2021, 9, 885. [Google Scholar] [CrossRef] [PubMed]
- Kim, K.W.; Chung, B.H.; Jeon, E.J.; Kim, B.M.; Choi, B.S.; Park, C.W.; Kim, Y.S.; Cho, S.G.; Cho, M.L.; Yang, C.W. B cell-associated immune profiles in patients with end-stage renal disease (ESRD). Exp. Mol. Med. 2012, 44, 465–472. [Google Scholar] [CrossRef] [PubMed] [Green Version]
- Kovacic, V.; Sain, M.; Vukman, V. Efficient haemodialysis improves the response to hepatitis B virus vaccination. Intervirology 2002, 45, 172–176. [Google Scholar] [CrossRef] [PubMed]
- Udomkarnjananun, S.; Takkavatakarn, K.; Praditpornsilpa, K.; Nader, C.; Eiam-Ong, S.; Jaber, B.L.; Susantitaphong, P. Hepatitis B virus vaccine immune response and mortality in dialysis patients: A meta-analysis. J. Nephrol. 2020, 33, 343–354. [Google Scholar] [CrossRef] [PubMed]
- Morales-Nunez, J.J.; Munoz-Valle, J.F.; Torres-Hernandez, P.C.; Hernandez-Bello, J. Overview of Neutralizing Antibodies and Their Potential in COVID-19. Vaccines 2021, 9, 1376. [Google Scholar] [CrossRef]
- Morales-Nunez, J.J.; Munoz-Valle, J.F.; Meza-Lopez, C.; Wang, L.F.; Machado Sulbaran, A.C.; Torres-Hernandez, P.C.; Bedolla-Barajas, M.; la O-Gómez, D.; Balcazar-Felix, P.; Hernandez-Bello, J. Neutralizing Antibodies Titers and Side Effects in Response to BNT162b2 Vaccine in Healthcare Workers with and without Prior SARS-CoV-2 Infection. Vaccines 2021, 9, 742. [Google Scholar] [CrossRef]
- Folegatti, P.M.; Ewer, K.J.; Aley, P.K.; Angus, B.; Becker, S.; Belij-Rammerstorfer, S.; Bellamy, D.; Bibi, S.; Bittaye, M.; Clutterbuck, E.A.; et al. Safety and immunogenicity of the ChAdOx1 nCoV-19 vaccine against SARS-CoV-2: A preliminary report of a phase 1/2, single-blind, randomised controlled trial. Lancet 2020, 396, 467–478. [Google Scholar] [CrossRef]
- Rincon-Arevalo, H.; Choi, M.; Stefanski, A.L.; Halleck, F.; Weber, U.; Szelinski, F.; Jahrsdorfer, B.; Schrezenmeier, H.; Ludwig, C.; Sattler, A.; et al. Impaired humoral immunity to SARS-CoV-2 BNT162b2 vaccine in kidney transplant recipients and dialysis patients. Sci. Immunol. 2021, 6, eabj1031. [Google Scholar] [CrossRef]
- Chen, C.Y.; Ye, J.J.; Huang, T.S.; Lee, C.C.; Chen, Y.T.; Hsu, C.K.; Hsu, H.J.; Sun, C.Y.; Pan, H.C.; Chen, K.S.; et al. Effective Preventive Strategies to Prevent Secondary Transmission of COVID-19 in Hemodialysis Unit: The First Month of Community Outbreak in Taiwan. Healthcare 2021, 9, 1173. [Google Scholar] [CrossRef] [PubMed]
Publisher’s Note: MDPI stays neutral with regard to jurisdictional claims in published maps and institutional affiliations. |
© 2022 by the authors. Licensee MDPI, Basel, Switzerland. This article is an open access article distributed under the terms and conditions of the Creative Commons Attribution (CC BY) license (https://creativecommons.org/licenses/by/4.0/).