Author Contributions
Conceptualization, S.G.M.K., B.R.A., J.S.T. and C.C.B.; methodology, S.G.M.K., J.Z., B.R.A., T.K.S., C.G.A., A.J.S., C.C.B. and J.S.T.; formal analysis, S.G.M.K., C.C.B., B.R.A. and J.S.T.; writing—review and editing, S.G.M.K., J.Z., B.R.A., A.J.S., C.C.B. and J.S.T.; supervision, C.C.B. and J.S.T.; funding acquisition, C.C.B. and J.S.T. All authors have read and agreed to the published version of the manuscript.
Figure 1.
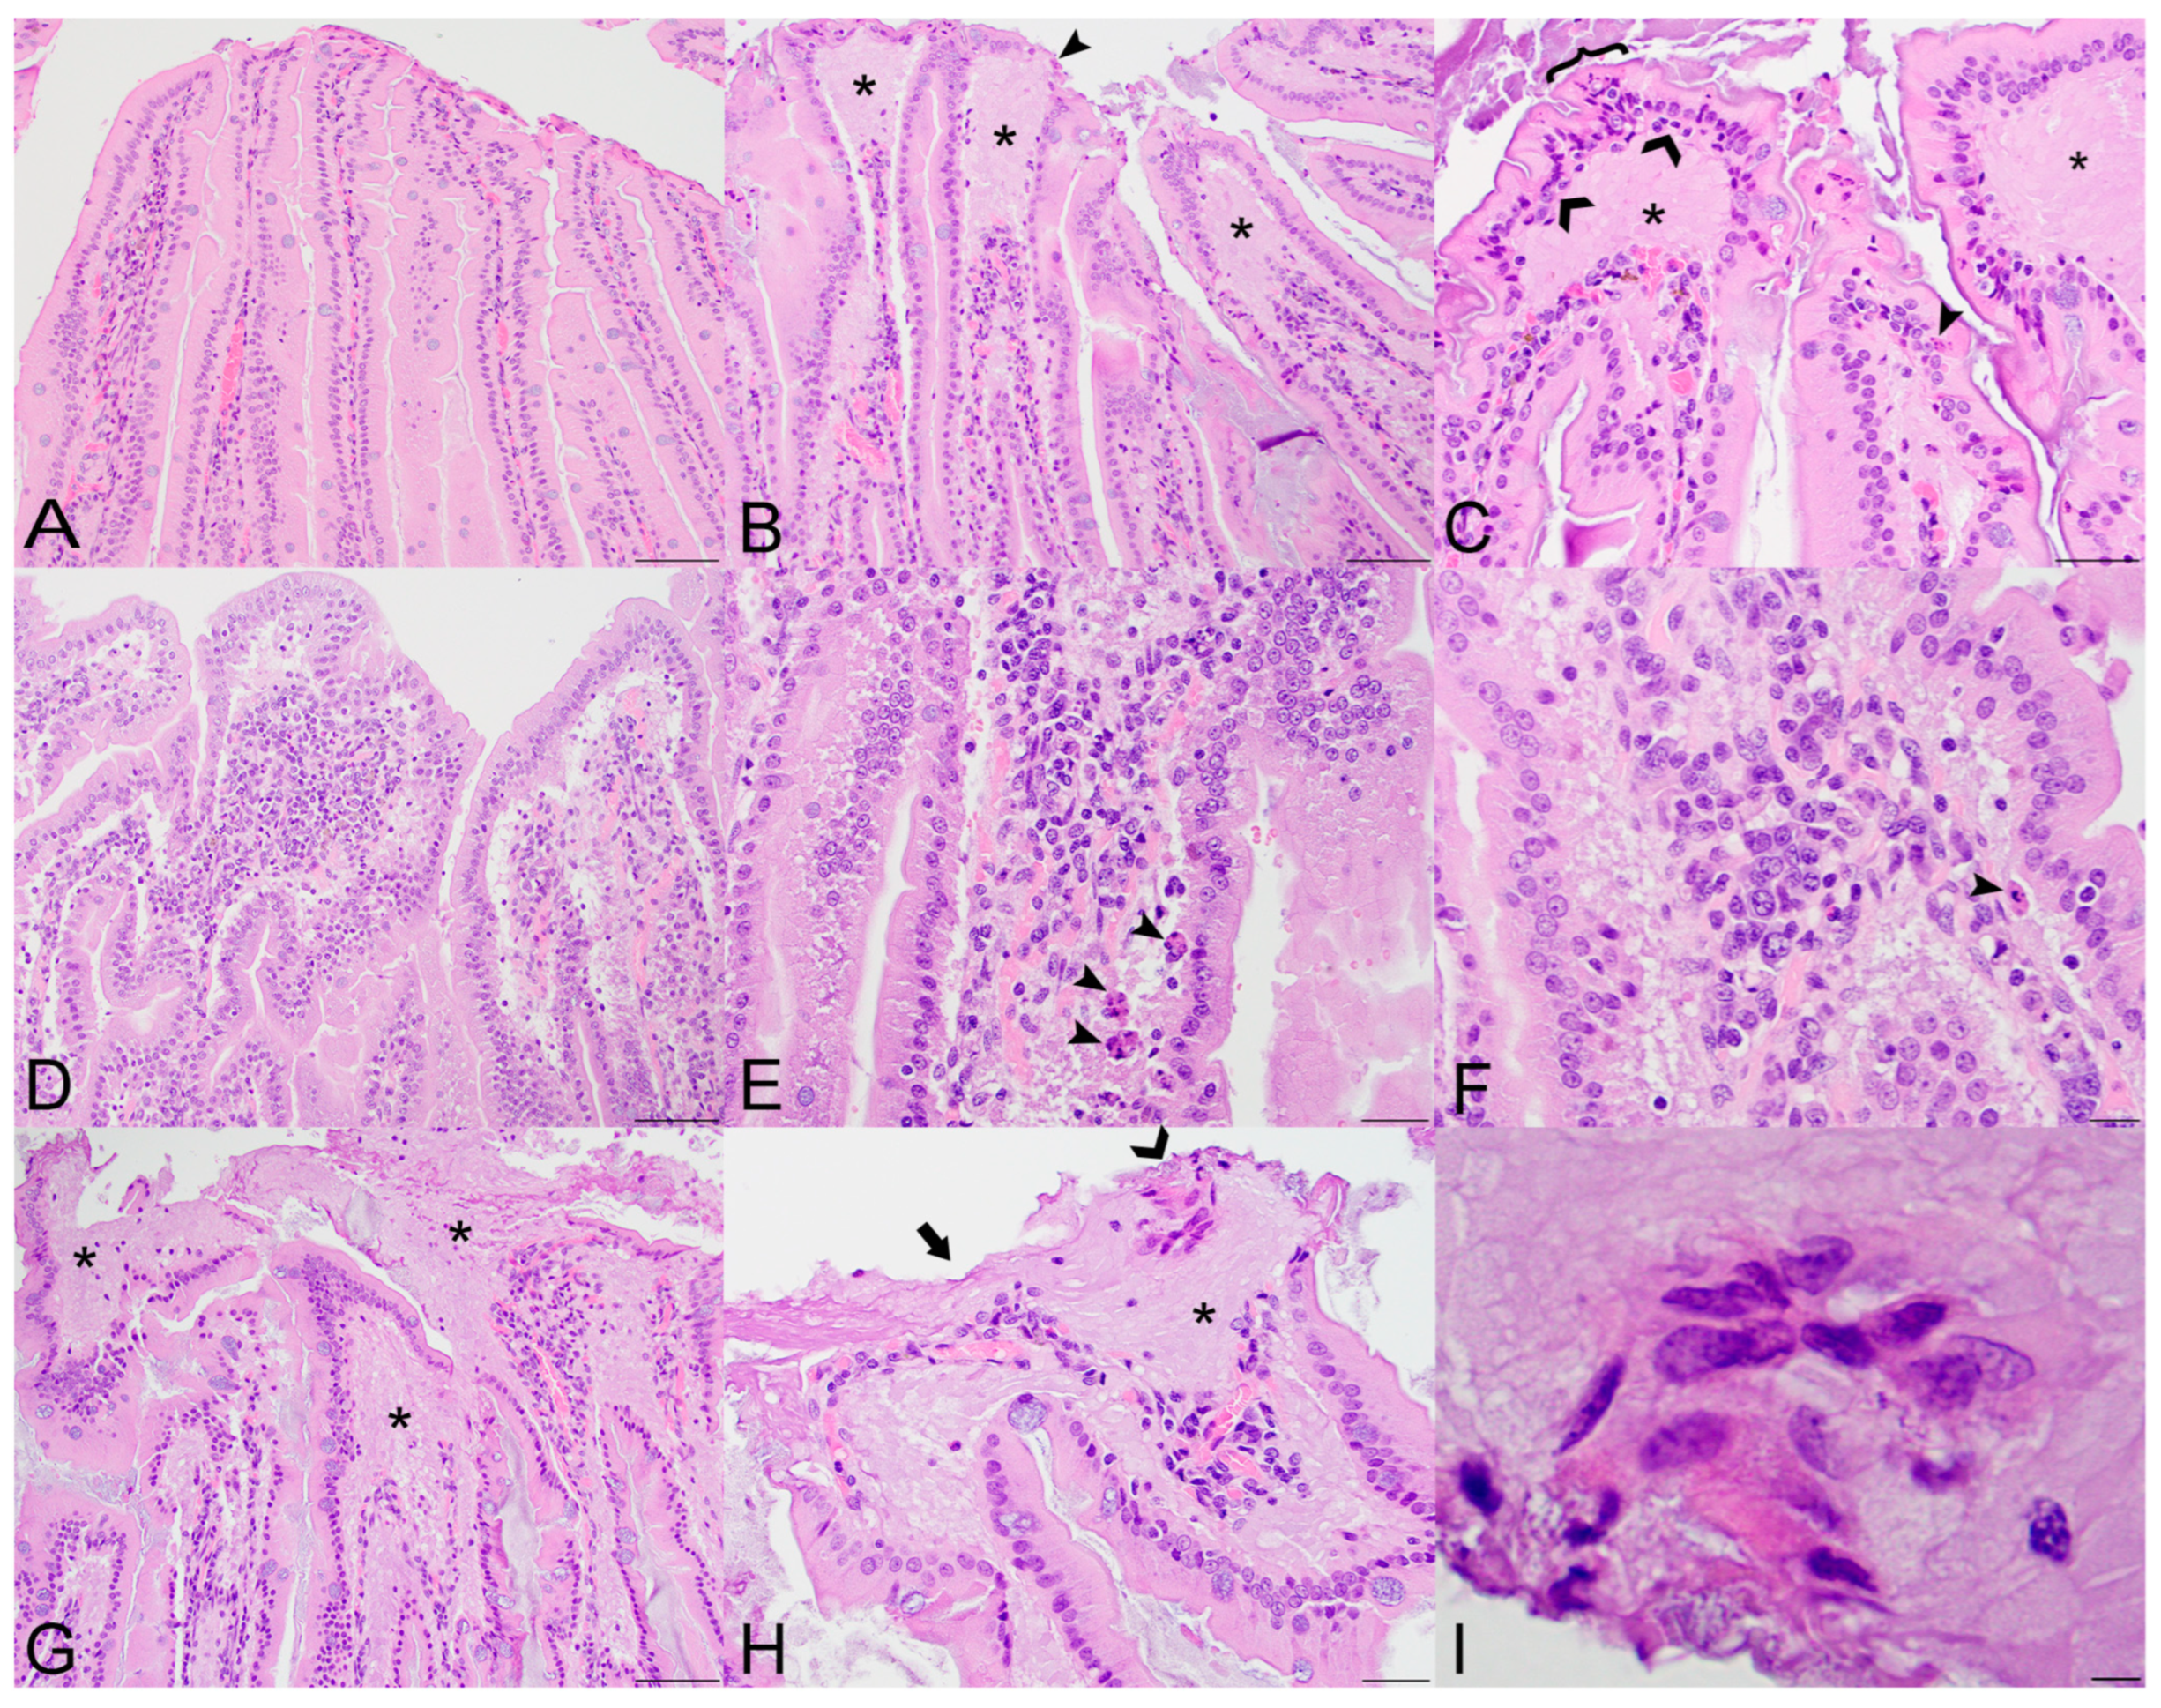
Histopathologic lesions in the small intestines of Sosuga virus (SOSV)-infected Egyptian rousette bats euthanized at 9 and 21 days post-inoculation (DPI). (A) Jejunum, control bat 290195. The intestinal villi are tall and slender with thin lamina propria cores. HE stain; original magnification = 200×; bar = 50 µm. (B) Jejunum, 9 DPI bat 287756. The villus tips are swollen with an accumulation of a paucicellular, eosinophilic fluid (*) that elevates the epithelium and compresses the lamina propria core. A villus tip is focally ulcerated (arrowhead). HE stain; original magnification = 200×; bar = 50 µm. (C) Jejunum, 9 DPI bat 287756. Enterocytes lining villus tips show a range of degenerative changes, including piling of nuclei, loss of cell borders and nuclear polarity ({) and nuclear fragmentation (closed arrowhead). Several mononuclear cells are present just beneath the epithelium (open arrowheads) and the lamina propria is expanded by eosinophilic fluid (*). HE stain; original magnification = 400×; bar = 20 µm. (D) Jejunum, 9 DPI bat 287014. The villi are multifocally fused and the lamina propria is congested and mildly hypercellular. HE stain; original magnification = 200×; bar = 50 µm. (E) Jejunum, 9 DPI bat 287014. The hypercellular lamina propria contains numerous tingible body macrophages beneath the epithelium (arrowheads). Inset: higher magnification of a tingible body macrophage from another but similarly affected villus showing phagocytosed cellular and nuclear debris. HE stains; original magnifications = 400×; bar = 20 µm. (F) Jejunum, 9 DPI bat 287014. Higher magnification image of the same bat demonstrating a congested and mildly hypercellular lamina propria containing a mixed inflammatory cell population composed of rounded to elongate macrophages with abundant cytoplasm, lymphocytes, and rare eosinophils and plasma cells. HE stain; original magnification = 600×; bar = 20 µm. (G) Duodenum, 21 DPI bat 287953. The villus tips are obscured by large ulcerations, accumulated eosinophilic fluid in the lamina propria (*) and multifocal villus fusion. Eosinophilic fluid spills into the lumen at the top of the image (*). HE stain; original magnification = 200×; bar = 50 µm. (H) Duodenum, 21 DPI bat 287953. The villus tip is folded over and has a focally extensive area of ulceration (arrow). At the top right of the image, a raft of syncytial epithelial cells (open arrowhead) is surrounded by eosinophilic fluid. HE stain; original magnification = 400×; bar = 20 µm. (I) Duodenum, 21 DPI bat 287953. High magnification image of the epithelial cell syncytium showing hypereosinophilic granular cytoplasm and karyolytic or pyknotic nuclei. HE stain; original magnification = 1000×; bar = 10 µm.
Figure 1.
Histopathologic lesions in the small intestines of Sosuga virus (SOSV)-infected Egyptian rousette bats euthanized at 9 and 21 days post-inoculation (DPI). (A) Jejunum, control bat 290195. The intestinal villi are tall and slender with thin lamina propria cores. HE stain; original magnification = 200×; bar = 50 µm. (B) Jejunum, 9 DPI bat 287756. The villus tips are swollen with an accumulation of a paucicellular, eosinophilic fluid (*) that elevates the epithelium and compresses the lamina propria core. A villus tip is focally ulcerated (arrowhead). HE stain; original magnification = 200×; bar = 50 µm. (C) Jejunum, 9 DPI bat 287756. Enterocytes lining villus tips show a range of degenerative changes, including piling of nuclei, loss of cell borders and nuclear polarity ({) and nuclear fragmentation (closed arrowhead). Several mononuclear cells are present just beneath the epithelium (open arrowheads) and the lamina propria is expanded by eosinophilic fluid (*). HE stain; original magnification = 400×; bar = 20 µm. (D) Jejunum, 9 DPI bat 287014. The villi are multifocally fused and the lamina propria is congested and mildly hypercellular. HE stain; original magnification = 200×; bar = 50 µm. (E) Jejunum, 9 DPI bat 287014. The hypercellular lamina propria contains numerous tingible body macrophages beneath the epithelium (arrowheads). Inset: higher magnification of a tingible body macrophage from another but similarly affected villus showing phagocytosed cellular and nuclear debris. HE stains; original magnifications = 400×; bar = 20 µm. (F) Jejunum, 9 DPI bat 287014. Higher magnification image of the same bat demonstrating a congested and mildly hypercellular lamina propria containing a mixed inflammatory cell population composed of rounded to elongate macrophages with abundant cytoplasm, lymphocytes, and rare eosinophils and plasma cells. HE stain; original magnification = 600×; bar = 20 µm. (G) Duodenum, 21 DPI bat 287953. The villus tips are obscured by large ulcerations, accumulated eosinophilic fluid in the lamina propria (*) and multifocal villus fusion. Eosinophilic fluid spills into the lumen at the top of the image (*). HE stain; original magnification = 200×; bar = 50 µm. (H) Duodenum, 21 DPI bat 287953. The villus tip is folded over and has a focally extensive area of ulceration (arrow). At the top right of the image, a raft of syncytial epithelial cells (open arrowhead) is surrounded by eosinophilic fluid. HE stain; original magnification = 400×; bar = 20 µm. (I) Duodenum, 21 DPI bat 287953. High magnification image of the epithelial cell syncytium showing hypereosinophilic granular cytoplasm and karyolytic or pyknotic nuclei. HE stain; original magnification = 1000×; bar = 10 µm.
![Viruses 14 01278 g001]()
Figure 2.
Histopathologic lesions in the salivary glands of SOSV-infected Egyptian rousette bats euthanized at 6, 9 and 21 DPI. (A) Salivary gland, control bat 290195. A normal interlobular duct is 1–3 cell layers thick and contains very low numbers of intraepithelial and peri-ductular resident immune cells. HE stain; original magnification = 400×; bar = 20 µm. (B) Salivary gland, 6 DPI bat 284899. Acute sialodochitis characterized by a robust infiltrate of mononuclear and granulocytic inflammatory cells that expands the duct wall and surrounding connective tissue. Granulocytic cells, mononuclear cells and cellular debris fill and partially occlude the duct lumen. Inset: The luminal aspect of a different, but similarly affected duct contains an epithelial syncytium and several granulocytes. HE stains; original magnifications = 400× (main image; bar = 20 µm) and 1000× (inset; bar = 10 µm). This bat was qRT-PCR positive for SOSV in the salivary gland at necropsy and had SOSV RNA in the oral swabs on days 5 and 6 PI. (C) Salivary gland, 9 DPI bat 287014. The duct is multifocally infiltrated by low numbers of mononuclear and granulocytic cells. The lumen contains low numbers of neutrophils and a binucleated cell with abundant granular cytoplasm (suspected syncytium) (arrowhead). HE stain; original magnification = 400×; bar = 20 µm. (D) Salivary gland, 21 DPI bat 289338. An interlobular duct is focally infiltrated and expanded by a mixture of mononuclear and granulocytic inflammatory cells. Bottom left inset: The wall of a smaller but similarly affected duct contains an apoptotic body that is shrunken and rounded with distinct cell borders and a pyknotic nucleus (arrowhead). HE stains; original magnifications = 400× (main image; bar = 20 µm) and 1000× (inset; bar = 10 µm). Top left inset: An apoptotic body in the wall of the same duct as the lower left inset has diffuse, moderate cytoplasmic immunoreactivity for cleaved caspase 3 (arrowhead). Immunohistochemical stain with 3-3′-Diaminobenzidine (DAB; brown) chromogen to visualize cleaved caspase 3 antigen and hematoxylin counterstain. Original magnification = 600×; bar = 20 µm. (E) Salivary gland, 21 DPI bat 290040. Low magnification image of salivary gland acinar tissue showing multiple foci of mononuclear cells which expand the interstitium and focally obscure the acini (arrowhead). HE stain; original magnification = 200×; bar = 50 µm. (F) Salivary gland, same 21 DPI bat as previous image. Higher magnification of one hypercellular focus showing interstitial expansion with numerous mononuclear inflammatory cells. One intralobular duct epithelial cell exhibits cytoplasmic swelling, peripheralization of nuclear material and accumulation of eosinophilic material within the nucleus suggestive of intranuclear inclusion material (arrowhead). HE stain; original magnification = 400×; bar = 20 µm.
![Viruses 14 01278 g002]()
Figure 3.
Histopathologic lesion scores in the small intestines and salivary glands of SOSV-infected Egyptian rousette bats. Individual groups are represented on the x axis and each dot represents the score for a single bat. Bars represent the mean and lines represent the ±95% confidence interval. Control bats were euthanized at 21 DPI. (A) Criteria used to generate a composite small intestine lesion score for each bat included: villus epithelial discontinuity or ulceration, accumulation of eosinophilic fluid in the lamina propria, hypercellularity of the lamina propria, epithelial cell apoptosis and/or tingible body macrophages in the lamina propria and villus fusion. (B) Salivary gland scores were positively correlated with time. Criteria used to generate a composite salivary gland lesion score for each bat included: sialodochitis, sialadenitis, duct epithelial cell apoptosis and epithelial syncytia.
Figure 4.
Immunohistochemical localization of SOSV nucleoprotein (NP) antigen in experimentally infected Egyptian rousette bats euthanized at 6, 9 or 21 DPI. (A) Small intestines, 21 DPI bat 289953. Granular, intracytoplasmic NP antigen is present within the villus lamina propria core and within the lumen (arrowheads). Immunohistochemical stain with Fast Red chromogen and hematoxylin counterstain; original magnification = 400×. (B) Salivary gland, 6 DPI bat 284899. Multifocal cytoplasmic immunolabeling for NP antigen within the wall of an inflamed interlobular salivary duct (arrowhead). Immunohistochemical stain with Fast Red chromogen and hematoxylin counterstain; original magnification = 400×. (C) Axillary lymph node, 6 DPI bat 284509. Viral nucleoprotein antigen (arrowheads) is present within the cytoplasm of histiocytic cells in the cortical germinal centers and in the paracortical regions (arrowheads and inset). Immunohistochemical stain with Fast Red chromogen and hematoxylin counterstain; original magnifications = 200× (main image) and 600× (inset). (D) Spleen, 9 DPI bat 287014. NP antigen (arrowheads) is present within the cytoplasm of few histiocytic cells in the red pulp. Immunohistochemical stain with Fast Red chromogen and hematoxylin counterstain; original magnification = 600×.
![Viruses 14 01278 g004]()
Figure 5.
Iba1+ pixel percentages and CD3+ cell counts obtained by immunohistochemistry and whole-slide digital image analyses of the small intestines and salivary glands from SOSV-infected Egyptian rousette bats. Individual groups are represented on the x axis and each dot represents the score for a single bat. Bars represent the mean and lines represent the ±95% confidence interval. Control bats were euthanized at 21 DPI. (A) Percentage of Iba1-immunopositive pixels in the small intestines. (B) Number of CD3-immunopositive cells in the small intestines per mm2 tissue. (C) Percentage of Iba1-immunopositive pixels in the small intestines. The Iba1% positive pixel count was significantly increased in the salivary glands of SOSV-infected bats at 21 DPI relative to the controls (*). (D) Number of CD3-immunopositive cells in the small intestines per mm2 tissue.
Figure 6.
Distribution of Iba1- and CD3-immunolabeled cells in the small intestines of SOSV-infected Egyptian rousette bats euthanized at 9 and 21 DPI. (A) Iba1 immunohistochemistry (IHC), jejunum, control bat 290195. Iba1-immunolabeled cells (brown) are present in moderate numbers throughout the lamina propria core of the small intestinal villi. Original magnification = 200×. (B) Iba1 IHC, jejunum, 9 DPI bat 287756. Moderate numbers of Iba1-immunolabeled cells are present within the lamina propria core, occasionally in small clusters (arrow). Low numbers of Iba1+ cells with an amoeboid morphology are scattered within the lamina propria fluid and just beneath the epithelium at the villus tip (arrowheads). The small intestines of this bat had the highest viral load of all tissues tested during the serial sacrifice study. Original magnification = 200×. (C) Iba1 IHC, jejunum, 21 DPI bat 289953. The villus core and lamina propria contain moderate numbers of Iba1+ cells, occasionally clumped in small aggregates (arrows). Several villus tips have epithelial defects through which fluid spills from the lamina propria into the lumen. This luminal fluid contains several Iba1+ cells (open arrowheads). Inset: Higher magnification image demonstrating the amoeboid phenotype of macrophages present within the lamina propria fluid. This bat intermittently shed SOSV in the feces throughout the duration of the serial euthanasia study. Original magnifications = 100× (main image) and 600× (inset). (D) CD3 IHC, jejunum, control bat 290195. Low numbers of CD3+ cells (brown) are scattered throughout the epithelium. Rare CD3+ cells are present within the lamina propria core. Original magnification = 400×. (E) CD3 IHC, jejunum, 9 DPI bat 287756. Low numbers of CD3+ cells are scattered throughout the intestinal epithelium and occasionally present within the lamina propria fluid. Slightly increased CD3+ cells are present within the lamina propria core compared to the control. Original magnification = 400×. (F) CD3 IHC, jejunum, 21 DPI bat 289953. Scattered CD3+ cells are present just beneath the intestinal epithelium and within the lamina propria fluid. Slightly increased numbers of CD3+ cells are distributed throughout the lamina propria core compared to the control. Original magnification = 400×. All immunohistochemical stains were performed using 3-3′-Diaminobenzidine (DAB; brown) chromogen to visualize cellular antigen and hematoxylin counterstain.
![Viruses 14 01278 g006]()
Figure 7.
Distribution of Iba1- and CD3-immunolabeled cells in the salivary glands of SOSV-infected Egyptian rousette bats euthanized at 6, 9 and 21 DPI. (A) Iba1 immunohistochemistry (IHC), salivary gland, control bat 290195. Low numbers of Iba1+ cells (brown) are present within the salivary duct and surrounding connective tissue. Original magnification = 400× (B) Iba1 IHC, salivary gland, 6 DPI bat 284899. Numerous Iba1+ cells morphologically consistent with macrophages or dendritic cells infiltrate the salivary gland duct epithelium and expand the adjacent connective tissues. Original magnification = 400×. (C) Iba1 IHC, 9 DPI bat 287014. A small cluster of Iba1+ cells (open arrowhead) is present within a hyperplastic salivary duct. This bat had mild eosinophilic and neutrophilic sialodochitis, scattered apoptotic ductular epithelial cells and an epithelial syncytium. Original magnification = 350×. (D) Iba1 IHC 21 DPI bat 289338. Increased numbers of Iba1+ cells are distributed throughout a salivary duct, and multifocally in small clusters (open arrowhead). This bat had moderate eosinophilic sialodochitis, sialoadenitis and numerous apoptotic cells within interlobular ducts. Original magnification = 200×. (E) CD3 IHC, salivary gland, control bat 290195. Rare CD3+ cells (brown) are present within the salivary duct and surrounding connective tissue. Original magnification = 400×. (F) CD3 IHC, salivary gland, 6 DPI bat 284899. Moderate numbers of CD3+ cells infiltrate the periductular connective tissues. Original magnification = 400×. (G) CD3 IHC, 9 DPI bat 287014. Very low numbers of CD3+ cells surround an interlobular duct. Original magnification = 350×. (H) CD3 IHC 21 DPI bat 289338. Mild to moderate numbers of CD3+ cells surround and infiltrate an affected salivary duct. This bat had moderate eosinophilic sialodochitis, sialoadenitis and numerous apoptotic cells within interlobular ducts. Original magnification = 200x. (I) Iba1 IHC, 21 DPI bat 289338. Low magnification image demonstrating widespread Iba1+ immunolabeling and aggregation of these cells within interlobular ducts (open arrowheads). Iba1+ cells also form loose aggregates multifocally within the interstitium (closed arrowheads), where they separate, surround and interdigitate with acinar and intralobular duct epithelial cells (inset is higher magnification of boxed region). Original magnifications = 80× (main image) and 300× (inset). (J) CD3 IHC 21 DPI bat 289338. Low magnification image demonstrating loose aggregates of CD3+ cells distributed multifocally throughout the interstitium (arrowheads), where they separate, surround and infiltrate intralobular ducts (inset is higher magnification of boxed region). Original magnifications = 80× (main image) and 300× (inset). All immunohistochemical stains were performed using 3-3′-Diaminobenzidine (DAB; brown) chromogen to visualize cellular antigen and hematoxylin counterstain.
![Viruses 14 01278 g007]()
Table 1.
Distribution of Sosuga virus nucleoprotein antigen in selected tissues from SOSV-infected Egyptian rousette bats euthanized at 3, 6, 9 and 21 DPI.
Table 1.
Distribution of Sosuga virus nucleoprotein antigen in selected tissues from SOSV-infected Egyptian rousette bats euthanized at 3, 6, 9 and 21 DPI.
| DPI | Bat ID | Small Intestines | Salivary Gland | AxLN | Spleen | Large Intestinal GALT |
|---|
| 3 | 283936 | NP | - | + | - | NP |
| 284049 | - | - | + | - | - |
| 284459 | - | - | - | - | - |
| 6 | 284509 | - | - | ++ | - | - |
| 284899 | + | + | + | ++ | - |
| 285146 | - | - | - | - | - |
| 9 | 287014 | - | - | - | - | - |
| 287253 | - | - | - | + | - |
| 287756 | + | - | + | + | + |
| 21 | 289338 | - | + | - | - | - |
| 289953 * | + | - | + | + | + |
| 290040 | - | - | + | - | - |
| Control | 290195 | - | - | NP | NP | - |
| 290494 | - | - | - | - | - |
| 290631 | - | - | - | - | - |


 ,
, 


