
Molecular Imaging of ACE2 Expression in Infectious Disease and Cancer
 and
and
Abstract
:1. Introduction
2. Background on COVID-19
3. Fluorescent Imaging
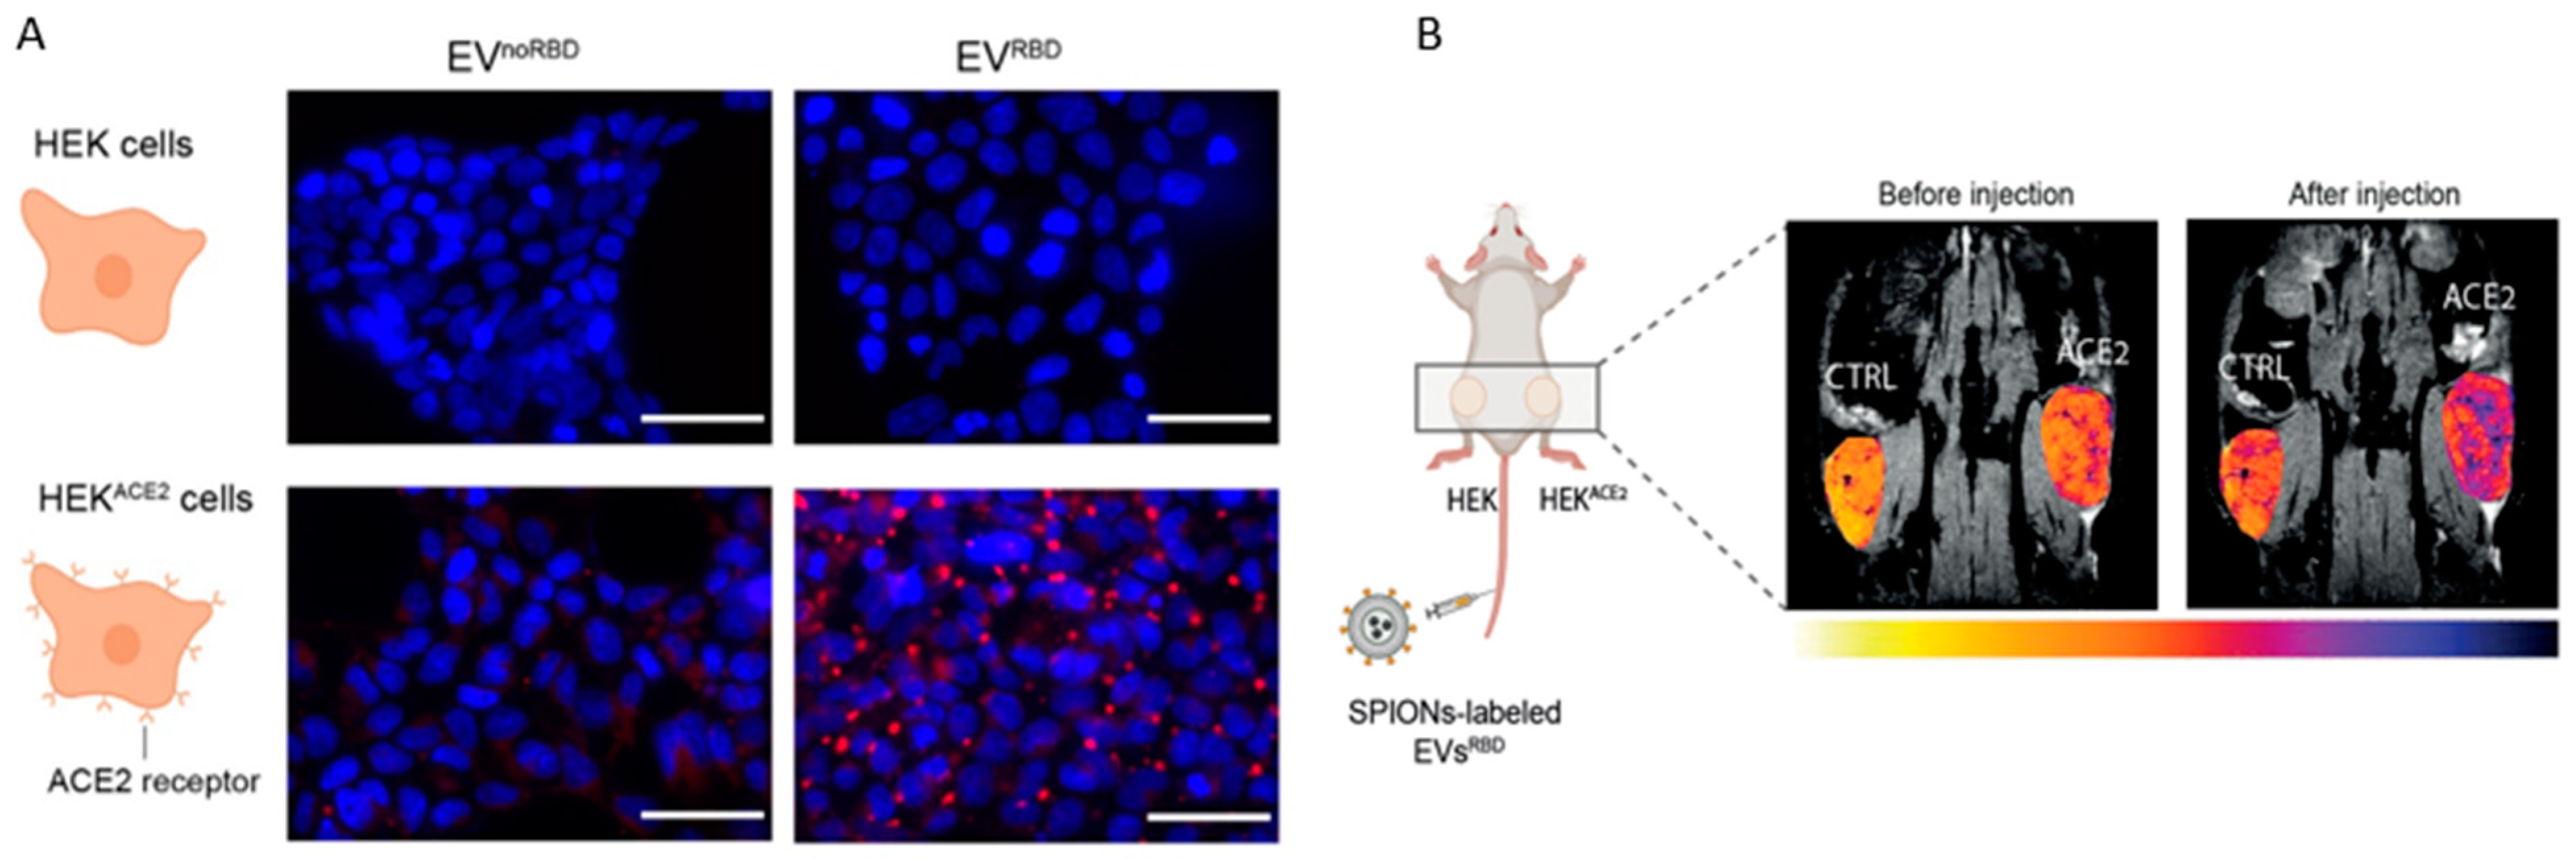
4. MR Imaging
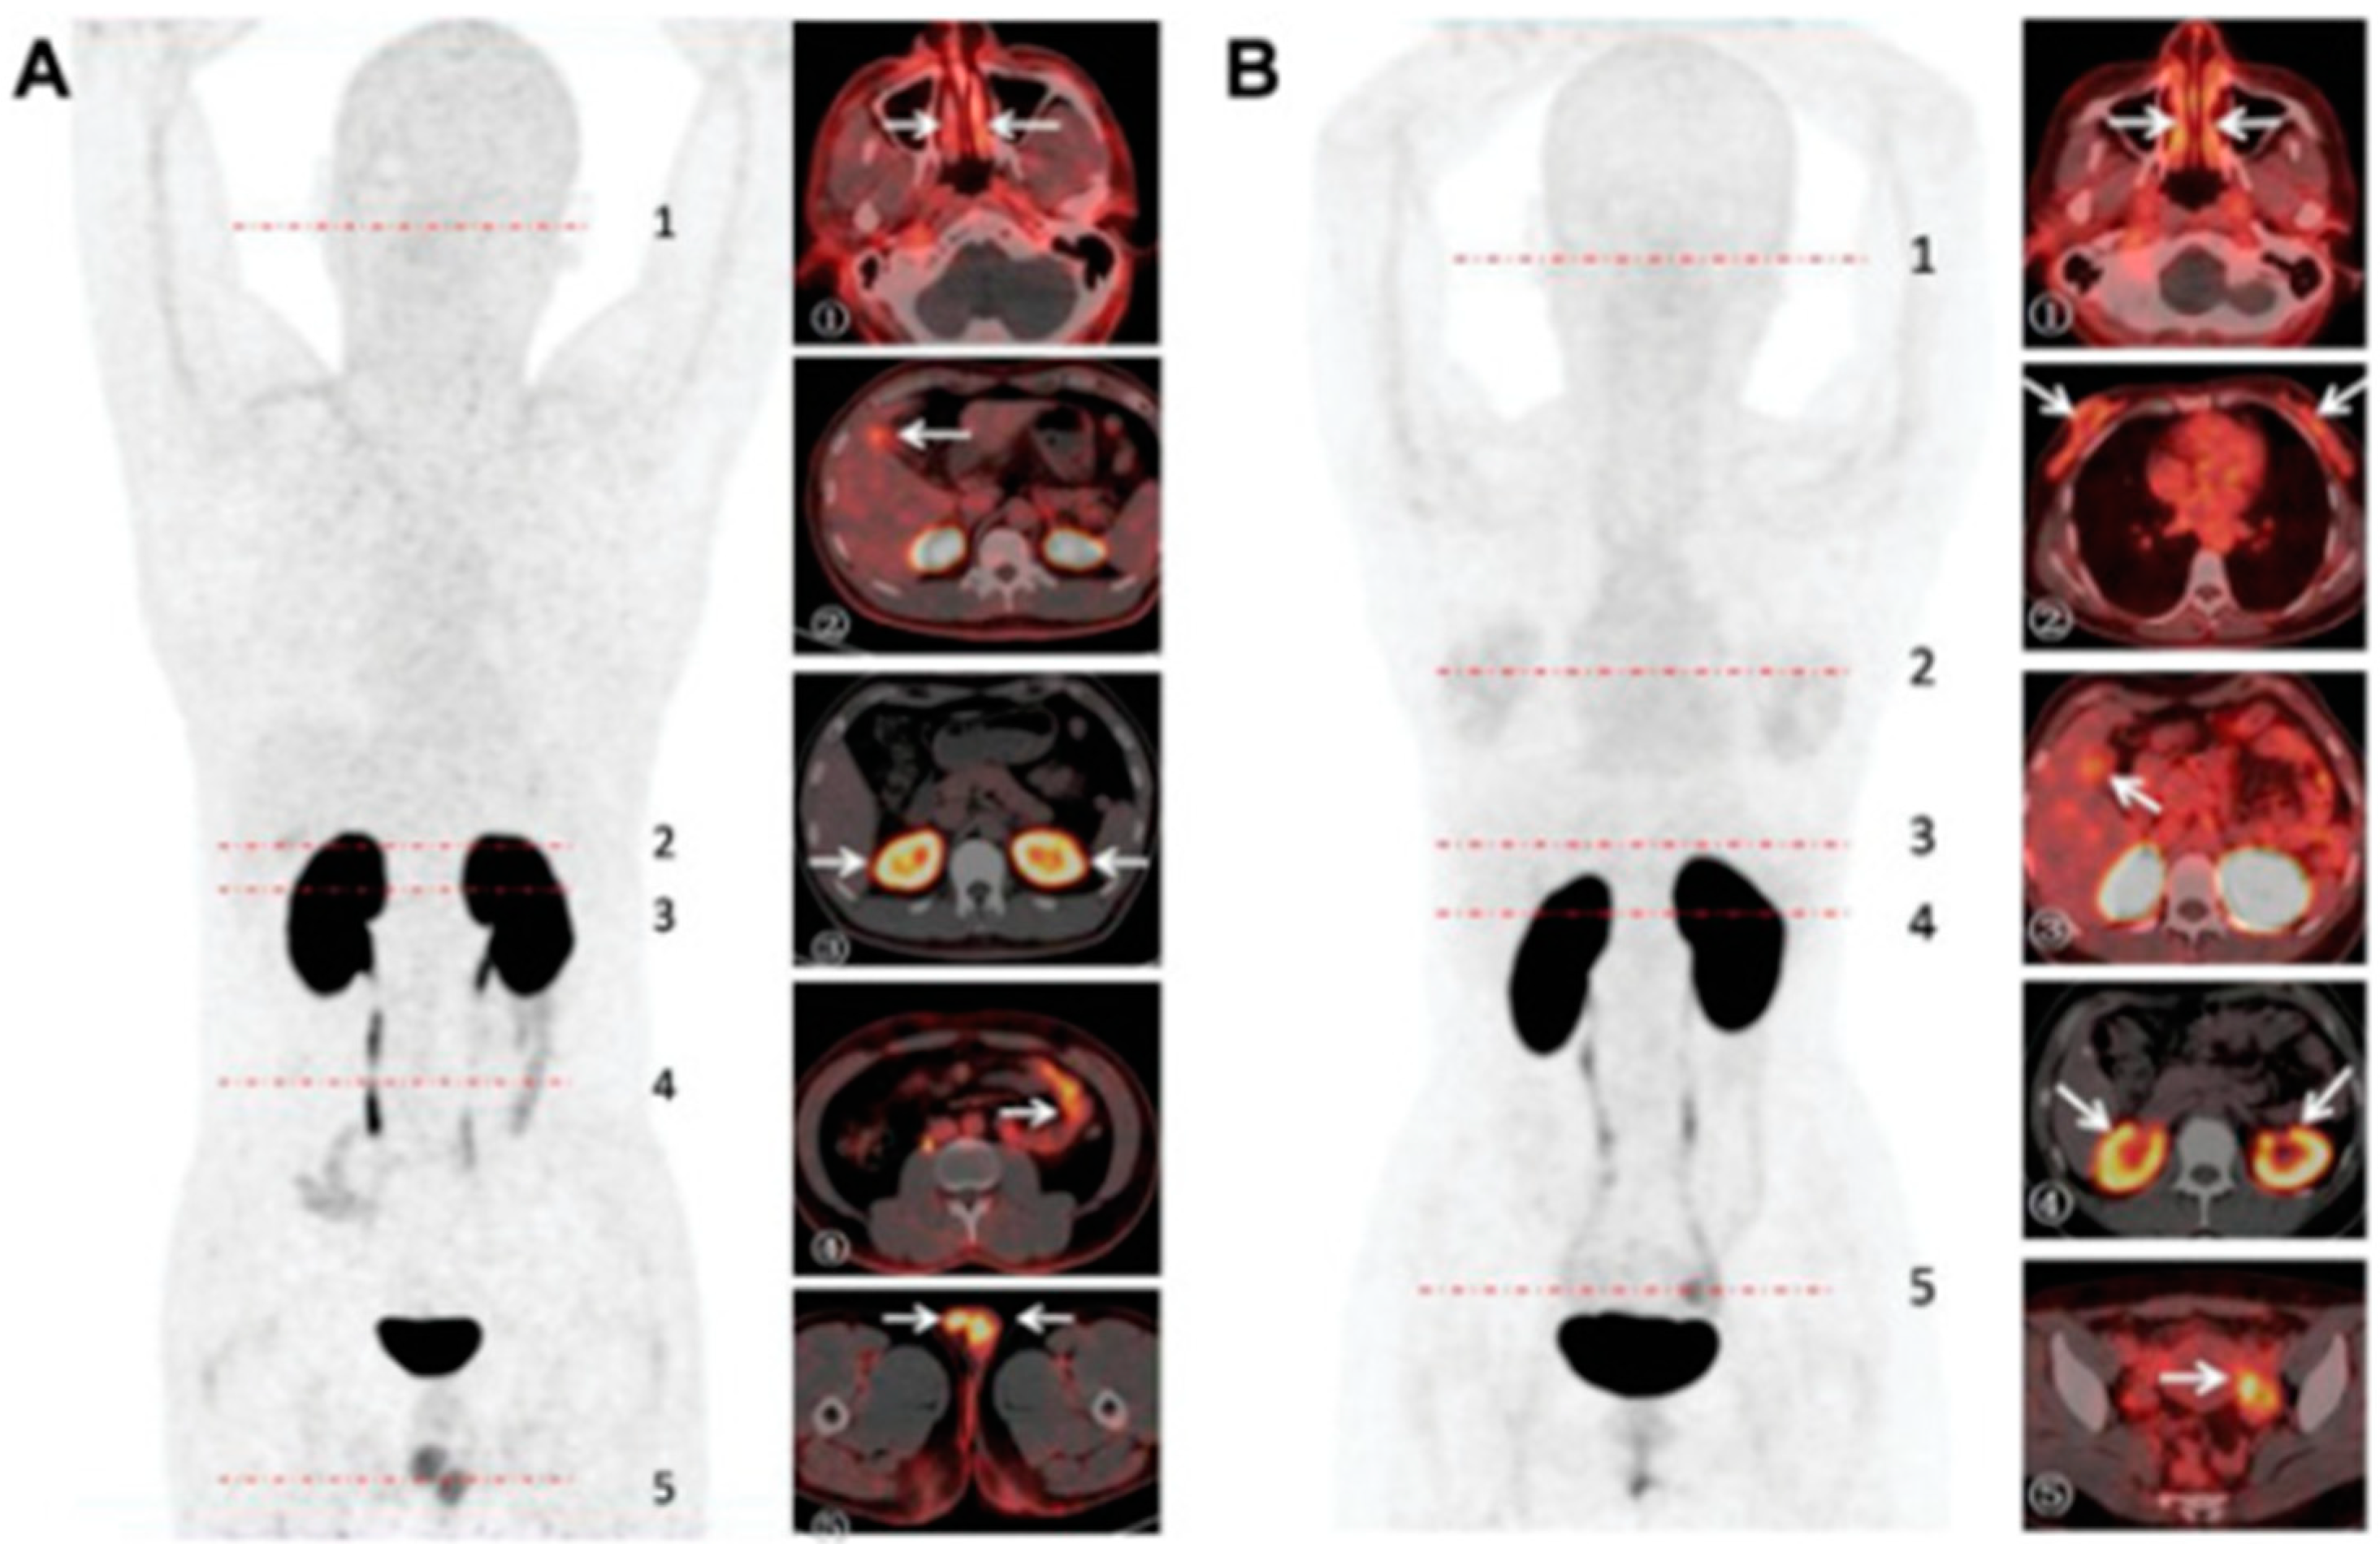
5. Nuclear Medicine
5.1. Introduction to Nuclear Imaging
5.2. ACE2 Imaging with DX600
5.3. ACE2 Imaging with RBD
5.4. Nuclear Imaging Shortcomings
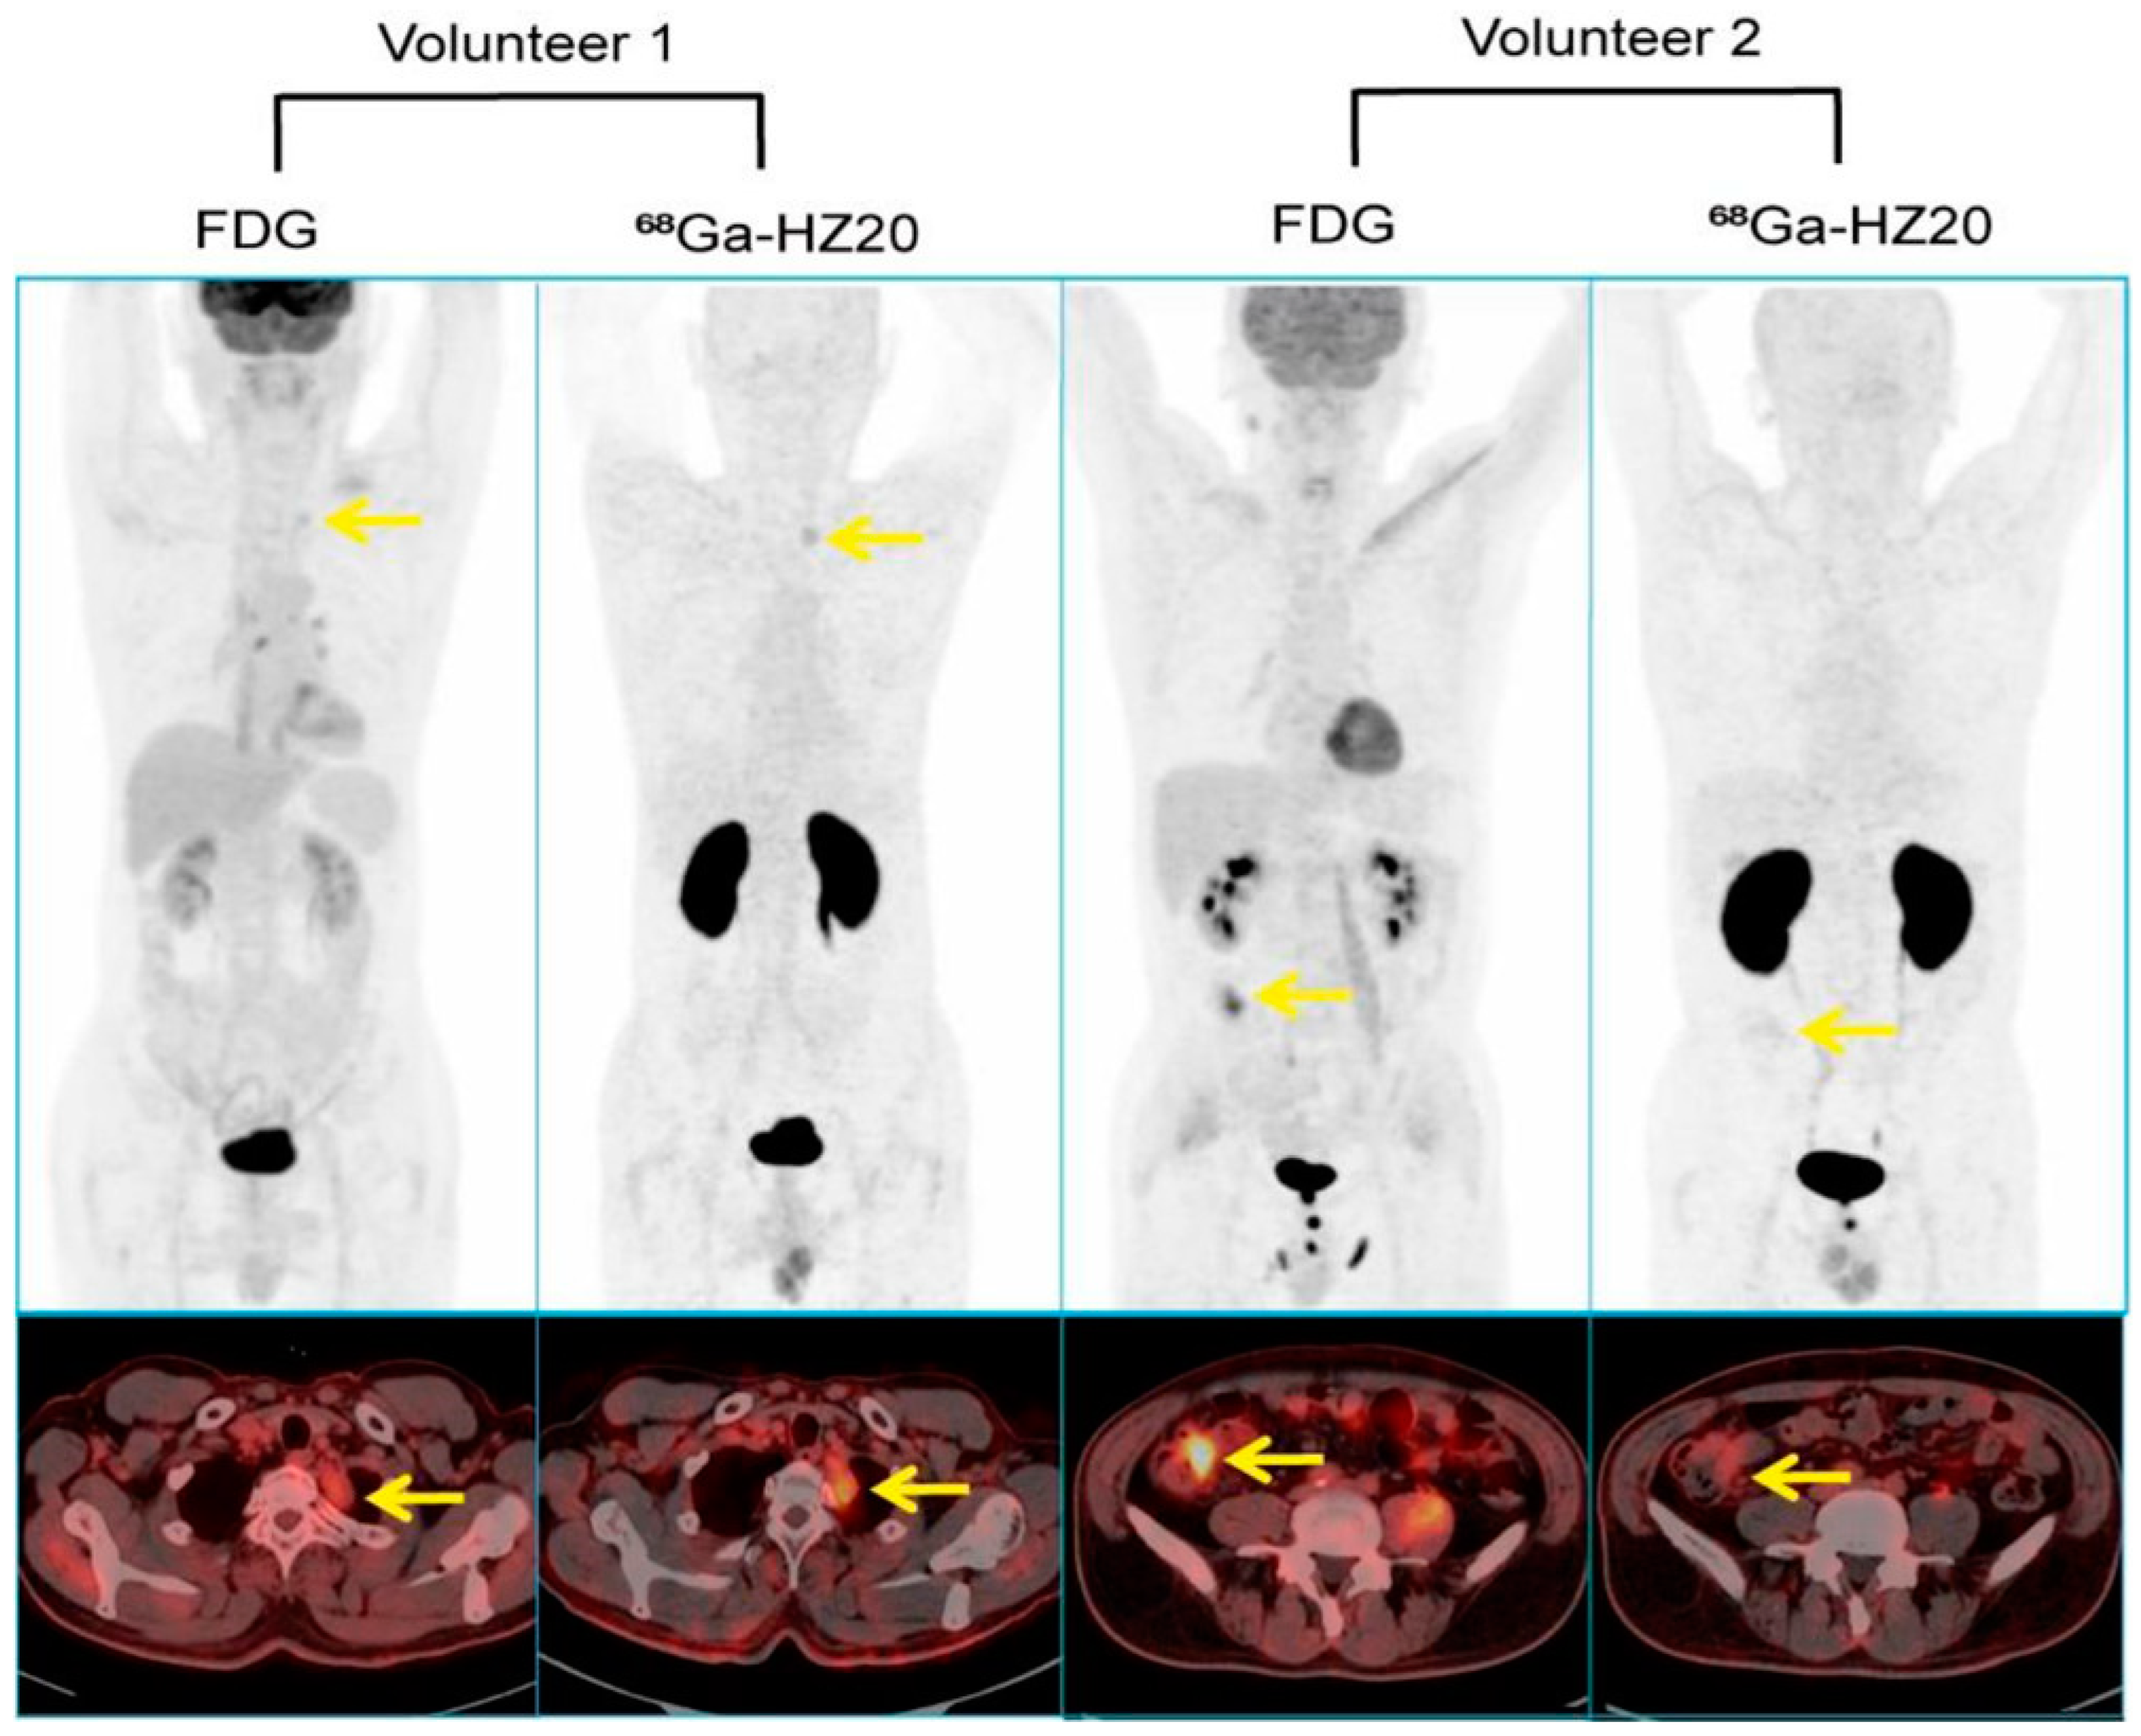
6. ACE2 Imaging in Cancerous Tissues
7. ACE2 Imaging in Liver Disease
8. Conclusions
Author Contributions
Funding
Institutional Review Board Statement
Informed Consent Statement
Data Availability Statement
Conflicts of Interest
References
- Tyrankiewicz, U.; Olkowicz, M.; Skorka, T.; Jablonska, M.; Orzylowska, A.; Bar, A.; Gonet, M.; Berkowicz, P.; Jasinski, K.; Zoladz, J.A.; et al. Activation pattern of ACE2/Ang-(1-7) and ACE/Ang II pathway in course of heart failure assessed by multiparametric MRI in vivo in Tgalphaq*44 mice. J. Appl. Physiol. 1985, 124, 52–65. [Google Scholar] [CrossRef]
- Bosso, M.; Thanaraj, T.A.; Abu-Farha, M.; Alanbaei, M.; Abubaker, J.; Al-Mulla, F. The Two Faces of ACE2: The Role of ACE2 Receptor and Its Polymorphisms in Hypertension and COVID-19. Mol. Ther. Methods Clin. Dev. 2020, 18, 321–327. [Google Scholar] [CrossRef] [PubMed]
- Cascella, M.; Rajnik, M.; Aleem, A.; Dulebohn, S.C.; Di Napoli, R. Features, Evaluation, and Treatment of Coronavirus (COVID-19); StatPearls: Treasure Island, FL, USA, 2023. [Google Scholar]
- Bao, L.; Deng, W.; Huang, B.; Gao, H.; Liu, J.; Ren, L.; Wei, Q.; Yu, P.; Xu, Y.; Qi, F.; et al. The pathogenicity of SARS-CoV-2 in hACE2 transgenic mice. Nature 2020, 583, 830–833. [Google Scholar] [CrossRef]
- Sun, S.-H.; Chen, Q.; Gu, H.-J.; Yang, G.; Wang, Y.-X.; Huang, X.-Y.; Liu, S.S.; Zhang, N.N.; Li, X.F.; Xiong, R.; et al. A Mouse Model of SARS-CoV-2 Infection and Pathogenesis. Cell Host Microbe 2020, 28, 124–133.e4. [Google Scholar] [CrossRef] [PubMed]
- Chai, P.; Yu, J.; Ge, S.; Jia, R.; Fan, X. Genetic alteration, RNA expression, and DNA methylation profiling of coronavirus disease 2019 (COVID-19) receptor ACE2 in malignancies: A pan-cancer analysis. J. Hematol. Oncol. 2020, 13, 43. [Google Scholar] [CrossRef] [PubMed]
- Stevens, J.P.; Kolachala, V.L.; Joshi, G.N.; Nagpal, S.; Gibson, G.; Gupta, N.A. Angiotensin-converting Enzyme-2 (ACE2) Expression in Pediatric Liver Disease. Appl. Immunohistochem. Mol. Morphol. 2022, 30, 647–653. [Google Scholar] [CrossRef]
- Huang, Y.; Yang, C.; Xu, X.F.; Xu, W.; Liu, S.W. Structural and functional properties of SARS-CoV-2 spike protein: Potential antivirus drug development for COVID-19. Acta Pharmacol. Sin. 2020, 41, 1141–1149. [Google Scholar] [CrossRef]
- Ahmad, I.; Pawara, R.; Surana, S.; Patel, H. The Repurposed ACE2 Inhibitors: SARS-CoV-2 Entry Blockers of COVID-19. Top. Curr. Chem. 2021, 379, 40. [Google Scholar] [CrossRef]
- Ghaith, M.M.; Albanghali, M.A.; Aldairi, A.F.; Iqbal, M.S.; Almaimani, R.A.; AlQuthami, K.; Alqasmi, M.H.; Almaimani, W.; El-Readi, M.Z.; Alghamdi, A.; et al. Potential Predictors of Poor Prognosis among Severe COVID-19 Patients: A Single-Center Study. Can. J. Infect. Dis. Med. Microbiol. 2021, 2021, 6656092. [Google Scholar] [CrossRef]
- Davis, H.E.; McCorkell, L.; Vogel, J.M.; Topol, E.J. Author Correction: Long COVID: Major findings, mechanisms and recommendations. Nat. Rev. Microbiol. 2023, 21, 408. [Google Scholar] [CrossRef]
- Sharma, A.; Ahmad Farouk, I.; Lal, S.K. COVID-19: A Review on the Novel Coronavirus Disease Evolution, Transmission, Detection, Control and Prevention. Viruses 2021, 13, 202. [Google Scholar] [CrossRef]
- Combs, C.A.; Shroff, H. Fluorescence Microscopy: A Concise Guide to Current Imaging Methods. Curr. Protoc. Neurosci. 2017, 79, 2.1.1–2.1.25. [Google Scholar] [CrossRef] [PubMed]
- Putlyaeva, L.V.; Lukyanov, K.A. Studying SARS-CoV-2 with Fluorescence Microscopy. Int. J. Mol. Sci. 2021, 22, 6558. [Google Scholar] [CrossRef]
- Cortese, M.; Laketa, V. Advanced microscopy technologies enable rapid response to SARS-CoV-2 pandemic. Cell Microbiol. 2021, 23, e13319. [Google Scholar] [CrossRef]
- Miao, L.; Yan, C.; Chen, Y.; Zhou, W.; Zhou, X.; Qiao, Q.; Xu, Z. SIM imaging resolves endocytosis of SARS-CoV-2 spike RBD in living cells. Cell Chem. Biol. 2023, 30, 248–260.e4. [Google Scholar] [CrossRef]
- Sharma, G.; Song, L.F.; Merz, K.M. Effect of an Inhibitor on the ACE2-Receptor-Binding Domain of SARS-CoV-2. J. Chem. Inf. Model 2022, 62, 6574–6585. [Google Scholar] [CrossRef] [PubMed]
- Verma, S.; Patil, V.M.; Gupta, M.K. Mutation informatics: SARS-CoV-2 receptor-binding domain of the spike protein. Drug Discov. Today 2022, 27, 103312. [Google Scholar] [CrossRef]
- Lan, J.; Ge, J.; Yu, J.; Shan, S.; Zhou, H.; Fan, S.; Zhang, Q.; Shi, X.; Wang, Q.; Zhang, L.; et al. Structure of the SARS-CoV-2 spike receptor-binding domain bound to the ACE2 receptor. Nature 2020, 581, 215–220. [Google Scholar] [CrossRef] [PubMed]
- Prakash, K.; Diederich, B.; Reichelt, S.; Heintzmann, R.; Schermelleh, L. Super-resolution structured illumination microscopy: Past, present and future. Philos. Trans. A Math. Phys. Eng. Sci. 2021, 379, 20200143. [Google Scholar] [CrossRef]
- Cole, N.B. Site-specific protein labeling with SNAP-tags. Curr. Protoc. Protein Sci. 2013, 73, 30.1.1–30.1.16. [Google Scholar] [CrossRef]
- Miao, L.; Zhou, W.; Yan, C.; Zhang, Y.; Qiao, Q.; Zhou, X.; Chen, Y.; Wang, G.; Guo, Z.; Liu, J.; et al. Rapid screening of SARS-CoV-2 inhibitors via ratiometric fluorescence of RBD-ACE2 complexes in living cells by competitive binding. Acta Pharm. Sin. B 2022, 12, 3739–3742. [Google Scholar] [CrossRef] [PubMed]
- Yang, J.; Xiao, Y.; Lidsky, P.V.; Wu, C.T.; Bonser, L.R.; Peng, S.; Garcia-Knight, M.A.; Tassetto, M.; Chung, C.I.; Li, X.; et al. Fluorogenic reporter enables identification of compounds that inhibit SARS-CoV-2. Nat. Microbiol. 2023, 8, 121–134. [Google Scholar] [CrossRef] [PubMed]
- Mahalingam, G.; Arjunan, P.; Periyasami, Y.; Dhyani, A.K.; Devaraju, N.; Rajendiran, V.; Christopher, A.C.; Kt, R.D.; Dhanasingh, I.; Thangavel, S.; et al. Correlating the differences in the receptor binding domain of SARS-CoV-2 spike variants on their interactions with human ACE2 receptor. Sci. Rep. 2023, 13, 8743. [Google Scholar] [CrossRef]
- Yan, R.; Zhang, Y.; Li, Y.; Xia, L.; Guo, Y.; Zhou, Q. Structural basis for the recognition of SARS-CoV-2 by full-length human ACE2. Science 2020, 367, 1444–1448. [Google Scholar] [CrossRef] [PubMed]
- Zhu, J.; Su, Y.; Tang, Y. Disrupting ACE2 dimerization mitigates the infection by SARS-CoV-2 Pseudovirus. Front. Virol. 2022, 2, 916700. [Google Scholar] [CrossRef]
- Magidson, V.; Khodjakov, A. Circumventing photodamage in live-cell microscopy. Methods Cell Biol. 2013, 114, 545–560. [Google Scholar]
- Grover, V.P.; Tognarelli, J.M.; Crossey, M.M.; Cox, I.J.; Taylor-Robinson, S.D.; McPhail, M.J. Magnetic Resonance Imaging: Principles and Techniques: Lessons for Clinicians. J. Clin. Exp. Hepatol. 2015, 5, 246–255. [Google Scholar] [CrossRef]
- Langenbach, M.C.; Hokamp, N.G.; Persigehl, T.; Bratke, G. MRI appearance of COVID-19 infection. Diagn. Interv. Radiol. 2020, 26, 377–378. [Google Scholar] [CrossRef]
- Afshar-Oromieh, A.; Prosch, H.; Schaefer-Prokop, C.; Bohn, K.P.; Alberts, I.; Mingels, C.; Thurnher, M.; Cumming, P.; Shi, K.; Peters, A.; et al. A comprehensive review of imaging findings in COVID-19—Status in early 2021. Eur. J. Nucl. Med. Mol. Imaging 2021, 48, 2500–2524. [Google Scholar] [CrossRef]
- Galisova, A.; Zahradnik, J.; Allouche-Arnon, H.; Morandi, M.I.; Abou Karam, P.; Fisler, M.; Avinoam, O.; Regev-Rudzki, N.; Schreiber, G.; Bar-Shir, A. Genetically Engineered MRI-Trackable Extracellular Vesicles as SARS-CoV-2 Mimetics for Mapping ACE2 Binding In Vivo. ACS Nano 2022, 16, 12276–12289. [Google Scholar] [CrossRef]
- National Research Council (US); Institute of Medicine (US) Committee on State of the Science of Nuclear Medicine. Advancing Nuclear Medicine Through Innovation, Advancing Nuclear Medicine Through Innovation; National Academies Press: Washington, DC, USA, 2007. [Google Scholar] [CrossRef]
- Doepker, M.P.; Yamamoto, M.; Applebaum, M.A.; Patel, N.U.; Jaime Montilla-Soler, M.; Sarnaik, A.A.; Wayne Cruse, C.; Sondak, V.K.; Zager, J.S. Comparison of Single-Photon Emission Computed Tomography-Computed Tomography (SPECT/CT) and Conventional Planar Lymphoscintigraphy for Sentinel Node Localization in Patients with Cutaneous Malignancies. Ann. Surg. Oncol. 2017, 24, 355–361. [Google Scholar] [CrossRef] [PubMed]
- Sai, K.K.S.; Zachar, Z.; Bingham, P.M.; Mintz, A. Metabolic PET Imaging in Oncology. AJR Am. J. Roentgenol. 2017, 209, 270–276. [Google Scholar] [CrossRef] [PubMed]
- Shukla, A.K.; Kumar, U. Positron emission tomography: An overview. J. Med. Phys. 2006, 31, 13–21. [Google Scholar] [CrossRef]
- Crisan, G.; Moldovean-Cioroianu, N.S.; Timaru, D.G.; Andries, G.; Cainap, C.; Chis, V. Radiopharmaceuticals for PET and SPECT Imaging: A Literature Review over the Last Decade. Int. J. Mol. Sci. 2022, 23, 5023. [Google Scholar] [CrossRef]
- Huang, L.; Sexton, D.J.; Skogerson, K.; Devlin, M.; Smith, R.; Sanyal, I.; Parry, T.; Kent, R.; Enright, J.; Wu, Q.L.; et al. Novel peptide inhibitors of angiotensin-converting enzyme 2. J. Biol. Chem. 2003, 278, 15532–15540. [Google Scholar] [CrossRef] [PubMed]
- Zhu, H.; Zhang, H.; Zhou, N.; Ding, J.; Jiang, J.; Liu, T.; Liu, Z.; Wang, F.; Zhang, Q.; Zhang, Z.; et al. Molecular PET/CT Profiling of ACE2 Expression In Vivo: Implications for Infection and Outcome from SARS-CoV-2. Adv. Sci. 2021, 8, e2100965. [Google Scholar] [CrossRef]
- Liu, T.; Liu, C.; Xu, X.; Liu, F.; Guo, X.; Li, N.; Wang, X.; Yang, J.; Yang, X.; Zhu, H.; et al. Preclinical Evaluation and Pilot Clinical Study of Al(18)F-PSMA-BCH for Prostate Cancer PET Imaging. J. Nucl. Med. 2019, 60, 1284–1292. [Google Scholar] [CrossRef]
- Uhlen, M.; Fagerberg, L.; Hallstrom, B.M.; Lindskog, C.; Oksvold, P.; Mardinoglu, A.; Sivertsson, A.; Kampf, C.; Sjostedt, E.; Asplund, A.; et al. Proteomics. Tissue-based map of the human proteome. Science 2015, 347, 1260419. [Google Scholar] [CrossRef]
- Parker, M.F.L.; Blecha, J.; Rosenberg, O.; Ohliger, M.; Flavell, R.R.; Wilson, D.M. Cyclic (68)Ga-Labeled Peptides for Specific Detection of Human Angiotensin-Converting Enzyme 2. J. Nucl. Med. 2021, 62, 1631–1637. [Google Scholar] [CrossRef]
- Beyer, D.; Vaccarin, C.; Deupi, X.; Mapanao, A.K.; Cohrs, S.; Sozzi-Guo, F.; Grundler, P.V.; van der Meulen, N.P.; Wang, J.; Tanriver, M.; et al. A tool for nuclear imaging of the SARS-CoV-2 entry receptor: Molecular model and preclinical development of ACE2-selective radiopeptides. EJNMMI Res. 2023, 13, 32. [Google Scholar] [CrossRef]
- Li, X.; Yin, W.; Li, A.; Li, D.; Gao, X.; Wang, R.; Cui, B.; Qiu, S.; Li, R.; Jia, L.; et al. ACE2 PET to reveal the dynamic patterns of ACE2 recovery in an infection model with pseudocorona virus. J. Med. Virol. 2023, 95, e28470. [Google Scholar] [CrossRef] [PubMed]
- Li, X.; Li, J.; Zhou, P.; Li, D.; Wang, M.; Tong, Q.; Chen, J.; Zuo, C.; Zhang, L.; Li, R. The functional views on response of host rabbit post coronavirus vaccination via ACE2 PET. Am. J. Nucl. Med. Mol. Imaging 2023, 13, 43–50. [Google Scholar]
- Wang, Z.; Liu, Z.; Yang, L.; Ding, J.; Wang, F.; Liu, T.; Yang, Z.; Wang, C.; Zhu, H.; Liu, Y. Noninvasive Mapping of Angiotensin Converting Enzyme-2 in Pigeons Using Micro Positron Emission Tomography. Life 2022, 12, 793. [Google Scholar] [CrossRef]
- Gilbertson, B.; Subbarao, K. Mammalian infections with highly pathogenic avian influenza viruses renew concerns of pandemic potential. J. Exp. Med. 2023, 220, e20230447. [Google Scholar] [CrossRef]
- Subbarao, K.; Klimov, A.; Katz, J.; Regnery, H.; Lim, W.; Hall, H.; Perdue, M.; Swayne, D.; Bender, C.; Huang, J.; et al. Characterization of an avian influenza A (H5N1) virus isolated from a child with a fatal respiratory illness. Science 1998, 279, 393–396. [Google Scholar] [CrossRef] [PubMed]
- Li, D.; Ding, J.; Liu, T.L.; Wang, F.; Meng, X.X.; Liu, S.; Yang, Z.; Zhu, H. SARS-CoV-2 receptor binding domain radio-probe: A non-invasive approach for angiotensin-converting enzyme 2 mapping in mice. Acta Pharmacol. Sin. 2022, 43, 1749–1757. [Google Scholar] [CrossRef] [PubMed]
- Li, D.; Xiong, L.; Pan, G.; Wang, T.; Li, R.; Zhu, L.; Tong, Q.; Yang, Q.; Peng, Y.; Zuo, C.; et al. Molecular imaging on ACE2-dependent transocular infection of coronavirus. J. Med. Virol. 2022, 94, 4878–4889. [Google Scholar] [CrossRef]
- Liu, S.; Li, G.; Ding, L.; Ding, J.; Zhang, Q.; Li, D.; Hou, X.; Kong, X.; Zou, J.; Zhang, S.; et al. Evaluation of SARS-CoV-2-Neutralizing Nanobody Using Virus Receptor Binding Domain-Administered Model Mice. Research 2022, 2022, 9864089. [Google Scholar] [CrossRef]
- Zhang, Q.; Lu, S.; Li, T.; Yu, L.; Zhang, Y.; Zeng, H.; Qian, X.; Bi, J.; Lin, Y. ACE2 inhibits breast cancer angiogenesis via suppressing the VEGFa/VEGFR2/ERK pathway. J. Exp. Clin. Cancer Res. 2019, 38, 173. [Google Scholar] [CrossRef]
- Xu, K.; Han, H.; Luo, Y.; Ye, H.; Lin, H.; Ni, L. The Angiotensin-Converting Enzyme Inhibitory State Promotes the Transformation of Non-Small Cell Lung Cancer Blood Supply Pattern Toward Vasculogenic Mimicry Formation. Front. Oncol. 2021, 11, 663671. [Google Scholar] [CrossRef]
- Gottschalk, G.; Knox, K.; Roy, A. ACE2: At the crossroad of COVID-19 and lung cancer. Gene Rep. 2021, 23, 101077. [Google Scholar] [CrossRef]
- Nair, M.G.; Prabhu, J.S.; Ts, S. High expression of ACE2 in HER2 subtype of breast cancer is a marker of poor prognosis. Cancer Treat. Res. Commun. 2021, 27, 100321. [Google Scholar] [CrossRef]
- Ren, F.; Jiang, H.; Shi, L.; Zhang, L.; Li, X.; Lu, Q.; Li, Q. (68)Ga-cyc-DX600 PET/CT in ACE2-targeted tumor imaging. Eur. J. Nucl. Med. Mol. Imaging 2023, 50, 2056–2067. [Google Scholar] [CrossRef]
- Zhang, Q.; Liu, T.; Ding, J.; Zhou, N.; Yu, Z.; Ren, Y.; Qin, X.; Du, P.; Yang, Z.; Zhu, H. Evaluation of (68)Ga- and (177)Lu-Labeled HZ20 Angiotensin-Converting Enzyme 2-Targeting Peptides for Tumor-Specific Imaging. Mol. Pharm. 2022, 19, 4149–4156. [Google Scholar] [CrossRef]
- Salamanna, F.; Maglio, M.; Landini, M.P.; Fini, M. Body Localization of ACE-2: On the Trail of the Keyhole of SARS-CoV-2. Front. Med. 2020, 7, 594495. [Google Scholar] [CrossRef] [PubMed]
- Leowattana, W. Angiotensin-converting enzyme 2 receptors, chronic liver diseases, common medications, and clinical outcomes in coronavirus disease 2019 patients. World J. Virol. 2021, 10, 86–96. [Google Scholar] [CrossRef]
- Dhole, S.D.; Kher, A.S.; Ghildiyal, R.G.; Tambse, M.P. Chronic Liver Diseases in Children: Clinical Profile and Histology. J. Clin. Diagn. Res. 2015, 9, SC04-7. [Google Scholar] [CrossRef] [PubMed]
- Sardar, A.; Sr Parkash, A.; Merchant, A.A.; Qamar, B.; Ayub, F.; Zehravi, S. Etiology in Children Presented with Chronic Liver Disease in a Tertiary Care Hospital. Cureus 2022, 14, e25570. [Google Scholar] [CrossRef]
- Im, K.; Mareninov, S.; Diaz, M.F.P.; Yong, W.H. An Introduction to Performing Immunofluorescence Staining. Methods Mol. Biol. 2019, 1897, 299–311. [Google Scholar] [PubMed]


| CTID | Abbreviated Titles | Imaging Modality | Purpose | Compound | Patients | Status |
|---|---|---|---|---|---|---|
| NCT04422457 | Specific Molecular Imaging of DX600 Labeled by PET Radionuclide Targeting ACE2 in Patients | PET/CT | Diagnostic | 68Ga-DX600 | 30 | Completed |
| NCT04542863 | The Molecular Imaging Research of F-18-Labeled DX600 PET Probe | PET/CT | Diagnostic | 18F-DX600 | 100 | Recruiting |
Disclaimer/Publisher’s Note: The statements, opinions and data contained in all publications are solely those of the individual author(s) and contributor(s) and not of MDPI and/or the editor(s). MDPI and/or the editor(s) disclaim responsibility for any injury to people or property resulting from any ideas, methods, instructions or products referred to in the content. |
© 2023 by the authors. Licensee MDPI, Basel, Switzerland. This article is an open access article distributed under the terms and conditions of the Creative Commons Attribution (CC BY) license (https://creativecommons.org/licenses/by/4.0/).
Share and Cite
Li, Z.; Hasson, A.; Daggumati, L.; Zhang, H.; Thorek, D.L.J. Molecular Imaging of ACE2 Expression in Infectious Disease and Cancer. Viruses 2023, 15, 1982. https://doi.org/10.3390/v15101982
Li Z, Hasson A, Daggumati L, Zhang H, Thorek DLJ. Molecular Imaging of ACE2 Expression in Infectious Disease and Cancer. Viruses. 2023; 15(10):1982. https://doi.org/10.3390/v15101982
Chicago/Turabian StyleLi, Zhiyao, Abbie Hasson, Lasya Daggumati, Hanwen Zhang, and Daniel L. J. Thorek. 2023. "Molecular Imaging of ACE2 Expression in Infectious Disease and Cancer" Viruses 15, no. 10: 1982. https://doi.org/10.3390/v15101982