
Exploring Paxlovid Efficacy in COVID-19 Patients with MAFLD: Insights from a Single-Center Prospective Cohort Study


Abstract
:1. Introduction
2. Materials and Methods
2.1. Study Design and Population
2.2. Laboratory and Clinical Data
2.3. Statistical Analysis
3. Results
3.1. Baseline Patients’ Characteristics
3.2. Clinical and Laboratory Findings in Patients Treated with Pavloxid vs. Standard Therapy
3.3. Difference in Laboratory Findings in Patients Treated with Paxlovid and Standard Therapy on Discharge Comparing with Admission
3.4. Correlation Analysis
3.5. Kaplan–Meier Test for Recovery Time
4. Discussion
5. Conclusions
Author Contributions
Funding
Institutional Review Board Statement
Informed Consent Statement
Data Availability Statement
Conflicts of Interest
References
- Singh, A.; Hussain, S.; Antony, B. Non-Alcoholic Fatty Liver Disease and Clinical Outcomes in Patients with COVID-19: A Comprehensive Systematic Review and Meta-Analysis. Diabetes Metab. Syndr. Clin. Res. Rev. 2021, 15, 813–822. [Google Scholar] [CrossRef]
- Yoo, H.W.; Jin, H.Y.; Yon, D.K.; Effenberger, M.; Shin, Y.H.; Kim, S.Y.; Yang, J.M.; Kim, M.S.; Koyanagi, A.; Jacob, L.; et al. Non-Alcoholic Fatty Liver Disease and COVID-19 Susceptibility and Outcomes: A Korean Nationwide Cohort. J. Korean Med. Sci. 2021, 36, e291. [Google Scholar] [CrossRef] [PubMed]
- Eslam, M.; Sanyal, A.J.; George, J.; Sanyal, A.; Neuschwander-Tetri, B.; Tiribelli, C.; Kleiner, D.E.; Brunt, E.; Bugianesi, E.; Yki-Järvinen, H.; et al. MAFLD: A Consensus-Driven Proposed Nomenclature for Metabolic Associated Fatty Liver Disease. Gastroenterology 2020, 158, 1999–2014. [Google Scholar] [CrossRef]
- Eslam, M.; Newsome, P.N.; Sarin, S.K.; Anstee, Q.M.; Targher, G.; Romero-Gomez, M.; Zelber-Sagi, S.; Wai-Sun Wong, V.; Dufour, J.-F.; Schattenberg, J.M.; et al. A New Definition for Metabolic Dysfunction-Associated Fatty Liver Disease: An International Expert Consensus Statement. J. Hepatol. 2020, 73, 202–209. [Google Scholar] [CrossRef] [PubMed]
- Forlano, R.; Mullish, B.H.; Mukherjee, S.K.; Nathwani, R.; Harlow, C.; Crook, P.; Judge, R.; Soubieres, A.; Middleton, P.; Daunt, A.; et al. In-Hospital Mortality Is Associated with Inflammatory Response in NAFLD Patients Admitted for COVID-19. PLoS ONE 2020, 15, e0240400. [Google Scholar] [CrossRef] [PubMed]
- Pan, L.; Huang, P.; Xie, X.; Xu, J.; Guo, D.; Jiang, Y. Metabolic Associated Fatty Liver Disease Increases the Severity of COVID-19: A Meta-Analysis. Dig. Liver Dis. 2021, 53, 153–157. [Google Scholar] [CrossRef] [PubMed]
- Mather, M.W.; Jardine, L.; Talks, B.; Gardner, L.; Haniffa, M. Complexity of Immune Responses in COVID-19. Semin. Immunol. 2021, 55, 101545. [Google Scholar] [CrossRef] [PubMed]
- Gao, F.; Zheng, K.I.; Yan, H.-D.; Sun, Q.-F.; Pan, K.-H.; Wang, T.-Y.; Chen, Y.-P.; Targher, G.; Byrne, C.D.; George, J.; et al. Association and Interaction Between Serum Interleukin-6 Levels and Metabolic Dysfunction-Associated Fatty Liver Disease in Patients with Severe Coronavirus Disease 2019. Front. Endocrinol. 2021, 12, 604100. [Google Scholar] [CrossRef]
- Papic, N.; Samadan, L.; Vrsaljko, N.; Radmanic, L.; Jelicic, K.; Simicic, P.; Svoboda, P.; Lepej, S.Z.; Vince, A. Distinct Cytokine Profiles in Severe COVID-19 and Non-Alcoholic Fatty Liver Disease. Life 2022, 12, 795. [Google Scholar] [CrossRef]
- Del Valle, D.M.; Kim-Schulze, S.; Huang, H.-H.; Beckmann, N.D.; Nirenberg, S.; Wang, B.; Lavin, Y.; Swartz, T.H.; Madduri, D.; Stock, A.; et al. An Inflammatory Cytokine Signature Predicts COVID-19 Severity and Survival. Nat. Med. 2020, 26, 1636–1643. [Google Scholar] [CrossRef]
- Hegyi, P.J.; Váncsa, S.; Ocskay, K.; Dembrovszky, F.; Kiss, S.; Farkas, N.; Erőss, B.; Szakács, Z.; Hegyi, P.; Pár, G. Metabolic Associated Fatty Liver Disease Is Associated with an Increased Risk of Severe COVID-19: A Systematic Review with Meta-Analysis. Front. Med. 2021, 8, 626425. [Google Scholar] [CrossRef] [PubMed]
- Tao, Z.; Li, Y.; Cheng, B.; Zhou, T.; Gao, Y. Risk of Severe COVID-19 Increased by Metabolic Dysfunction-Associated Fatty Liver Disease: A Meta-Analysis. J. Clin. Gastroenterol. 2021, 55, 830. [Google Scholar] [CrossRef] [PubMed]
- Wang, Y.; Wang, Y.; Duan, G.; Yang, H. NAFLD Was Independently Associated with Severe COVID-19 among Younger Patients Rather than Older Patients: A Meta-Analysis. J. Hepatol. 2023, 78, e136–e139. [Google Scholar] [CrossRef]
- Buchynskyi, M.; Kamyshna, I.; Oksenych, V.; Zavidniuk, N.; Kamyshnyi, A. The Intersection of COVID-19 and Metabolic-Associated Fatty Liver Disease: An Overview of the Current Evidence. Viruses 2023, 15, 1072. [Google Scholar] [CrossRef]
- Kamyshnyi, A.; Koval, H.; Kobevko, O.; Buchynskyi, M.; Oksenych, V.; Kainov, D.; Lyubomirskaya, K.; Kamyshna, I.; Potters, G.; Moshynets, O. Therapeutic Effectiveness of Interferon-A2b against COVID-19 with Community-Acquired Pneumonia: The Ukrainian Experience. Int. J. Mol. Sci. 2023, 24, 6887. [Google Scholar] [CrossRef] [PubMed]
- Buchynskyi, M.; Kamyshna, I.; Lyubomirskaya, K.; Moshynets, O.; Kobyliak, N.; Oksenych, V.; Kamyshnyi, A. Efficacy of Interferon Alpha for the Treatment of Hospitalized Patients with COVID-19: A Meta-Analysis. Front. Immunol. 2023, 14, 1069894. [Google Scholar] [CrossRef]
- Owen, D.R.; Allerton, C.M.N.; Anderson, A.S.; Aschenbrenner, L.; Avery, M.; Berritt, S.; Boras, B.; Cardin, R.D.; Carlo, A.; Coffman, K.J.; et al. An Oral SARS-CoV-2 Mpro Inhibitor Clinical Candidate for the Treatment of COVID-19. Science 2021, 374, 1586–1593. [Google Scholar] [CrossRef]
- Hammond, J.; Leister-Tebbe, H.; Gardner, A.; Abreu, P.; Bao, W.; Wisemandle, W.; Baniecki, M.; Hendrick, V.M.; Damle, B.; Simón-Campos, A.; et al. Oral Nirmatrelvir for High-Risk, Nonhospitalized Adults with COVID-19. N. Engl. J. Med. 2022, 386, 1397–1408. [Google Scholar] [CrossRef]
- Fda; Cder EUA Pfizer Paxlovid Letter of Authorization (LOA). 2023. Available online: https://www.fda.gov/media/155049/download (accessed on 1 January 2024).
- Pfizer Inc. Pfizer’s Novel COVID-19 Oral Antiviral Treatment Candidate Reduced Risk of Hospitalization or Death by 89% in Interim Analysis of Phase 2/3 EPIC-HR Study|Pfizer. Pfizer Website. 2021. Available online: https://www.pfizer.com/news/press-release/press-release-detail/pfizers-novel-covid-19-oral-antiviral-treatment-candidate (accessed on 1 January 2024).
- Clinical Spectrum|COVID-19 Treatment Guidelines. Available online: https://www.covid19treatmentguidelines.nih.gov/overview/clinical-spectrum/ (accessed on 29 October 2023).
- Fouad, Y.; Waked, I.; Bollipo, S.; Gomaa, A.; Ajlouni, Y.; Attia, D. What’s in a Name? Renaming ‘NAFLD’ to ‘MAFLD’. Liver Int. 2020, 40, 1254–1261. [Google Scholar] [CrossRef]
- Méndez-Sánchez, N.; Bugianesi, E.; Gish, R.G.; Lammert, F.; Tilg, H.; Nguyen, M.H.; Sarin, S.K.; Fabrellas, N.; Zelber-Sagi, S.; Fan, J.G.; et al. Global Multi-Stakeholder Endorsement of the MAFLD Definition. Lancet Gastroenterol. Hepatol. 2022, 7, 388–390. [Google Scholar] [CrossRef]
- Ritonavir-Boosted Nirmatrelvir (Paxlovid)|COVID-19 Treatment Guidelines. Available online: https://www.covid19treatmentguidelines.nih.gov/therapies/antivirals-including-antibody-products/ritonavir-boosted-nirmatrelvir--paxlovid-/ (accessed on 31 October 2023).
- Cheemerla, S.; Balakrishnan, M. Global Epidemiology of Chronic Liver Disease. Clin. Liver Dis. 2021, 17, 365–370. [Google Scholar] [CrossRef] [PubMed]
- Liu, M.; Mei, K.; Tan, Z.; Huang, S.; Liu, F.; Deng, C.; Ma, J.; Yu, P.; Liu, X. Liver Fibrosis Scores and Hospitalization, Mechanical Ventilation, Severity, and Death in Patients with COVID-19: A Systematic Review and Dose-Response Meta-Analysis. Can. J. Gastroenterol. Hepatol. 2022, 2022, 7235860. [Google Scholar] [CrossRef] [PubMed]
- Pranata, R.; Yonas, E.; Huang, I.; Lim, M.A.; Nasution, S.A.; Kuswardhani, R.A.T. Fibrosis-4 Index and Mortality in Coronavirus Disease 2019: A Meta-Analysis. Eur. J. Gastroenterol. Hepatol. 2021, 33, e368–e374. [Google Scholar] [CrossRef] [PubMed]
- Ji, D.; Qin, E.; Xu, J.; Zhang, D.; Cheng, G.; Wang, Y.; Lau, G. Non-Alcoholic Fatty Liver Diseases in Patients with COVID-19: A Retrospective Study. J. Hepatol. 2020, 73, 451–453. [Google Scholar] [CrossRef] [PubMed]
- Zhou, Y.-J.; Zheng, K.I.; Wang, X.-B.; Yan, H.-D.; Sun, Q.-F.; Pan, K.-H.; Wang, T.-Y.; Ma, H.-L.; Chen, Y.-P.; George, J.; et al. Younger Patients with MAFLD Are at Increased Risk of Severe COVID-19 Illness: A Multicenter Preliminary Analysis. J. Hepatol. 2020, 73, 719–721. [Google Scholar] [CrossRef] [PubMed]
- Wu, S.; Zhou, K.; Misra-Hebert, A.; Bena, J.; Kashyap, S.R. Impact of Metabolic Syndrome on Severity of COVID-19 Illness. Metab. Syndr. Relat. Disord. 2022, 20, 191–198. [Google Scholar] [CrossRef]
- Weber, S.; Hellmuth, J.C.; Scherer, C.; Muenchhoff, M.; Mayerle, J.; Gerbes, A.L. Liver Function Test Abnormalities at Hospital Admission Are Associated with Severe Course of SARS-CoV-2 Infection: A Prospective Cohort Study. Gut 2021, 70, 1925–1932. [Google Scholar] [CrossRef]
- Kamyshnyi, O.; Matskevych, V.; Lenchuk, T.; Strilbytska, O.; Storey, K.; Lushchak, O. Metformin to Decrease COVID-19 Severity and Mortality: Molecular Mechanisms and Therapeutic Potential. Biomed. Pharmacother. 2021, 144, 112230. [Google Scholar] [CrossRef]
- Petakh, P.; Kamyshna, I.; Nykyforuk, A.; Yao, R.; Imbery, J.F.; Oksenych, V.; Korda, M.; Kamyshnyi, A. Immunoregulatory Intestinal Microbiota and COVID-19 in Patients with Type Two Diabetes: A Double-Edged Sword. Viruses 2022, 14, 477. [Google Scholar] [CrossRef]
- Jagirdhar, G.S.K.; Pattnaik, H.; Banga, A.; Qasba, R.K.; Rama, K.; Reddy, S.T.; Bucharles, A.C.F.; Kashyap, R.; Elmati, P.R.; Bansal, V.; et al. Association of Non-Alcoholic Fatty Liver Disease and Metabolic-Associated Fatty Liver Disease with COVID-19-Related Intensive Care Unit Outcomes: A Systematic Review and Meta-Analysis. Medicina 2023, 59, 1237. [Google Scholar] [CrossRef]
- Buchynskyi, M.; Oksenych, V.; Kamyshna, I.; Vari, S.G.; Kamyshnyi, A. Genetic Predictors of Comorbid Course of COVID-19 and MAFLD: A Comprehensive Analysis. Viruses 2023, 15, 1724. [Google Scholar] [CrossRef] [PubMed]
- Tungtrongchitr, N.; Srivanitchapoom, N.; Hirunpat, P.; Sungkanuparph, S. Correlation Between Coronavirus Disease 2019 Severity and Noninvasive Assessment of Liver Fibrosis in Patients with Metabolic Dysfunction-Associated Fatty Liver Disease. Turk. J. Gastroenterol. Off. J. Turk. Soc. Gastroenterol. 2023, 34, 1227–1234. [Google Scholar] [CrossRef]
- Li, J.; Tian, A.; Zhu, H.; Chen, L.; Wen, J.; Liu, W.; Chen, P. Mendelian Randomization Analysis Reveals No Causal Relationship Between Nonalcoholic Fatty Liver Disease and Severe COVID-19. Clin. Gastroenterol. Hepatol. 2022, 20, 1553–1560. [Google Scholar] [CrossRef] [PubMed]
- Apicella, M.; Campopiano, M.C.; Mantuano, M.; Mazoni, L.; Coppelli, A.; Del Prato, S. COVID-19 in People with Diabetes: Understanding the Reasons for Worse Outcomes. lancet. Diabetes Endocrinol. 2020, 8, 782–792. [Google Scholar] [CrossRef] [PubMed]
- Hayat, U.; Ashfaq, M.Z.; Johnson, L.; Ford, R.; Wuthnow, C.; Kadado, K.; Jurdi, K.E.; Okut, H.; Kilgore, W.R.; Assi, M.; et al. The Association of Metabolic-Associated Fatty Liver Disease with Clinical Outcomes of COVID-19: A Systematic Review and Meta-Analysis. Kans. J. Med. 2022, 15, 241. [Google Scholar] [CrossRef]
- Kamyshnyi, A.; Krynytska, I.; Matskevych, V.; Marushchak, M.; Lushchak, O. Arterial Hypertension as a Risk Comorbidity Associated with COVID-19 Pathology. Int. J. Hypertens. 2020, 2020, 8019360. [Google Scholar] [CrossRef]
- Lefere, S.; Tacke, F. Macrophages in Obesity and Non-Alcoholic Fatty Liver Disease: Crosstalk with Metabolism. JHEP Rep. Innov. Hepatol. 2019, 1, 30–43. [Google Scholar] [CrossRef]
- Shao, J.; Liang, Y.; Li, Y.; Ding, R.; Zhu, M.; You, W.; Wang, Z.; Huang, B.; Wu, M.; Zhang, T.; et al. Implications of Liver Injury in Risk-Stratification and Management of Patients with COVID-19. Hepatol. Int. 2021, 15, 202–212. [Google Scholar] [CrossRef]
- Ding, Y.; Deng, Q.; Yang, M.; Niu, H.; Wang, Z.; Xia, S. Clinical Classification of Obesity and Implications for Metabolic Dysfunction-Associated Fatty Liver Disease and Treatment. Diabetes. Metab. Syndr. Obes. 2023, 16, 3303–3329. [Google Scholar] [CrossRef]
- Assante, G.; Williams, R.; Youngson, N.A. Is the Increased Risk for MAFLD Patients to Develop Severe COVID-19 Linked to Perturbation of the Gut-Liver Axis? J. Hepatol. 2021, 74, 487–488. [Google Scholar] [CrossRef]
- Sharma, P.; Kumar, A. Metabolic Dysfunction Associated Fatty Liver Disease Increases Risk of Severe COVID-19. Diabetes Metab. Syndr. 2020, 14, 825–827. [Google Scholar] [CrossRef] [PubMed]
- Targher, G.; Mantovani, A.; Byrne, C.D.; Wang, X.-B.; Yan, H.-D.; Sun, Q.-F.; Pan, K.-H.; Zheng, K.I.; Chen, Y.-P.; Eslam, M.; et al. Risk of Severe Illness from COVID-19 in Patients with Metabolic Dysfunction-Associated Fatty Liver Disease and Increased Fibrosis Scores. Gut 2020, 69, 1545–1547. [Google Scholar] [CrossRef] [PubMed]
- Liu, D.; Zheng, Y.; Kang, J.; Wang, D.; Bai, L.; Mao, Y.; Zha, G.; Tang, H.; Zhang, R. Not Only High Number and Specific Comorbidities but Also Age Are Closely Related to Progression and Poor Prognosis in Patients With COVID-19. Front. Med. 2021, 8, 736109. [Google Scholar] [CrossRef] [PubMed]
- Luzi, L.; Radaelli, M.G. Influenza and Obesity: Its Odd Relationship and the Lessons for COVID-19 Pandemic. Acta Diabetol. 2020, 57, 759–764. [Google Scholar] [CrossRef] [PubMed]
- Karami, H.; Derakhshani, A.; Ghasemigol, M.; Fereidouni, M.; Miri-Moghaddam, E.; Baradaran, B.; Tabrizi, N.J.; Najafi, S.; Solimando, A.G.; Marsh, L.M.; et al. Weighted Gene Co-Expression Network Analysis Combined with Machine Learning Validation to Identify Key Modules and Hub Genes Associated with SARS-CoV-2 Infection. J. Clin. Med. 2021, 10, 3567. [Google Scholar] [CrossRef]
- Zhao, F.; Xiang, Z.; Han, J.; Pan, J.; Qu, Y.; Fan, K.; Wu, Z.; Xu, D.; Yu, Y.; Shen, Z.; et al. Simultaneous Quantification of Nirmatrelvir/Ritonavir in Human Serum by LC–HRMS. J. Pharm. Biomed. Anal. 2024, 237, 115796. [Google Scholar] [CrossRef]
- Matson, M.J.; Yinda, C.K.; Seifert, S.N.; Bushmaker, T.; Fischer, R.J.; Doremalen, N.V.; Lloyd-Smith, J.O.; Munster, V.J. Effect of Environmental Conditions on SARS-CoV-2 Stability in Human Nasal Mucus and Sputum. Emerg. Infect. Dis. 2020, 26, 2276–2278. [Google Scholar] [CrossRef]
- Pfizer Fact Sheet for Healthcare Providers: Emergency Use Authorization for Paxlovid TM Highlights of Emergency Use Authorization (EUA) These Highlights of the EUA Do Not Include All the Information Needed to Use Paxlovid TM under the EUA. See the Full Fact Sheet for Healthcare Providers for Paxlovid. Paxlovid (Nirmatrelvir Tablets; Ritonavir Tablets), Co-Packaged for Oral Use Original EUA Authorized Date. Available online: https://www.cdc.gov/coronavirus/2019-ncov/hcp/clinical-care/underlyingconditions.html (accessed on 1 January 2024).
- Arbel, R.; Wolff Sagy, Y.; Hoshen, M.; Battat, E.; Lavie, G.; Sergienko, R.; Friger, M.; Waxman, J.G.; Dagan, N.; Balicer, R.; et al. Nirmatrelvir Use and Severe COVID-19 Outcomes during the Omicron Surge. N. Engl. J. Med. 2022, 387, 790–798. [Google Scholar] [CrossRef]
- Dryden-Peterson, S.; Kim, A.; Kim, A.Y.; Caniglia, E.C.; Lennes, I.T.; Patel, R.; Gainer, L.; Dutton, L.; Donahue, E.; Gandhi, R.T.; et al. Nirmatrelvir Plus Ritonavir for Early COVID-19 in a Large U.S. Health System : A Population-Based Cohort Study. Ann. Intern. Med. 2023, 176, 77–84. [Google Scholar] [CrossRef]
- Wong, C.K.H.; Au, I.C.H.; Lau, K.T.K.; Lau, E.H.Y.; Cowling, B.J.; Leung, G.M. Real-World Effectiveness of Molnupiravir and Nirmatrelvir plus Ritonavir against Mortality, Hospitalisation, and in-Hospital Outcomes among Community-Dwelling, Ambulatory Patients with Confirmed SARS-CoV-2 Infection during the Omicron Wave in Hong Kong: An observational study. Lancet 2022, 400, 1213–1222. [Google Scholar] [CrossRef]
- Aggarwal, N.R.; Molina, K.C.; Beaty, L.E.; Bennett, T.D.; Carlson, N.E.; Mayer, D.A.; Peers, J.L.; Russell, S.; Wynia, M.K.; Ginde, A.A. Real-World Use of Nirmatrelvir-Ritonavir in Outpatients with COVID-19 during the Era of Omicron Variants Including BA.4 and BA.5 in Colorado, USA: A Retrospective Cohort Study. Lancet. Infect. Dis. 2023, 23, 696–705. [Google Scholar] [CrossRef] [PubMed]
- Yip, T.C.-F.; Lui, G.C.-Y.; Lai, M.S.-M.; Wong, V.W.-S.; Tse, Y.-K.; Ma, B.H.-M.; Hui, E.; Leung, M.K.W.; Chan, H.L.-Y.; Hui, D.S.-C.; et al. Impact of the Use of Oral Antiviral Agents on the Risk of Hospitalization in Community Coronavirus Disease 2019 Patients (COVID-19). Clin. Infect. Dis. Off. Publ. Infect. Dis. Soc. Am. 2023, 76, e26–e33. [Google Scholar] [CrossRef]
- Schwartz, K.L.; Wang, J.; Tadrous, M.; Langford, B.J.; Daneman, N.; Leung, V.; Gomes, T.; Friedman, L.; Daley, P.; Brown, K.A. Population-Based Evaluation of the Effectiveness of Nirmatrelvir-Ritonavir for Reducing Hospital Admissions and Mortality from COVID-19. Can. Med Assoc. J. 2023, 195, E220–E226. [Google Scholar] [CrossRef] [PubMed]
- Ganatra, S.; Dani, S.S.; Ahmad, J.; Kumar, A.; Shah, J.; Abraham, G.M.; McQuillen, D.P.; Wachter, R.M.; Sax, P.E. Oral Nirmatrelvir and Ritonavir in Nonhospitalized Vaccinated Patients With Coronavirus Disease 2019. Clin. Infect. Dis. 2023, 76, 563–572. [Google Scholar] [CrossRef]
- Qiu, C.; Wu, Z.; Liu, X.; Zhang, Q.; Wu, L.; Ye, X.; Zhou, J.; Shi, J.; Jiang, X. Efficacy and Safety of Nirmatrelvir/Ritonavir for Treating the Omicron Variant of COVID-19. Front. Med. 2023, 10, 1161193. [Google Scholar] [CrossRef] [PubMed]
- Pfizer Reports Additional Data on PAXLOVIDTM Supporting Upcoming New Drug Application Submission to U.S. FDA|Pfizer. Available online: https://www.pfizer.com/news/press-release/press-release-detail/pfizer-reports-additional-data-paxlovidtm-supporting (accessed on 20 November 2023).
- Malden, D.E.; Hong, V.; Lewin, B.J.; Ackerson, B.K.; Lipsitch, M.; Lewnard, J.A.; Tartof, S.Y. Hospitalization and Emergency Department Encounters for COVID-19 After Paxlovid Treatment—California, December 2021–May 2022. MMWR Morb. Mortal. Wkly. Rep. 2022, 71, 830–833. [Google Scholar] [CrossRef]
- Zhou, X.; Kelly, S.P.; Liang, C.; Li, L.; Shen, R.; Leister-Tebbe, H.K.; Terra, S.G.; Gaffney, M.; Russo, L. Real-World Effectiveness of Nirmatrelvir/Ritonavir in Preventing Hospitalization Among Patients With COVID-19 at High Risk for Severe Disease in the United States: A Nationwide Population-Based Cohort Study. medRxiv 2022. 2022.09.13.22279908. [Google Scholar] [CrossRef]
- Shah, M.M.; Joyce, B.; Plumb, I.D.; Sahakian, S.; Feldstein, L.R.; Barkley, E.; Paccione, M.; Deckert, J.; Sandmann, D.; Gerhart, J.L.; et al. Paxlovid Associated with Decreased Hospitalization Rate Among Adults with COVID-19—United States, April–September 2022. MMWR Morb. Mortal. Wkly. Rep. 2022, 71, 1531–1537. [Google Scholar] [CrossRef]
- Amani, B.; Amani, B. Efficacy and Safety of Nirmatrelvir/Ritonavir (Paxlovid) for COVID-19: A Rapid Review and Meta-Analysis. J. Med. Virol. 2023, 95, e28441. [Google Scholar] [CrossRef]
- Zheng, Q.; Ma, P.; Wang, M.; Cheng, Y.; Zhou, M.; Ye, L.; Feng, Z.; Zhang, C. Efficacy and Safety of Paxlovid for COVID-19:A Meta-Analysis. J. Infect. 2023, 86, 66–117. [Google Scholar] [CrossRef]
- Wen, W.; Chen, C.; Tang, J.; Wang, C.; Zhou, M.; Cheng, Y.; Zhou, X.; Wu, Q.; Zhang, X.; Feng, Z.; et al. Efficacy and Safety of Three New Oral Antiviral Treatment (Molnupiravir, Fluvoxamine and Paxlovid) for COVID-19: A Meta-Analysis. Ann. Med. 2022, 54, 516–523. [Google Scholar] [CrossRef] [PubMed]
- Wong, G.L.-H.; Hui, V.W.-K.; Yip, T.C.-F.; Lui, G.C.-Y.; Hui, D.S.-C.; Wong, V.W.-S. Minimal Risk of Drug-Induced Liver Injury with Molnupiravir and Ritonavir-Boosted Nirmatrelvir. Gastroenterology 2023, 164, 151–153. [Google Scholar] [CrossRef] [PubMed]
- Amani, B.; Zareei, S.; Amani, B. Rapid Review and Meta-Analysis of Adverse Events Associated with Molnupiravir in Patients with COVID-19. Br. J. Clin. Pharmacol. 2022, 88, 4403–4411. [Google Scholar] [CrossRef] [PubMed]
- Saravolatz, L.D.; Depcinski, S.; Sharma, M. Molnupiravir and Nirmatrelvir-Ritonavir: Oral Coronavirus Disease 2019 Antiviral Drugs. Clin. Infect. Dis. Off. Publ. Infect. Dis. Soc. Am. 2023, 76, 165–171. [Google Scholar] [CrossRef]
- Lamb, Y.N. Nirmatrelvir Plus Ritonavir: First Approval. Drugs 2022, 82, 585–591. [Google Scholar] [CrossRef]
- Li, M.; Zhang, Q.-S.; Liu, X.-L.; Wang, H.-L.; Liu, W. Adverse Events Associated with Nirmatrelvir/Ritonavir: A Pharmacovigilance Analysis Based on FAERS. Pharmaceuticals 2022, 15, 1455. [Google Scholar] [CrossRef]


| MAFLD (n = 33) | Non-MAFLD (n = 39) | p-Value a | |
|---|---|---|---|
| Age, median (IQR) b | 66 (50–72) | 65 (41–72) | 0.560 |
| Male, No. (%) | 21 (63.6%) | 22 (54.4%) | 0.632 |
| BMI, kg/m² | 30.8 (28.42–33.5) | 24 (22.4–25.35) | <0.001 |
| Peripheral oxygen saturation (SpO2), % on admission/ | 95 (92–96) | 96 (94–97) | 0.264 |
| discharge | 97 (96–98) | 97 (96–98) | 0.545 |
| The duration of hospital stay, days | 11 (9–13) | 10 (8–12) | 0.082 |
| COVID-19 severity (moderate/severe/critical), n | 20/10/3 | 22/15/2 | 0.670 |
| The need for oxygen supply, n (%) | 12 (36.6%) | 8 (20.51%) | 0.188 |
| Comorbidities | |||
| Diabetes mellitus | 14 (42.4%) | 2 (6.6%) | <0.001 |
| Arterial hypertension | 25 (75.7%) | 18 (46.15%) | 0.160 |
| COPD | 1 (3%) | 3 (7.69%) | 0.620 |
| Obesity | 18 (54.5%) | 0 | <0.001 |
| Coronary heart disease | 14 (42.4%) | 13 (33.33%) | 0.471 |
| Community-acquired pneumonia | 18 (54.55%) | 22 (54.41%) | 1.000 |
| Mortality | 1 (3.03%) | 2 (5.12%) | 1.000 |
| Admission | Discharge | |||||
|---|---|---|---|---|---|---|
| MAFLD (n = 33) | Non-MAFLD (n = 39) | p-Value a | MAFLD (n = 33) | Non-MAFLD (n = 39) | p-Value a | |
| Leukocytes, 109/L, median (IQR) b | 6.4 (4.47–9.37) | 5.57 (4.04–7.57) | 0.139 | 8.93 (6.87–11.33) | 7.73 (5.17–10.8) | 0.083 |
| Lymphocytes, % | 22 (9.5–29.5) | 23 (14–33) | 0.428 | 27 (16.5–34) | 29 (17–38) | 0.406 |
| Band neutrophils, % | 9 (5.5–16) | 7 (6–12) | 0.185 | 3 (2–5) | 3 (2–4) | 0.950 |
| Segmented neutrophils, % | 62 (49.5–71) | 62 (52–75) | 0.874 | 64 (56–75) | 63 (52–72) | 0.490 |
| Eosinophils, % | 1 (0–2) | 1 (0–1) | 0.797 | 1 (0–1) | 1 (0–1) | 0.279 |
| Monocytes, % | 4 (2–6.5) | 4 (1–9) | 0.793 | 5 (3–8) | 4 (2–7) | 0.535 |
| ESR *, mm/h | 6 (4–19.5) | 6 (4–11) | 0.537 | 5 (4–7) | 5 (4–14) | 0.271 |
| Platelet count, 109/L | 214 (168–250) | 210 (170–258) | 0.576 | 218 (183–314) | 244 (178–290) | 0.709 |
| Hematocrit, % | 40 (33.64–48.50) | 36.9 (32–40.8) | 0.055 | 37.8 (31.97–45.95) | 34.5 (31.29–38.95) | 0.028 |
| INR *, n | 0.99 (0.95–1.05) | 1.03 (0.95–1.12) | 0.244 | 1.01 (0.95–1.07) | 1.02 (0.92–1.1) | 0.888 |
| PT *, s | 12.8 (12.2–13.55) | 12.8 (12.2–14) | 0.553 | 13.2 (12.35–13.4) | 12.4 (11.6–13.8) | 0.419 |
| QPT *, % | 94.1 (87.1–104) | 92.6 (76.7–100) | 0.345 | 96 (81.6–106.1) | 95 (82–103.6) | 0.923 |
| aPTT *, s | 33.4 (29.8–37.4) | 33.8 (30.8–35.4) | 0.991 | 29.8 (25.2–33.9) | 31.8 (27.6–35.4) | 0.171 |
| Fibrinogen, g/L | 3.99 (3.1–5.21) | 3.77 (3.33–5.11) | 0.941 | 3.99 (3.3–4.44) | 3.71 (3.12–4.56) | 0.333 |
| Total bilirubin, mmol/L | 12.9 (10.8–15.15) | 12.3 (10.8–16) | 0.852 | 11.3 (10.6–16.4) | 12.7 (10.5–16) | 0.964 |
| ALT *, mmol/L | 28.2 (21.1–33.65) | 25 (21.2–30.5) | 0.354 | 30.6 (23.15–37.45) | 27.5 (22.9–44) | 0.747 |
| AST *, mmol/L | 27 (21.4–43.6) | 22.9 (16.6–27.7) | 0.024 | 42 (72.05–23.9) | 33 (24.5–53.5) | 0.584 |
| Creatinine, mmol/L | 104 (91–117) | 90 (77–104) | 0.015 | 99 (86–115) | 94 (79–113) | 0.197 |
| GGT *, U/L | 60 (35.5–87) | 36 (23–66) | 0.017 | 67 (41–93.5) | 43 (30–65) | 0.012 |
| Total protein, g/L | 70.9 (64.6–76.25) | 61.1 (61.2–70.4) | 0.016 | 63.4 (59.3–67.8) | 67.6 (61.9–72.2) | 0.019 |
| Albumin, g/L | 47 (43–46) | 44 (40–55) | 0.068 | 42 (39–47) | 43 (37–49) | 0.861 |
| ALP *, mmol/L | 123 (99.5–149.5) | 127 (103–167) | 0.584 | 111 (94.5–133.5) | 125 (100–150) | 0.124 |
| CRP *, mg/L | 12 (6–24) | 6 (6–12) | 0.006 | 6 (6) | 6 (6) | 0.806 |
| Blood glucose, mmol/L | 7 (5.6–9.5) | 5.9 (5.2–7.1) | 0.012 | 5.6 (5.05–7) | 5.2 (4.7–6.3) | 0.178 |
| NLR * | 3.32 (2.09–8.96) | 2.83 (1.73–6) | 0.381 | 2.48 (1.76–4.79) | 2.36 (1.47–4.65) | 0.480 |
| COVID-19 Severity a | B (OR b) | Std. Error | Wald | df | Sig. (p-Value) | Exp (B) | 95% CI for Exp (B) | ||
|---|---|---|---|---|---|---|---|---|---|
| Lower Bound | Lower Bound | ||||||||
| Severe COVID-19 a | Intercept | 110.170 | 27.906 | 15.586 | 1 | 0.000 | |||
| SpO2 (admission) | −1.123 | 0.280 | 16.125 | 1 | 0.000 | 0.325 | 0.188 | 0.563 | |
| Lymphocytes, % (admission) | −0.051 | 0.036 | 1.974 | 1 | 0.160 | 0.950 | 0.885 | 1.020 | |
| QPT, % (admission) | −0.004 | 0.025 | 0.022 | 1 | 0.882 | 0.996 | 0.948 | 1.047 | |
| Albumin, g/L (admission) | −0.050 | 0.043 | 1.401 | 1 | 0.237 | 0.951 | 0.875 | 1.034 | |
| Critical COVID-19 a | Intercept | 236.719 | 132.155 | 3.208 | 1 | 0.073 | |||
| SpO2 (admission) | −2.382 | 1.414 | 2.838 | 1 | 0.092 | 0.092 | 0.006 | 1.476 | |
| Lymphocytes, % (admission) | 0.079 | 0.232 | 0.117 | 1 | 0.733 | 1.082 | 0.687 | 1.706 | |
| QPT, % (admission) | −0.206 | 0.234 | 0.778 | 1 | 0.378 | 0.814 | 0.515 | 1.287 | |
| Albumin, g/L (admission) | −0.082 | 0.338 | 0.059 | 1 | 0.808 | 0.921 | 0.475 | 1.787 | |
| B (OR a) | df | Sig. (p-Value) | 95% CI for EXP (B) | |||||
|---|---|---|---|---|---|---|---|---|
| S.E. | Wald | Exp (B) | Lower | Upper | ||||
| SpO2 admission | −1.245 | 0.375 | 11.019 | 1 | 0.001 | 0.288 | 0.138 | 0.601 |
| Leukocytes, 109/L (admission) | 0.261 | 0.215 | 1.469 | 1 | 0.225 | 1.298 | 0.851 | 1.980 |
| Hematocrit (%) (admission) | 0.067 | 0.054 | 1.518 | 1 | 0.218 | 1.069 | 0.961 | 1.188 |
| Creatinine, mmol/L (admission) | −0.002 | 0.004 | 0.171 | 1 | 0.679 | 0.998 | 0.990 | 1.007 |
| Constant | 112.063 | 34.734 | 10.409 | 1 | 0.001 | 4.659 × 1048 | ||
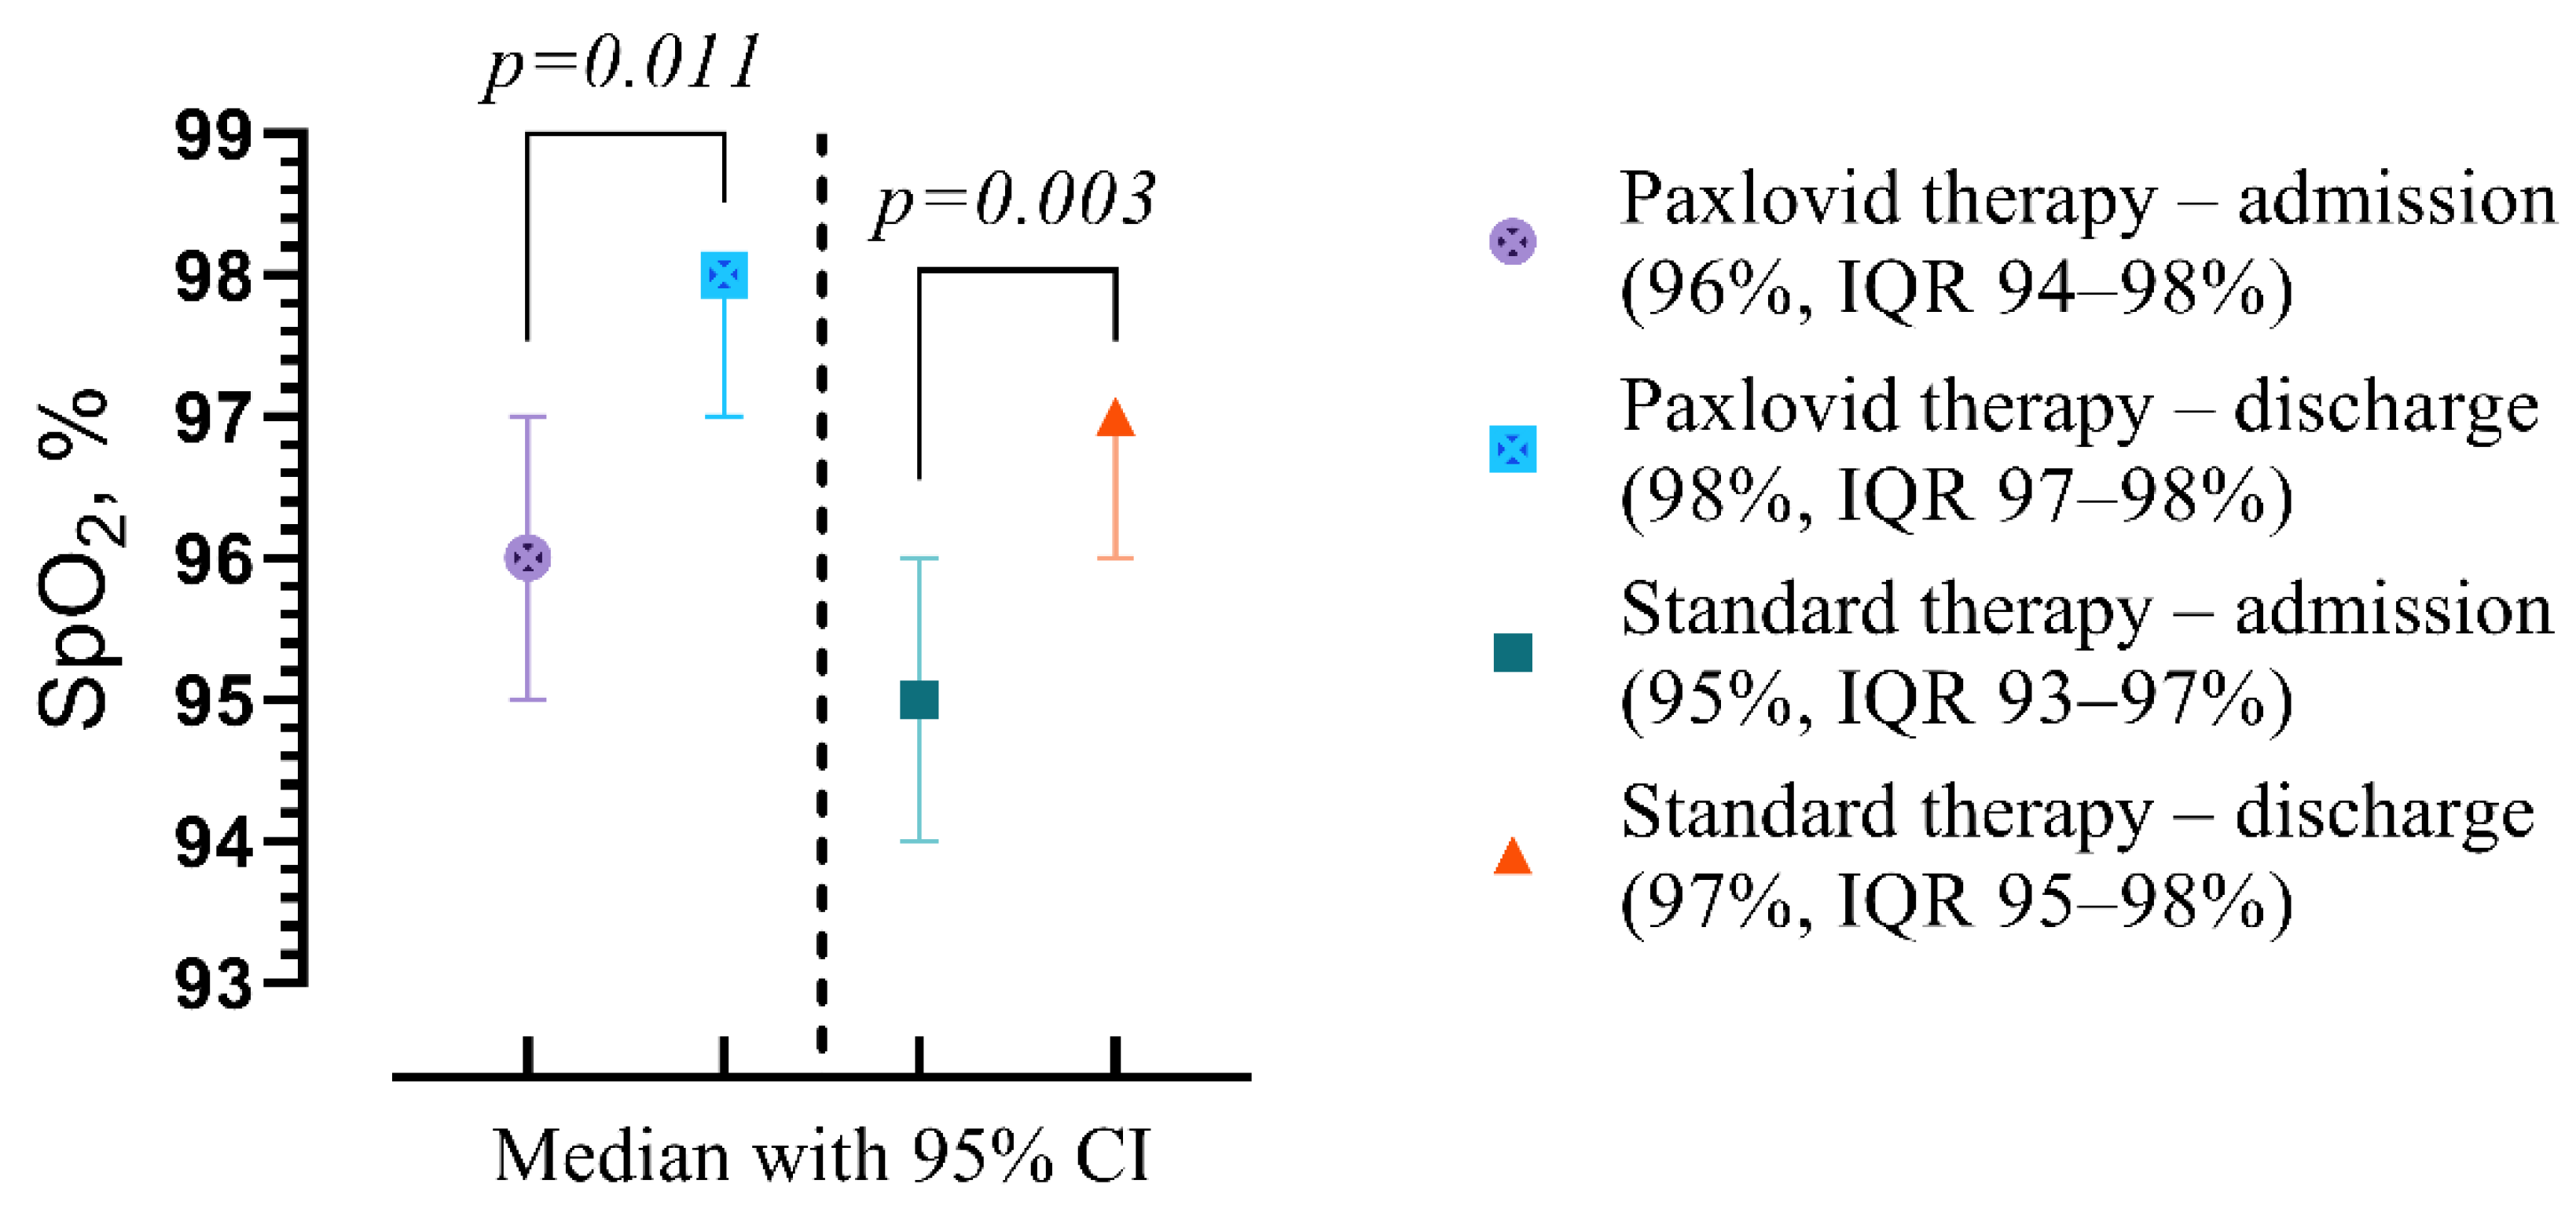
| Admission/Discharge, p-Value | Clinical and Laboratory Findings | Paxlovid Therapy (n = 23) | Standard Therapy (n = 49) | p-Value |
|---|---|---|---|---|
| A | Peripheral oxygen saturation (SpO2), % | 96 (94–98) | 95 (93–97) | p = 0.187 |
| D | 98 (97–98) | 97 (95–98) | p = 0.049 | |
| p | p = 0.011 | p = 0.003 | ||
| A | Leukocytes, 109/L | 5.17 (3.85–8.37) | 5.94 (4.57–7.95) | p = 0.567 |
| D | 8.44 (5.84–11.34) | 6.36 (8.81–11.29) | p = 0.978 | |
| p | p < 0.001 | p < 0.001 | ||
| A | Lymphocytes, % | 25 (16–33) | 22 (10–31) | p = 0.291 |
| D | 24 (17–37) | 28 (17–34) | p = 0.566 | |
| p | p = 0.466 | p = 0.002 | ||
| A | Band neutrophils, % | 7 (6–12) | 9 (5.5–14.5) | p = 0.720 |
| D | 3 (2–4) | 3 (2–5.5) | p = 0.398 | |
| p | p < 0.001 | p < 0.001 | ||
| A | Segmented neutrophils, % | 59 (46–70) | 63 (54–72.5) | p = 0.308 |
| D | 66 (52–75) | 62 (54.5–70) | p = 0.283 | |
| p | p = 0.008 | p = 0.758 | ||
| A | Eosinophils, % | 1 (1–2) | 1 (0–1) | p = 0.173 |
| D | 1 (0–1) | 1 (0–1.5) | p = 0.631 | |
| p | p = 0.079 | p = 0.647 | ||
| A | Monocytes, % | 5 (2–9) | 4 (1.5–6) | p = 0.072 |
| D | 6 (4–10) | 4 (2–6) | p = 0.013 | |
| p | p = 0.626 | p = 0.674 | ||
| A | ESR, mm/h | 5 (4–11) | 6 (4–19.5) | p = 0.432 |
| D | 5 (4–6) | 5 (4–10) | p = 0.418 | |
| p | p= 0.094 | p = 0.102 | ||
| A | Platelet count, 109/L | 180 (146–231) | 220 (177.5–263.5) | p = 0.055 |
| D | 220 (169–262) | 248 (190–314) | p = 0.257 | |
| p | p = 0.008 | p = 0.002 | ||
| A | Hematocrit, % | 37.3 (34.2–44) | 38.11 (30.87–43.5) | p = 0.291 |
| D | 37 (32–42) | 36 (31.43–42.97) | p = 0.511 | |
| p | p = 0.075 | p = 0.115 | ||
| A | INR, n | 0.98 (0.95–1.1) | 1 (0.95–1.09) | p = 0.473 |
| D | 1.01 (0.88–1.06) | 1.02 (0.93–1.09 | p = 0.205 | |
| p | p = 0.955 | p = 0.655 | ||
| A | PT, sec | 12.7 (12.2–13.6) | 12.9 (12.2–13.85) | p = 0.650 |
| D | 12.6 (11.9–13.4) | 12.8 (11.85–13.65) | p = 0.522 | |
| p | p = 0.479 | p = 0.484 | ||
| A | QPT, % | 94.1 (85.3–105.2) | 93.6 (82.6–101) | p = 0.437 |
| D | 96.2 (84.3–106.1) | 91.8 (80.9–104) | p = 0.625 | |
| p | p = 0.949 | p = 0.575 | ||
| A | APTT, s | 33.4 (29.8–37) | 33.7 (30.6–36.25) | p = 0.762 |
| D | 29.8 (25.6–34.7) | 31 (26.9–34.15) | p = 0.547 | |
| p | p = 0.014 | p < 0.001 | ||
| A | Fibrinogen, g/L | 3.99 (3.55–4.88) | 3.55 (3.1–5.32) | p = 0.454 |
| D | 3.33 (2.86–3.99) | 3.99 (3.44–4.66) | p = 0.025 | |
| p | p = 0.018 | p = 0.430 | ||
| A | Total bilirubin, mmol/L | 12.9 (10.8–17.1) | 12.6 (10.8–15.3) | p = 0.998 |
| D | 11.2 (10.6–14.1) | 12.7 (10.55–16.7) | p = 0.239 | |
| p | p = 0.092 | p = 0.638 | ||
| A | ALT, mmol/L | 23.4 (18.2–32.6) | 25.4 (22–31.1) | p = 0.283 |
| D | 29.8 (23.9–36.6) | 29 (22–39.3) | p = 0.690 | |
| p | p = 0.153 | p = 0.031 | ||
| A | AST, mmol/L | 22.5 (17.4–25.8) | 25.1 (17.55–33.45) | p = 0.232 |
| D | 30.8 (24.5–76.9) | 35 (24.75–61) | p = 1.000 | |
| p | p = 0.003 | p < 0.001 | ||
| A | Creatinine, mmol/L | 101 (80–117) | 98 (81.5–113) | p = 0.950 |
| D | 96 (84–103) | 96 (80–117.5) | p = 0.451 | |
| p | p = 0.325 | p = 0.524 | ||
| A | GGT , unit/L | 54 (26–83) | 49 (28–75.5) | p = 0.978 |
| D | 52 (37–72) | 57 (33–91.5) | p = 0.813 | |
| p | p = 0.310 | p = 0.006 | ||
| A | Total protein, g/L | 68.5 (61.6–74.6) | 68.6 (62.65–72.1) | p = 0.959 |
| D | 66.3 (61.8–71.2) | 63.6 (60.4–70.45) | p = 0.350 | |
| p | p = 0.345 | p = 0.004 | ||
| A | Albumin, g/L | 50 (45–56) | 44 (40–52.5) | p = 0.040 |
| D | 40 (46–51) | 42 (37.5–46) | p = 0.060 | |
| p | p = 0.102 | p = 0.001 | ||
| A | ALP, mmol/L | 138 (116–157) | 119 (95–160.5) | p = 0.095 |
| D | 120 (96–146) | 115 (99–148) | p = 0.785 | |
| p | p = 0.064 | p = 0.284 | ||
| A | CRP, mg/L | 6 (6–12) | 6 (6–24) | p = 0.860 |
| D | 6 (6) | 6 (6–12) | p = 0.104 | |
| p | p = 0.008 | p = 0.096 | ||
| A | Blood glucose, mmol/L | 5.7 (5.1–7.5) | 6.6 (5.5–8.05) | p = 0.239 |
| D | 5.6 (4.8–7.4) | 5.5 (4.85–6.1) | p = 0.484 | |
| p | p= 0.325 | p < 0.001 | ||
| A | NLR | 2.83 (1.76–5) | 3.32 (2–8.4) | p = 0.260 |
| D | 3.04 (1.42–5.12) | 2.19 (1.68–4.62) | p = 0.547 | |
| p | p= 0.622 | p = 0.009 |
| B (OR a) | Std. Error | Wald | df | Sig. (p-Value) | Exp (B) | 95% C.I. for EXP (B) | ||
|---|---|---|---|---|---|---|---|---|
| Lower | Upper | |||||||
| SpO2 (discharge) | −0.034 | 0.046 | 0.548 | 1 | 0.459 | 0.967 | 0.884 | 1.057 |
| Length of hospital stay (days) | −0.238 | 0.115 | 4.290 | 1 | 0.038 | 0.789 | 0.630 | 0.987 |
| Monocytes, % (discharge) | 0.207 | 0.091 | 5.229 | 1 | 0.022 | 1.230 | 1.030 | 1.469 |
| Fibrinogen, g/L (discharge) | −0.533 | 0.251 | 4.494 | 1 | 0.034 | 0.587 | 0.359 | 0.961 |
| Constant | 5.726 | 5.094 | 1.263 | 1 | 0.261 | 306.735 | ||
Disclaimer/Publisher’s Note: The statements, opinions and data contained in all publications are solely those of the individual author(s) and contributor(s) and not of MDPI and/or the editor(s). MDPI and/or the editor(s) disclaim responsibility for any injury to people or property resulting from any ideas, methods, instructions or products referred to in the content. |
© 2024 by the authors. Licensee MDPI, Basel, Switzerland. This article is an open access article distributed under the terms and conditions of the Creative Commons Attribution (CC BY) license (https://creativecommons.org/licenses/by/4.0/).
Share and Cite
Buchynskyi, M.; Oksenych, V.; Kamyshna, I.; Kamyshnyi, O. Exploring Paxlovid Efficacy in COVID-19 Patients with MAFLD: Insights from a Single-Center Prospective Cohort Study. Viruses 2024, 16, 112. https://doi.org/10.3390/v16010112
Buchynskyi M, Oksenych V, Kamyshna I, Kamyshnyi O. Exploring Paxlovid Efficacy in COVID-19 Patients with MAFLD: Insights from a Single-Center Prospective Cohort Study. Viruses. 2024; 16(1):112. https://doi.org/10.3390/v16010112
Chicago/Turabian StyleBuchynskyi, Mykhailo, Valentyn Oksenych, Iryna Kamyshna, and Oleksandr Kamyshnyi. 2024. "Exploring Paxlovid Efficacy in COVID-19 Patients with MAFLD: Insights from a Single-Center Prospective Cohort Study" Viruses 16, no. 1: 112. https://doi.org/10.3390/v16010112