Article

Transcriptome Analysis in Air–Liquid Interface Porcine Respiratory Epithelial Cell Cultures Reveals That the Betacoronavirus Porcine Encephalomyelitis Hemagglutinating Virus Induces a Robust Interferon Response to Infection

by
Kaitlyn M. Sarlo Davila
1,†,
Rahul K. Nelli
2,†,
Juan C. Mora-Díaz
2,
Yongming Sang
3,
Laura C. Miller
4,5,* and
Luis G. Giménez-Lirola
2,*
1
Infectious Bacterial Disease Research Unit, National Animal Disease Center, United States Department of Agriculture, Agricultural Research Service, Ames, IA 50010, USA
2
Department of Veterinary Diagnostic and Production Animal Medicine, College of Veterinary Medicine, Iowa State University, Ames, IA 50011, USA
3
Department of Agricultural and Environmental Sciences, College of Agriculture, Tennessee State University, Nashville, TN 37209, USA
4
Virus and Prion Research Unit, National Animal Disease Center, United States Department of Agriculture, Agricultural Research Service, Ames, IA 50010, USA
5
Department of Diagnostic Medicine/Pathobiology, College of Veterinary Medicine, Kansas State University, Manhattan, KS 66506, USA
*
Authors to whom correspondence should be addressed.
These authors contributed equally to this work.
Viruses 2024, 16(6), 939; https://doi.org/10.3390/v16060939
Submission received: 18 May 2024 / Revised: 6 June 2024 / Accepted: 7 June 2024 / Published: 11 June 2024
(This article belongs to the Special Issue Endemic and Emerging Swine Viruses 2024)

Abstract

:
Porcine hemagglutinating encephalomyelitis virus (PHEV) replicates in the upper respiratory tract and tonsils of pigs. Using an air–liquid interface porcine respiratory epithelial cells (ALI-PRECs) culture system, we demonstrated that PHEV disrupts respiratory epithelia homeostasis by impairing ciliary function and inducing antiviral, pro-inflammatory cytokine, and chemokine responses. This study explores the mechanisms driving early innate immune responses during PHEV infection through host transcriptome analysis. Total RNA was collected from ALI-PRECs at 24, 36, and 48 h post inoculation (hpi). RNA-seq analysis was performed using an Illumina Hiseq 600 to generate 100 bp paired-end reads. Differential gene expression was analyzed using DeSeq2. PHEV replicated actively in ALI-PRECs, causing cytopathic changes and progressive mucociliary disruption. Transcriptome analysis revealed downregulation of cilia-associated genes such as CILK1, DNAH11, LRRC-23, -49, and -51, and acidic sialomucin CD164L2. PHEV also activated antiviral signaling pathways, significantly increasing the expression of interferon-stimulated genes (RSAD2, MX1, IFIT, and ISG15) and chemokine genes (CCL5 and CXCL10), highlighting inflammatory regulation. This study contributes to elucidating the molecular mechanisms of the innate immune response to PHEV infection of the airway epithelium, emphasizing the critical roles of the mucociliary, interferon, and chemokine responses.

1. Introduction

Porcine hemagglutinating encephalomyelitis virus (PHEV) is a highly contagious swine pathogen associated with vomiting and wasting disease (VWD), encephalomyelitis, and/or respiratory disease [1,2,3]. PHEV is an enveloped single-stranded, positive-sense RNA coronavirus in the species Betacoronavirus 1 in the family Coronaviridae [4]. The disease was described for the first time in 1957 in nursing pigs in Ontario, Canada [5]; however, the virus was not isolated until 1962 during an encephalomyelitis outbreak in neonatal pigs [6]. Clinical manifestations of PHEV are restricted to piglets younger than 4 weeks of age, including VWD and encephalomyelitis [2,3,7]. The neurotropism of PHEV was also demonstrated in mice and rats but only under experimental conditions [8,9]. Although PHEV can infect any age, older pigs develop self-limiting or subclinical infections [10,11].
Primary replication of PHEV in pigs occurs in the respiratory tract, followed by infection of peripheral nerves and subsequent spread to the central nervous system (CNS) [12]. In a previous study we demonstrated in vivo and ex vivo that PHEV strain 67 N [13] replicates in the upper respiratory tract and tonsils using both a refined cesarean-derived, colostrum-deprived (CDCD) neonatal pig model and an organotypic air–liquid interface (ALI) porcine respiratory epithelial cell culture (PREC) system derived from CDCD neonatal pig tracheas [14].
Under ALI culture conditions, primary porcine cells derived from the respiratory tract are differentiated into a pseudostratified respiratory epithelium consisting of ciliated cells, goblet/secretory cells, and basal cells [15,16,17]. The ALI-PREC culture model was demonstrated to be sufficiently complex to resemble the biological and physiological properties of the respiratory tract’s epithelial lining and constitutes a viable alternative infection model to investigate the molecular mechanisms of the innate immune response and pathogenesis of respiratory pathogens [18,19].
Our previous studies on innate immune response to PHEV (67 N strain) using an ALI-PREC culture system revealed that upon PHEV infection of porcine respiratory cells, pattern recognition receptors (PRRs), such as Toll-like receptor 3 (TLR3), TLR7, retinoic acid-inducible gene (RIG)-I, and MyD88 played a crucial role in the transcriptional upregulation of IFN-λ 1 gene, which in turn upregulated the transcription factor STAT1, and therefore induced the expression of the antiviral IFN-stimulated genes OAS1 and Mx1 [20]. In addition, PHEV infection increased the secretion of IL-8 in grower and neonatal pigs, as well as in the subnatant of ALI-PREC cultures infected with the virus [14,20]. IL-8 plays a key role in the recruitment and subsequent infiltration of T-lymphocytes and macrophages [21,22].
Understanding the immune pathways responding to PHEV replication is essential for developing effective strategies to prevent and control diseases associated with this pathogen. The objective of this study is to further our understanding of the molecular mechanisms of the pathogenesis and innate immune response towards PHEV infection of ALI-PREC culture via transcriptomic analysis.

2. Materials and Methods

2.1. Culturing ALI-PRECs

Isolation and culture of PRECs were performed as previously described [20]. Tracheal samples were washed with phosphate-buffered saline (PBS) supplemented with 100 IU/mL of penicillin/100 µg/mL of streptomycin (Pen–Strep; Thermo Fisher Scientific Inc., Waltham, MA, USA) and 1.25 µg/mL of amphotericin B (AmpB; Thermo Fisher Scientific). Tissue digestion was performed in calcium and magnesium-free Minimum Essential Medium (MEM; in-house), supplemented with 1.4 mg/mL pronase (Millipore-Sigma, Burlington, MA, USA), 0.1 mg/mL DNase (Millipore-Sigma), 100 µg/mL Primocin (Invivogen, San Diego, CA, USA). The dissociated cells (PRECs) were frozen at −80 °C in an LHC® basal medium (Thermo Fisher Scientific) containing 30% heat-inactivated fetal bovine serum (EqualFetal; Atlas Biologicals, Fort Collins, CO, USA) and 10% dimethyl sulfoxide (DMSO; Millipore-Sigma).
As described previously [20], isolated PRECs were seeded at a density of ~20,000 cells/mm2 on 24-well ThinCert cell culture inserts or “transwell-inserts” [Polyethylene terephthalate (PET); transparent; pore size 0.4 μm; pore density 2 × 106 cm2; Greiner Bio-One North America Inc., Monroe, NC, USA) coated with collagen from the human placenta-Bornstein and Traub Type IV (Millipore-Sigma). Cells were cultured in a growth medium containing DMEM/F12 (Thermo Fisher Scientific) supplemented with 1400 nM hydrocortisone (Acros Organics, Fair Lawn, NJ, USA), 2700 nM epinephrine (Acros Organics), 100 nM retinoic acid (Acros Organics), 9.7 nM 3,3′,5-Triiodo-L-thyronine (Cayman Chemicals, Ann Arbor, MI, USA), 0.5 ng/mL murine epidermal growth factor (EGF; PeproTech US, Rocky Hill, NJ, USA), 1X insulin-selenium-transferrin (Thermo Fisher Scientific), 1X 4-(2-hydroxyethyl)-1-piperazineethanesulfonic acid (HEPES; Thermo Fisher Scientific), 2% Ultroser-G (Pall France, Cergy, France), Pen–Strep, and AmpB. The growth medium was replaced every 2–3 days until PRECs were completely differentiated into ALI-PRECs with no visible medium seepage, a shiny glaze that resembled mucus and cilia development.

2.2. PHEV In Vitro Culture and Propagation

PHEV 67 N or “Mengeling strain” was obtained from the National Veterinary Services Laboratories [NVSL, United States Department of Agriculture (USDA), Ames, IA, USA] and was propagated in swine kidney primary (SKP) cells (NVSL), as described previously [14]. The virus harvested in this study was titrated by hemagglutination assay (HA) and stored at −80 °C.

2.3. PHEV Infection in ALI-PRECs

Approximately 27–30 days old, completely differentiated ALI-PRECs from two independent control cesarean-derived, colostrum-deprived (CDCD) pigs (i.e., 2 biological and 3 technical replicates) were used for PHEV infection studies as previously described [20]. The number of replicates (n = 6 at each time point and treatment) ensures the study is statistically robust. On transwells inserts, a volume of 250 µL of 1:1 dilution of PHEV 67 N (1:128 HA titer) and infection medium containing DMEM/F12 supplemented with 2% Ultroser G, 1X MEM non-essential amino acids, 1X HEPES, Pen–Strep, and 2 µg/mL N-tosyl-L-phenylalanine chloromethyl ketone (TPCK) treated trypsin (Millipore-Sigma) was used. Infection medium without the virus was used for mock inoculations and platewells subnatants of both treatments to control for any non-specific effects. After 6 h at 37 °C and 5% CO2, the inoculum was removed, the cell cultures (i.e., transwell and platewell) were washed once with DMEM/F12, and fresh infection medium was added into the platewells only, exposing the transwell surface to air. Subsequently, plates were incubated for 24, 36, and 48 h post-inoculation (hpi) at 37 °C with 5% CO2. ALI-PRECs cultures were monitored daily under the microscope for cytopathic changes.

2.4. PHEV RT-qPCR

Viral RNA extractions were performed using the E.Z.N.A.® Viral R.N.A. Kit (Omega Bio-tek, Inc., Norcross, GA, USA) and vacuum manifold (QIAGEN, Germantown, MD, USA) method following the manufacturer’s instructions. A quantitative PHEV N gene-based RT-PCR (RT-qPCR) developed by Tetracore (Tetracore, Inc., Rockville, MD, USA) and Iowa State University [11] was used to confirm and quantify PHEV infection in vivo (CDCD pigs) and ex vivo (ALI-PRECs cultures). Each RT-qPCR reaction (25 μL final reaction volume) was set up by combining 19 μL of PHEV RT-qPCR master mix and 1 μL of the enzyme blend (reverse transcriptase and RNase inhibitor). An internal control (IC) was used as an extraction control, with 6 μL of the IC added to the lysis buffer. Then 5 μL of the extracted sample RNA with IC was added to Master Mix. All RT-qPCR reactions were performed in duplicate, with a negative extraction control (NEC), positive extraction control (PEC), and a “no template” control (NTC) included in each run. RT-qPCR reactions were run on a Rotor-Gene Q (QIAGEN) with cycling conditions; 48 °C for 15 min and 95 °C for 2 min holding; 45 cycles; 95 °C for 10 s denaturation; and 60 °C for 40 s amplification. The RT-qPCR results were analyzed using Rotor-Gene Q Pure Detection software (v 2.3.1). Samples with a threshold cycle (Ct) above 40 were considered negative.

2.5. Total RNA Isolation, Reverse Transcription, and Transcriptional Analysis

According to the manufacturer’s protocol, total RNA from ALI-PRECs was isolated for transcriptomic analysis using TRizol reagent (Thermo Fisher Scientific), chloroform phase separation, and commercially available RNeasy Plus Mini Kit (QIAGEN). Eluted RNA was quantified using a NanoDrop one microvolume UV-Vis spectrophotometer (Thermo Fisher Scientific), and samples with A260/280 between 1.96 and 2.05 were used for reverse transcription using the qScript XLT cDNA SuperMix Kit (Quantabio, Beverly, MA, USA). Furthermore, RNA quality was assessed with the Agilent bioanalyzer. The total RNA from each sample was used for RNA-Seq libraries, and indexed libraries for individual samples were pooled and sequenced utilizing the Illumina Hiseq 6000 to generate 100 base paired-end reads. Both library preparation and sequencing were performed at the Iowa State University Genomics Center. An average of 14,330,993.17 reads were generated per sample.
All qPCR reactions were performed using 1× PowerUp SYBR Green Master Mix (Thermo Fisher Scientific), 500 nM of swine-specific primers as described previously [20], 1.5 ng of total RNA converted to cDNA on Applied Biosystems 7500 Fast real-time system (Applied Biosystems, Foster City, CA, USA) thermocycler. The qPCR results were analyzed using 7500 Software v2.3 (Applied Biosystems) and exported to Microsoft Excel (Microsoft Corporation, Redmond, WA, USA). Amplification efficiencies beyond the range (1.5–2.2), samples with multiple melting peaks and above 40 Ct, were discarded. Ct values were subsequently analyzed on qBase+ gene expression analysis software (Biogazelle, Zwijnaarde, Belgium), which calculates the stability of endogenous control genes and provides a value called M-value. Out of seven endogenous control genes (ACTB, B2M, EIF3K, GAPDH, PPIA, RPL10, PCNA) used, three genes (EIF3K, PPIA, and RPL10) were identified as the best endogenous controls based on their low M-value. Hence, gene expression data were normalized using the geometric mean of these three genes [23]. Relative quantitation analysis was performed using the ΔΔCt method as described previously [24].

2.6. Differential Gene Expression Analysis

Tools at galaxy.scinet.usda.gov were utilized to analyze the sequenced reads and examine raw read data and counts. MultiQC was used to combine and visualize the FastQC results for all samples. The phred score and counts for each sample were performed Trimmomatic (version 0.38.1) [25] was used to remove adapters and reads with a phred score below 20 using a sliding window averaged across four bases prior to alignment on the Sscrofa 11.1 genome assembly with HiSat2 (version2.1.0) [26,27] utilizing default parameters for paired-end reads (FR option for orientation). Raw counts were generated with the default parameters (without count split and non-split alignments or fragment counts) of FeatureCounts and the NCBI Sscrofa11.1 version 2.2 GTF file. Differential gene expression (DEG) was performed using DeSeq2 (version 2.11.40.6) [28], utilizing a parametric fit type and poscounts to account for genes with zero counts. DEG analysis was based on the model treatment + hpi + treatment:hpi + E. Statistically significant genes were reported for the interaction effect of treatment:hpi. Genes were declared statistically significant at the Benjamini–Hochberg false discovery rate (FDR) adjusted p < 0.15.

2.7. Gene Ontology and Network Analysis

Gene Ontology (GO) term enrichment and clustering analysis were performed on the DEGs from each timepoint using the ClueGo Plug-in in Cytoscape 3.9.1 software [29]. GO term enrichment was calculated with a hypergeometric test. Functional grouping was based on the kappa score. Terms were declared as connected with a kappa score greater than 0.4. Redundant groups with greater than 50% overlap were merged. Mapped genes represent at least 4% of the total associated genes per term.

2.8. Pathway Analysis

Ingenuity Pathway Analysis (IPA) by Qiagen was used to determine the top canonical pathways associated with the DEGs data from ALI-PRECs at each time point. Significance values for the canonical pathways were calculated using the right-tailed Fisher’s Exact Test. The ratio is calculated as the number of significantly differentially expressed molecules in each pathway divided by the total number of molecules in that pathway. The IPA z-score values were used to predict the direction of change in each pathway, indicating the predicted activation or inhibition. Positive z-scores indicate predicted activation, while negative z-scores indicate predicted inhibition. Z-scores were only calculated for pathways including at least four significantly differentially expressed genes. The differential gene expression was visualized for each time point for a significant pathway. Based on significant z-score values, the molecule activity predictor (MAP) tool was used to predict upstream and downstream effects of activation and inhibition based on these known changes in gene expression.

3. Results

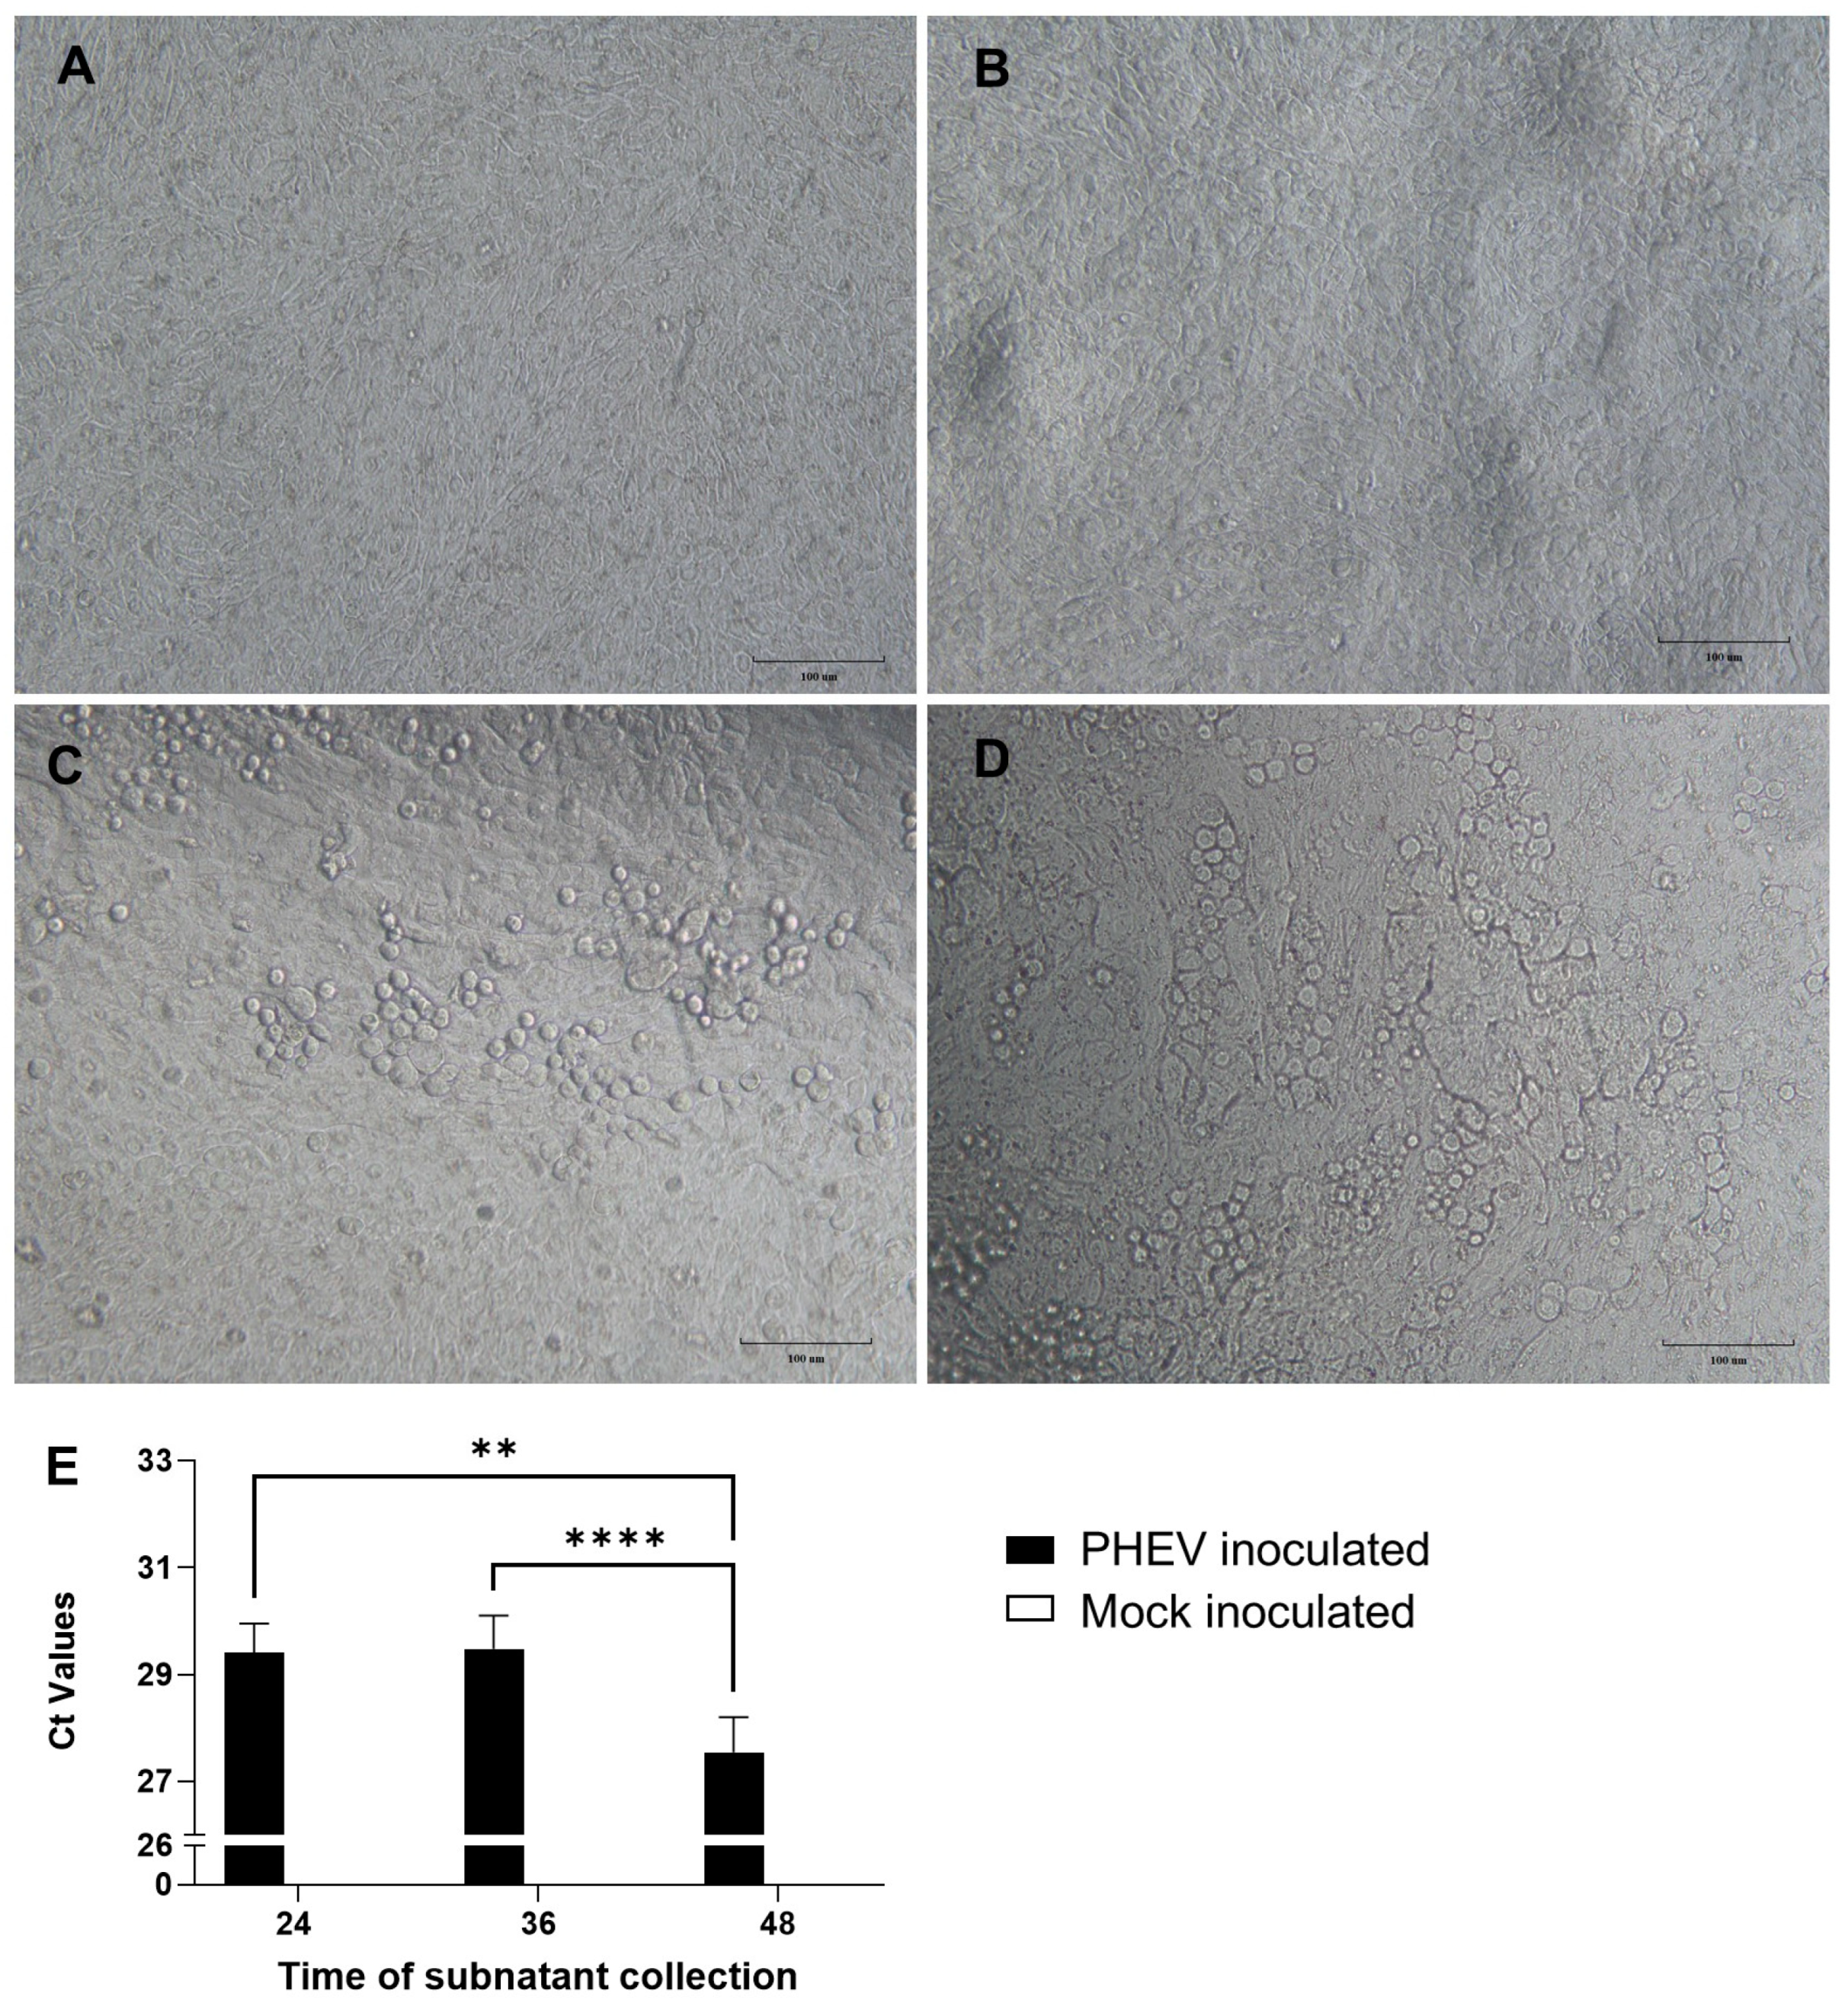
3.1. PHEV Replicates in ALI-PREC Cultures

Following PHEV inoculation, ALI-PRECs appeared normal and showed active ciliary movement in both mock- and virus-inoculated cells up to 24 h hpi. The virus-inoculated cells started showing cytopathic changes such as ciliary destruction, cytoplasmic stranding, vacuolation, rounding of cells, clusters of rounded cells, cell shrinkage, and detachment of cells around 36 hpi and increased over 48 hpi compared to mock-inoculated cells (Figure 1 A–D). Once the integrity of ALI-PRECs was breached, the virus started to shed into the bottom subnatants of the plate well medium, as evidenced by the RT-qPCR results (Figure 1E).

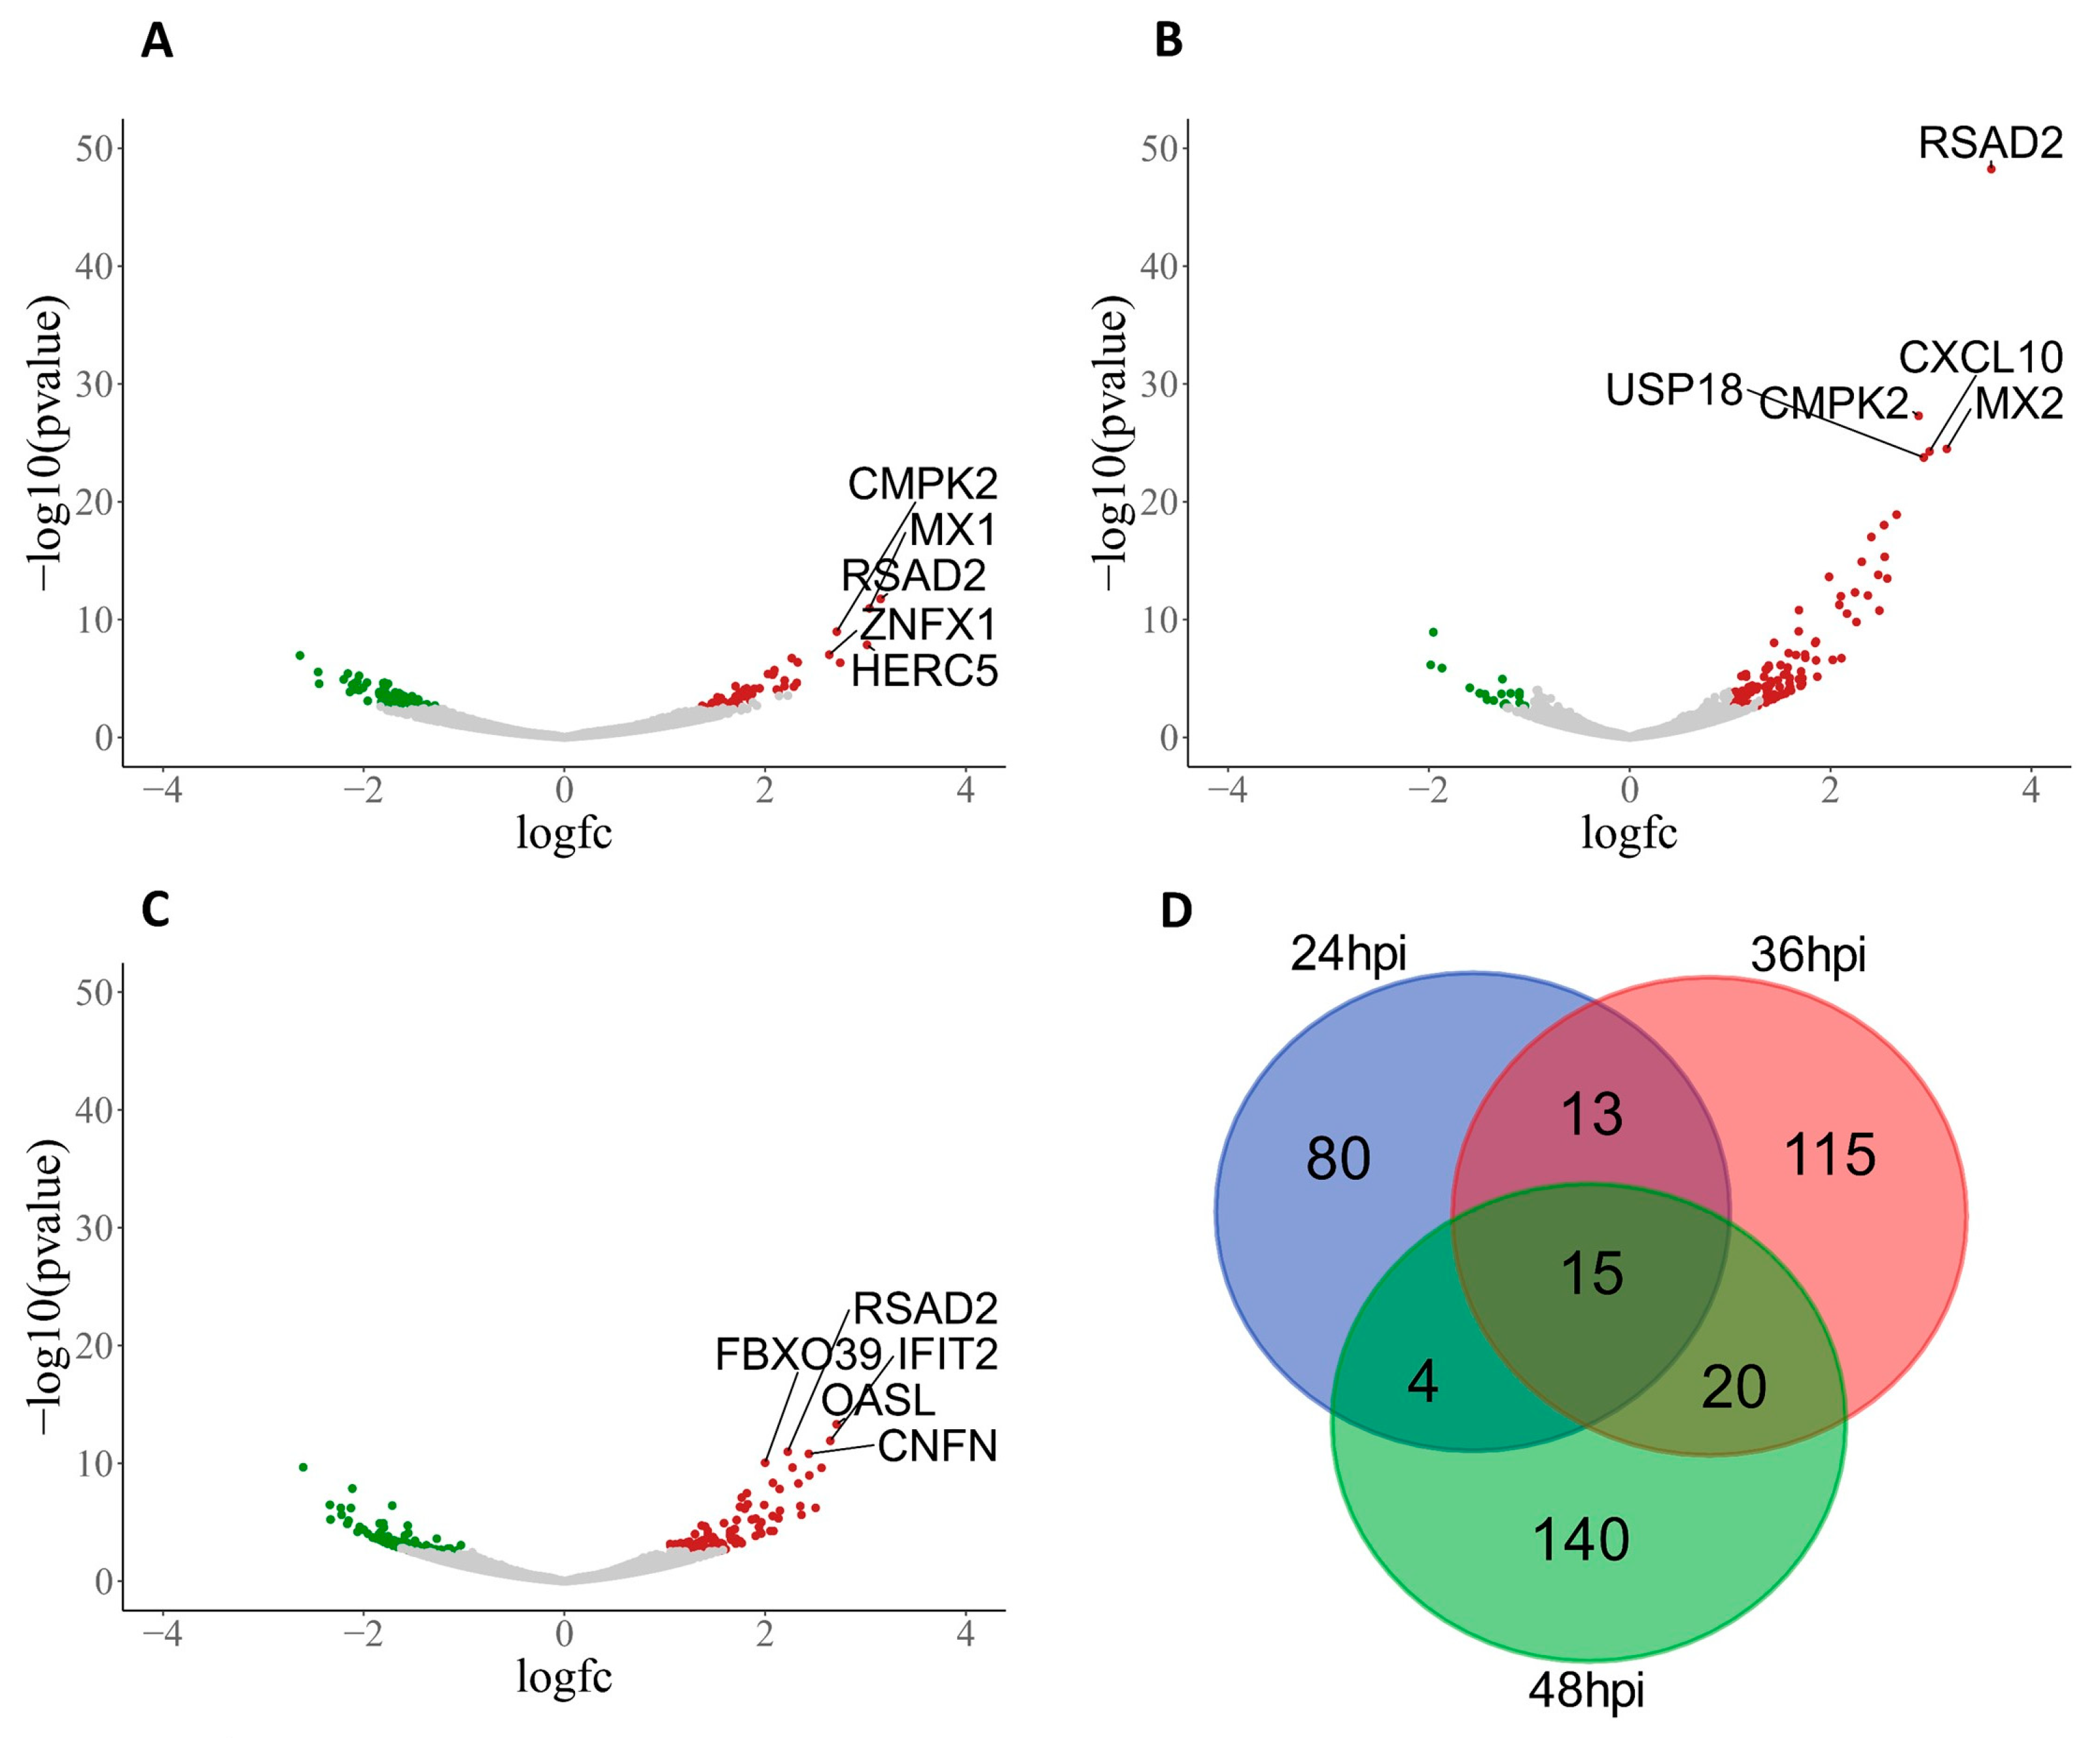
3.2. PHEV-Induced Robust Transcriptional Regulation in ALI-PRECs

Following PHEV infection, the significant (FDR < 0.15) number of DEGs increased throughout infection with 112, 163, and 179 DEGs at 24, 36, and 48 hpi, respectively (Tables S1–S3), and corresponding volcano plots (Figure 2A–C). At 24 hpi, 50 DEGs were upregulated, and 62 DEGs were downregulated in the infected samples compared to the controls (Table S1). A statistically significantly greater number of DEGs upregulated by 36 hpi, with 132 DEGs up and only 31 DEGs down compared to the controls (Table S2). Expression profiles were more balanced at 48 hpi with 97 upregulated DEGs and 82 downregulated DEGs (Table S3). A total of 15 DEGs (RSAD2, CMPK2, HERC5, HERC6, GBP1, OAS2, OASL, MX1, MX2, ISG15, IFIT1, ENSSSCG00000017754, EPSTI1, UBE2L6, and PSMB9) were shared across all three time points (Figure 2D). Interestingly, the top three significantly (p value  <  0.000001) upregulated genes at 24 (RSAD2, CMPK2, and MX1), 36 (RSAD2, CMPK2, and MX2), and 48 (RSAD2, OASL, and IFIT2) hpi belong to antiviral activity, with a fold change >2.5 (Tables S1–S3).

3.3. Network Visualization and Analysis of DEGs in ALI-PRECs following PHEV Infection

Using Cytoscape network analysis software (version 3.9.1), GO terms were clustered into functional groups based on kappa scores (Figure 3A,C,E). GO terms clustered into 7, 16, and 13 functional groups at 24, 36, and 48 hpi, respectively (Figure 3B,D,F). The functional group that was significant across all three time points was a response to type I interferons (IFNs), with 10.0% of all significant GO terms at 24 hpi (Figure 3A,B), 5.88% (Figure 3C,D) and 11.54% (Figure 3E,F) at 36 and 48 hpi. It is compelling to note that the GO terms associated with double-stranded RNA binding (10%; Figure 3A) were involved at 24 hpi, potentially leading to the involvement of the PRRs signaling pathway [30] (23.53%; Figure 3C) at 36 hpi with PHEV. The enrichment of these DEGs early in the infection possibly leads to the involvement of GO terms associated with the adaptive immune response (26.92%), monocyte chemotaxis (11.54%), and motile cilium (11.54%) at 48 hpi (Figure 3E).

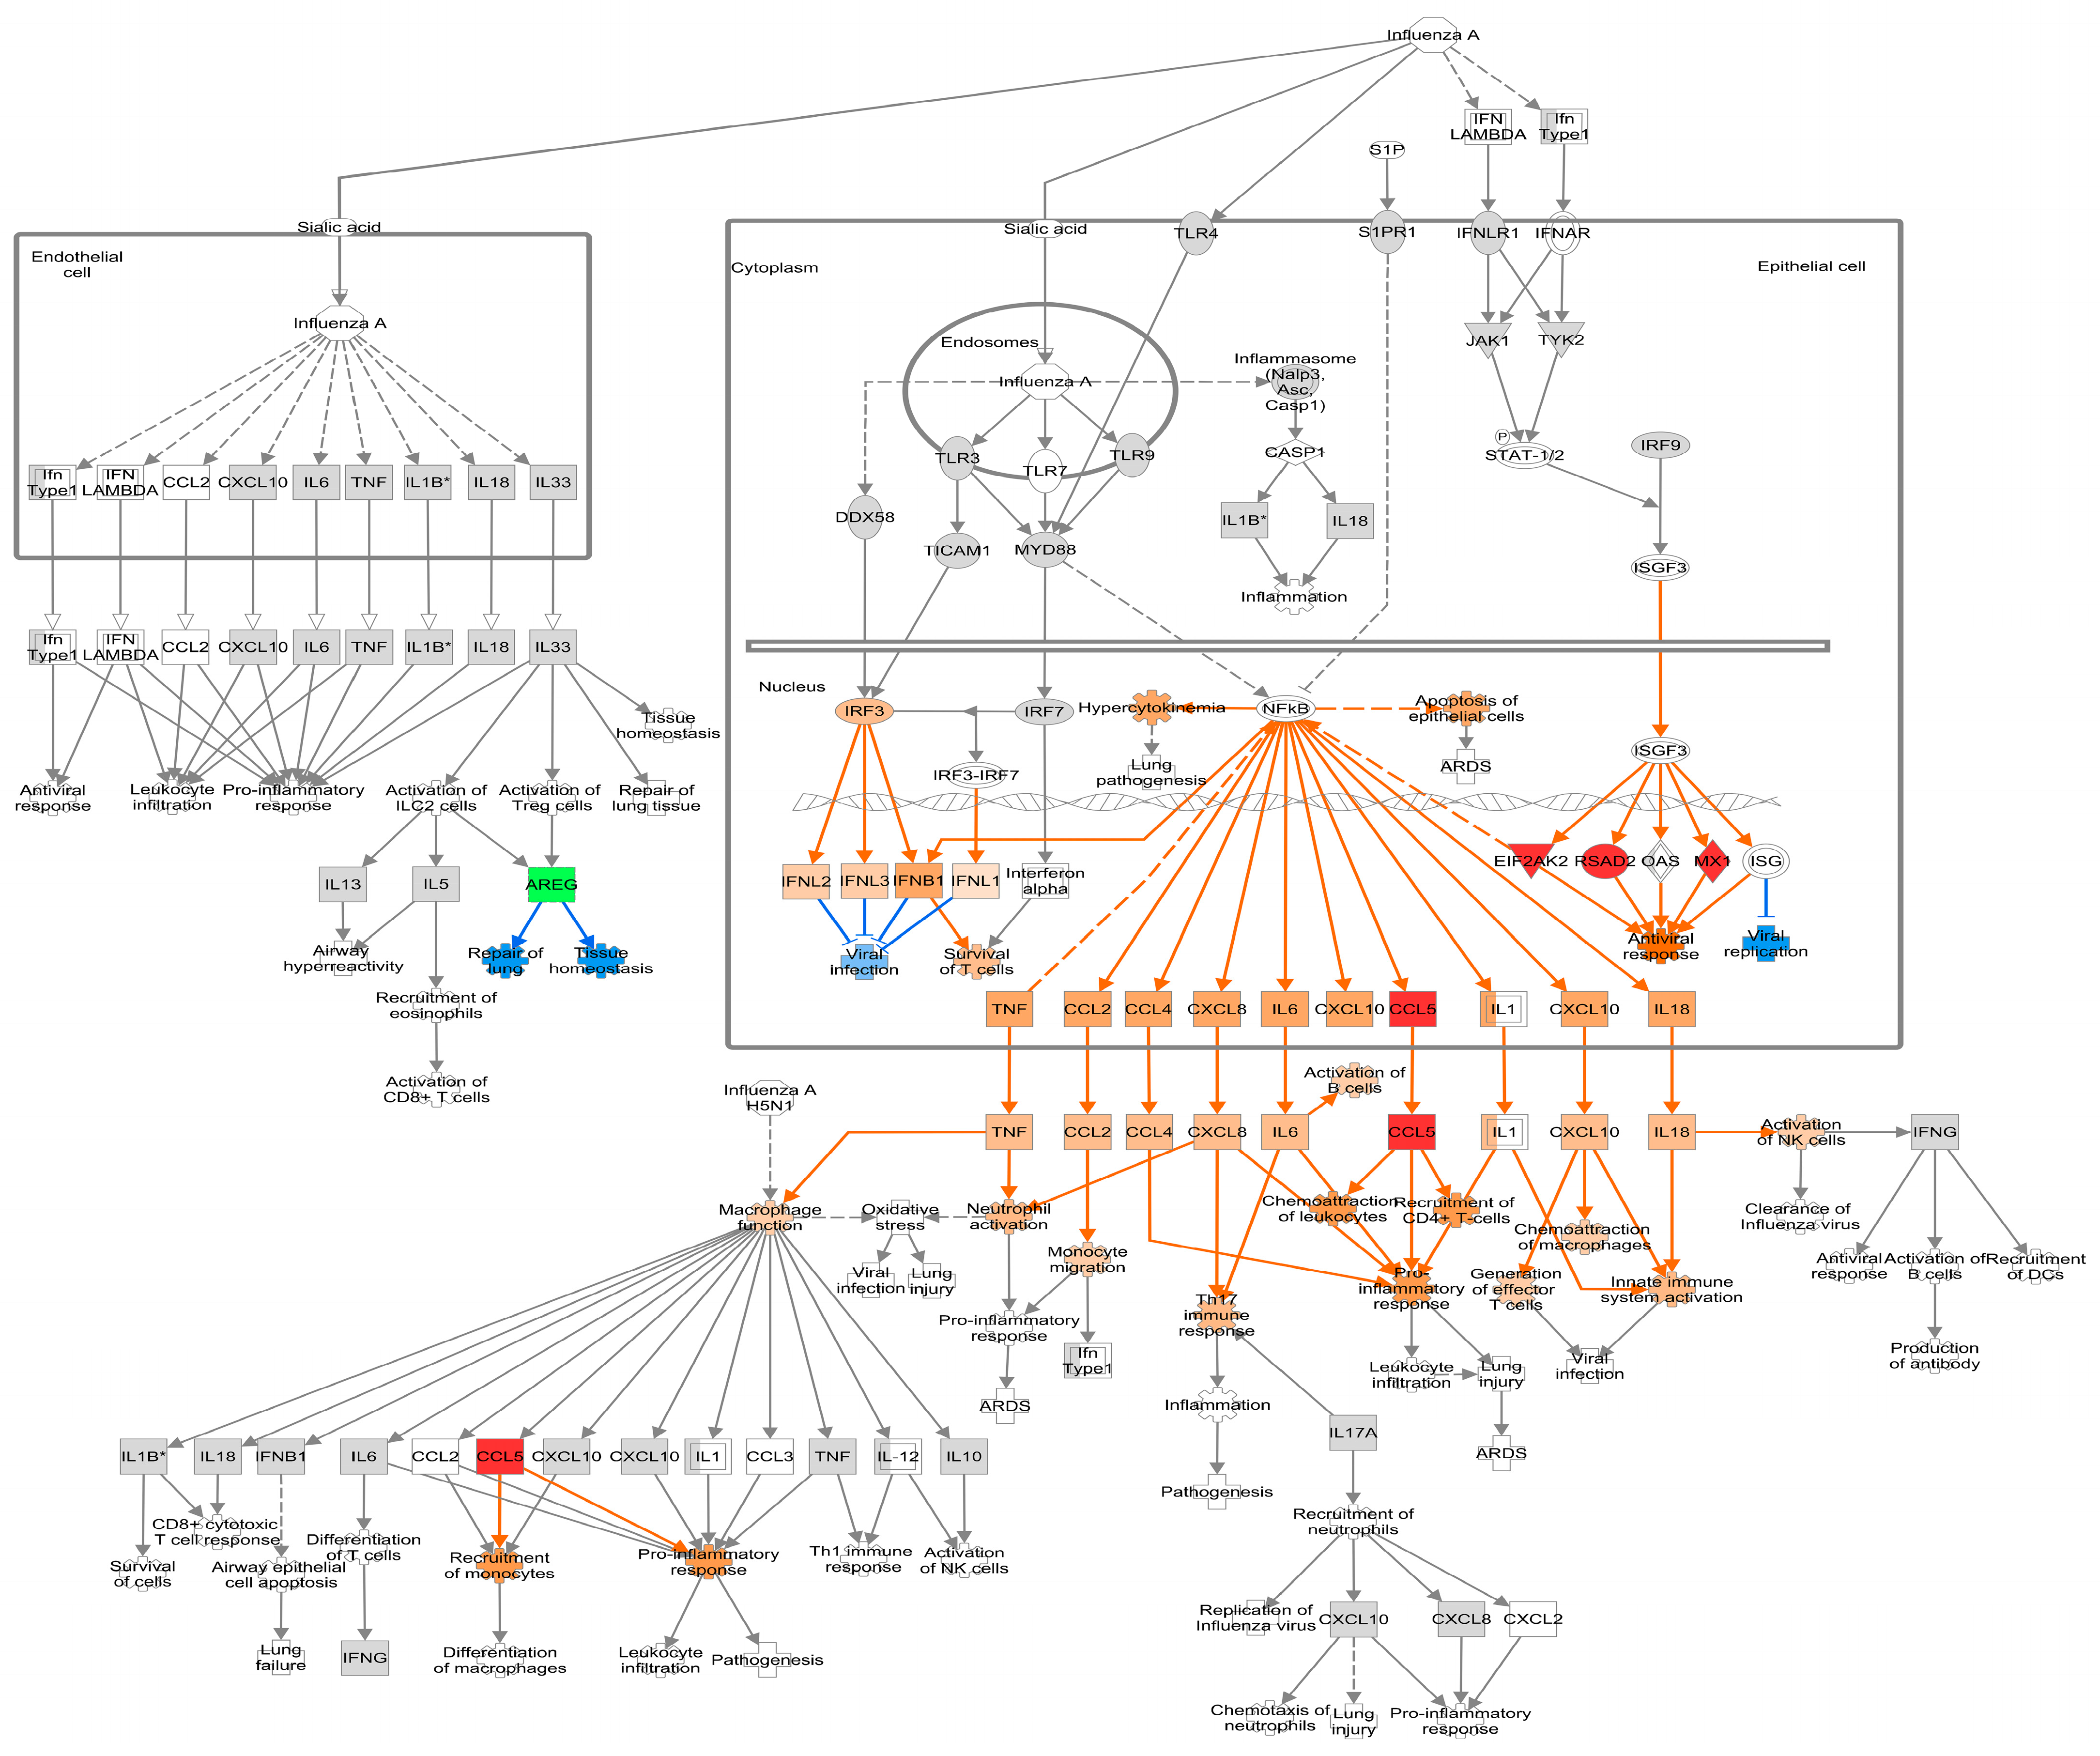
3.4. Pathway Analysis of DEGs Regulated by PHEV in ALI-PRECs

All significant IPA pathways for each timepoint are provided in (Tables S4–S6). A total of 516, 278, and 388 pathways were significantly enriched (p < 0.05) in ALI-PRECs after 24, 36, and 48 hpi with PHEV, respectively. The “Role of Hypercytokinemia and Hyperchemokinemia in the Pathogenesis of Influenza” pathway was significantly enriched with a positive z-score value > 2 at all three time points, thus implying an overall pathway activation (Tables S4–S6). It is beyond the scope of this study to analyze and discuss all the differentially regulated pathways. A pathway-associated analysis with a well-researched influenza virus, also a respiratory virus affecting airway epithelial cells, is ideal for focusing on the current results and discussion.

3.4.1. Early Infection

Following PHEV infection in ALI-PRECs, at 24 hpi, genes associated with the recognition of viral RNA (ZNFX1) [31] and transmembrane proteins associated with transcytosis of immune complexes (PIGR) were all upregulated >2 log2 fold change (FC) (Table S1). PHEV-induced a robust antiviral response by upregulating several interferon-inducible genes such as RSAD2, CMPK2, OAS2, OASL, MX1, MX2, PARP14, GBP1, IFIT1, UBE2L6/RIG-B, MDA5/IFIH1, EIF2AK2/PKR, and ISG15 (Figure 4 and Table S1). While most of them were associated with the type 1 interferon response, RSAD2 induced by type I and type II interferon [32] had >3 log2 FC at 24 hpi (Table S1). The early antiviral activity in ALI-PRECs was further evident by the upregulation of HERC5, HERC6, and zinc finger gene ZC3HAV1 (Table S1), which inhibit viral replication [33,34,35]. Visualizing these DEGs at 24 hpi, using the “Role of Hypercytokinemia and Hyperchemokinemia in the Pathogenesis of Influenza” pathway, predicts that robust antiviral gene modulation could be through IRF3/IRF7 and other mediators of ISGF3. In addition, the pro-inflammatory response is predicted to be mediated through NFkB signaling (Figure 4).

3.4.2. Mid Infection

Antigen-presenting markers TNFSF9, CD40, and CD86 were upregulated by 36 hpi (Table S2). The levels of zinc finger genes associated with antiviral activity, ZC3HAV1, ZC3H12A, and ZC3H12C, were also elevated along with DEFB1, an antimicrobial gene. In ALI-PRECs, the antiviral response and inhibitors of viral replication continued at 36 hpi with increased expression of RSAD2, CMPK2, OASL, OAS2, MX1, MX2, PARP14, GBP1, EIF2AK2/PKR, IFIT1, ISG15, MDA5/IFIH1, UBE2L6/RIG-B, and TRIM22, [36,37] as well as HERC5, HERC6, and ZNFX1 (Table S2). The prediction of IRF3/IRF7 role in the transcriptional activation of interferon-stimulated genes (ISG) and antiviral response by IPA analysis at 24 hpi was indeed confirmed by a 1.5-fold change upregulation of IRF7 at 36 hpi (Figure 5 and Table S2). The strong type I IFN response also increased STAT1 and CD274/PD-L1 DEG levels, and their expression is positively correlated [38]. The synergism of IFN response, STAT1 expression, and upregulation of TNFAIP3, an NFκB inhibitor, can lead to an induced CCL5 and CXCL10. In addition, the continued upregulation of CCL5 and CXCL10 further activates the pro-inflammatory responses, leukocyte infiltration, chemoattraction of macrophages, generation of effector T cells, and innate immune system activation as predicted by IPA analysis (Figure 5). However, the upregulation of CXCL10 and activation of the pro-inflammatory response can lead to lung injury. Remarkably, one of the most downregulated genes at 36 hpi is CILK1 (−1.96 log2FC; Table S2), which is involved in ciliopathies [39].

3.4.3. Late Infection

A solid antiviral response continued at 48 hpi (Figure 6 and Table S3). Several interferon stimulatory genes, TNFAIP3, STAT1, CXCL10, and CXCL11, were upregulated with predicted pro-inflammatory and chemokine activation. The active inflammatory response was further evident by the downmodulation of regulators of inflammation, MRC1/CD206, an inflammation resolution marker, and MARCO, a scavenger receptor. All genes (ROPN1L, RSPH1, PACRG, SPA17, DNAH11, LRRC23, LRRC49, and LRRC51) related to ciliary motility were significantly downregulated < −1 log2FC (Table S3). The expression of CILK1 was significantly increased (1.72 log2FC), and CD164L2, a sialomucin-like 2 protein, was downregulated (−1.71 log2FC) by 48 hpi. Finally, the upregulation of the AREG gene was predicted to be involved in the repair of lung and tissue homeostasis, possibly indicating a recovery response.
The RNA-seq data were further confirmed by normalized qPCR data analysis of MDA5, STAT1, Mx1, CXCL10, and CCL5 genes (Figure 7). The expression of PRR, MDA5, was observed as early as 24 hpi and the expression was significant (p value  <  0.05) by 48 hpi (Figure 7A). The Jak-STAT signaling molecule STAT1 gene was significantly (p value  <  0.005) upregulated at both 36 and 48 hpi in ALI-PRECs following infection with PHEV (Figure 7B). The interferon stimulatory genes, Mx1 and chemokine CXCL10, were upregulated considerably by 24 hpi and continued into 48 hpi (Figure 7C,D), while upregulation of CCL5 was significant (p value  <  0.05) at 48 hpi (Figure 7E).

4. Discussion

The present study further confirms previous work that ALI-PRECs constitute an excellent ex vivo infection model to study early innate immune responses against PHEV [20]. Here, we explored the transcriptome-wide differences during PHEV infection using RNA-seq analysis. The use of ALI-PREC cultures allowed for a time-course analysis of response to PHEV infection, recapitulating a cell culture environment morphologically and functionally more representative of the epithelial lining of the swine trachea than traditional culture systems [14,20]. As in the upper respiratory tract in vivo, PHEV replicated actively in this environment, inducing cytopathic changes and progressive disruption of the mucociliary apparatus systems [14,20]. These changes were also evident at the transcriptomic level throughout the experimental timeline, especially at 48 hpi. For instance, CILK1, which is involved in ciliopathies [39], was downregulated at 36 hpi, and eight genes associated with motile cilium, ROPN1L, RSPH1, PACRG, SPA17, DNAH11, LRRC23, LRRC49, and LRRC51 were also downregulated at 48 hpi [40,41,42]. ALI-PRECs were previously shown to produce acidic mucins, and PHEV infection caused a reduction in mucus at 48 hpi [20]. Here, we found that PHEV infection results in a transcriptional decrease of CD164 sialomucin-like 2 proteins (CD164L2) at 48 hpi, further supporting our previous study. CD164 is a type I integral transmembrane sialomucin that functions as an adhesion receptor [43]. Recent studies have identified sialomucin CD164 as an essential viral entry factor for the lymphocytic choriomeningitis virus [44]. However, the specific role of CD164 during PHEV infection remains unknown.

4.1. Pattern Recognition Receptors on ALI-PRECs Possibly Initiates a Robust Antiviral Response during PHEV Infection

Respiratory epithelial cells are one of the first cells to react and distinguish pathogens using an array of PRRs, which include TLRs, nucleotide-binding and oligomerization domain (NODs)-like receptors (NLRs), RIG-I-like receptors (RLRs), membrane C-type lectin receptors (CLRs), and DNA receptors, that recognize and distinguish pathogen-associated molecular patterns (PAMPs). Thereby triggering a downstream signaling event leading to the transcriptional upregulation of an inflammatory and antiviral response. In fact, at 36 hpi, the most significant GO functional group by kappa score was the PRR signaling pathway, with 23.53% of significantly enriched GO terms.
At 24 hpi, PHEV triggered mostly PRR molecules associated with the RLR pathway in ALI-PRECs, i.e., RSAD2, ZNFX1, OAS2, OASL, MX1, MX2, PKR/EIF2AK2, IFIT1, ISG15, and MDA5/IFIH1. An increase in the expression of IFIH1 in PHEV-infected ALI-PRECs was also reported previously based on qPCR analysis [20]. ZNFX1 and MDA5 detect viral RNA and initiate signaling cascades [31,45], which has been shown to activate type I IFN and inflammatory cytokine production, even in other porcine coronaviruses [46,47]. During viral infection, MDA5 levels are also enhanced by the activation of PKR [48], which is encoded by the gene EIF2AK2 [49]. Activation of PKR mediates the activation of NF-kB, apoptosis, and the antiviral response [49]. With the accumulation of viral dsRNA in infected cells, PKR phosphorylation will, in turn, inhibit the translation of viral RNA [50,51], and PKR was significantly upregulated at 24 and 36 hpi. A noncanonical sensor for RNA viruses that initiates type 1 IFN response is PARP9, and deletion of PARP9 in human immune cells inhibits type 1 IFN response during reovirus infection [52]. At 36 hpi, the expression of PARP9 and DTX3L increased >1 log2FC (Table S2). A hyperactive IFN response can induce PARP9 and DTX3L, binding to form PARP9-DTX3L, an E3 ubiquitin ligase complex, which can promote ISG expression and disrupt viral assembly. PARP9-DTX3L complex with STAT1 can enhance downstream interferon efficacy and can favor host defense more so when there is an increased expression [53]. STAT1, a key functional component of the IFN signaling pathway, is upregulated at 36 and 48 hpi by increased IRF7 expression at 36 hpi. Notably, some of these genes (e.g., IFN, STAT, OAS, MX, IL-8, and CXCL10) were previously reported upregulated (qPCR) in trachea tissues from neonatal piglets infected with PHEV under experimental conditions [14].
The cell surface of ALI-PRECs contain other receptors such as HERC5, HERC6, ZNFX1, ZC3HAV1, ZC3H12A, ZC3H12C, DEFB1, TNFSF9, CD40, and CD86, based on current transcriptome data (Tables S1–S3). All these genes were differentially regulated and involved in viral detection, initiation of antiviral response, antigen presentation, transcytosis of immune complexes, inhibition of viral replication, and initiation of the phagocytosis response RNA response [31,33,34,35]. PHEV infection also triggered a response associated with phagocytosis in ALI-PRECs with the modulation of cell surface receptors, CD274 (PD-L1), B2M (subunit of MHC-1), CD24, CD206/MRC1 (C-type lectin receptor), and MARCO [54,55,56,57,58]. An increase in CD274, B2M at 36 hpi and ~2log2FC increase of CD24 at 48 hpi (phagocytosis inhibitors), in conjunction with downmodulation (−1.5 log2FC) of scavenger receptors CD206/MRC1 and MARCO at 48 hpi is an indication that ALI-PRECs express a “don’t eat me signal” during PHEV infection. In severe human cases of SARS-CoV-2, MARCO-positive alveolar macrophages were depleted [59], which may be a consequence of betacoronavirus infection. APOBEC1 is shown to edit mRNA transcripts, leading to altered cellular function [60]. Similarly, APOBEC1 can cause host-driven editing of viral RNA, including SARS-CoV-2, leading to C-to-U substitution mutations that can impact viral replication and viral progeny production [61,62]. In ALI-PRECs infected with PHEV, APOBEC1 upregulated (>1.0 log2FC) at 36 and 48 hpi, leading to possible mutations in PHEV RNA, but further studies are warranted to confirm the above findings.

4.2. Interferon Response in ALI-PRECs and the Role of RSAD2 following PHEV Infection

During infection, i.e., 24 to 48 hpi, PHEV significantly enhanced the number of DEGs in ALI-PRECs with expression mostly belonging to IFN functional groups. Several ISGs were differentially expressed in this study, including OAS2, OASL, MX1, MX2, ISG15, IFIT1, PARP14, GBP1, RIG-B, TRIM22, CMPK2, and RSAD2, as shown in Figure 4, Figure 5 and Figure 6 and Tables S1–S3.
PHEV PAMPs, upon binding to the PRRs, activate ISGs such as OAS2 (also known as 2′-5OAS, 2′-5-oligoadenylate synthase 2), which plays a vital role in the interferon-mediated antiviral pathway [63]. The porcine OAS family consists of three functional genes (OAS1a, OAS1b, and OAS2) encoding active enzymes to catalyze adenosine triphosphate in 2′-specific nucleotidyl transfer reactions to synthesize 2′,5′-oligoadenylates (2–5 As) [63,64]. Another OAS homolog, OASL, has dual functions that depend on the phase of viral infection and various mechanisms and is postulated to interfere with the 2–5 A and RNase L pathway [65]. The OAS family members activate latent RNase L, and antiviral activity mediates through the OAS/RNase L pathway, an interferon effector pathway that induces viral RNA degradation and inhibits viral replication [66]. Both in ALI-PRECs and porcine tracheal tissue, a significant increase in the expression of OAS1 in response to PHEV infection has previously been reported [20]. Similarly, in the current study, a significant upregulation (≥2 log2FC) of OAS2 and OASL was consistent at all three time points, while RNASEL was upregulated (>1 log2FC) alongside OAS genes at 36 hpi. Recent findings in multisystem inflammatory syndrome in children with SARS-CoV-2 demonstrate that genetic deficiencies of OAS1, OAS2, or RNase L displayed exaggerated inflammatory responses [67]. It will be interesting to evaluate the role of the OAS/RNase L pathway in mediating the cytokine response during PHEV infection.
Interferon-induced Mx GTPases, MX1 and MX2, were also significantly upregulated (>1.5 log2FC) at all three time points. The crucial role of MX1 in influenza resistance has been well documented in mouse and human studies, where it was shown to prevent the transcription and replication of viruses that utilize nuclear replication by preventing the transcription of viral RNA polymerase [68]. Again, MX1 upregulation was also reported in PHEV infected ALI-PRECs and porcine tracheal tissues [20]. Although the exact role of MX1 in inhibiting PHEV is not yet fully understood, higher levels of expression of MX1 in the blood have been associated with a reduced risk of developing severe disease in SARS-CoV-2 infections [69]. While not as well studied as MX1, IFIT1 encodes for a family of IFN-induced proteins with tetratricopeptide repeats that are induced after viral infection or PAMP recognition [70]. These proteins inhibit the replication of multiple families of viruses through distinct mechanisms, including translation inhibition, recognizing a lack of 2′-O methylation, 5′-ppp RNA recognition, and binding to viral proteins [70].
ISG15 gene is critical in host antiviral response with diverse and pathogen-dependent mechanisms to protect the host during infection [71] by conjugating to a wide range of viral and cellular proteins [72]. Many viruses that encode viral proteases have evolved mechanisms to reverse ISG15 conjugation from viral target proteins, including the betacoronaviruses SARS-CoV and MERS-CoV [71,72]. ISG15 can be associated with HERC5, IFIT1, PKR, and TRIM25 and enhance antiviral signaling by prolonging the state of signaling proteins such as IRF3 and STAT1 or can inhibit activation state by reversing the ISGylation via USP18 [72,73]. PHEV significantly upregulated ISG15 expression (>1.5 log2FC) at all three time points, and it appears ISG15 does interact with HERC5, IFIT1, PKR, TRIM25, STAT1, and USP18, as their expression was also enhanced (>1.0 log2FC) at various timepoints during ALI-PRECs infection (Tables S1–S3). However, the interactions of ISG15 with various cellular and viral proteins during PHEV infection. An enhanced expression of pattern recognition receptors such as TRIM25, TRIM38, MDA5/IFIH1, and DDX58 can also increase IRF7, a regulator of type 1 IFN response [36,74,75,76].
The PAMPs of PHEV also activated RSAD2 or viperin and CMPK2 in ALI-PRECs at all three time points. In humans, both RSAD2 and CMPK2 are adjacent to each other in the short arm of chromosome 2, and both are induced by IFN signaling (reviewed by [77]). RSAD2 aids in the production of 3′-deoxy-3′, 4′-dihydro-CTP (ddhCTP) that causes premature termination of RNA synthesis by acting as a chain terminator for the viral RNA-dependent RNA polymerase (RdRP) of some viruses [77]. CMPK2 has been implicated as an antiviral gene with activity against multiple coronaviruses [78]. A co-expression of CMPK2 along with RSAD2 further enhances the ddhCTP production, and it is speculated that they may play a role in inflammation. RSAD2 is highly conserved in mammalian evolution, and a number of overexpression and knockdown experiments have demonstrated its importance in antiviral activity [77,79], including members of the Coronaviridae family [80]. For example, RSAD2 has been shown to inhibit replication of the coronavirus porcine epidemic diarrhea virus (PEDV), which is believed to be a result of the interaction of the RSAD2 S-adenosylmethionine domain with the N protein of PEDV [81]. While the role of host cell antiviral responses is comparatively well characterized in other porcine coronaviruses [82,83,84], additional studies are required to delineate the antiviral responses in PHEV infection.

4.3. Chemokine Response

In addition to inhibiting viral replication by the interferon response, ALI-PRECs strongly expressed the chemokines CCL5/RANTES and CXCL10/IP-10 following PHEV infection. Both of these chemokines were previously reported to be upregulated in PHEV-infected ALI-PRECs by qPCR studies [20]. In the present study, CCL5 was significantly upregulated at 24 and 36 hpi, and CXCL10 was significantly upregulated at 36 and 48 hpi, as shown in Figure 4, Figure 5 and Figure 6. Activation of chemokines is a classic response during infection, which mediates immune cell trafficking with potential impacts on pathogenesis, virus replication, virus clearance, and healing. Low levels of CCL5 and a high SARS-CoV-2 viral load were associated with the severity of COVID-19 disease [85]. Virus-infected cell clearance is impaired in influenza infected mice lacking CCL5 or by blocking CCL5 during respiratory syncytial virus infection, causing further tissue damage and a pro-inflammatory response [86,87]. Similarly, in mice infected with the betacoronavirus murine hepatitis virus (MHV), the absence of CXCL10 is associated with increased virus titers and high mortality [88]. In addition, CXCL10 was demonstrated to limit the spread of MHV infection [89]. Both CCL5 and CXCL10 were reported to be predictive biomarkers for clinical outcomes of COVID-19, and it appears this observation can be broadly applied to other betacoronaviruses, including PHEV.

5. Conclusions

This is the first study to apply transcriptomic analysis to organotypic cultures of porcine respiratory epithelial cells over the course of infection with the betacoronavirus PHEV. It contributes to understanding the molecular mechanisms driving the early antiviral innate immune response in the respiratory tract with a robust mucociliary response. At this primary site of infection, the overall significant responsive pathways that were activated leading toward an effective response to PHEV include IFN-, PRR-, and chemokine-mediated pathways. Moreover, the results presented herein highlight the vital role of respiratory epithelial cells in maintaining respiratory homeostasis and the initiation, resolution, and outcome of the infection process. Finally, this study further demonstrates the potential of the organotypic respiratory culture system as a robust infection model alternative or as a complement to live animals, which can be readily applied across animal species and pathogens.

Supplementary Materials

The following supporting information can be downloaded at: https://www.mdpi.com/article/10.3390/v16060939/s1, Table S1: 24 hpi DEG; Table S2: 36 hpi DEG; Table S3: 48 hpi DEG; Table S4: 24 hpi Pathways; Table S5: 36 hpi Pathways; Table S6: 48 hpi Pathways.

Author Contributions

Conceptualization, R.K.N., L.G.G.-L., L.C.M. and Y.S.; methodology, R.K.N., L.G.G.-L., K.M.S.D., L.C.M. and J.C.M.-D.; software, K.M.S.D.; validation, R.K.N.; formal analysis, R.K.N. and K.M.S.D.; investigation, R.K.N., L.C.M., L.G.G.-L., Y.S. and K.M.S.D.; resources, R.K.N., L.C.M. and L.G.G.-L.; data curation, R.K.N., L.G.G.-L., K.M.S.D. and L.C.M.; writing—original draft preparation, K.M.S.D. and R.K.N.; writing—review and editing, K.M.S.D., R.K.N., L.C.M., L.G.G.-L., J.C.M.-D. and Y.S.; visualization, K.M.S.D. and R.K.N.; supervision, L.C.M.; project administration, L.G.G.-L.; funding acquisition, R.K.N., L.G.G.-L., Y.S. and L.C.M. All authors have read and agreed to the published version of the manuscript.

Funding

This research received no external funding.

Institutional Review Board Statement

The 7-day-old CDCD piglets (Yorkshire × large white crossbred) used for isolating primary cells was approved by the Institutional Animal Care and Use Committee (IACUC log# 12-17-8658-S; approval date: 3 January 2018) of Iowa State University.

Data Availability Statement

Data are contained within the article or Supplementary Materials. Additional raw data formatted according to the Gene Expression Omnibus (GEO) requirements are available in the NCBI SRA database under BioProject ID PRJNA1029154.l.

Acknowledgments

Thank you to Sarah Anderson for her technical expertise.

Conflicts of Interest

The authors declare no conflicts of interest.

References

  1. Mengeling, W.L.; Cutlip, R.C. Experimentally Induced Infection of Newborn Pigs with Hemagglutinating Encephalomyelitis Virus Strain 67N. Am. J. Vet. Res. 1972, 33, 953–956. [Google Scholar]
  2. Cartwright, S.F.; Lucas, M.; Cavill, J.P.; Gush, A.F.; Blandford, T.B. Vomiting and Wasting Disease of Piglets. Vet. Rec. 1969, 84, 175–176. [Google Scholar] [CrossRef] [PubMed]
  3. Pensaert, M.B.; Callebaut, P.E. Characteristics of a Coronavirus Causing Vomition and Wasting in Pigs. Arch. Gesamte Virusforsch. 1974, 44, 35–50. [Google Scholar] [CrossRef] [PubMed]
  4. Walker, P.J.; Siddell, S.G.; Lefkowitz, E.J.; Mushegian, A.R.; Dempsey, D.M.; Dutilh, B.E.; Harrach, B.; Harrison, R.L.; Hendrickson, R.C.; Junglen, S.; et al. Changes to Virus Taxonomy and the International Code of Virus Classification and Nomenclature Ratified by the International Committee on Taxonomy of Viruses (2019). Arch. Virol. 2019, 164, 2417–2429. [Google Scholar] [CrossRef] [PubMed]
  5. Roe, C.K.; Alexander, T.J. A Disease of Nursing Pigs Previously Unreported in Ontario. Can. J. Comp. Med. Vet. Sci. 1958, 22, 305–307. [Google Scholar] [PubMed]
  6. Greig, A.S.; Mitchell, D.; Corner, A.H.; Bannister, G.L.; Meads, E.B.; Julian, R.J. A Hemagglutinating Virus Producing Encephalomyelitis in Baby Pigs. Can. J. Comp. Med. Vet. Sci. 1962, 26, 49. [Google Scholar] [PubMed]
  7. Quiroga, M.A.; Cappuccio, J.; Piñeyro, P.; Basso, W.; Moré, G.; Kienast, M.; Schonfeld, S.; Cáncer, J.L.; Arauz, S.; Pintos, M.E.; et al. Hemagglutinating Encephalomyelitis Coronavirus Infection in Pigs, Argentina. Emerg. Infect. Dis. 2008, 14, 484–486. [Google Scholar] [CrossRef] [PubMed]
  8. Hirano, N.; Nomura, R.; Tawara, T.; Tohyama, K. Neurotropism of Swine Haemagglutinating Encephalomyelitis Virus (Coronavirus) in Mice Depending upon Host Age and Route of Infection. J. Comp. Pathol. 2004, 130, 58–65. [Google Scholar] [CrossRef] [PubMed]
  9. Yagami, K.; Izumi, Y.; Kajiwara, N.; Sugiyama, F.; Sugiyama, Y. Neurotropism of Mouse-Adapted Haemagglutinating Encephalomyelitis Virus. J. Comp. Pathol. 1993, 109, 21–27. [Google Scholar] [CrossRef]
  10. Appel, M.; Greig, A.S.; Corner, A.H. Encephalomyelitis of Swine Caused by a Haemagglutinating Virus. IV. Transmission Studies. Res. Vet. Sci. 1965, 6, 482–489. [Google Scholar] [CrossRef]
  11. Mora-Díaz, J.C.; Temeeyasen, G.; Magtoto, R.; Rauh, R.; Nelson, W.; Carrillo-Ávila, J.A.; Zimmerman, J.; Piñeyro, P.; Giménez-Lirola, L. Infection and Immune Response to Porcine Hemagglutinating Encephalomyelitis Virus in Grower Pigs. Vet. Microbiol. 2021, 253, 108958. [Google Scholar] [CrossRef] [PubMed]
  12. Meyvisch, C.; Hoorens, J. An Electron Microscopic Study of Experimentally-Induced HEV Encephalitis. Vet. Pathol. 1978, 15, 102–113. [Google Scholar] [CrossRef] [PubMed]
  13. Mengeling, W.L.; Boothe, A.D.; Ritchie, A.E. Characteristics of a Coronavirus (Strain 67N) of Pigs. Am. J. Vet. Res. 1972, 33, 297–308. [Google Scholar] [PubMed]
  14. Mora-Díaz, J.C.; Piñeyro, P.E.; Rauh, R.; Nelson, W.; Sankoh, Z.; Gregg, E.; Carrillo-Ávila, J.A.; Shen, H.; Nelli, R.K.; Zimmerman, J.J.; et al. Porcine Hemagglutinating Encephalomyelitis Virus Infection In Vivo and Ex Vivo. J. Virol. 2021, 95, 12. [Google Scholar] [CrossRef] [PubMed]
  15. Wang, H.; He, L.; Liu, B.; Feng, Y.; Zhou, H.; Zhang, Z.; Wu, Y.; Wang, J.; Gan, Y.; Yuan, T.; et al. Establishment and Comparison of Air-Liquid Interface Culture Systems for Primary and Immortalized Swine Tracheal Epithelial Cells. BMC Cell Biol. 2018, 19, 10. [Google Scholar] [CrossRef]
  16. Wu, N.H.; Yang, W.; Beineke, A.; Dijkman, R.; Matrosovich, M.; Baumgärtner, W.; Thiel, V.; Valentin-Weigand, P.; Meng, F.; Herrler, G. The Differentiated Airway Epithelium Infected by Influenza Viruses Maintains the Barrier Function despite a Dramatic Loss of Ciliated Cells. Sci. Rep. 2016, 6, 39668. [Google Scholar] [CrossRef] [PubMed]
  17. Mao, H.; Wang, Y.; Yuan, W.; Wong, L.B. Ciliogenesis in Cryopreserved Mammalian Tracheal Epithelial Cells Cultured at the Air-Liquid Interface. Cryobiology 2009, 59, 250. [Google Scholar] [CrossRef]
  18. Hewitt, R.J.; Lloyd, C.M. Regulation of Immune Responses by the Airway Epithelial Cell Landscape. Nat. Rev. Immunol. 2021, 21, 347–362. [Google Scholar] [CrossRef]
  19. Holtzman, M.J.; Byers, D.E.; Alexander-Brett, J.; Wang, X. The Role of Airway Epithelial Cells and Innate Immune Cells in Chronic Respiratory Disease. Nat. Rev. Immunol. 2014, 14, 686–698. [Google Scholar] [CrossRef]
  20. Nelli, R.K.; Mora-Díaz, J.C.; Giménez-Lirola, L.G. The Betacoronavirus PHEV Replicates and Disrupts the Respiratory Epithelia and Upregulates Key Pattern Recognition Receptor Genes and Downstream Mediators, Including IL-8 and IFN-λ. mSphere 2021, 6, e00820-2. [Google Scholar] [CrossRef]
  21. Taub, D.D.; Anver, M.; Oppenheim, J.J.; Longo, D.L.; Murphy, W.J. T Lymphocyte Recruitment by Interleukin-8 (IL-8). IL-8-Induced Degranulation of Neutrophils Releases Potent Chemoattractants for Human T Lymphocytes Both In Vitro and In Vivo. J. Clin. Investig. 1996, 97, 1931–1941. [Google Scholar] [CrossRef] [PubMed]
  22. Pace, E.; Gjomarkaj, M.; Melis, M.; Profita, M.; Spatafora, M.; Vignola, A.M.; Bonsignore, G.; Mody, C.H. Interleukin-8 Induces Lymphocyte Chemotaxis into the Pleural Space. Am. J. Respir. Crit. Care Med. 2012, 159, 1592–1599. [Google Scholar] [CrossRef] [PubMed]
  23. Hellemans, J.; Mortier, G.; De Paepe, A.; Speleman, F.; Vandesompele, J. QBase Relative Quantification Framework and Software for Management and Automated Analysis of Real-Time Quantitative PCR Data. Genome Biol. 2008, 8, R19. [Google Scholar] [CrossRef] [PubMed]
  24. Livak, K.J.; Schmittgen, T.D. Analysis of Relative Gene Expression Data Using Real-Time Quantitative PCR and the 2−ΔΔCT Method. Methods 2001, 25, 402–408. [Google Scholar] [CrossRef] [PubMed]
  25. Bolger, A.M.; Lohse, M.; Usadel, B. Trimmomatic: A Flexible Trimmer for Illumina Sequence Data. Bioinformatics 2014, 30, 2114–2120. [Google Scholar] [CrossRef] [PubMed]
  26. Kim, D.; Paggi, J.M.; Park, C.; Bennett, C.; Salzberg, S.L. Graph-Based Genome Alignment and Genotyping with HISAT2 and HISAT-Genotype. Nat. Biotechnol. 2019, 37, 907–915. [Google Scholar] [CrossRef]
  27. Kim, D.; Langmead, B.; Salzberg, S.L. HISAT: A Fast Spliced Aligner with Low Memory Requirements. Nat. Methods 2015, 12, 357–360. [Google Scholar] [CrossRef] [PubMed]
  28. Love, M.I.; Huber, W.; Anders, S. Moderated Estimation of Fold Change and Dispersion for RNA-Seq Data with DESeq2. Genome Biol. 2014, 15, 550. [Google Scholar] [CrossRef]
  29. Bindea, G.; Mlecnik, B.; Hackl, H.; Charoentong, P.; Tosolini, M.; Kirilovsky, A.; Fridman, W.H.; Pagès, F.; Trajanoski, Z.; Galon, J. ClueGO: A Cytoscape Plug-in to Decipher Functionally Grouped Gene Ontology and Pathway Annotation Networks. Bioinformatics 2009, 25, 1091–1093. [Google Scholar] [CrossRef]
  30. Chen, Y.G.; Hur, S. Cellular Origins of DsRNA, Their Recognition and Consequences. Nat. Rev. Mol. Cell Biol. 2021, 23, 286–301. [Google Scholar] [CrossRef]
  31. Wang, Y.; Yuan, S.; Jia, X.; Ge, Y.; Ling, T.; Nie, M.; Lan, X.; Chen, S.; Xu, A. Mitochondria-Localised ZNFX1 Functions as a DsRNA Sensor to Initiate Antiviral Responses through MAVS. Nat. Cell Biol. 2019, 21, 1346–1356. [Google Scholar] [CrossRef] [PubMed]
  32. Yuan, Y.; Miao, Y.; Qian, L.; Zhang, Y.; Liu, C.; Liu, J.; Zuo, Y.; Feng, Q.; Guo, T.; Zhang, L.; et al. Targeting UBE4A Revives Viperin Protein in Epithelium to Enhance Host Antiviral Defense. Mol. Cell 2020, 77, 734–747.e7. [Google Scholar] [CrossRef] [PubMed]
  33. Bick, M.J.; Carroll, J.-W.N.; Gao, G.; Goff, S.P.; Rice, C.M.; MacDonald, M.R. Expression of the Zinc-Finger Antiviral Protein Inhibits Alphavirus Replication. J. Virol. 2003, 77, 11555. [Google Scholar] [CrossRef] [PubMed]
  34. Jacquet, S.; Pontier, D.; Etienne, L. Rapid Evolution of HERC6 and Duplication of a Chimeric HERC5/6 Gene in Rodents and Bats Suggest an Overlooked Role of HERCs in Mammalian Immunity. Front. Immunol. 2020, 11, 3232. [Google Scholar] [CrossRef]
  35. Dastur, A.; Beaudenon, S.; Kelley, M.; Krug, R.M.; Huibregtse, J.M. Herc5, an Interferon-Induced HECT E3 Enzyme, Is Required for Conjugation of ISG15 in Human Cells. J. Biol. Chem. 2006, 281, 4334–4338. [Google Scholar] [CrossRef] [PubMed]
  36. Bourdon, M.; Manet, C.; Montagutelli, X. Host Genetic Susceptibility to Viral Infections: The Role of Type I Interferon Induction. Genes. Immun. 2020, 21, 365. [Google Scholar] [CrossRef] [PubMed]
  37. Charman, M.; McFarlane, S.; Wojtus, J.K.; Sloan, E.; Dewar, R.; Leeming, G.; Al-Saadi, M.; Hunter, L.; Carroll, M.W.; Stewart, J.P.; et al. Constitutive TRIM22 Expression in the Respiratory Tract Confers a Pre-Existing Defence Against Influenza A Virus Infection. Front. Cell. Infect. Microbiol. 2021, 11, 689707. [Google Scholar] [CrossRef]
  38. Sasidharan Nair, V.; Toor, S.M.; Ali, B.R.; Elkord, E. Dual Inhibition of STAT1 and STAT3 Activation Downregulates Expression of PD-L1 in Human Breast Cancer Cells. Expert Opin. Ther. Targets 2018, 22, 547–557. [Google Scholar] [CrossRef] [PubMed]
  39. Fu, Z.; Gailey, C.D.; Wang, E.J.; Brautigan, D.L. Ciliogenesis Associated Kinase 1 (CILK1): Targets and Functions in Various Organ Systems. FEBS Lett. 2019, 593, 2990. [Google Scholar] [CrossRef]
  40. Schultz, R.; Elenius, V.; Lukkarinen, H.; Saarela, T. Two Novel Mutations in the DNAH11 Gene in Primary Ciliary Dyskinesia (CILD7) with Considerable Variety in the Clinical and Beating Cilia Phenotype. BMC Med. Genet. 2020, 21, 237. [Google Scholar] [CrossRef]
  41. Hoh, R. The Ciliated Cell Transcriptome; Stanford University: Stanford, CA, USA, 2010. [Google Scholar]
  42. Fiedler, S.E.; Dudiki, T.; Vijayaraghavan, S.; Carr, D.W. Loss of R2D2 Proteins ROPN1 and ROPN1L Causes Defects in Murine Sperm Motility, Phosphorylation, and Fibrous Sheath Integrity. Biol. Reprod. 2013, 88, 41–42. [Google Scholar] [CrossRef] [PubMed]
  43. Watt, S.M.; Bühring, H.-J.; Rappold, I.; Chan, J.Y.-H.; Lee-Prudhoe, J.; Jones, T.; Zannettino, A.C.W.; Simmons, P.J.; Doyonnas, R.; Sheer, D.; et al. CD164, a Novel Sialomucin on CD34+ and Erythroid Subsets, Is Located on Human Chromosome 6q21. Blood 1998, 92, 849–866. [Google Scholar] [CrossRef]
  44. Liu, J.; Knopp, K.A.; Rackaityte, E.; Wang, C.Y.; Laurie, M.T.; Sunshine, S.; Puschnik, A.S.; DeRisi, J.L. Genome-Wide Knockout Screen Identifies Human Sialomucin CD164 as an Essential Entry Factor for Lymphocytic Choriomeningitis Virus. mBio 2022, 13, e00205-22. [Google Scholar] [CrossRef] [PubMed]
  45. Züst, R.; Cervantes-Barragan, L.; Habjan, M.; Maier, R.; Neuman, B.W.; Ziebuhr, J.; Szretter, K.J.; Baker, S.C.; Barchet, W.; Diamond, M.S.; et al. Ribose 2′-O-Methylation Provides a Molecular Signature for the Distinction of Self and Non-Self MRNA Dependent on the RNA Sensor Mda5. Nat. Immunol. 2011, 12, 137–143. [Google Scholar] [CrossRef] [PubMed]
  46. Zhang, J.; Fang, P.; Ren, J.; Xia, S.; Zhang, H.; Zhu, X.; Ding, T.; Xiao, S.; Fang, L. Porcine Epidemic Diarrhea Virus Nsp7 Inhibits MDA5 Dephosphorylation to Antagonize Type I Interferon Production. Microbiol. Spectr. 2023, 11, e05017-22. [Google Scholar] [CrossRef] [PubMed]
  47. Fang, P.; Fang, L.; Ren, J.; Hong, Y.; Liu, X.; Zhao, Y.; Wang, D.; Peng, G.; Xiao, S. Porcine Deltacoronavirus Accessory Protein NS6 Antagonizes Interferon Beta Production by Interfering with the Binding of RIG-I/MDA5 to Double-Stranded RNA. J. Virol. 2018, 92, 15. [Google Scholar] [CrossRef] [PubMed]
  48. Pham, A.M.; Santa Maria, F.G.; Lahiri, T.; Friedman, E.; Marié, I.J.; Levy, D.E. PKR Transduces MDA5-Dependent Signals for Type I IFN Induction. PLoS Pathog. 2016, 12, e1005489. [Google Scholar] [CrossRef] [PubMed]
  49. Gal-Ben-Ari, S.; Barrera, I.; Ehrlich, M.; Rosenblum, K. PKR: A Kinase to Remember. Front. Mol. Neurosci. 2019, 11, 480. [Google Scholar] [CrossRef] [PubMed]
  50. Sadler, A.J.; Latchoumanin, O.; Hawkes, D.; Mak, J.; Williams, B.R.G. An Antiviral Response Directed by PKR Phosphorylation of the RNA Helicase A. PLoS Pathog. 2009, 5, e1000311. [Google Scholar] [CrossRef]
  51. García, M.A.; Gil, J.; Ventoso, I.; Guerra, S.; Domingo, E.; Rivas, C.; Esteban, M. Impact of Protein Kinase PKR in Cell Biology: From Antiviral to Antiproliferative Action. Microbiol. Mol. Biol. Rev. 2006, 70, 1032. [Google Scholar] [CrossRef]
  52. Xing, J.; Zhang, A.; Du, Y.; Fang, M.; Minze, L.J.; Liu, Y.J.; Li, X.C.; Zhang, Z. Identification of Poly(ADP-Ribose) Polymerase 9 (PARP9) as a Noncanonical Sensor for RNA Virus in Dendritic Cells. Nat. Commun. 2021, 12, 2681. [Google Scholar] [CrossRef]
  53. Zhang, Y.; Mao, D.; Roswit, W.T.; Jin, X.; Patel, A.C.; Patel, D.A.; Agapov, E.; Wang, Z.; Tidwell, R.M.; Atkinson, J.J.; et al. PARP9-DTX3L Ubiquitin Ligase Targets Host Histone H2BJ and Viral 3C Protease to Enhance Interferon Signaling and Control Viral Infection. Nat. Immunol. 2015, 16, 1215–1227. [Google Scholar] [CrossRef] [PubMed]
  54. Xing, Q.; Feng, Y.; Sun, H.; Yang, S.; Sun, T.; Guo, X.; Ji, F.; Wu, B.; Zhou, D. Scavenger Receptor MARCO Contributes to Macrophage Phagocytosis and Clearance of Tumor Cells. Exp. Cell Res. 2021, 408, 112862. [Google Scholar] [CrossRef]
  55. Barkal, A.A.; Brewer, R.E.; Markovic, M.; Kowarsky, M.; Barkal, S.A.; Zaro, B.W.; Krishnan, V.; Hatakeyama, J.; Dorigo, O.; Barkal, L.J.; et al. CD24 Signalling through Macrophage Siglec-10 Is a Target for Cancer Immunotherapy. Nature 2019, 572, 392–396. [Google Scholar] [CrossRef] [PubMed]
  56. Gordon, S.R.; Maute, R.L.; Dulken, B.W.; Hutter, G.; George, B.M.; McCracken, M.N.; Gupta, R.; Tsai, J.M.; Sinha, R.; Corey, D.; et al. PD-1 Expression by Tumour-Associated Macrophages Inhibits Phagocytosis and Tumour Immunity. Nature 2017, 545, 495–499. [Google Scholar] [CrossRef]
  57. Shi, B.; Chu, J.; Huang, T.; Wang, X.; Li, Q.; Gao, Q.; Xia, Q.; Luo, S. The Scavenger Receptor MARCO Expressed by Tumor-Associated Macrophages Are Highly Associated With Poor Pancreatic Cancer Prognosis. Front. Oncol. 2021, 11, 4518. [Google Scholar] [CrossRef]
  58. Schulz, D.; Severin, Y.; Zanotelli, V.R.T.; Bodenmiller, B. In-Depth Characterization of Monocyte-Derived Macrophages Using a Mass Cytometry-Based Phagocytosis Assay. Sci. Rep. 2019, 9, 1925. [Google Scholar] [CrossRef]
  59. Liao, M.; Liu, Y.; Yuan, J.; Wen, Y.; Xu, G.; Zhao, J.; Cheng, L.; Li, J.; Wang, X.; Wang, F.; et al. Single-Cell Landscape of Bronchoalveolar Immune Cells in Patients with COVID-19. Nat. Med. 2020, 26, 842–844. [Google Scholar] [CrossRef]
  60. Cole, D.C.; Chung, Y.; Gagnidze, K.; Hajdarovic, K.H.; Rayon-Estrada, V.; Harjanto, D.; Bigio, B.; Gal-Toth, J.; Milner, T.A.; McEwen, B.S.; et al. Loss of APOBEC1 RNA-Editing Function in Microglia Exacerbates Age-Related CNS Pathophysiology. Proc. Natl. Acad. Sci. USA 2017, 114, 13272–13277. [Google Scholar] [CrossRef]
  61. Kim, K.; Calabrese, P.; Wang, S.; Qin, C.; Rao, Y.; Feng, P.; Chen, X.S. The Roles of APOBEC-Mediated RNA Editing in SARS-CoV-2 Mutations, Replication and Fitness. Sci. Rep. 2022, 12, 14972. [Google Scholar] [CrossRef]
  62. Mourier, T.; Sadykov, M.; Carr, M.J.; Gonzalez, G.; Hall, W.W.; Pain, A. Host-Directed Editing of the SARS-CoV-2 Genome. Biochem. Biophys. Res. Commun. 2021, 538, 35–39. [Google Scholar] [CrossRef] [PubMed]
  63. Perelygin, A.A.; Zharkikh, A.A.; Scherbik, S.V.; Brinton, M.A. The Mammalian 2′-5′ Oligoadenylate Synthetase Gene Family: Evidence for Concerted Evolution of Paralogous Oas1 Genes in Rodentia and Artiodactyla. J. Mol. Evol. 2006, 63, 562–576. [Google Scholar] [CrossRef]
  64. Melchjorsen, J.; Kristiansen, H.; Christiansen, R.; Rintahaka, J.; Matikainen, S.; Paludan, S.R.; Hartmann, R. Differential Regulation of the OASL and OAS1 Genes in Response to Viral Infections. J. Interf. Cytokine Res. 2009, 29, 199–207. [Google Scholar] [CrossRef] [PubMed]
  65. Choi, U.Y.; Kang, J.S.; Hwang, Y.S.; Kim, Y.J. Oligoadenylate Synthase-like (OASL) Proteins: Dual Functions and Associations with Diseases. Exp. Mol. Med. 2015, 47, e144. [Google Scholar] [CrossRef]
  66. Drappier, M.; Michiels, T. Inhibition of the OAS/RNase L Pathway by Viruses. Curr. Opin. Virol. 2015, 15, 19. [Google Scholar] [CrossRef]
  67. Lee, D.; Le Pen, J.; Yatim, A.; Dong, B.; Aquino, Y.; Ogishi, M.; Pescarmona, R.; Talouarn, E.; Rinchai, D.; Zhang, P.; et al. Inborn Errors of OAS-RNase L in SARS-CoV-2-Related Multisystem Inflammatory Syndrome in Children. Science (1979) 2023, 379, eabo3627. [Google Scholar] [CrossRef] [PubMed]
  68. Ciancanelli, M.J.; Abel, L.; Zhang, S.Y.; Casanova, J.L. Host Genetics of Severe Influenza: From Mouse Mx1 to Human IRF7. Curr. Opin. Immunol. 2016, 38, 109–120. [Google Scholar] [CrossRef]
  69. Andolfo, I.; Russo, R.; Lasorsa, V.A.; Cantalupo, S.; Rosato, B.E.; Bonfiglio, F.; Frisso, G.; Abete, P.; Cassese, G.M.; Servillo, G.; et al. Common Variants at 21q22.3 Locus Influence MX1 and TMPRSS2 Gene Expression and Susceptibility to Severe COVID-19. iScience 2021, 24, 102322. [Google Scholar] [CrossRef]
  70. Diamond, M.S.; Farzan, M. The Broad-Spectrum Antiviral Functions of IFIT and IFITM Proteins. Nat. Rev. Immunol. 2012, 13, 46–57. [Google Scholar] [CrossRef]
  71. Perng, Y.C.; Lenschow, D.J. ISG15 in Antiviral Immunity and Beyond. Nat. Rev. Microbiol. 2018, 16, 423–439. [Google Scholar] [CrossRef]
  72. Dzimianski, J.V.; Scholte, F.E.M.; Bergeron, É.; Pegan, S.D. ISG15: It’s Complicated. J. Mol. Biol. 2019, 431, 4203–4216. [Google Scholar] [CrossRef] [PubMed]
  73. Ritchie, K.J.; Hahn, C.S.; Kim, K.I.; Yan, M.; Rosario, D.; Li, L.; De La Torre, J.C.; Zhang, D.E. Role of ISG15 Protease UBP43 (USP18) in Innate Immunity to Viral Infection. Nat. Med. 2004, 10, 1374–1378. [Google Scholar] [CrossRef] [PubMed]
  74. Choudhury, N.R.; Heikel, G.; Michlewski, G. TRIM25 and Its Emerging RNA-Binding Roles in Antiviral Defense. Wiley Interdiscip. Rev. RNA 2020, 11, e1588. [Google Scholar] [CrossRef]
  75. Hu, M.M.; Shu, H.B. Multifaceted Roles of TRIM38 in Innate Immune and Inflammatory Responses. Cell. Mol. Immunol. 2017, 14, 331–338. [Google Scholar] [CrossRef] [PubMed]
  76. Errett, J.S.; Suthar, M.S.; McMillan, A.; Diamond, M.S.; Gale, M. The Essential, Nonredundant Roles of RIG-I and MDA5 in Detecting and Controlling West Nile Virus Infection. J. Virol. 2013, 87, 11416–11425. [Google Scholar] [CrossRef] [PubMed]
  77. Rivera-Serrano, E.E.; Gizzi, A.S.; Arnold, J.J.; Grove, T.L.; Almo, S.C.; Cameron, C.E. Viperin Reveals Its True Function. Annu. Rev. Virol. 2020, 7, 421–446. [Google Scholar] [CrossRef] [PubMed]
  78. Zhu, M.; Lv, J.; Wang, W.; Guo, R.; Zhong, C.; Antia, A.; Zeng, Q.; Li, J.; Liu, Q.; Zhou, J.; et al. CMPK2 Is a Host Restriction Factor That Inhibits Infection of Multiple Coronaviruses in a Cell-Intrinsic Manner. PLoS Biol. 2023, 21, e3002039. [Google Scholar] [CrossRef] [PubMed]
  79. Seo, J.Y.; Yaneva, R.; Cresswell, P. Viperin: A Multifunctional, Interferon-Inducible Protein That Regulates Virus Replication. Cell Host Microbe 2011, 10, 534–539. [Google Scholar] [CrossRef] [PubMed]
  80. Heydari, H.; Golmohammadi, R.; Mirnejad, R.; Tebyanian, H.; Fasihi-Ramandi, M.; Moosazadeh Moghaddam, M. Antiviral Peptides against Coronaviridae Family: A Review. Peptides 2021, 139, 170526. [Google Scholar] [CrossRef]
  81. Wu, J.; Chi, H.; Fu, Y.; Cao, A.; Shi, J.; Zhu, M.; Zhang, L.; Hua, D.; Huang, J. The Antiviral Protein Viperin Interacts with the Viral N Protein to Inhibit Proliferation of Porcine Epidemic Diarrhea Virus. Arch. Virol. 2020, 165, 2279. [Google Scholar] [CrossRef]
  82. Sun, M.; Yu, Z.; Luo, M.; Li, B.; Pan, Z.; Ma, J.; Yao, H. Screening Host Antiviral Proteins under the Enhanced Immune Responses Induced by a Variant Strain of Porcine Epidemic Diarrhea Virus. Microbiol. Spectr. 2022, 10, e0066122. [Google Scholar] [CrossRef] [PubMed]
  83. Mao, J.; Huang, X.; Shan, Y.; Xu, J.; Gao, Q.; Xu, X.; Zhang, C.; Shi, F.; Yue, M.; He, F.; et al. Transcriptome Analysis Revealed Inhibition of Lipid Metabolism in 2-D Porcine Enteroids by Infection with Porcine Epidemic Diarrhea Virus. Vet. Microbiol. 2022, 273, 109525. [Google Scholar] [CrossRef] [PubMed]
  84. Yin, L.; Liu, X.; Hu, D.; Luo, Y.; Zhang, G.; Liu, P. Swine Enteric Coronaviruses (PEDV, TGEV, and PDCoV) Induce Divergent Interferon-Stimulated Gene Responses and Antigen Presentation in Porcine Intestinal Enteroids. Front. Immunol. 2022, 12, 5946. [Google Scholar] [CrossRef]
  85. Erez-Garcia, F.; Martin-Vicente, M.; Rojas-Garcia, R.L.; Castilla-Garcia, L.; Munoz-Gomez, M.J.; Hervas Fernandez, I.; Gonzalez Ventosa, V.; Vidal-Alcantara, E.J.; Cuadros-Gonzalez, J.; Bermejo-Martin, J.F.; et al. High SARS-CoV-2 Viral Load and Low CCL5 Expression Levels in the Upper Respiratory Tract Are Associated With COVID-19 Severity. J. Infect. Dis. 2022, 225, 977. [Google Scholar] [CrossRef] [PubMed]
  86. Tyner, J.W.; Uchida, O.; Kajiwara, N.; Kim, E.Y.; Patel, A.C.; O’Sullivan, M.P.; Walter, M.J.; Schwendener, R.A.; Cook, D.N.; Danoff, T.M.; et al. CCL5-CCR5 Interaction Provides Antiapoptotic Signals for Macrophage Survival during Viral Infection. Nat. Med. 2005, 11, 1180. [Google Scholar] [CrossRef]
  87. Culley, F.J.; Pennycook, A.M.J.; Tregoning, J.S.; Dodd, J.S.; Walzl, G.; Wells, T.N.; Hussell, T.; Openshaw, P.J.M. Role of CCL5 (RANTES) in Viral Lung Disease. J. Virol. 2006, 80, 8151–8157. [Google Scholar] [CrossRef] [PubMed]
  88. Elemam, N.M.; Talaat, I.M.; Maghazachi, A.A. CXCL10 Chemokine: A Critical Player in RNA and DNA Viral Infections. Viruses 2022, 14, 2445. [Google Scholar] [CrossRef]
  89. Mahalingam, S.; Farber, J.M.; Karupiah, G. The Interferon-Inducible Chemokines MuMig and Crg-2 Exhibit Antiviral Activity In Vivo. J. Virol. 1999, 73, 1479–1491. [Google Scholar] [CrossRef]
Figure 1. Air–liquid interface porcine respiratory epithelial cells (ALI-PREC) susceptibility toward porcine hemagglutinating encephalomyelitis virus (PHEV) infection. (AD) Completely differentiated ALI-PRECs (day 30) treated with infection medium only, i.e., without virus (mock-inoculated) (A), (B) with HA (titer of 128) of PHEV 67 N for 24 h post-inoculation (hpi), (C) 36 hpi, and (D) 48 hpi. Bar, 100 μm. Representative images from two biological and three technical replicates. (E) Detection of PHEV nucleocapsid gene using reverse transcription-qPCR. RNA from the subnatants collected from ALI-PRECs treated with PHEV was analyzed using RT-qPCR developed by ISU and Tetracore. Collection time is shown in hours. A sample volume of 5 μL of extracted sample RNA along with internal control was added to the qPCR master mix. All qPCRs were performed with a negative extraction control (NEC), a positive extraction control (PEC), and a no-template control (NTC) included in each run. Samples from two biological replicates and three technical replicates. Statistical analysis was performed using Fisher’s LSD multiple-comparison test (GraphPad Prism 9.0.1). **, p value  <  0.01, and ****, p value  <  0.0001.
Viruses 16 00939 g001
Figure 2. PHEV-induced DEG in ALI-PRECs at 24, 36, and 48 h post-infection (hpi). Volcano plots show differential gene expression at 24 hpi (A), 36 hpi (B), and 48 hpi (C). Significant genes (Benjamini–Hochberg FDR p < 0.15) downregulated are shown in green, while upregulated genes are shown in red. Genes that are not significantly differentially expressed are shown in grey. The number of DEGs shared between time points is plotted in the Venn diagram (D).
Viruses 16 00939 g002
Figure 3. Network visualization of DEG in ALI-PRECs at 24, 36, and 48 h post-infection (hpi) with PHEV. Percentage GO terms per group (grouped by kappa score) in PHEV-infected ALI-PRECs at (A) 24 hpi, (C) 36 hpi, (E) 48 hpi. Network of functionally grouped significant gene ontology terms at (B) 24 hpi, (D) 36 hpi, and (F) 48 hpi. The network elements were nodes representing molecules and edges representing the interaction between molecules. The node size represents the significance of the term. Upregulated genes associated with each term are shown in red, while downregulated are in green. * p < 0.05, ** p < 0.01.
Viruses 16 00939 g003
Figure 4. Differential gene expression at 24 h post-inoculation (hpi) within the canonical IPA pathway “Role of Hypercytokinemia/hyperchemokinemia in the Pathogenesis of Influenza”. Downregulated genes are shown with green fill, while upregulated genes were shown with pink fill. The greater the upregulation or downregulation, the darker the fill. A molecule activity predictor tool predicts downstream activity based on significant differential gene expression. Predicted activation is shown in orange, and predicted inhibition is shown in blue. The more confident the prediction, the darker the fill. Solid lines represent direct relationships, while dashed lines represent indirect relationships. * Denotes statistical significance.
Viruses 16 00939 g004
Figure 5. Differential gene expression at 36 h post-inoculation (hpi) within the canonical IPA pathway “Role of Hypercytokinemia/hyperchemokinemia in the Pathogenesis of Influenza”. Downregulated genes are shown with green fill, while upregulated genes are shown with pink fill. The greater the upregulation or downregulation, the darker the fill. A molecule activity predictor tool predicts downstream activity based on significant differential gene expression. Predicted activation is shown in orange, and predicted inhibition is shown in blue. The more confident the prediction, the darker the fill. Solid lines represent direct relationships, while dashed lines represent indirect relationships. * Denotes statistical significance.
Viruses 16 00939 g005
Figure 6. Differential gene expression at 48 h post-inoculation (hpi) within the canonical IPA pathway “Role of Hypercytokinemia/hyperchemokinemia in the Pathogenesis of Influenza”. Downregulated genes are shown with green fill, while upregulated genes are shown with pink fill. The greater the upregulation or downregulation, the darker the fill. A molecule activity predictor tool predicts downstream activity based on significant differential gene expression. Predicted activation is shown in orange, and predicted inhibition is shown in blue. The more confident the prediction, the darker the fill. Solid lines represent direct relationships, while dashed lines represent indirect relationships.
Viruses 16 00939 g006
Figure 7. Quantitative PCR analysis of ALI-PRECs inoculated with PHEV or mock inoculated with infection medium. Bar graph showing relative quantification (RQ) levels of MDA5 (A), STAT1 (B), Mx1 (C), CXCL10 (D), and CCL5 (E) measured in ALI-PRECs treated with HA (titer of 128) of PHEV and mock inoculum at respective h post-infection (x axes). RQ values were calculated using the 2−ΔΔCT method. The data are normalized against the geometric mean for three endogenous control genes (EIF3K, PPIA, and RPL10). This graph is generated from three technical replicates and two biological replicates (2 pigs). Statistical analysis was performed using Fisher’s LSD multiple-comparison test (GraphPad Prism 9.0.1). *, p value  <  0.05; **, p value < 0.001; ***, p value < 0.005; ****, p value < 0.0001.
Viruses 16 00939 g007
Disclaimer/Publisher’s Note: The statements, opinions and data contained in all publications are solely those of the individual author(s) and contributor(s) and not of MDPI and/or the editor(s). MDPI and/or the editor(s) disclaim responsibility for any injury to people or property resulting from any ideas, methods, instructions or products referred to in the content.

