
Inflammatory and Autoimmune Aspects of Multisystem Inflammatory Syndrome in Children (MIS-C): A Prospective Cohort Study

 ,
,  , , , ,
  and
and
Abstract
1. Introduction
2. Materials and Methods
2.1. Study Design and Biological Samples
2.2. Luminex Multiplex Assay
2.3. SARS-CoV-2 Antibody (Ab) Microsphere Immunofluorescence Assay
2.4. ELISA for Total Serum IgG
2.5. ELISA for IgG Anti-Brain autoAbs
2.6. ELISA for IgG Anti-dsDNA autoAbs
2.7. ELISA for IgG Anti-Metallothionein (MT) autoAbs
2.8. ELISA of IgG autoAbs to Specific Proteins Captured from Brain Lysate
2.9. Statistical Analyses
3. Results
4. Discussion
Author Contributions
Funding
Institutional Review Board Statement
Informed Consent Statement
Data Availability Statement
Acknowledgments
Conflicts of Interest
References
- U.S. Department of Health and Human Services Centers for Disease Control and Prevention. CSTE/CDC Multisystem Inflammatory Syndrome in Children (MIS-C) Associated with SARS-CoV-2 Infection Surveillance Interim Case Reporting Guide. Available online: https://www.cdc.gov/mis/pdfs/MIS-C_interim-case-reporting-guidance.pdf (accessed on 6 October 2023).
- Rubens, J.H.; Akindele, N.P.; Tschudy, M.M.; Sick-Samuels, A.C. Acute COVID-19 and multisystem inflammatory syndrome in children. BMJ 2021, 372, n385. [Google Scholar] [CrossRef] [PubMed]
- Huynh, T.; Sanchez-Flores, X.; Yau, J.; Huang, J.T. Cutaneous Manifestations of SARS-CoV-2 Infection. Am. J. Clin. Dermatol. 2022, 23, 277–286. [Google Scholar] [CrossRef] [PubMed]
- Sancho-Shimizu, V.; Brodin, P.; Cobat, A.; Biggs, C.M.; Toubiana, J.; Lucas, C.L.; Henrickson, S.E.; Belot, A.; MIS-C@CHGE; Tangye, S.G.; et al. SARS-CoV-2-related MIS-C: A key to the viral and genetic causes of Kawasaki disease? J. Exp. Med. 2021, 218, e20210446. [Google Scholar] [CrossRef] [PubMed]
- Chou, J.; Platt, C.D.; Habiballah, S.; Nguyen, A.A.; Elkins, M.; Weeks, S.; Peters, Z.; Day-Lewis, M.; Novak, T.; Armant, M.; et al. Taking on COVID-19 Together Study Investigators. Mechanisms underlying genetic susceptibility to multisystem inflammatory syndrome in children (MIS-C). J. Allergy Clin. Immunol. 2021, 148, 732–738.e1. [Google Scholar] [CrossRef] [PubMed]
- Nakra, N.A.; Blumberg, D.A.; Herrera-Guerra, A.; Lakshminrusimha, S. Multi-System Inflammatory Syndrome in Children (MIS-C) Following SARS-CoV-2 Infection: Review of Clinical Presentation, Hypothetical Pathogenesis, and Proposed Management. Children 2020, 7, 69. [Google Scholar] [CrossRef] [PubMed]
- Kalyanaraman, M.; Anderson, M.R. COVID-19 in Children. Pediatr. Clin. N. Am. 2022, 69, 547–571. [Google Scholar] [CrossRef]
- Centers for Disease Control and Prevention. COVID Data Tracker; U.S. Department of Health and Human Services, CDC: Atlanta, GA, USA, 2023. Available online: https://covid.cdc.gov/covid-data-tracker/ (accessed on 18 July 2023).
- Feldstein, L.R.; Rose, E.B.; Horwitz, S.M.; Collins, J.P.; Newhams, M.M.; Son, M.B.F.; Newburger, J.W.; Kleinman, L.C.; Heidemann, S.M.; Martin, A.A.; et al. Multisystem Inflammatory Syndrome in U.S. Children and Adolescents. N. Engl. J. Med. 2020, 383, 334–346. [Google Scholar] [CrossRef]
- Niaz, T.; Hope, K.; Fremed, M.; Misra, N.; Altman, C.; Glickstein, J.; Sanchez-de-Toledo, J.; Fraisse, A.; Miller, J.; Snyder, C.; et al. Role of a Pediatric Cardiologist in the COVID-19 Pandemic. Pediatr. Cardiol. 2021, 42, 19–35. [Google Scholar] [CrossRef] [PubMed]
- Alcamo, A.M.; McGuire, J.L.; Kanthimathinathan, H.K.; Roa, J.D.; Fink, E.L. Worldwide epidemiology of neuro-coronavirus disease in children: Lessons for the next pandemic. Curr. Opin. Pediatr. 2021, 33, 580–590. [Google Scholar] [CrossRef]
- Cherry, G.; Rocke, J.; Chu, M.; Liu, J.; Lechner, M.; Lund, V.J.; Kumar, B.N. Loss of smell and taste: A new marker of COVID-19? Tracking reduced sense of smell during the coronavirus pandemic using search trends. Expert. Rev. Anti Infect. Ther. 2020, 18, 1165–1170. [Google Scholar] [CrossRef]
- Jafari, Z.; Kolb, B.E.; Mohajerani, M.H. Hearing Loss, Tinnitus, and Dizziness in COVID-19: A Systematic Review and Meta-Analysis. Can. J. Neurol. Sci. 2022, 49, 184–195. [Google Scholar] [CrossRef] [PubMed]
- Mastrangelo, A.; Bonato, M.; Cinque, P. Smell and taste disorders in COVID-19: From pathogenesis to clinical features and outcomes. Neurosci. Lett. 2021, 748, 135694. [Google Scholar] [CrossRef] [PubMed]
- Natale, N.R.; Lukens, J.R.; Petri, W.A., Jr. The nervous system during COVID-19: Caught in the crossfire. Immunol. Rev. 2022, 311, 90–111. [Google Scholar] [CrossRef] [PubMed]
- da Silva Chagas, L.; Sandre, P.C.; de Velasco, P.C.; Marcondes, H.; Ribeiro, E.; Ribeiro, N.C.A.; Barreto, A.L.; Alves Mauro, L.B.; Ferreira, J.H.; Serfaty, C.A. Neuroinflammation and Brain Development: Possible Risk Factors in COVID-19-Infected Children. Neuroimmunomodulation 2021, 28, 22–28. [Google Scholar] [CrossRef] [PubMed]
- Olivotto, S.; Basso, E.; Lavatelli, R.; Previtali, R.; Parenti, L.; Fiori, L.; Dilillo, D.; Zuccotti, G.V.; Veggiotti, P.; Bova, S.M. Acute encephalitis in pediatric multisystem inflammatory syndrome associated with COVID-19. Eur. J. Paediatr. Neurol. 2021, 34, 84–90. [Google Scholar] [CrossRef] [PubMed]
- Roh, J.S.; Sohn, D.H. Damage-Associated Molecular Patterns in Inflammatory Diseases. Immune Netw. 2018, 18, e27. [Google Scholar] [CrossRef] [PubMed]
- Parthasarathy, U.; Martinelli, R.; Vollmann, E.H.; Best, K.; Therien, A.G. The impact of DAMP-mediated inflammation in severe COVID-19 and related disorders. Biochem. Pharmacol. 2022, 195, 114847. [Google Scholar] [CrossRef] [PubMed]
- Yates, J.L.; Ehrbar, D.J.; Hunt, D.T.; Girardin, R.C.; Dupuis, A.P., 2nd; Payne, A.F.; Sowizral, M.; Varney, S.; Kulas, K.E.; Demarest, V.L.; et al. Serological analysis reveals an imbalanced IgG subclass composition associated with COVID-19 disease severity. Cell Rep. Med. 2021, 2, 100329. [Google Scholar] [CrossRef]
- Nakanishi, K. Unique Action of Interleukin-18 on T Cells and Other Immune Cells. Front. Immunol. 2018, 9, 763. [Google Scholar] [CrossRef] [PubMed] [PubMed Central]
- Akdis, C.A.; Arkwright, P.D.; Brüggen, M.C.; Busse, W.; Gadina, M.; Guttman-Yassky, E.; Kabashima, K.; Mitamura, Y.; Vian, L.; Wu, J.; et al. Type 2 immunity in the skin and lungs. Allergy 2020, 75, 1582–1605. [Google Scholar] [CrossRef]
- Kato, A. Group 2 Innate Lymphoid Cells in Airway Diseases. Chest 2019, 156, 141–149. [Google Scholar] [CrossRef] [PubMed]
- Kiss, A.; Ryan, P.M.; Mondal, T. Management of COVID-19-associated multisystem inflammatory syndrome in children: A comprehensive literature review. Prog. Pediatr. Cardiol. 2021, 63, 101381. [Google Scholar] [CrossRef] [PubMed]
- Belay, E.D.; Abrams, J.; Oster, M.E.; Giovanni, J.; Pierce, T.; Meng, L.; Prezzato, E.; Balachandran, N.; Openshaw, J.J.; Rosen, H.E.; et al. Trends in Geographic and Temporal Distribution of, U.S. Children with Multisystem Inflammatory Syndrome During the COVID-19 Pandemic. JAMA Pediatr. 2021, 175, 837–845. [Google Scholar] [CrossRef] [PubMed]
- Long, D.; Chen, Y.; Wu, H.; Zhao, M.; Lu, Q. Clinical significance and immunobiology of IL-21 in autoimmunity. J. Autoimmun. 2019, 99, 1–14. [Google Scholar] [CrossRef] [PubMed]
- Quast, I.; Dvorscek, A.R.; Pattaroni, C.; Steiner, T.M.; McKenzie, C.I.; Pitt, C.; O’Donnell, K.; Ding, Z.; Hill, D.L.; Brink, R.; et al. Interleukin-21, acting beyond the immunological synapse, independently controls T follicular helper and germinal center B cells. Immunity 2022, 55, 1414–1430.e5. [Google Scholar] [CrossRef] [PubMed]
- Lefrançais, E.; Duval, A.; Mirey, E.; Roga, S.; Espinosa, E.; Cayrol, C.; Girard, J.P. Central domain of IL-33 is cleaved by mast cell proteases for potent activation of group-2 innate lymphoid cells. Proc. Natl. Acad. Sci. USA 2014, 111, 15502–15507. [Google Scholar] [CrossRef]
- Cayrol, C.; Girard, J.P. Interleukin-33 (IL-33): A critical review of its biology and the mechanisms involved in its release as a potent extracellular cytokine. Cytokine 2022, 156, 155891. [Google Scholar] [CrossRef]
- Seehus, C.R.; Kadavallore, A.; Torre, B.; Yeckes, A.R.; Wang, Y.; Tang, J.; Kaye, J. Alternative activation generates IL-10 producing type 2 innate lymphoid cells. Nat. Commun. 2017, 8, 1900. [Google Scholar] [CrossRef] [PubMed] [PubMed Central]
- Lamkhioued, B.; Gounni, A.S.; Aldebert, D.; Delaporte, E.; Prin, L.; Capron, A.; Capron, M. Synthesis of type 1 (IFN gamma) and type 2 (IL-4, IL-5, and IL-10) cytokines by human eosinophils. Ann. N. Y. Acad. Sci. 1996, 796, 203–208. [Google Scholar] [CrossRef] [PubMed]
- Mosser, D.M.; Zhang, X. Interleukin-10: New perspectives on an old cytokine. Immunol. Rev. 2008, 226, 205–218. [Google Scholar] [CrossRef] [PubMed] [PubMed Central]
- Zheng, Z.; Huang, G.; Gao, T.; Huang, T.; Zou, M.; Zou, Y.; Duan, S. Epigenetic Changes Associated with Interleukin-10. Front. Immunol. 2020, 11, 1105. [Google Scholar] [CrossRef]
- Carlini, V.; Noonan, D.M.; Abdalalem, E.; Goletti, D.; Sansone, C.; Calabrone, L.; Albini, A. The multifaceted nature of IL-10: Regulation, role in immunological homeostasis and its relevance to cancer, COVID-19 and post-COVID conditions. Front. Immunol. 2023, 14, 1161067. [Google Scholar] [CrossRef]
- Xu, Q.; Katakura, Y.; Yamashita, M.; Fang, S.; Tamura, T.; Matsumoto, S.E.; Aiba, Y.; Teruya, K.; Osada, K.; Nishikawa, R.; et al. IL-10 augments antibody production in in vitro immunized lymphocytes by inducing a Th2-type response and B cell maturation. Biosci. Biotechnol. Biochem. 2004, 68, 2279–2284. [Google Scholar] [CrossRef] [PubMed]
- Aukrust, P.; Svardal, A.M.; Müller, F.; Lunden, B.; Berge, R.K.; Ueland, P.M.; Frøland, S.S. Increased levels of oxidized glutathione in CD4+ lymphocytes associated with disturbed intracellular redox balance in human immunodeficiency virus type 1 infection. Blood 1995, 86, 258–267. [Google Scholar] [CrossRef] [PubMed]
- van der Ven, A.J.; Blom, H.J.; Peters, W.; Jacobs, L.E.; Verver, T.J.; Koopmans, P.P.; Demacker, P.; van der Meer, J.W. Glutathione homeostasis is disturbed in CD4-positive lymphocytes of HIV-seropositive individuals. Eur. J. Clin. Investig. 1998, 28, 187–193. [Google Scholar] [CrossRef] [PubMed]
- Khanfar, A.; Al Qaroot, B. Could glutathione depletion be the Trojan horse of COVID-19 mortality? Eur. Rev. Med. Pharmacol. Sci. 2020, 24, 12500–12509. [Google Scholar] [CrossRef] [PubMed]
- Peterson, J.D.; Herzenberg, L.A.; Vasquez, K.; Waltenbaugh, C. Glutathione levels in antigen-presenting cells modulate Th1 versus Th2 response patterns. Proc. Natl. Acad. Sci. USA 1998, 95, 3071–3076. [Google Scholar] [CrossRef] [PubMed]
- Kidd, P. Th1/Th2 balance: The hypothesis, its limitations, and implications for health and disease. Altern. Med. Rev. 2003, 8, 223–246. [Google Scholar] [PubMed]
- Mak, T.W.; Grusdat, M.; Duncan, G.S.; Dostert, C.; Nonnenmacher, Y.; Cox, M.; Binsfeld, C.; Hao, Z.; Brüstle, A.; Itsumi, M.; et al. Glutathione Primes T Cell Metabolism for Inflammation. Immunity 2017, 46, 675–689. [Google Scholar] [CrossRef] [PubMed]
- Emeny, R.T.; Carpenter, D.O.; Lawrence, D.A. Health disparities: Intracellular consequences of social determinants of health. Toxicol. Appl. Pharmacol. 2021, 416, 115444. [Google Scholar] [CrossRef] [PubMed]
- Picca, A.; Calvani, R.; Coelho-Junior, H.J.; Marzetti, E. Cell Death and Inflammation: The Role of Mitochondria in Health and Disease. Cells 2021, 10, 537. [Google Scholar] [CrossRef]
- Klocperk, A.; Bloomfield, M.; Parackova, Z.; Aillot, L.; Fremuth, J.; Sasek, L.; David, J.; Fencl, F.; Skotnicova, A.; Rejlova, K.; et al. B cell phenotype and serum levels of interferons, BAFF, and APRIL in multisystem inflammatory syndrome in children associated with COVID-19 (MIS-C). Mol. Cell Pediatr. 2023, 10, 15. [Google Scholar] [CrossRef]
- Diorio, C.; Shraim, R.; Vella, L.A.; Giles, J.R.; Baxter, A.E.; Oldridge, D.A.; Canna, S.W.; Henrickson, S.E.; McNerney, K.O.; Balamuth, F.; et al. Proteomic profiling of MIS-C patients indicates heterogeneity relating to interferon gamma dysregulation and vascular endothelial dysfunction. Nat. Commun. 2021, 12, 7222. [Google Scholar] [CrossRef]
- Gurlevik, S.L.; Ozsurekci, Y.; Sağ, E.; Derin Oygar, P.; Kesici, S.; Akca, Ü.K.; Cuceoglu, M.K.; Basaran, O.; Göncü, S.; Karakaya, J.; et al. The difference of the inflammatory milieu in MIS-C and severe COVID-19. Pediatr. Res. 2022, 92, 1805–1814. [Google Scholar] [CrossRef]
- Romani, L.; Del Chierico, F.; Macari, G.; Pane, S.; Ristori, M.V.; Guarrasi, V.; Gardini, S.; Pascucci, G.R.; Cotugno, N.; Perno, C.F.; et al. The Relationship Between Pediatric Gut Microbiota and SARS-CoV-2 Infection. Front. Cell Infect. Microbiol. 2022, 12, 908492. [Google Scholar] [CrossRef] [PubMed]
- Suskun, C.; Kilic, O.; Yilmaz Ciftdogan, D.; Guven, S.; Karbuz, A.; Ozkaya Parlakay, A.; Kara, Y.; Kacmaz, E.; Sahin, A.; Boga, A.; et al. Intestinal microbiota composition of children with infection with severe acute respiratory syndrome coronavirus 2 (SARS-CoV-2) and multisystem inflammatory syndrome (MIS-C). Eur. J. Pediatr. 2022, 181, 3175–3191. [Google Scholar] [CrossRef]
- Breedveld, A.; van Egmond, M. IgA and FcαRI: Pathological Roles and Therapeutic Opportunities. Front. Immunol. 2019, 10, 553. [Google Scholar] [CrossRef]
- Rogier, E.W.; Frantz, A.L.; Bruno, M.E.; Kaetzel, C.S. Secretory IgA is Concentrated in the Outer Layer of Colonic Mucus along with Gut Bacteria. Pathogens 2014, 3, 390–403. [Google Scholar] [CrossRef]
- de Jager, C.P.; Wever, P.C.; Gemen, E.F.; Kusters, R.; van Gageldonk-Lafeber, A.B.; van der Poll, T.; Laheij, R.J. The neutrophil-lymphocyte count ratio in patients with community-acquired pneumonia. PLoS ONE 2012, 7, e46561. [Google Scholar] [CrossRef]
- de Jager, C.P.; van Wijk, P.T.; Mathoera, R.B.; de Jongh-Leuvenink, J.; van der Poll, T.; Wever, P.C. Lymphocytopenia and neutrophil–lymphocyte count ratio predict bacteremia better than conventional infection markers in an emergency care unit. Crit. Care 2010, 14, R192. [Google Scholar] [CrossRef]
- Laforge, M.; Elbim, C.; Frère, C.; Hémadi, M.; Massaad, C.; Nuss, P.; Benoliel, J.J.; Becker, C. Tissue damage from neutrophil-induced oxidative stress in COVID-19. Nat. Rev. Immunol. 2020, 20, 515–516. [Google Scholar] [CrossRef]
- Feldstein, L.R.; Tenforde, M.W.; Friedman, K.G.; Newhams, M.; Rose, E.B.; Dapul, H.; Soma, V.L.; Maddux, A.B.; Mourani, P.M.; Bowens, C.; et al. Characteristics and Outcomes of US Children and Adolescents with Multisystem Inflammatory Syndrome in Children (MIS-C) Compared with Severe Acute COVID-19. JAMA 2021, 325, 1074–1087. [Google Scholar] [CrossRef]
- Parthasarathi, A.; Padukudru, S.; Arunachal, S.; Basavaraj, C.K.; Krishna, M.T.; Ganguly, K.; Upadhyay, S.; Anand, M.P. The Role of Neutrophil-to-Lymphocyte Ratio in Risk Stratification and Prognostication of COVID-19: A Systematic Review and Meta-Analysis. Vaccines 2022, 10, 1233. [Google Scholar] [CrossRef] [PubMed] [PubMed Central]
- Sarkar, S.; Khanna, P.; Singh, A.K. The Impact of Neutrophil-Lymphocyte Count Ratio in COVID-19: A Systematic Review and Meta-Analysis. J. Intensive Care Med. 2022, 37, 857–869. [Google Scholar] [CrossRef]
- Harada, A.; Sekido, N.; Akahoshi, T.; Wada, T.; Mukaida, N.; Matsushima, K. Essential involvement of interleukin-8 (IL-8) in acute inflammation. J. Leuk. Biol. 1994, 56, 559–564. [Google Scholar] [CrossRef]
- Nussbaum, J.C.; Van Dyken, S.J.; von Moltke, J.; Cheng, L.E.; Mohapatra, A.; Molofsky, A.B.; Thornton, E.E.; Krummel, M.F.; Chawla, A.; Liang, H.E.; et al. Type 2 innate lymphoid cells control eosinophil homeostasis. Nature 2013, 502, 245–248. [Google Scholar] [CrossRef]
- Uchida, A.M.; Ro, G.; Qiang, L.; Peterson, K.A.; Round, J.; Dougan, M.; Dougan, S.K. Human differentiated eosinophils release IL-13 in response to IL-33 stimulation. Front. Immunol. 2022, 13, 946643. [Google Scholar] [CrossRef] [PubMed] [PubMed Central]
- Folci, M.; Ramponi, G.; Arcari, I.; Zumbo, A.; Brunetta, E. Eosinophils as Major Player in Type 2 Inflammation: Autoimmunity and Beyond. Adv. Exp. Med. Biol. 2021, 1347, 197–219. [Google Scholar] [CrossRef] [PubMed]
- Karimi, A.; Pourbakhtiaran, E.; Fallahi, M.; Karbasian, F.; Armin, S.; Babaie, D. Is It Stevens-Johnson Syndrome or MIS-C with Mucocutaneous Involvement? Case Rep. Pediatr. 2021, 2021, 1812545. [Google Scholar] [CrossRef] [PubMed] [PubMed Central]
- Lootah, S.; Alshammari, E.; Alqanatish, J. Complete Remission in a Child with Multisystem Inflammatory Syndrome and Stevens-Johnson Syndrome Treated with Infliximab. Cureus 2023, 15, e37076. [Google Scholar] [CrossRef]
- Long, H.; Zhang, G.; Wang, L.; Lu, Q. Eosinophilic Skin Diseases: A Comprehensive Review. Clin. Rev. Allergy Immunol. 2016, 50, 189–213. [Google Scholar] [CrossRef]
- Seery, N.; Butzkueven, H.; O’Brien, T.J.; Monif, M. Contemporary advances in antibody-mediated encephalitis: Anti-LGI1 and anti-Caspr2 antibody (Ab)-mediated encephalitides. Autoimmun. Rev. 2022, 21, 103074. [Google Scholar] [CrossRef]
- Son, M.B.F.; Burns, J.C.; Newburger, J.W. A New Definition for Multisystem Inflammatory Syndrome in Children. Pediatrics 2023, 151, e2022060302. [Google Scholar] [CrossRef]
- Brilland, B.; Vinatier, E.; Subra, J.F.; Jeannin, P.; Augusto, J.F.; Delneste, Y. Anti-Pentraxin Antibodies in Autoimmune Diseases: Bystanders or Pathophysiological Actors? Front. Immunol. 2021, 11, 626343. [Google Scholar] [CrossRef]
- Consiglio, C.R.; Cotugno, N.; Sardh, F.; Pou, C.; Amodio, D.; Rodriguez, L.; Tan, Z.; Zicari, S.; Ruggiero, A.; Pascucci, G.R.; et al. The Immunology of Multisystem Inflammatory Syndrome in Children with COVID-19. Cell 2020, 183, 968–981.e7. [Google Scholar] [CrossRef]
- Ramaswamy, A.; Brodsky, N.N.; Sumida, T.S.; Comi, M.; Asashima, H.; Hoehn, K.B.; Li, N.; Liu, Y.; Shah, A.; Ravindra, N.G.; et al. Immune dysregulation and autoreactivity correlate with disease severity in SARS-CoV-2-associated multisystem inflammatory syndrome in children. Immunity 2021, 54, 1083–1095.e7. [Google Scholar] [CrossRef]
- Burbelo, P.D.; Castagnoli, R.; Shimizu, C.; Delmonte, O.M.; Dobbs, K.; Discepolo, V.; Lo Vecchio, A.; Guarino, A.; Licciardi, F.; Ramenghi, U.; et al. Autoantibodies Against Proteins Previously Associated with Autoimmunity in Adult and Pediatric Patients with COVID-19 and Children with MIS-C. Front. Immunol. 2022, 13, 841126. [Google Scholar] [CrossRef]
- Whitacre, C. Sex differences in autoimmune disease. Nat. Immunol. 2001, 2, 777–780. [Google Scholar] [CrossRef]
- Santos, M.O.; Gonçalves, L.C.; Silva, P.A.N.; Moreira, A.L.E.; Ito, C.R.M.; Peixoto, F.A.O.; Wastowski, I.J.; Carneiro, L.C.; Avelino, M.A.G. Multisystem inflammatory syndrome (MIS-C): A systematic review and meta-analysis of clinical characteristics, treatment, and outcomes. J. Pediatr. 2022, 98, 338–349. [Google Scholar] [CrossRef]
- Dinan, T.G.; Cryan, J.F. The Microbiome-Gut-Brain Axis in Health and Disease. Gastroenterol. Clin. N. Am. 2017, 46, 77–89. [Google Scholar] [CrossRef]
- Petra, A.I.; Panagiotidou, S.; Hatziagelaki, E.; Stewart, J.M.; Conti, P.; Theoharides, T.C. Gut-Microbiota-Brain Axis and Its Effect on Neuropsychiatric Disorders with Suspected Immune Dysregulation. Clin. Ther. 2015, 37, 984–995. [Google Scholar] [CrossRef] [PubMed] [PubMed Central]
- Cheung, S.G.; Goldenthal, A.R.; Uhlemann, A.C.; Mann, J.J.; Miller, J.M.; Sublette, M.E. Systematic Review of Gut Microbiota and Major Depression. Front. Psychiatry 2019, 10, 34. [Google Scholar] [CrossRef] [PubMed] [PubMed Central]
- Liang, S.; Wu, X.; Hu, X.; Wang, T.; Jin, F. Recognizing Depression from the Microbiota⁻Gut⁻Brain Axis. Int. J. Mol. Sci. 2018, 19, 1592. [Google Scholar] [CrossRef] [PubMed] [PubMed Central]
- Siljander, H.; Honkanen, J.; Knip, M. Microbiome and type 1 diabetes. EBioMedicine 2019, 46, 512–521. [Google Scholar] [CrossRef] [PubMed] [PubMed Central]
- Manosso, L.M.; Arent, C.O.; Borba, L.A.; Ceretta, L.B.; Quevedo, J.; Réus, G.Z. Microbiota-Gut-Brain Communication in the SARS-CoV-2 Infection. Cells 2021, 10, 1993. [Google Scholar] [CrossRef] [PubMed] [PubMed Central]
- Brogna, C.; Viduto, V.; Fabrowski, M.; Cristoni, S.; Marino, G.; Montano, L.; Piscopo, M. The importance of the gut microbiome in the pathogenesis and transmission of SARS-CoV-2. Gut Microbes 2023, 15, 2244718. [Google Scholar] [CrossRef] [PubMed]
- Khawar Sr, M.M.; Ijaz, S.; Goyal, P.; Kandambige, D.; Sharifa, M.; Maslamani, A.N.J.; Al Kutabi, S.; Saleh, I.; Albshir Sr, M.M.; I Kh Almadhoun, M.K.; et al. The Gut-Brain Axis in Autoimmune Diseases: Emerging Insights and Therapeutic Implications. Cureus 2023, 15, e48655. [Google Scholar] [CrossRef] [PubMed] [PubMed Central]
- Gary, Y.; Kakria, N.; Singh, S.; Jindal, A.K. Coronavirus disease-19 triggered systemic lupus erythematous: A novel entity. Lung India 2023, 40, 79–81. [Google Scholar] [CrossRef] [PubMed]
- Volchkova, E.A.; Legkova, K.S.; Topchy, T.B. COVID-19 as a trigger of autoimmune hepatitis. Case report. Ter. Arkh 2022, 94, 259–264. [Google Scholar] [CrossRef] [PubMed]
- Zhong, Z.; Wu, Q.; Lai, Y.; Dai, L.; Gao, Y.; Liao, W.; Feng, X.; Yang, P. Risk for uveitis relapse after COVID-19 vaccination. J. Autoimmun. 2022, 133, 102925. [Google Scholar] [CrossRef]
- Lazarian, G.; Quinquenel, A.; Bellal, M.; Siavellis, J.; Jacquy, C.; Re, D.; Merabet, F.; Mekinian, A.; Braun, T.; Damaj, G.; et al. Autoimmune Haemolytic Anaemia Associated with COVID-19 Infection. Br. J. Haematol. 2020, 190, 29–31. [Google Scholar] [CrossRef] [PubMed]
- Inaba, H.; Aizawa, T. Coronavirus Disease 2019 and the Thyroid-Progress and Perspectives. Front. Endocrinol. 2021, 12, 708333. [Google Scholar] [CrossRef] [PubMed]
- Prüss, H. Autoantibodies in neurological disease. Nat. Rev. Immunol. 2021, 21, 798–813. [Google Scholar] [CrossRef]
- Irani, S.R.; Alexander, S.; Waters, P.; Kleopa, K.A.; Pettingill, P.; Zuliani, L.; Peles, E.; Buckley, C.; Lang, B.; Vincent, A. Antibodies to Kv1 potassium channel-complex proteins leucine-rich, glioma inactivated 1 protein and contactin-associated protein-2 in limbic encephalitis, Morvan’s syndrome and acquired neuromyotonia. Brain 2010, 133, 2734–2748. [Google Scholar] [CrossRef] [PubMed]
- Stone, R. The inflamed brain. Science 2024, 384, 728–733. [Google Scholar] [CrossRef] [PubMed]
- Mourani, S.C.; Khoury, R.; Ghossoub, E. Mechanisms of new-onset psychosis during the COVID-19 pandemic: What ignited the fire? Ann. Clin. Psychiatry 2022, 34, 123–135. [Google Scholar] [CrossRef]
- Messina, A.; Signorelli, M.S. COVID-19 associated psychosis. Ind. Psychiatry J. 2023, 32, 215–221. [Google Scholar] [CrossRef]
- Hogan, A.H.; Herbst, K.W.; Defelice, C.; Schulman, N.; Adams, A.M.; Carroll, C.L.; Salazar, J.C. Going Viral: Assessing the Impact of Social Media on Enrollment in a Coronavirus Disease 2019 (COVID-19) Cohort Study. Cureus 2024, 16, e56096. [Google Scholar] [CrossRef] [PubMed]
- Vicetti Miguel, C.P.; Dasgupta-Tsinikas, S.; Lamb, G.S.; Olarte, L.; Santos, R.P. Race, Ethnicity, and Health Disparities in US Children with COVID-19: A Review of the Evidence and Recommendations for the Future. J. Pediatr. Infect. Dis. Soc. 2022, 11 (Suppl. 4), S132–S140. [Google Scholar] [CrossRef]
- Encinosa, W.; Moon, K.; Figueroa, J.; Elias, Y. Complications, Adverse Drug Events, High Costs, and Disparities in Multisystem Inflammatory Syndrome in Children vs. COVID-19. JAMA Netw. Open 2023, 6, e2244975. [Google Scholar] [CrossRef]

| Characteristic | Total Cohort (n = 131) | COVID+ (n = 29) | MIS-C (n = 33) | Control (n = 69) | p-Value |
|---|---|---|---|---|---|
| Age (mos) IQR | 127 (72–185) | 110 (38–196) | 116 (70–158) | 144 (74–189) | 0.39 |
| Age range (mos) | 1–260 | 1–214 | 2–212 | 8–260 | |
| Male | 80 (56%) | 16 (55%) | 19 (58%) | 38 (55%) | 0.97 |
| Race | <0.001 | ||||
| Black | 22 (17%) | 4 (14%) | 13 (39%) | 5 (7%) | |
| White | 65 (50%) | 12 (41%) | 5 (15%) | 48 (70%) | |
| Other Race | 26 (20%) | 10 (35%) | 12 (36%) | 4 (6%) | |
| >1 Race | 13 (10%) | 1 (3%) | 3 (9%) | 9 (13%) | |
| Prefer not to answer | 5 (4%) | 2 (7%) | - | 3 (4%) | |
| Hispanic | 40 (31%) | 10 (35%) | 12 (36%) | 18 (26%) | 0.67 |
| Prefer not to answer | 2 (2%) | 0 | 0 | 2 (3%) | |
| Comorbidity | Total Cohort (n = 131) | COVID+ (n = 29) | MIS-C (n = 33) | Control (n = 69) |
|---|---|---|---|---|
| Asthma | 26 (18%) | 11 (38%) | 8 (24%) | 7 (9%) |
| Other chronic lung disease | 1 (1%) | 1 (3%) | 0 | 0 |
| Hypertension | 1 (1%) | 1 (3%) | 0 | 0 |
| Immunocompromised | 1 (1%) | 1 (3%) | 0 | 0 |
| Diabetes | 3 (2%) | 3 (10%) * | 0 | 0 |
| IBD | 1 (1%) | 1 (3%) | 0 | 0 |
| JIA | 1 (1%) | 1 (3%) | 0 | 0 |
| Other rheumatic disease | 1 (1%) | 1 (3%) | 0 | 0 |
| Cancer | 1 (1%) | 1 (3%) | 0 | 0 |
| Sickle cell disease | 2 (1%) | 1 (3%) | 1 (3%) | 0 |
| Serious mental illness | 3 (2%) | 1 (3%) | 0 | 2 (3%) |
| Symptom | COVID+ (n = 29) | MIS-C (n = 33) | p-Value |
|---|---|---|---|
| Fever | 16 (55%) | 31 (94%) | <0.001 |
| Mucocutaneous 1 | 3 (10%) | 20 (61%) | <0.001 |
| Upper respiratory 2 | 20 (69%) | 13 (39%) | <0.05 |
| Lower respiratory 3 | 15 (52%) | 5 (15%) | <0.005 |
| Gastrointestinal 4 | 17 (59%) | 30 (91%) | <0.01 |
| Neurologic 5 | 0 | 0 | |
| Systemic 6 | 14 (48%) | 30 (91%) | <0.001 |
| No symptoms present | 0 | 0 | |
| Days of symptoms prior to admission | 3.0 (1.5–8.0) | 4.0 (3.0–5.0) | 0.36 |
| Diagnostic Lab | COVID+ (n = 29) | MIS-C (n = 33) | p-Value |
|---|---|---|---|
| CBC ordered | 25 (86%) | 31 (94%) | |
| WBC (103/µL) | 8.5 (4.7–15.4) | 9.2 (7.2–14.5) | 0.49 |
| Hemoglobin (g/dL) | 13.4 (11.8–14.4) | 11.8 (10.3–12.7) | 0.005 |
| Platelet count (103/µL) | 260 (206–354) | 180 (121–261) | 0.001 |
| Neutrophils (103/µL) | 5.6 (2.4–11.3) | 7.3 (5.5–11.4) | 0.002 |
| Lymphocyte (%) | 21.1 (12.6–41.7) | 8.0 (5.6–17.2) | <0.001 |
| Lymphocytes (103/µL) | 1.8 (1.3–3.2) | 0.7 (0.5–1.8) | 0.002 |
| Eosinophils (103/µL) | 0.67 (0–4.8) | 1.9 (0–8.1) | 0.004 |
| Neutrophil/lymphocyte ratio | 3.28 (1.06–6.36) | 10.14 (4.31–16.0) | <0.001 |
| Eosinophil/lymphocyte ratio | 0.004 (0–0.037) | 0.132 (0.02–0.338) | <0.001 |
| CRP ordered | 22 (76%) | 31 (94%) | |
| CRP (mg/dL) median (IQR) | 1.16 (0.3–4.89) | 15.9 (10.9–21.7) | <0.001 |
| CRP (mg/dL) range | 0.1–9.8 | 2.6–52.2 | |
| CRP elevated 1 | 13 (59%) | 31 (91%) | <0.001 |
| Troponin ordered | 13 (45%) | 30 (91%) | |
| Troponin I (ng/mL) median (IQR) | 0.30 (0.30–0.30) | 0.30 (0.30–0.31) | 0.49 |
| Troponin I (ng/mL) range | 0.30–0.51 | 0.30–7.67 | |
| Troponin elevated 2 | 13 (100%) | 30 (100%) | 1.00 |
| ProBNP ordered | 13 (45%) | 30 (91%) | |
| ProBNP (pg/mL) median (IQR) | 197 (19–1737) | 1583 (672–6110) | 0.027 |
| ProBNP (pg/mL) range | 5–70,000 | 44–70,000 | |
| ProBNP elevated 3 | 4 (31%) | 19 (63%) | 0.09 |
| ProBNP indeterminate 4 | 3 (23%) | 6 (20%) | 1.00 |
| Characteristic | COVID+ (n = 29) | MIS-C (n = 33) | p-Value |
|---|---|---|---|
| Length of stay (days) | 4 (2–6) | 6 (4–9) | <0.05 |
| ICU | 9 (31%) | 17 (52%) | 0.13 |
| Intubation | 0 | 0 | |
| Ventilation (BiPAP) | 1 (3%) | 0 | 0.47 |
| Received IVIg | 1 (3%) | 33 (100%) | <0.001 |
| Received steroids | 14 (48%) | 32 (97%) | <0.001 |
| Received immunomodulator | 0 | 2 (6%) | 0.49 |
| Received antimicrobial | 18 (62%) | 31 (94%) | <0.005 |
| Cytokine/Chemokine | COVID+ (n = 29) | MIS-C (n = 33) | Control (n = 69) | COVID+ vs. Control p-Value | MIS-C vs. Control p-Value | COVID+ vs. MIS-C p-Value |
|---|---|---|---|---|---|---|
| CCL3 | 28 (18–35) | 44 (30–51) | 18 (12–27) | 0.66 | <0.001 | 0.003 |
| CCL4 | 33 (20–62) | 69 (39–88) | 35 (24–49) | 0.29 | <0.001 | 0.031 |
| CCL20 | 31 (24–36) | 41 (35–55) | 30 (26–40) | 0.67 | 0.034 | 0.37 |
| CX3CL1 | 219 (185–266) | 255 (221–344) | 241 (194–300) | 0.15 | 0.49 | 0.78 |
| CXCL11 | 107 (51–346) | 1010 (300–1458) | 53 (40–71) | 0.38 | <0.001 | <0.001 |
| GM-CSF | 83 (33–165) | 110 (65–273) | 72 (36–152) | 0.89 | 0.12 | 0.10 |
| IFN-α2 | 83 (8–150) | 148 (60–236) | 96 (26–190) | 0.69 | 0.035 | 0.016 |
| IFN-β | 488 (488–488) | 488 (478–1068) | 488 (488–488) | 0.98 | 0.031 | 0.12 |
| IFN-γ | 77 (46–149) | 113 (78–189) | 76 (49–156) | 0.86 | 0.88 | 0.67 |
| TNF-α | 15 (11–20) | 28 (19–47) | 14 (11–18) | 0.80 | <0.001 | <0.001 |
| IL-1β | 3.2 (2.1–4.5) | 4.8 (3.4–6.2) | 3.1 (2.1–5.4) | 0.53 | 0.23 | 0.06 |
| IL-2 | 5.2 (2.8–79) | 6.9 (4.2–8.0) | 4.3 (2.7–6.4) | 0.54 | 0.020 | 0.38 |
| IL-4 | 39 (19–115) | 686 (328–953) | 49 (26–194) | 0.80 | <0.001 | <0.001 |
| IL-5 | 4.6 (2.6–7.8) | 21 (11–26) | 4.9 (2.6–8.6) | 0.99 | <0.001 | <0.001 |
| IL-6 | 13 (5–24) | 73 (47–101) | 4.4 (1.1–11.8) | 0.30 | <0.001 | <0.001 |
| IL-7 | 16 (11–19) | 18 (14–23) | 13 (11–17) | 0.96 | 0.016 | 0.09 |
| IL-8 | 18 (9–47) | 112 (58–152) | 9.4 (5.1–22.8) | 0.22 | <0.001 | <0.001 |
| IL-10 | 35 (22–41) | 79 (42–176) | 13 (8–20) | 0.58 | <0.001 | 0.002 |
| IL-12(p70) | 4.9 (3.0–6.5) | 4.6 (3.1–6.9) | 4.8 (3.4–7.5) | 0.31 | 0.35 | 0.99 |
| IL-13 | 7.9 (4.2–30.4) | 127 (38–179) | 8.6 (2.8–37.5) | 0.95 | <0.001 | <0.001 |
| IL-15 | 5.9 (3.0–19.5) | 24 (14–35) | 3.0 (3.0–8.3) | <0.001 | <0.001 | 0.40 |
| IL-17a | 16 (11–25) | 22 (14–30) | 16 (9–28) | 0.88 | 0.73 | 0.54 |
| IL-18 | 218 (93–417) | 652 (438–1041) | 103 (46–217) | 0.23 | <0.001 | <0.001 |
| IL-21 | 5.8 (3.8–9.7) | 9.1 (7.3–12.6) | 5.8 (3.9–8.8) | 0.99 | 0.006 | 0.038 |
| IL-23 | 487 (188–1316) | 966 (748–1541) | 591 (311–1126) | 0.99 | 0.19 | 0.37 |
| IL-33 | 23 (20–286) | 464 (317–670) | 32 (20–151) | 0.67 | <0.001 | 0.023 |
| Cytokine/Chemokine | Serum Collected before IVIg (n = 6) | Serum Collected after IVIg (n = 27) | p-Value |
|---|---|---|---|
| CCL3 | 30 (13–56) | 45 (33–49) | 0.17 |
| CCL4 | 66 (31–101) | 69 (44–85) | 0.95 |
| CCL20 | 70 (47–163) | 38 (31–48) | <0.05 |
| CX3CL1 | 250 (226–358) | 255 (197–344) | 0.91 |
| CXCL11 | 1030 (454–1499) | 969 (293–1498) | 0.77 |
| GM-CSF | 143 (59–287) | 105 (66–270) | 0.73 |
| IFN-α2 | 63 (29–348) | 156 (68–221) | 0.30 |
| IFN-β | 493 (488–7314) | 488 (441–1054) | 0.30 |
| IFN-γ | 216 (86–304) | 112 (56–163) | 0.08 |
| TNF-α | 41 (23–54) | 24 (19–48) | 0.35 |
| IL-1β | 4.0 (2.8–4.6) | 5.2 (3.8–6.3) | <0.05 |
| IL-2 | 7.2 (4.4–8.1) | 6.9 (3.7–8.1) | 0.95 |
| IL-4 | 40 (14–593) | 810 (544–974) | <0.05 |
| IL-5 | 6.9 (2.5–16.0) | 23 (16–27) | <0.05 |
| IL-6 | 45 (25–151) | 74 (55–96) | 0.51 |
| IL-7 | 17 (15–23) | 18 (14–22) | 0.84 |
| IL-8 | 28 (13–99) | 119 (81–165) | <0.05 |
| IL-10 | 198 (166–810) | 64 (36–102) | <0.005 |
| IL-12(p70) | 5.1 (3.7–6.7) | 4.4 (2.8–6.9) | 0.77 |
| IL-13 | 12 (3–63) | 154 (49–190) | 0.001 |
| IL-15 | 39 (16–60) | 24 (12–34) | 0.06 |
| IL-17a | 28 (17–45) | 19 (13–28) | 0.28 |
| IL-18 | 977 (545–1508) | 630 (429–895) | 0.24 |
| IL-21 | 8.3 (6.5–13.6) | 9.5 (7.3–12.1) | 0.67 |
| IL-23 | 879 (635–1501) | 1016 (726–1621) | 0.57 |
| IL-33 | 39 (20–1069) | 554 (349–692) | 0.06 |
| Antibody Isotype | COVID+ (n = 17) | MIS-C (n = 26) | Control (n = 55) | COVID+ vs. Control p-Value | MIS-C vs. Control p-Value | COVID+ vs. MIS-C p-Value |
|---|---|---|---|---|---|---|
| IgM RBD | 0.58 (0.20–4.36) | 0.90 (0.25–2.05) | 0.20 (0.14–0.29) | <0.001 | 0.30 | 0.034 |
| IgM NC | 0.14 (0.07–0.32) | 0.13 (0.08–0.42) | 0.11 (0.06–0.21) | 0.017 | 0.62 | 0.18 |
| IgM Spike1 | 0.36 (0.22–13.35) | 2.53 (0.54–4.67) | 0.29 (0.15–0.42) | <0.001 | 0.60 | 0.009 |
| IgA RBD | 0.21 (0.04–2.79) | 3.34 (0.92–8.14) | 0.41 (0.08–1.92) | 1.00 | 0.002 | 0.024 |
| IgA NC | 0.10 (0.04–0.53) | 0.29 (0.14–0.49) | 0.13 (0.08–0.41) | 0.94 | 0.08 | 0.37 |
| IgA Spike1 | 0.26 (0.12–7.93) | 13.1 (3.1–30.8) | 1.98 (0.18–8.80) | 0.81 | 0.08 | 0.07 |
| IgG1 RBD | 6.09 (0.02–21.29) | 34.8 (27.7–51.9) | 103.2 (1.0–196.3) | <0.001 | 0.008 | 0.55 |
| IgG1 NC | 4.18 (0.02–13.53) | 31.7 (16.7–67.0) | 6.98 (0.08–70.1) | 0.11 | 0.88 | 0.08 |
| IgG1 Spike1 | 17.93 (0.07–85.12) | 348.0 (178.5–512.3) | 521.5 (2.0–1164.5) | <0.001 | 0.10 | 0.21 |
| IgG2 RBD | 0.23 (0.04–0.66) | 1.22 (0.81–1.65) | 0.49 (0.15–1.81) | 0.29 | 0.59 | 0.82 |
| IgG2 NC | 0.53 (0.14–1.67) | 2.21 (1.51–8.01) | 0.70 (0.28–4.15) | 0.71 | 0.13 | 0.70 |
| IgG2 Spike1 | 0.50 (0.14–2.28) | 4.28 (2.34–6.88) | 2.05 (0.32–8.58) | 0.36 | 0.60 | 0.88 |
| IgG3 RBD | 0.11 (0.03–0.90) | 1.34 (0.85–3.00) | 0.93 (0.36–3.48) | 0.61 | 0.50 | 1.00 |
| IgG3 NC | 0.38 (0.02–1.78) | 4.4 (2.3–14.3) | 0.91 (0.45–19.5) | 0.15 | 0.54 | 0.67 |
| IgG3 Spike1 | 0.27 (0.07–4.57) | 3.7 (2.2–6.4) | 2.40 (0.40–8.93) | 0.57 | 0.41 | 0.99 |
| IgG4 RBD | 0.38 (0.38–0.69) | 0.75 (0.47–1.03) | 1.75 (0.50–29.4) | 0.18 | 0.06 | 0.99 |
| IgG4 NC | 0.38 (0.13–0.69) | 1.13 (0.55–2.24) | 0.64 (0.57–0.86) | 0.94 | 0.03 | 0.07 |
| IgG4 Spike1 | 0.25 (0.25–0.56) | 0.50 (0.25–0.80) | 0.94 (0.56–25.4) | 0.16 | 0.06 | 0.99 |
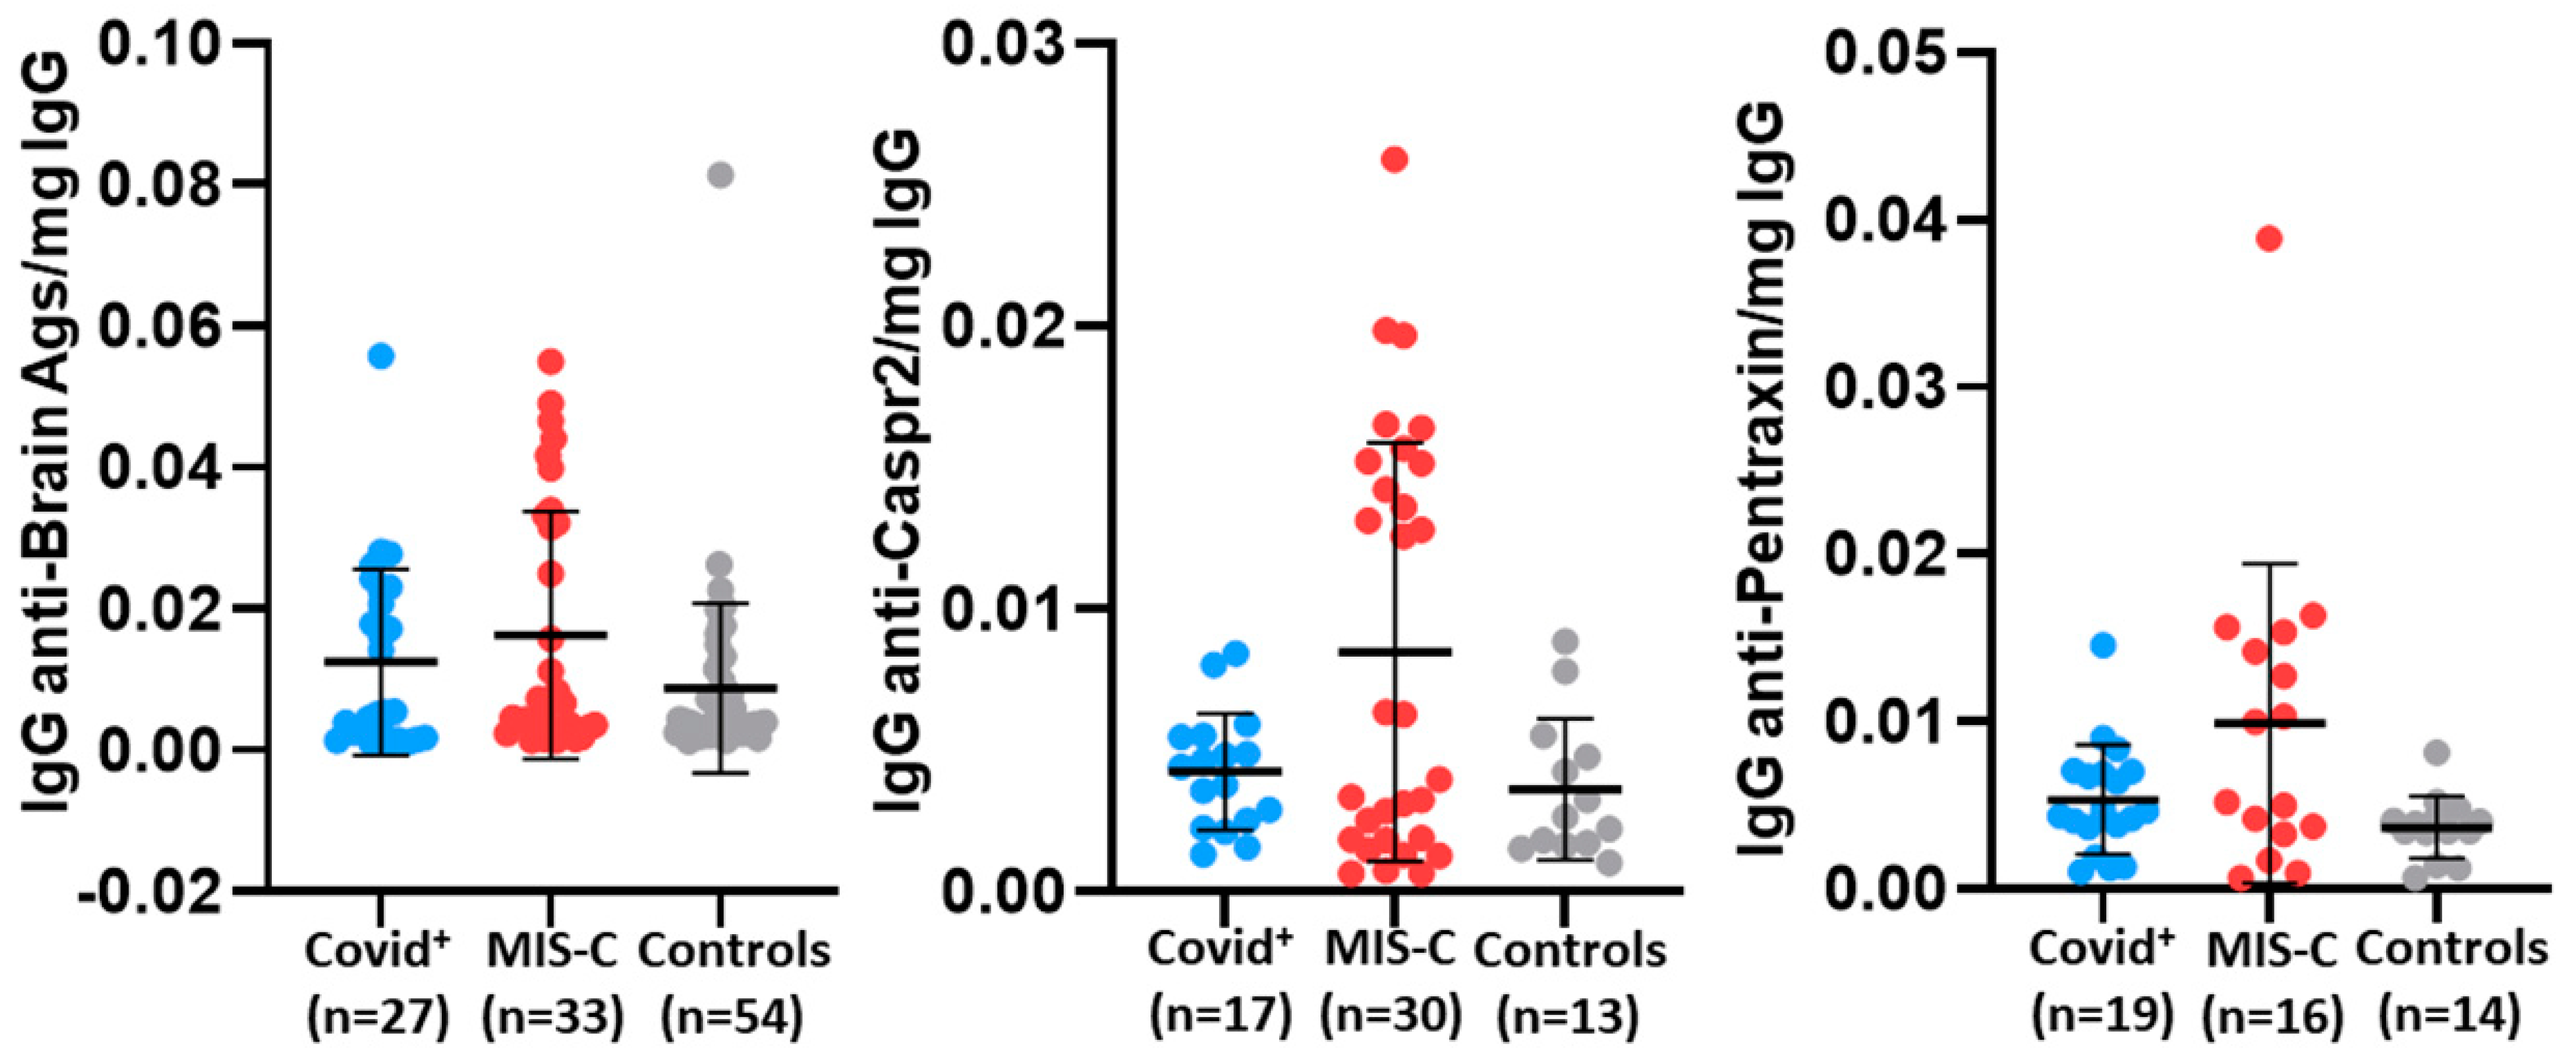
| AutoAb | COVID+ | MIS-C | Control | COVID+ vs. Control p-Value | MIS-C vs. Control p-Value | COVID+ vs. MIS-C p-Value |
|---|---|---|---|---|---|---|
| Anti-dsDNA | n = 27 | n = 29 | n = 20 | |||
| Median (IQR) | 0.008 (0.005–0.019) | 0.011 (0.009–0.032) | 0.008 (0.004–0.018) | 0.92 | 0.15 | 0.24 |
| Anti-brain | n = 27 | n = 33 | n = 54 | |||
| Median (IQR) | 0.005 (0.002–0.023) | 0.007 (0.003–0.033) | 0.004 (0.003–0.010) | 0.52 | 0.045 | 0.54 |
| Anti-AQP4 | n = 13 | n = 12 | n = 16 | |||
| Median (IQR) | 0.002 (0.001–0.005) | 0.002 (0.001–0.004) | 0.002 (0.001–0.003) | 0.77 | 0.69 | 0.99 |
| Anti-Caspr2 | n = 17 | n = 30 | n = 13 | |||
| Median (IQR) | 0.004 (0.002–0.005) | 0.005 (0.005–0.015) | 0.003 (0.002–0.005) | 0.95 | 0.028 | 0.038 |
| Anti-MT | n = 27 | n = 29 | n = 20 | |||
| Median (IQR) | 0.012 (0.005–0.021) | 0.007 (0.005–0.042) | 0.010 (0.006–0.030) | 0.58 | 0.96 | 0.35 |
| Anti-pentraxin | n = 19 | n = 16 | n = 14 | |||
| Median (IQR) | 0.005 (0.004–0.007) | 0.008 (0.003–0.015) | 0.004 (0.003–0.004) | 0.71 | 0.016 | 0.07 |
| Anti-NMDAR1 | n = 13 | n = 12 | n = 16 | |||
| Median (IQR) | 0.002 (0.001–0.003) | 0.002 (0.001–0.002) | 0.001 (0.001–0.002) | 0.07 | 0.78 | 0.32 |
Disclaimer/Publisher’s Note: The statements, opinions and data contained in all publications are solely those of the individual author(s) and contributor(s) and not of MDPI and/or the editor(s). MDPI and/or the editor(s) disclaim responsibility for any injury to people or property resulting from any ideas, methods, instructions or products referred to in the content. |
© 2024 by the authors. Licensee MDPI, Basel, Switzerland. This article is an open access article distributed under the terms and conditions of the Creative Commons Attribution (CC BY) license (https://creativecommons.org/licenses/by/4.0/).
Share and Cite
Lawrence, D.A.; Jadhav, A.; Mondal, T.K.; Carson, K.; Lee, W.T.; Hogan, A.H.; Herbst, K.W.; Michelow, I.C.; Brimacombe, M.; Salazar, J.C.; et al. Inflammatory and Autoimmune Aspects of Multisystem Inflammatory Syndrome in Children (MIS-C): A Prospective Cohort Study. Viruses 2024, 16, 950. https://doi.org/10.3390/v16060950
Lawrence DA, Jadhav A, Mondal TK, Carson K, Lee WT, Hogan AH, Herbst KW, Michelow IC, Brimacombe M, Salazar JC, et al. Inflammatory and Autoimmune Aspects of Multisystem Inflammatory Syndrome in Children (MIS-C): A Prospective Cohort Study. Viruses. 2024; 16(6):950. https://doi.org/10.3390/v16060950
Chicago/Turabian StyleLawrence, David A., Aishwarya Jadhav, Tapan K. Mondal, Kyle Carson, William T. Lee, Alexander H. Hogan, Katherine W. Herbst, Ian C. Michelow, Michael Brimacombe, Juan C. Salazar, and et al. 2024. "Inflammatory and Autoimmune Aspects of Multisystem Inflammatory Syndrome in Children (MIS-C): A Prospective Cohort Study" Viruses 16, no. 6: 950. https://doi.org/10.3390/v16060950
APA StyleLawrence, D. A., Jadhav, A., Mondal, T. K., Carson, K., Lee, W. T., Hogan, A. H., Herbst, K. W., Michelow, I. C., Brimacombe, M., Salazar, J. C., & The Connecticut Children’s COVID Collaborative. (2024). Inflammatory and Autoimmune Aspects of Multisystem Inflammatory Syndrome in Children (MIS-C): A Prospective Cohort Study. Viruses, 16(6), 950. https://doi.org/10.3390/v16060950