
T-Cell Epitope Mapping of SARS-CoV-2 Reveals Coordinated IFN-γ Production and Clonal Expansion of T Cells Facilitates Recovery from COVID-19

 , , and
Abstract
:1. Introduction
2. Methods
2.1. Study Subjects
2.2. Sample Collection
2.3. Epitopes Screening
2.4. SARS-CoV-2 Specific Short-Term Cell Line Expansion and IFN-γ Expression Assessment via Flow Cytometry
2.5. Next-Generation Sequencing (NGS) of the TCR β Gene
2.6. TCR β Gene Sequence Analyses
2.7. HLA Genotyping
2.8. Peptide Homology Analysis
2.9. Ethical Approval
2.10. Statistical Analysis
3. Results
3.1. T Cells of Patients with Moderate Disease Had a Robust Response towards SARS-CoV-2 Antigens
3.2. T-Cell Response of Patients with Severe Disease Produced Higher Levels of IL-17A
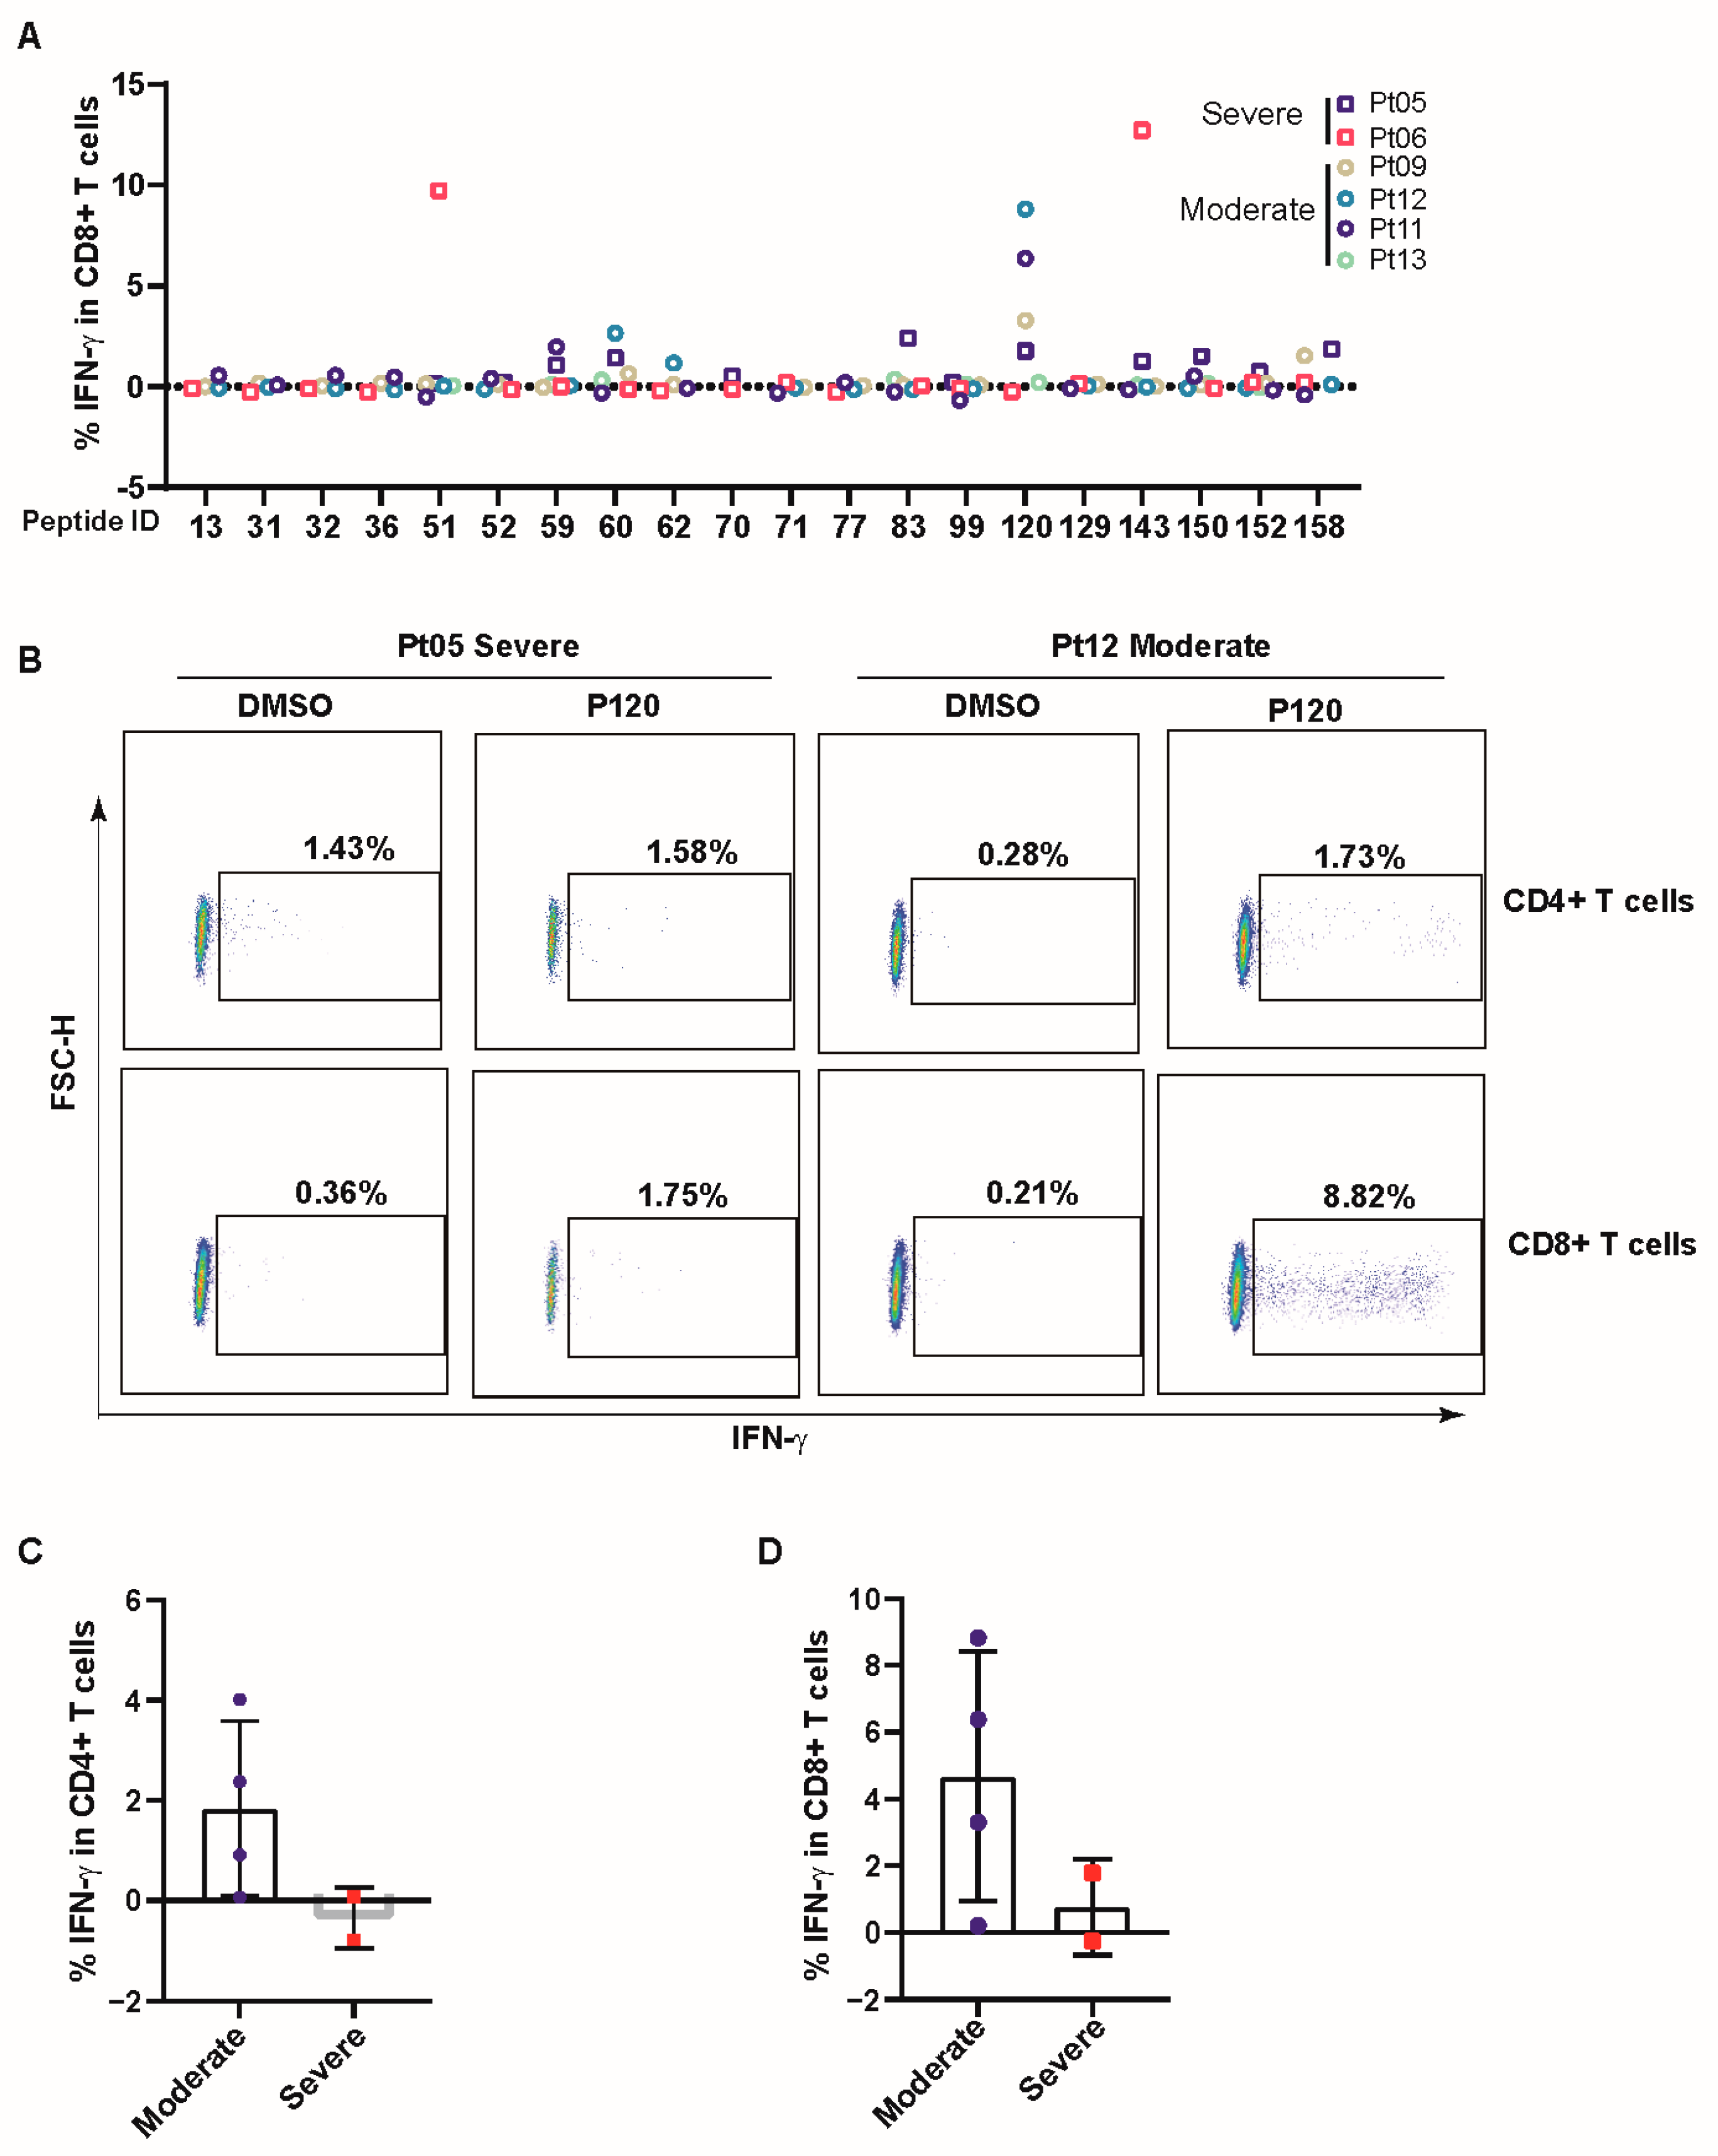
3.3. COVID-19 Patients Broadly Recognized Conserved P120 Peptide
3.4. P120 Peptide Was Conserved among SARS-CoV-2 Variants and Induced Strong TCR Expansion
4. Discussion
Author Contributions
Funding
Institutional Review Board Statement
Informed Consent Statement
Data Availability Statement
Acknowledgments
Conflicts of Interest
Appendix A

| Peptide ID | Name | Species | Antigen | Sequence | Length | Reference |
|---|---|---|---|---|---|---|
| P1 | spike-1 | SARS-CoV-2 | Spike | MFVFLVLLPLVSSQC | 15 | |
| P2 | spike-2 | SARS-CoV-2 | Spike | VNLTTRTQLPPAYTN | 15 | |
| P3 | spike-3 | SARS-CoV-2 | Spike | SFTRGVYYPDKVFRS | 15 | |
| P4 | spike-4 | SARS-CoV-2 | Spike | SVLHSTQDLFLPFFS | 15 | |
| P5 | spike-5 | SARS-CoV-2 | Spike | NVTWFHAIHVSGTNG | 15 | |
| P6 | spike-6 | SARS-CoV-2 | Spike | TKRFDNPVLPFNDGV | 15 | |
| P7 | spike-7 | SARS-CoV-2 | Spike | YFASTEKSNIIRGWI | 15 | |
| P8 | spike-8 | SARS-CoV-2 | Spike | FGTTLDSKTQSLLIV | 15 | |
| P9 | spike-9 | SARS-CoV-2 | Spike | NNATNVVIKVCEFQF | 15 | |
| P10 | spike-10 | SARS-CoV-2 | Spike | CNDPFLGVYYHKNNK | 15 | |
| P11 | spike-11 | SARS-CoV-2 | Spike | SWMESEFRVYSSANN | 15 | |
| P12 | spike-12 | SARS-CoV-2 | Spike | CTFEYVSQPFLMDLE | 15 | |
| P13 | spike-13 | SARS-CoV-2 | Spike | GKQGNFKNLREFVFK | 15 | |
| P14 | spike-14 | SARS-CoV-2 | Spike | NIDGYFKIYSKHTPI | 15 | |
| P15 | spike-15 | SARS-CoV-2 | Spike | NLVRDLPQGFSALEP | 15 | |
| P16 | spike-16 | SARS-CoV-2 | Spike | LVDLPIGINITRFQT | 15 | |
| P17 | spike-17 | SARS-CoV-2 | Spike | LLALHRSYLTPGDSS | 15 | |
| P18 | spike-18 | SARS-CoV-2 | Spike | SGWTAGAAAYYVGYL | 15 | |
| P19 | spike-19 | SARS-CoV-2 | Spike | QPRTFLLKYNENGTI | 15 | |
| P20 | spike-20 | SARS-CoV-2 | Spike | TDAVDCALDPLSETK | 15 | |
| P21 | spike-21 | SARS-CoV-2 | Spike | CTLKSFTVEKGIYQT | 15 | |
| P22 | spike-22 | SARS-CoV-2 | Spike | SNFRVQPTESIVRFP | 15 | |
| P23 | spike-23 | SARS-CoV-2 | Spike | NITNLCPFGEVFNAT | 15 | |
| P24 | spike-24 | SARS-CoV-2 | Spike | RFASVYAWNRKRISN | 15 | |
| P25 | spike-25 | SARS-CoV-2 | Spike | CVADYSVLYNSASFS | 15 | |
| P26 | spike-26 | SARS-CoV-2 | Spike | TFKCYGVSPTKLNDL | 15 | |
| P27 | spike-27 | SARS-CoV-2 | Spike | CFTNVYADSFVIRGD | 15 | |
| P28 | spike-28 | SARS-CoV-2 | Spike | EVRQIAPGQTGKIAD | 15 | |
| P29 | spike-29 | SARS-CoV-2 | Spike | YNYKLPDDFTGCVIA | 15 | |
| P30 | spike-30 | SARS-CoV-2 | Spike | WNSNNLDSKVGGNYN | 15 | |
| P31 | spike-31 | SARS-CoV-2 | Spike | YLYRLFRKSNLKPFE | 15 | |
| P32 | spike-32 | SARS-CoV-2 | Spike | RDISTEIYQAGSTPC | 15 | |
| P33 | spike-33 | SARS-CoV-2 | Spike | NGVEGFNCYFPLQSY | 15 | |
| P34 | spike-34 | SARS-CoV-2 | Spike | GFQPTNGVGYQPYRV | 15 | |
| P35 | spike-35 | SARS-CoV-2 | Spike | VVLSFELLHAPATVC | 15 | |
| P36 | spike-36 | SARS-CoV-2 | Spike | GPKKSTNLVKNKCVN | 15 | |
| P37 | spike-37 | SARS-CoV-2 | Spike | FNFNGLTGTGVLTES | 15 | |
| P38 | spike-38 | SARS-CoV-2 | Spike | NKKFLPFQQFGRDIA | 15 | |
| P39 | spike-39 | SARS-CoV-2 | Spike | DTTDAVRDPQTLEIL | 15 | |
| P40 | spike-40 | SARS-CoV-2 | Spike | DITPCSFGGVSVITP | 15 | |
| P41 | spike-41 | SARS-CoV-2 | Spike | GTNTSNQVAVLYQDV | 15 | |
| P42 | spike-42 | SARS-CoV-2 | Spike | NCTEVPVAIHADQLT | 15 | |
| P43 | spike-43 | SARS-CoV-2 | Spike | PTWRVYSTGSNVFQT | 15 | |
| P44 | spike-44 | SARS-CoV-2 | Spike | RAGCLIGAEHVNNSY | 15 | |
| P45 | spike-45 | SARS-CoV-2 | Spike | ECDIPIGAGICASYQ | 15 | |
| P46 | spike-46 | SARS-CoV-2 | Spike | TQTNSPRRARSVASQ | 15 | |
| P47 | spike-47 | SARS-CoV-2 | Spike | SIIAYTMSLGAENSV | 15 | |
| P48 | spike-48 | SARS-CoV-2 | Spike | AYSNNSIAIPTNFTI | 15 | |
| P49 | spike-49 | SARS-CoV-2 | Spike | SVTTEILPVSMTKTS | 15 | |
| P50 | spike-50 | SARS-CoV-2 | Spike | VDCTMYICGDSTECS | 15 | |
| P51 | spike-51 | SARS-CoV-2 | Spike | NLLLQYGSFCTQLNR | 15 | |
| P52 | spike-52 | SARS-CoV-2 | Spike | ALTGIAVEQDKNTQE | 15 | |
| P53 | spike-53 | SARS-CoV-2 | Spike | VFAQVKQIYKTPPIK | 15 | |
| P54 | spike-54 | SARS-CoV-2 | Spike | DFGGFNFSQILPDPS | 15 | |
| P55 | spike-55 | SARS-CoV-2 | Spike | KPSKRSFIEDLLFNK | 15 | |
| P56 | spike-56 | SARS-CoV-2 | Spike | VTLADAGFIKQYGDC | 15 | |
| P57 | spike-57 | SARS-CoV-2 | Spike | LGDIAARDLICAQKF | 15 | |
| P58 | spike-58 | SARS-CoV-2 | Spike | NGLTVLPPLLTDEMI | 15 | |
| P59 | spike-59 | SARS-CoV-2 | Spike | AQYTSALLAGTITSG | 15 | |
| P60 | spike-60 | SARS-CoV-2 | Spike | WTFGAGAALQIPFAM | 15 | |
| P61 | spike-61 | SARS-CoV-2 | Spike | QMAYRFNGIGVTQNV | 15 | |
| P62 | spike-62 | SARS-CoV-2 | Spike | LYENQKLIANQFNSA | 15 | |
| P63 | spike-63 | SARS-CoV-2 | Spike | IGKIQDSLSSTASAL | 15 | |
| P64 | spike-64 | SARS-CoV-2 | Spike | GKLQDVVNQNAQALN | 15 | |
| P65 | spike-65 | SARS-CoV-2 | Spike | TLVKQLSSNFGAISS | 15 | |
| P66 | spike-66 | SARS-CoV-2 | Spike | VLNDILSRLDKVEAE | 15 | |
| P67 | spike-67 | SARS-CoV-2 | Spike | VQIDRLITGRLQSLQ | 15 | |
| P68 | spike-68 | SARS-CoV-2 | Spike | TYVTQQLIRAAEIRA | 15 | |
| P69 | spike-69 | SARS-CoV-2 | Spike | SANLAATKMSECVLG | 15 | |
| P70 | spike-70 | SARS-CoV-2 | Spike | QSKRVDFCGKGYHLM | 15 | |
| P71 | spike-71 | SARS-CoV-2 | Spike | SFPQSAPHGVVFLHV | 15 | |
| P72 | spike-72 | SARS-CoV-2 | Spike | TYVPAQEKNFTTAPA | 15 | |
| P73 | spike-73 | SARS-CoV-2 | Spike | ICHDGKAHFPREGVF | 15 | |
| P74 | spike-74 | SARS-CoV-2 | Spike | VSNGTHWFVTQRNFY | 15 | |
| P75 | spike-75 | SARS-CoV-2 | Spike | EPQIITTDNTFVSGN | 15 | |
| P77 | spike-77 | SARS-CoV-2 | Spike | LQPELDSFKEELDKY | 15 | |
| P78 | spike-78 | SARS-CoV-2 | Spike | FKNHTSPDVDLGDIS | 15 | |
| P79 | spike-79 | SARS-CoV-2 | Spike | GINASVVNIQKEIDR | 15 | |
| P80 | spike-80 | SARS-CoV-2 | Spike | LNEVAKNLNESLIDL | 15 | |
| P81 | spike-81 | SARS-CoV-2 | Spike | QELGKYEQYIKWPWY | 15 | |
| P83 | spike-83 | SARS-CoV-2 | Spike | TIMLCCMTSCCSCLK | 15 | |
| P84 | spike-84 | SARS-CoV-2 | Spike | GCCSCGSCCKFDEDD | 15 | |
| P85 | spike-85 | SARS-CoV-2 | Spike | SEPVLKGVKLHYT | 13 | |
| P86 | nucleocapcid-1 | SARS-CoV-2 | NP | MSDNGPQNQRNAPRI | 15 | |
| P87 | nucleocapcid-2 | SARS-CoV-2 | NP | TFGGPSDSTGSNQNG | 15 | |
| P88 | nucleocapcid-3 | SARS-CoV-2 | NP | ERSGARSKQRRPQGL | 15 | |
| P89 | nucleocapcid-4 | SARS-CoV-2 | NP | PNNTASWFTALTQHG | 15 | |
| P90 | nucleocapcid-5 | SARS-CoV-2 | NP | KEDLKFPRGQGVPIN | 15 | |
| P91 | nucleocapcid-6 | SARS-CoV-2 | NP | TNSSPDDQIGYYRRA | 15 | |
| P92 | nucleocapcid-7 | SARS-CoV-2 | NP | TRRIRGGDGKMKDLS | 15 | |
| P93 | nucleocapcid-8 | SARS-CoV-2 | NP | PRWYFYYLGTGPEAG | 15 | |
| P94 | nucleocapcid-9 | SARS-CoV-2 | NP | LPYGANKDGIIWVAT | 15 | |
| P95 | nucleocapcid-10 | SARS-CoV-2 | NP | EGALNTPKDHIGTRN | 15 | |
| P96 | nucleocapcid-11 | SARS-CoV-2 | NP | PANNAAIVLQLPQGT | 15 | |
| P97 | nucleocapcid-12 | SARS-CoV-2 | NP | TLPKGFYAEGSRGGS | 15 | |
| P98 | nucleocapcid-13 | SARS-CoV-2 | NP | QASSRSSSRSRNSSR | 15 | |
| P99 | nucleocapcid-14 | SARS-CoV-2 | NP | NSTPGSSRGTSPARM | 15 | |
| P100 | nucleocapcid-15 | SARS-CoV-2 | NP | AGNGGDAALALLLLD | 15 | |
| P101 | nucleocapcid-16 | SARS-CoV-2 | NP | RLNQLESKMSGKGQQ | 15 | |
| P102 | nucleocapcid-17 | SARS-CoV-2 | NP | QQGQTVTKKSAAEAS | 15 | |
| P103 | nucleocapcid-18 | SARS-CoV-2 | NP | KKPRQKRTATKAYNV | 15 | |
| P104 | nucleocapcid-19 | SARS-CoV-2 | NP | TQAFGRRGPEQTQGN | 15 | |
| P105 | nucleocapcid-20 | SARS-CoV-2 | NP | FGDQELIRQGTDYKH | 15 | |
| P106 | nucleocapcid-21 | SARS-CoV-2 | NP | WPQIAQFAPSASAFF | 15 | |
| P107 | nucleocapcid-22 | SARS-CoV-2 | NP | GMSRIGMEVTPSGTW | 15 | |
| P108 | nucleocapcid-23 | SARS-CoV-2 | NP | LTYTGAIKLDDKDPN | 15 | |
| P109 | nucleocapcid-24 | SARS-CoV-2 | NP | FKDQVILLNKHIDAY | 15 | |
| P110 | nucleocapcid-25 | SARS-CoV-2 | NP | KTFPPTEPKKDKKKK | 15 | |
| P111 | nucleocapcid-26 | SARS-CoV-2 | NP | ADETQALPQRQKKQQ | 15 | |
| P112 | nucleocapcid-27 | SARS-CoV-2 | NP | TVTLLPAADLDDFSK | 15 | |
| P113 | nucleocapcid-28 | SARS-CoV-2 | NP | QLQQSMSSADSTQA | 14 | |
| P114 | membrane-1 | SARS-CoV-2 | M | MADSNGTITVEELKK | 15 | |
| P115 | membrane-2 | SARS-CoV-2 | M | ITVEELKKLLEQWNL | 15 | |
| P116 | membrane-3 | SARS-CoV-2 | M | KKLLEQWNLVIGFLF | 15 | |
| P117 | membrane-4 | SARS-CoV-2 | M | EQWNLVIGFLFLTWI | 15 | |
| P118 | membrane-5 | SARS-CoV-2 | M | LLESELVIGAVILRG | 15 | |
| P119 | membrane-6 | SARS-CoV-2 | M | IGAVILRGHLRIAGH | 15 | |
| P120 | membrane-7 | SARS-CoV-2 | M | HLRIAGHHLGRCDIK | 15 | |
| P121 | SARS_2016.05.006 | SARS-CoV-1 | NP | LLNKHIDAYKTFP | 13 | PMID:27287409 |
| P123 | SARS_10.1128_2 | SARS-CoV-1 | Spike | NYNYKYRYLRGKLRPF | 16 | PMID:18832706 |
| P124 | SARS_10.1128_3 | SARS-CoV-1 | Spike | AGCLIGAEHVDTSYECDI | 18 | PMID:18832706 |
| P125 | SARS_10.1128_4 | SARS-CoV-1 | NP | GETALALLLLDRLNQ | 15 | PMID:18832706 |
| P126 | SARS_10.1128_5 | SARS-CoV-1 | M | GHLRMAGHSLGRCDI | 15 | PMID:18832706 |
| P127 | SARS_10.1128_6 | SARS-CoV-1 | Spike | NFNGLTGTGVLTPSSKRF | 18 | PMID:18832706 |
| P128 | SARS_10.1128_7 | SARS-CoV-1 | Spike | DIPIGAGICASYHTVSLL | 18 | PMID:18832706 |
| P129 | SARS_10.1128_8 | SARS-CoV-1 | Spike | SWFITQRNFFSPQII | 15 | PMID:18832706 |
| P130 | SARS_1 | SARS-CoV-1 | Spike | FIAGLIAIV | 9 | PMID: 15972696 |
| P131 | SARS_2 | SARS-CoV-1 | Spike | LITGRLQSL | 9 | PMID: 15972696 |
| P132 | SARS_3 | SARS-CoV-1 | Spike | RLNEVAKNL | 11 | PMID: 15972696 |
| P133 | SARS_4 | SARS-CoV-1 | Spike | ILPDPLKPT | 9 | PMID: 15016646 |
| P134 | SARS_5 | SARS-CoV-1 | Spike | VVFLHVTYV | 9 | PMID: 15016646 |
| P135 | SARS_6 | SARS-CoV-1 | Spike | KLPDDFMGCV | 10 | PMID: 16887973 |
| P136 | SARS_7 | SARS-CoV-1 | Spike | VLNDILSRL | 9 | PMID: 15016646 |
| P137 | SARS_8 | SARS-CoV-1 | NP | LLLDRLNQL | 9 | PMID: 16887973 |
| P138 | SARS_9 | SARS-CoV-1 | NP | RLNQLESKV | 9 | PMID: 16887973 |
| P139 | SARS_10 | SARS-CoV-1 | NP | GMSRIGMEV | 9 | PMID: 16887973 |
| P140 | SARS_11 | SARS-CoV-1 | NP | WLTYHGAIKLDDKDPQF | 17 | PMID: 15528730 |
| P141 | SARS_12 | SARS-CoV-1 | NP | QFKDNVILLNKHIDAYK | 17 | PMID: 15528730 |
| P142 | SARS_13 | SARS-CoV-1 | NP | MASGGGETALALLLLDRL NQLESKV | 25 | PMID: 17183651 |
| P143 | SARS_14 | SARS-CoV-1 | NP | TWLTYHGAIKLDDKDPQF KDNVILL | 25 | PMID: 17183651 |
| P144 | SARS_15 | SARS-CoV-1 | NP | GETALALLLL | 10 | PMID: 21813600 |
| P145 | SARS_16 | SARS-CoV-1 | M | LVIGFLFLAWIMLLQFAYS NRNRF | 24 | PMID: 17183651 |
| P147 | SARS_18 | SARS-CoV-1 | M | ILLNVPLRGTIVTRPLME SELVIG | 24 | PMID: 17183651 |
| P148 | SARS_19 | SARS-CoV-1 | M | IGNYKLNTDHAGSNDN IALLV | 21 | PMID: 17183651 |
| P149 | SARS_20 | SARS-CoV-1 | M | GHLRMAGHPLGRCDI | 15 | PMID: 17183651 |
| P150 | SARS-21 | SARS-CoV-1 | ORF3a | PLQASLPFGWLVIGV | 15 | PMID:18832706 |
| P151 | SARS_01026-X | SARS-CoV-1 | Spike | DVNCTDVSTAIHADQLTP AWR | 21 | PMID: 15629033 |
| P152 | SARS_01025-8_1 | SARS-CoV-1 | NP | KDKKKKTDEAQPLPQRQ KKQ | 20 | PMID: 15629033 |
| P153 | SARS_01025-8_2 | SARS-CoV-1 | NP | QRQKKQPTVTLLPAAD MDDFSRQ | 23 | PMID: 15629033 |
| P154 | SARS_HLA-DR0401_1 | SARS-CoV-1 | Spike | NAFNCTFEYISDAFSLDV | 18 | PMID: 19050106 |
| P155 | SARS_HLA-DR0401_2 | SARS-CoV-1 | Spike | YISDAFSLDVSEKSGNFK | 18 | PMID: 19050106 |
| P156 | SARS_HLA-DR0401_3 | SARS-CoV-1 | Spike | YLRHGKLRPFERDISNVP | 18 | PMID: 19050106 |
| P157 | SARS_HLA-DR0401_4 | SARS-CoV-1 | Spike | RPFERDISNVPFSPDGK | 17 | PMID: 19050106 |
| P158 | SARS_3726.2005_1 | SARS-CoV-1 | M | MADNGTITVEELKQLLE QWNLVIGFLFLAWI | 31 | PMID: 16081901 |
| P159 | SARS_3726.2005_2 | SARS-CoV-1 | M | LMESELVIGAVIIRGHLR MAGHPLGRCDIK | 30 | PMID: 16081901 |
| P160 | SARS_5314.2004_1 | SARS-CoV-1 | NP | NNNAATVLQLPQGTTLP KGFYAEGSR | 26 | PMID: 15528730 |
| P161 | SARS_5314.2004_2 | SARS-CoV-1 | NP | KTFPPTEPK | 9 | PMID: 15528730 |
| P162 | ORF8_1 | SARS-CoV-2 | ORF8 | MKFLVFLGIITTVAA | 15 | |
| P163 | ORF8_2 | SARS-CoV-2 | ORF8 | GIITTVAAFHQECSL | 15 | |
| P164 | ORF8_3 | SARS-CoV-2 | ORF8 | AFHQECSLQSCTQHQ | 15 | |
| P165 | ORF8_4 | SARS-CoV-2 | ORF8 | LQSCTQHQPYVVDDP | 15 | |
| P166 | ORF8_5 | SARS-CoV-2 | ORF8 | QPYVVDDPCPIHFYS | 15 | |
| P167 | ORF8_6 | SARS-CoV-2 | ORF8 | PCPIHFYSKWYIRVG | 15 | |
| P168 | ORF8_7 | SARS-CoV-2 | ORF8 | SKWYIRVGARKSAPL | 15 | |
| P169 | ORF8_8 | SARS-CoV-2 | ORF8 | GARKSAPLIELCVDE | 15 | |
| P170 | ORF8_9 | SARS-CoV-2 | ORF8 | LIELCVDEAGSKSPI | 15 | |
| P171 | ORF8_10 | SARS-CoV-2 | ORF8 | EAGSKSPIQYIDIGN | 15 | |
| P172 | ORF8_11 | SARS-CoV-2 | ORF8 | IQYIDIGNYTVSCLP | 15 | |
| P173 | ORF8_12 | SARS-CoV-2 | ORF8 | NYTVSCLPFTINCQE | 15 | |
| P174 | ORF8_13 | SARS-CoV-2 | ORF8 | PFTINCQEPKLGSLV | 15 | |
| P175 | ORF8_14 | SARS-CoV-2 | ORF8 | EPKLGSLVVRCSFYE | 15 | |
| P176 | ORF8_15 | SARS-CoV-2 | ORF8 | VVRCSFYEDFLEYHD | 15 | |
| P177 | ORF8_16 | SARS-CoV-2 | ORF8 | EDFLEYHDVRVVLDF | 15 | |
| P178 | ORF8_17 | SARS-CoV-2 | ORF8 | DVRVVLDFI | 9 | |
| P179 | ORF8_A | SARS-CoV-2 | ORF8 | GNYTVSCSPFTINCQ | 15 | |
| P180 | ORF8_BC | SARS-CoV-2 | ORF8 | GNYTVSCLPFTINCQ | 15 | |
| P181 | ORF10_1 | SARS-CoV-2 | ORF10 | MGYINVFAFPFTIYS | 15 | |
| P182 | ORF10_2 | SARS-CoV-2 | ORF10 | AFPFTIYSLLLCRMN | 15 | |
| P183 | ORF10_3 | SARS-CoV-2 | ORF10 | SLLLCRMNSRNYIAQ | 15 | |
| P184 | ORF10_4 | SARS-CoV-2 | ORF10 | NSRNYIAQVDVVNFN | 15 | |
| P185 | ORF10_5 | SARS-CoV-2 | ORF10 | QVDVVNFNLT | 10 | |
| P186 | ORF3a_AB | SARS-CoV-2 | ORF3a | VQIHTIDGSSGVVNP | 15 | |
| P187 | ORF3a_C | SARS-CoV-2 | ORF3a | VQIHTIDVSSGVVNP | 15 |
Appendix B
| Patients | HLA-A | HLA-B | HLA-C | HLA-DPB1 | HLA-DRB1 | HLA-DQB1 |
|---|---|---|---|---|---|---|
| Pt01 | A*11:01:01; A*01:01:01 | B*40:01:02; B*37:01:01 | C*07:02:01; C*06:02:01 | DPB1*13:01:01; DPB1*04:02:01 | DRB1*01:01:01G; DRB1*12:02:01 | DQB1*03:01:01; DQB1*05:01:01 |
| Pt02 | A*01:01:01; A*30:01:01 | B*15:17:01; B*13:02:01 | C*07:01:02; C*06:02:01 | DPB1*05:01:01G; DPB1*14:01:01 | DRB1*13:02:01; DRB1*09:01:02 | DQB1*03:03:02; DQB1*06:04:01G |
| Pt03 | A*24:02:01; A*29:01:01 | B*07:02:01; B*35:03:01 | C*07:02:01; C*04:01:01 | DPB1*10:01:01; DPB1*02:01:02 | DRB1*15:01:01; DRB1*11:04:01G | DQB1*06:02:01; DQB1*03:01:01 |
| Pt04 | A*11:01:01; A*30:01:01 | B*13:02:01; B*46:01:01G | C*06:02:01; C*01:02:01 | DPB1*05:01:01; DPB1*17:01:01 | DRB1*07:01:01; DRB1*09:01:02 | DQB1*03:03:02; DQB1*02:02:01 |
| Pt05 | A*11:01:01; A*11:01:01 | B*38:02:01G; B*15:01:01 | C*07:02:01; C*04:01:01 | DPB1*05:01:01; DPB1*02:01:02 | DRB1*15:01:01; DRB1*12:02:01 | DQB1*06:02:01; DQB1*03:01:01 |
| Pt06 | A*24:02:01; A*33:03:01 | B*40:01:02; B*58:01:01 | C*03:02:02; C*03:04:01 | DPB1*04:01:01; DPB1*04:02:01 | DRB1*15:01:01; DRB1*03:01:01 | DQB1*05:02:01; DQB1*02:01:01G |
| Pt07 | A*02:06:01; A*02:01:01 | B*13:02:01; B*15:11:01G | C*03:03:01; C*03:04:01 | DPB1*02:01:02; DPB1*17:01:01 | DRB1*07:01:01; DRB1*09:01:02 | DQB1*03:03:02; DQB1*02:02:01 |
| Pt08 | A*24:02:01; A*26:01:01 | B*08:01:01; B*46:01:01G | C*07:02:01; C*01:02:01 | DPB1*02:01:02; DPB1*02:01:02 | DRB1*15:02:01; DRB1*03:01:01 | DQB1*05:02:01; DQB1*02:01:01G |
| Pt09 | A*02:07:01G; A*02:06:01 | B*15:01:01; B*46:01:01G | C*01:02:01; C*08:01:01 | DPB1*05:01:01; DPB1*04:02:01 | DRB1*09:01:02; DRB1*09:01:02 | DQB1*03:03:02; DQB1*03:03:02 |
| Pt10 | NA | NA | NA | NA | NA | NA |
| Pt11 | A*01:01:01; A*26:01:01 | B*40:01:02; B*40:01:02 | C*07:02:01; C*03:04:01 | DPB1*05:01:01; DPB1*05:01:01G | DRB1*11:01:01; DRB1*08:03:02 | DQB1*06:01:01; DQB1*03:01:01 |
| Pt12 | A*02:06:01; A*24:02:01 | B*40:02:01; B*51:01:01 | C*14:02:01; C*03:03:01 | DPB1*05:01:01; DPB1*02:01:02 | DRB1*16:02:01; DRB1*11:01:01 | DQB1*05:02:01; DQB1*03:01:01 |
| Pt13 | A*02:01:01; A*01:01:01 | B*37:01:01; B*46:01:01G | C*01:03:01G; C*06:02:01 | DPB1*05:01:01; DPB1*04:01:01 | DRB1*09:01:02; DRB1*10:01:01 | DQB1*03:03:02; DQB1*05:01:01 |
Appendix C
| Patients | Gender | Age | Severity | Sampling (Day) | Sampling Status | Glucocorticoid before Sampling |
|---|---|---|---|---|---|---|
| Pt05 | Female | 85 | Severe | 16 | discharge | No |
| Pt06 | Female | 60 | Severe | 38 | discharge | No |
| Pt09 | Male | 37 | Moderate | 27 | discharge | No |
| Pt11 | Male | 58 | Moderate | 14 | inpatient | No |
| Pt12 | Male | 42 | Moderate | 50 | inpatient | No |
| Pt13 | Female | 53 | Moderate | 14 | inpatient | Yes |
Appendix D
| Peptide ID | Name | Species | Antigen | Sequence | Length |
|---|---|---|---|---|---|
| P13 | spike-13 | SARS-CoV-2 | Spike | GKQGNFKNLREFVFK | 15 |
| P31 | spike-31 | SARS-CoV-2 | Spike | YLYRLFRKSNLKPFE | 15 |
| P32 | spike-32 | SARS-CoV-2 | Spike | RDISTEIYQAGSTPC | 15 |
| P36 | spike-36 | SARS-CoV-2 | Spike | GPKKSTNLVKNKCVN | 15 |
| P51 | spike-51 | SARS-CoV-2 | Spike | NLLLQYGSFCTQLNR | 15 |
| P52 | spike-52 | SARS-CoV-2 | Spike | ALTGIAVEQDKNTQE | 15 |
| P59 | spike-59 | SARS-CoV-2 | Spike | AQYTSALLAGTITSG | 15 |
| P60 | spike-60 | SARS-CoV-2 | Spike | WTFGAGAALQIPFAM | 15 |
| P62 | spike-62 | SARS-CoV-2 | Spike | LYENQKLIANQFNSA | 15 |
| P70 | spike-70 | SARS-CoV-2 | Spike | QSKRVDFCGKGYHLM | 15 |
| P71 | spike-71 | SARS-CoV-2 | Spike | SFPQSAPHGVVFLHV | 15 |
| P77 | spike-77 | SARS-CoV-2 | Spike | LQPELDSFKEELDKY | 15 |
| P83 | spike-83 | SARS-CoV-2 | Spike | TIMLCCMTSCCSCLK | 15 |
| P99 | nucleocapcid-14 | SARS-CoV-2 | NP | NSTPGSSRGTSPARM | 15 |
| P120 | membrane-7 | SARS-CoV-2 | M | HLRIAGHHLGRCDIK | 15 |
| P129 | SARS_10.1128_8 | SARS-CoV-1 | Spike | SWFITQRNFFSPQII | 15 |
| P143 | SARS_14 | SARS-CoV-1 | NP | TWLTYHGAIKLDDKD PQFKDNVILL | 25 |
| P150 | SARS-21 | SARS-CoV-1 | ORF3a | PLQASLPFGWLVIGV | 15 |
| P152 | SARS_01025-8_1 | SARS-CoV-1 | NP | KDKKKKTDEAQPLPQRQKKQ | 20 |
| P158 | SARS_3726.2005_1 | SARS-CoV-1 | M | MADNGTITVEELKQ LLEQWNLVIGFLFLAWI | 31 |
Appendix E
| Cat | Allele | Length | Peptide | Score | Rank |
|---|---|---|---|---|---|
| 1 | HLA-A*11:01 | 9 | RIAGHHLGR | 0.479526 | 0.33 |
| 2 | HLA-A*30:01 | 9 | RIAGHHLGR | 0.276817 | 0.49 |
| 3 | HLA-A*30:01 | 9 | HLRIAGHHL | 0.187564 | 0.84 |
| 4 | HLA-A*33:03 | 9 | RIAGHHLGR | 0.462495 | 0.36 |
| 5 | HLA-A*33:03 | 11 | HLRIAGHHLGR | 0.327884 | 0.62 |
| 6 | HLA-A*33:03 | 10 | LRIAGHHLGR | 0.169875 | 1.4 |
| 7 | HLA-B*07:02 | 9 | HLRIAGHHL | 0.369452 | 0.37 |
| 8 | HLA-B*08:01 | 9 | HLRIAGHHL | 0.508222 | 0.15 |
| 9 | HLA-B*13:02 | 9 | HLRIAGHHL | 0.167793 | 1.1 |
| 10 | HLA-B*15:01 | 9 | HLRIAGHHL | 0.279509 | 0.68 |
| 11 | HLA-B*46:01 | 9 | HLRIAGHHL | 0.123246 | 0.92 |
| 12 | HLA-C*01:02 | 9 | HLRIAGHHL | 0.067542 | 0.92 |
| 13 | HLA-C*03:02 | 9 | HLRIAGHHL | 0.058591 | 1.9 |
| 14 | HLA-C*03:03 | 9 | HLRIAGHHL | 0.029497 | 1.4 |
| 15 | HLA-C*03:04 | 9 | HLRIAGHHL | 0.029497 | 1.4 |
| 16 | HLA-C*07:01 | 9 | RIAGHHLGR | 0.007038 | 1.8 |
| 17 | HLA-C*07:02 | 9 | RIAGHHLGR | 0.011405 | 1.9 |
| 18 | HLA-C*14:02 | 9 | HLRIAGHHL | 0.052757 | 1.3 |
Appendix F
| Patients | HLA-A | HLA-B | HLA-C | DPB1 | DRB1 | DQB1 | IFN-γ Level | Detection Assay |
|---|---|---|---|---|---|---|---|---|
| Pt11 | A*26:01; A*01:01 | B*40:01; B*40:01 | C*03:04; C*07:02 | DPB1*05:01; DPB1*05:01 | DRB1*08:03; DRB1*11:01 | DQB1*03:01; DQB1*06:01 | 6.37% | Flow cytometry |
| Pt12 | A*24:02; A*02:06 | B*51:01; B*40:02 | C*03:03; C*14:02 | DPB1*02:01; DPB1*05:01 | DRB1*11:01; DRB1*16:02 | DQB1*03:01; DQB1*05:02 | 8.82% | Flow cytometry |
| Pt02 | A*01:01; A*30:01 | B*15:17; B*13:02 | C*07:01; C*06:02 | DPB1*05:01; DPB1*14:01 | DRB1*13:02; DRB1*09:01 | DQB1*03:03; DQB1*06:04 | 32.13 pg/mL | ELISA |
| Pt08 | A*26:01; A*24:02 | B*46:01; B*08:01 | C*01:02; C*07:02 | DPB1*02:01; DPB1*02:01 | DRB1*03:01; DRB1*15:02 | DQB1*02:01; DQB1*05:02 | 64.78 pg/mL | ELISA |
Appendix G

Appendix H

Appendix I

References
- Saxena, S.K.; Kumar, S.; Ansari, S.; Paweska, J.T.; Maurya, V.K.; Tripathi, A.K.; Abdel-Moneim, A.S. Transmission dynamics and mutational prevalence of the novel Severe acute respiratory syndrome coronavirus-2 Omicron Variant of Concern. J. Med. Virol. 2022, 94, 2160–2166. [Google Scholar] [CrossRef] [PubMed]
- Vardhana, S.; Baldo, L.; Morice, W.G.; Wherry, E.J. Understanding T cell responses to COVID-19 is essential for informing public health strategies. Sci. Immunol. 2022, 7, eabo1303. [Google Scholar] [CrossRef] [PubMed]
- Kim, J.; Seo, H.; Kim, H.W.; Kim, D.; Kwon, H.J.; Kim, Y.K. Effect of Previous COVID-19 Vaccination on Humoral Immunity 3 Months after SARS-CoV-2 Omicron Infection and Booster Effect of a Fourth COVID-19 Vaccination 2 Months after SARS-CoV-2 Omicron Infection. Viruses 2022, 14, 2458. [Google Scholar] [CrossRef] [PubMed]
- Rössler, A.; Riepler, L.; Bante, D.; von Laer, D.; Kimpel, J. SARS-CoV-2 Omicron Variant Neutralization in Serum from Vaccinated and Convalescent Persons. N. Engl. J. Med. 2022, 386, 698–700. [Google Scholar] [CrossRef] [PubMed]
- Zhao, X.; Li, D.; Ruan, W.; Chen, Z.; Zhang, R.; Zheng, A.; Qiao, S.; Zheng, X.; Zhao, Y.; Dai, L.; et al. Effects of a Prolonged Booster Interval on Neutralization of Omicron Variant. N. Engl. J. Med. 2022, 386, 894–896. [Google Scholar] [CrossRef] [PubMed]
- Sakharkar, M.; Rappazzo, C.G.; Wieland-Alter, W.F.; Hsieh, C.L.; Wrapp, D.; Esterman, E.S.; Kaku, C.I.; Wec, A.Z.; Geoghegan, J.C.; McLellan, J.S.; et al. Prolonged evolution of the human B cell response to SARS-CoV-2 infection. Sci. Immunol. 2021, 6, eabg6916. [Google Scholar] [CrossRef] [PubMed]
- Chen, Y.; Yin, S.; Tong, X.; Tao, Y.; Ni, J.; Pan, J.; Li, M.; Wan, Y.; Mao, M.; Xiong, Y.; et al. Dynamic SARS-CoV-2-specific B-cell and T-cell responses following immunization with an inactivated COVID-19 vaccine. Clin. Microbiol. Infect. 2022, 28, 410–418. [Google Scholar] [CrossRef] [PubMed]
- Wang, J.; Huang, L.; Guo, N.; Yao, Y.P.; Zhang, C.; Xu, R.; Jiao, Y.M.; Li, Y.Q.; Song, Y.R.; Wang, F.S.; et al. Dynamics of SARS-CoV-2 Antibody Responses up to 9 Months Post-Vaccination in Individuals with Previous SARS-CoV-2 Infection Receiving Inactivated Vaccines. Viruses 2023, 15, 917. [Google Scholar] [CrossRef] [PubMed]
- Eser, T.M.; Baranov, O.; Huth, M.; Ahmed, M.I.M.; Deák, F.; Held, K.; Lin, L.; Pekayvaz, K.; Leunig, A.; Nicolai, L.; et al. Nucleocapsid-specific T cell responses associate with control of SARS-CoV-2 in the upper airways before seroconversion. Nat. Commun. 2023, 14, 2952. [Google Scholar] [CrossRef]
- Koutsakos, M.; Reynaldi, A.; Lee, W.S.; Nguyen, J.; Amarasena, T.; Taiaroa, G.; Kinsella, P.; Liew, K.C.; Tran, T.; Kent, H.E.; et al. SARS-CoV-2 breakthrough infection induces rapid memory and de novo cell responses. Immunity 2023, 56, 879–892.e4. [Google Scholar] [CrossRef]
- Sekine, T.; Perez-Potti, A.; Rivera-Ballesteros, O.; Strålin, K.; Gorin, J.B.; Olsson, A.; Llewellyn-Lacey, S.; Kamal, H.; Bogdanovic, G.; Muschiol, S.; et al. Robust T Cell Immunity in Convalescent Individuals with Asymptomatic or Mild COVID-19. Cell 2020, 183, 158–168.e14. [Google Scholar] [CrossRef]
- Bange, E.M.; Han, N.A.; Wileyto, P.; Kim, J.Y.; Gouma, S.; Robinson, J.; Greenplate, A.R.; Hwee, M.A.; Porterfield, F.; Owoyemi, O.; et al. CD8(+) T cells contribute to survival in patients with COVID-19 and hematologic cancer. Nat. Med. 2021, 27, 1280–1289. [Google Scholar] [CrossRef]
- Zonozi, R.; Walters, L.C.; Shulkin, A.; Naranbhai, V.; Nithagon, P.; Sauvage, G.; Kaeske, C.; Cosgrove, K.; Nathan, A.; Tano-Menka, R.; et al. T cell responses to SARS-CoV-2 infection and vaccination are elevated in B cell deficiency and reduce risk of severe COVID-19. Sci. Transl. Med. 2023, 15, eadh4529. [Google Scholar] [CrossRef]
- McMahan, K.; Yu, J.; Mercado, N.B.; Loos, C.; Tostanoski, L.H.; Chandrashekar, A.; Liu, J.; Peter, L.; Atyeo, C.; Zhu, A. Correlates of protection against SARS-CoV-2 in rhesus macaques. Nature 2021, 590, 630–634. [Google Scholar] [CrossRef] [PubMed]
- Mathew, D.; Giles, J.R.; Baxter, A.E.; Oldridge, D.A.; Greenplate, A.R.; Wu, J.E.; Alanio, C.; Kuri-Cervantes, L.; Pampena, M.B.; D’Andrea, K. Deep immune profiling of COVID-19 patients reveals distinct immunotypes with therapeutic implications. Science 2020, 369, eabc8511. [Google Scholar] [CrossRef]
- Meckiff, B.J.; Ramírez-Suástegui, C.; Fajardo, V.; Chee, S.J.; Kusnadi, A.; Simon, H.; Eschweiler, S.; Grifoni, A.; Pelosi, E.; Weiskopf, D. Imbalance of regulatory and cytotoxic SARS-CoV-2-reactive CD4+ T cells in COVID-19. Cell 2020, 183, 1340–1353.e1316. [Google Scholar] [CrossRef] [PubMed]
- Tarke, A.; Sidney, J.; Kidd, C.K.; Dan, J.M.; Ramirez, S.I.; Yu, E.D.; Mateus, J.; da Silva Antunes, R.; Moore, E.; Rubiro, P.; et al. Comprehensive analysis of T cell immunodominance and immunoprevalence of SARS-CoV-2 epitopes in COVID-19 cases. Cell Rep. Med. 2021, 2, 100204. [Google Scholar] [CrossRef] [PubMed]
- Dolton, G.; Rius, C.; Hasan, M.S.; Wall, A.; Szomolay, B.; Behiry, E.; Whalley, T.; Southgate, J.; Fuller, A.; Morin, T.; et al. Emergence of immune escape at dominant SARS-CoV-2 killer T cell epitope. Cell 2022, 185, 2936–2951.e19. [Google Scholar] [CrossRef]
- Keeton, R.; Tincho, M.B.; Ngomti, A.; Baguma, R.; Benede, N.; Suzuki, A.; Khan, K.; Cele, S.; Bernstein, M.; Karim, F.; et al. T cell responses to SARS-CoV-2 spike cross-recognize Omicron. Nature 2022, 603, 488–492. [Google Scholar] [CrossRef]
- Tarke, A.; Sidney, J.; Methot, N.; Yu, E.D.; Zhang, Y.; Dan, J.M.; Goodwin, B.; Rubiro, P.; Sutherland, A.; Wang, E.; et al. Impact of SARS-CoV-2 variants on the total CD4(+) and CD8(+) T cell reactivity in infected or vaccinated individuals. Cell Rep. Med. 2021, 2, 100355. [Google Scholar] [CrossRef]
- Tarke, A.; Coelho, C.H.; Zhang, Z.; Dan, J.M.; Yu, E.D.; Methot, N.; Bloom, N.I.; Goodwin, B.; Phillips, E.; Mallal, S. SARS-CoV-2 vaccination induces immunological T cell memory able to cross-recognize variants from Alpha to Omicron. Cell 2022, 185, 847–859.e11. [Google Scholar] [CrossRef] [PubMed]
- Zhao, Y.; Kilian, C.; Turner, J.E.; Bosurgi, L.; Roedl, K.; Bartsch, P.; Gnirck, A.C.; Cortesi, F.; Schultheiß, C.; Hellmig, M.; et al. Clonal expansion and activation of tissue-resident memory-like Th17 cells expressing GM-CSF in the lungs of severe COVID-19 patients. Sci. Immunol. 2021, 6, eabf6692. [Google Scholar] [CrossRef]
- Zhang, J.Y.; Wang, X.M.; Xing, X.; Xu, Z.; Zhang, C.; Song, J.W.; Fan, X.; Xia, P.; Fu, J.L.; Wang, S.Y.; et al. Single-cell landscape of immunological responses in patients with COVID-19. Nat. Immunol. 2020, 21, 1107–1118. [Google Scholar] [CrossRef] [PubMed]
- Tan, A.T.; Linster, M.; Tan, C.W.; Le Bert, N.; Chia, W.N.; Kunasegaran, K.; Zhuang, Y.; Tham, C.Y.L.; Chia, A.; Smith, G.J.D.; et al. Early induction of functional SARS-CoV-2-specific T cells associates with rapid viral clearance and mild disease in COVID-19 patients. Cell Rep. 2021, 34, 108728. [Google Scholar] [CrossRef] [PubMed]
- Xu, Z.; Shi, L.; Wang, Y.; Zhang, J.; Huang, L.; Zhang, C.; Liu, S.; Zhao, P.; Liu, H.; Zhu, L.; et al. Pathological findings of COVID-19 associated with acute respiratory distress syndrome. Lancet Respir. Med. 2020, 8, 420–422. [Google Scholar] [CrossRef] [PubMed]
- Song, J.W.; Zhang, C.; Fan, X.; Meng, F.P.; Xu, Z.; Xia, P.; Cao, W.J.; Yang, T.; Dai, X.P.; Wang, S.Y.; et al. Immunological and inflammatory profiles in mild and severe cases of COVID-19. Nat. Commun. 2020, 11, 3410. [Google Scholar] [CrossRef] [PubMed]
- Liao, M.; Liu, Y.; Yuan, J.; Wen, Y.; Xu, G.; Zhao, J.; Cheng, L.; Li, J.; Wang, X.; Wang, F.; et al. Single-cell landscape of bronchoalveolar immune cells in patients with COVID-19. Nat. Med. 2020, 26, 842–844. [Google Scholar] [CrossRef] [PubMed]
- Ren, X.; Wen, W.; Fan, X.; Hou, W.; Su, B.; Cai, P.; Li, J.; Liu, Y.; Tang, F.; Zhang, F.; et al. COVID-19 immune features revealed by a large-scale single-cell transcriptome atlas. Cell 2021, 184, 1895–1913.e19. [Google Scholar] [CrossRef] [PubMed]
- Faure, E.; Poissy, J.; Goffard, A.; Fournier, C.; Kipnis, E.; Titecat, M.; Bortolotti, P.; Martinez, L.; Dubucquoi, S.; Dessein, R.; et al. Distinct immune response in two MERS-CoV-infected patients: Can we go from bench to bedside? PLoS ONE 2014, 9, e88716. [Google Scholar] [CrossRef]
- Josset, L.; Menachery, V.D.; Gralinski, L.E.; Agnihothram, S.; Sova, P.; Carter, V.S.; Yount, B.L.; Graham, R.L.; Baric, R.S.; Katze, M.G. Cell host response to infection with novel human coronavirus EMC predicts potential antivirals and important differences with SARS coronavirus. mBio 2013, 4, e00165-13. [Google Scholar] [CrossRef]
- Li, C.; Yang, P.; Sun, Y.; Li, T.; Wang, C.; Wang, Z.; Zou, Z.; Yan, Y.; Wang, W.; Wang, C.; et al. IL-17 response mediates acute lung injury induced by the 2009 pandemic influenza A (H1N1) virus. Cell Res. 2012, 22, 528–538. [Google Scholar] [CrossRef] [PubMed]
- Grifoni, A.; Weiskopf, D.; Ramirez, S.I.; Mateus, J.; Dan, J.M.; Moderbacher, C.R.; Rawlings, S.A.; Sutherland, A.; Premkumar, L.; Jadi, R.S.; et al. Targets of T Cell Responses to SARS-CoV-2 Coronavirus in Humans with COVID-19 Disease and Unexposed Individuals. Cell 2020, 181, 1489–1501.e15. [Google Scholar] [CrossRef] [PubMed]
- Lucas, C.; Wong, P.; Klein, J.; Castro, T.B.R.; Silva, J.; Sundaram, M.; Ellingson, M.K.; Mao, T.; Oh, J.E.; Israelow, B.; et al. Longitudinal analyses reveal immunological misfiring in severe COVID-19. Nature 2020, 584, 463–469. [Google Scholar] [CrossRef] [PubMed]
- Huang, C.; Wang, Y.; Li, X.; Ren, L.; Zhao, J.; Hu, Y.; Zhang, L.; Fan, G.; Xu, J.; Gu, X.; et al. Clinical features of patients infected with 2019 novel coronavirus in Wuhan, China. Lancet 2020, 395, 497–506. [Google Scholar] [CrossRef] [PubMed]
- Ogura, H.; Gohda, J.; Lu, X.; Yamamoto, M.; Takesue, Y.; Son, A.; Doi, S.; Matsushita, K.; Isobe, F.; Fukuda, Y.; et al. Dysfunctional Sars-CoV-2-M protein-specific cytotoxic T lymphocytes in patients recovering from severe COVID-19. Nat. Commun. 2022, 13, 7063. [Google Scholar] [CrossRef] [PubMed]
- Peng, Y.; Felce, S.L.; Dong, D.; Penkava, F.; Mentzer, A.J.; Yao, X.; Liu, G.; Yin, Z.; Chen, J.L.; Lu, Y.; et al. An immunodominant NP(105-113)-B*07:02 cytotoxic T cell response controls viral replication and is associated with less severe COVID-19 disease. Nat. Immunol. 2022, 23, 50–61. [Google Scholar] [CrossRef] [PubMed]
- Popescu, I.; Snyder, M.E.; Iasella, C.J.; Hannan, S.J.; Koshy, R.; Burke, R.; Das, A.; Brown, M.J.; Lyons, E.J.; Lieber, S.C.; et al. CD4(+) T-Cell Dysfunction in Severe COVID-19 Disease Is Tumor Necrosis Factor-α/Tumor Necrosis Factor Receptor 1-Dependent. Am. J. Respir. Crit. Care Med. 2022, 205, 1403–1418. [Google Scholar] [CrossRef] [PubMed]
- Sattler, A.; Angermair, S.; Stockmann, H.; Heim, K.M.; Khadzhynov, D.; Treskatsch, S.; Halleck, F.; Kreis, M.E.; Kotsch, K. SARS–CoV-2–specific T cell responses and correlations with COVID-19 patient predisposition. J. Clin. Investig. 2020, 130, 6477–6489. [Google Scholar] [CrossRef] [PubMed]
- Obermair, F.J.; Renoux, F.; Heer, S.; Lee, C.H.; Cereghetti, N.; Loi, M.; Maestri, G.; Haldner, Y.; Wuigk, R.; Iosefson, O.; et al. High-resolution profiling of MHC II peptide presentation capacity reveals SARS-CoV-2 CD4 T cell targets and mechanisms of immune escape. Sci. Adv. 2022, 8, eabl5394. [Google Scholar] [CrossRef] [PubMed]
- Hotop, S.K.; Reimering, S.; Shekhar, A.; Asgari, E.; Beutling, U.; Dahlke, C.; Fathi, A.; Khan, F.; Lütgehetmann, M.; Ballmann, R.; et al. Peptide microarrays coupled to machine learning reveal individual epitopes from human antibody responses with neutralizing capabilities against SARS-CoV-2. Emerg. Microbes Infect. 2022, 11, 1037–1048. [Google Scholar] [CrossRef]
- Heide, J.; Schulte, S.; Kohsar, M.; Brehm, T.T.; Herrmann, M.; Karsten, H.; Marget, M.; Peine, S.; Johansson, A.M.; Sette, A.; et al. Broadly directed SARS-CoV-2-specific CD4+ T cell response includes frequently detected peptide specificities within the membrane and nucleoprotein in patients with acute and resolved COVID-19. PLoS Pathog. 2021, 17, e1009842. [Google Scholar] [CrossRef] [PubMed]
- Szardenings, M.; Delaroque, N.; Kern, K.; Ramirez-Caballero, L.; Puder, M.; Ehrentreich-Förster, E.; Beige, J.; Zürner, S.; Popp, G.; Wolf, J.; et al. Detection of Antibodies against Endemic and SARS-CoV-2 Coronaviruses with Short Peptide Epitopes. Vaccines 2023, 11, 1403. [Google Scholar] [CrossRef] [PubMed]
- Kalita, P.; Padhi, A.K.; Zhang, K.Y.J.; Tripathi, T. Design of a peptide-based subunit vaccine against novel coronavirus SARS-CoV-2. Microb. Pathog. 2020, 145, 104236. [Google Scholar] [CrossRef] [PubMed]
- Gao, A.; Chen, Z.; Amitai, A.; Doelger, J.; Mallajosyula, V.; Sundquist, E.; Pereyra Segal, F.; Carrington, M.; Davis, M.M.; Streeck, H.; et al. Learning from HIV-1 to predict the immunogenicity of T cell epitopes in SARS-CoV-2. iScience 2021, 24, 102311. [Google Scholar] [CrossRef] [PubMed]
- Grifoni, A.; Sidney, J.; Zhang, Y.; Scheuermann, R.H.; Peters, B.; Sette, A. A Sequence Homology and Bioinformatic Approach Can Predict Candidate Targets for Immune Responses to SARS-CoV-2. Cell Host Microbe 2020, 27, 671–680.e2. [Google Scholar] [CrossRef] [PubMed]
- van den Dijssel, J.; Hagen, R.R.; de Jongh, R.; Steenhuis, M.; Rispens, T.; Geerdes, D.M.; Mok, J.Y.; Kragten, A.H.; Duurland, M.C.; Verstegen, N.J.; et al. Parallel detection of SARS-CoV-2 epitopes reveals dynamic immunodominance profiles of CD8(+) T memory cells in convalescent COVID-19 donors. Clin. Transl. Immunol. 2022, 11, e1423. [Google Scholar] [CrossRef] [PubMed]
- Jin, X.; Ding, Y.; Sun, S.; Wang, X.; Zhou, Z.; Liu, X.; Li, M.; Chen, X.; Shen, A.; Wu, Y.; et al. Screening HLA-A-restricted T cell epitopes of SARS-CoV-2 and the induction of CD8(+) T cell responses in HLA-A transgenic mice. Cell Mol. Immunol. 2021, 18, 2588–2608. [Google Scholar] [CrossRef]
- Janbazian, L.; Price, D.A.; Canderan, G.; Filali-Mouhim, A.; Asher, T.E.; Ambrozak, D.R.; Scheinberg, P.; Boulassel, M.R.; Routy, J.P.; Koup, R.A.; et al. Clonotype and repertoire changes drive the functional improvement of HIV-specific CD8 T cell populations under conditions of limited antigenic stimulation. J. Immunol. 2012, 188, 1156–1167. [Google Scholar] [CrossRef]


| Patients | Gender | Age | Severity | Sampling (Day) | Sampling Status | Glucocorticoid before Sampling |
|---|---|---|---|---|---|---|
| Pt01 | male | 46 | Moderate | 17 | discharge | No |
| Pt02 | male | 39 | Severe | 33 | inpatient | Yes |
| Pt03 | male | 48 | Severe | 30 | discharge | Yes |
| Pt04 | male | 48 | Moderate | 30 | discharge | No |
| Pt05 | female | 85 | Severe | 16 | discharge | No |
| Pt06 | female | 60 | Severe | 38 | discharge | No |
| Pt07 | male | 37 | Moderate | 24 | discharge | Yes |
| Pt08 | female | 44 | Moderate | 23 | discharge | No |
| Pt10 | female | 48 | Moderate | 16 | inpatient | No |
| HD-1 | Male | 29 | NA | NA | HD | NA |
| HD-2 | Male | 30 | NA | NA | HD | NA |
| HD-3 | Female | 27 | NA | NA | HD | NA |
| HD-4 | Female | 27 | NA | NA | HD | NA |
| HD-5 | Female | 28 | NA | NA | HD | NA |
| HD-6 | Male | 28 | NA | NA | HD | NA |
| HD-7 | Male | 26 | NA | NA | HD | NA |
| HD-8 | Female | 26 | NA | NA | HD | NA |
| HD-9 | Female | 25 | NA | NA | HD | NA |
Disclaimer/Publisher’s Note: The statements, opinions and data contained in all publications are solely those of the individual author(s) and contributor(s) and not of MDPI and/or the editor(s). MDPI and/or the editor(s) disclaim responsibility for any injury to people or property resulting from any ideas, methods, instructions or products referred to in the content. |
© 2024 by the authors. Licensee MDPI, Basel, Switzerland. This article is an open access article distributed under the terms and conditions of the Creative Commons Attribution (CC BY) license (https://creativecommons.org/licenses/by/4.0/).
Share and Cite
Fan, X.; Song, J.-W.; Cao, W.-J.; Zhou, M.-J.; Yang, T.; Wang, J.; Meng, F.-P.; Shi, M.; Zhang, C.; Wang, F.-S. T-Cell Epitope Mapping of SARS-CoV-2 Reveals Coordinated IFN-γ Production and Clonal Expansion of T Cells Facilitates Recovery from COVID-19. Viruses 2024, 16, 1006. https://doi.org/10.3390/v16071006
Fan X, Song J-W, Cao W-J, Zhou M-J, Yang T, Wang J, Meng F-P, Shi M, Zhang C, Wang F-S. T-Cell Epitope Mapping of SARS-CoV-2 Reveals Coordinated IFN-γ Production and Clonal Expansion of T Cells Facilitates Recovery from COVID-19. Viruses. 2024; 16(7):1006. https://doi.org/10.3390/v16071006
Chicago/Turabian StyleFan, Xing, Jin-Wen Song, Wen-Jing Cao, Ming-Ju Zhou, Tao Yang, Jing Wang, Fan-Ping Meng, Ming Shi, Chao Zhang, and Fu-Sheng Wang. 2024. "T-Cell Epitope Mapping of SARS-CoV-2 Reveals Coordinated IFN-γ Production and Clonal Expansion of T Cells Facilitates Recovery from COVID-19" Viruses 16, no. 7: 1006. https://doi.org/10.3390/v16071006