
Relationship between Modern ART Regimens and Immunosenescence Markers in Patients with Chronic HIV Infection
 , , , , , ,
  and
and
Abstract
1. Introduction
2. Materials and Methods
2.1. Participants’ Selection
2.2. Collection of Biological Material
2.3. Biomarkers Measurement
2.4. Viral Load Measurement
2.5. Statistical Methods
3. Results
3.1. Relationship between the Studied Indicators and Some Variables
- IL-12p70 was weakly positively related to the age (Spearman’s rho = 0.237, p = 0.034). A significant difference was found between the two sexes only for IL-4 (p = 0.002), which was significantly higher in men.
- The relationship between examined biomarkers and the baseline CD4 count and the clinical category of HIV was evaluated with Spearman’s rank correlation coefficient. No significantly different values of the indicators were proven depending on the baseline CD4 count. The baseline clinical category of HIV was weakly positively related to IL-18 (Sperman’s rho = 0.226, p = 0.044) and IL-4 (Sperman’s rho = 0.244, p = 0.029).
- No significantly different values of the indicators were proven depending on the presence of cardiovascular diseases (CVDs), sexually transmitted diseases (STDs), or other diseases.
- No significantly different values of the indicators were proven depending on the presence of smoking, although the differences in the values of sCD14 were higher in smokers but with borderline significance (p = 0.058). No significantly different values of the indicators were proven depending on the alcohol use.
- IFN-γ was found to be related to the duration of cART through a weak and inverse relationship, i.e., the increased duration of the therapy leads to a decreased value of IFN-γ (Spearman’s rho = −0.271, p = 0.015). IL-4 was moderately strongly positively related to the duration of cART (Spearman’s rho = 0.306, p = 0.006). D-dimer was weekly positively related to the duration of cART (Spearman’s rho = 0.228, p = 0.043).
- Significantly different values of the indicators were proven depending on whether the patient switched therapy in the values of IL-2 (p = 0.005) and IL-5 (p = 0.005)—patients who switched had higher values.
- We found some dependencies between the studied indicators and the duration of taking some of the cART regimens. IFN-γ was negatively related to the duration of the previous intake of integrase inhibitors (Sperman’s rho = −0.485, p = 0.049) and nucleoside analogs (Sperman’s rho = −0.404, p = 0.010). IL-2 was positively related to the duration of current non-nucleoside analogs use (Sperman’s rho = 0.442, p = 0.019). IL-2 was positively related to the total duration of nucleoside analogs use (Sperman’s rho = 0.259, p = 0.020) (Table 3).
3.2. Distribution of Biomarkers Depending on the cART Regimen
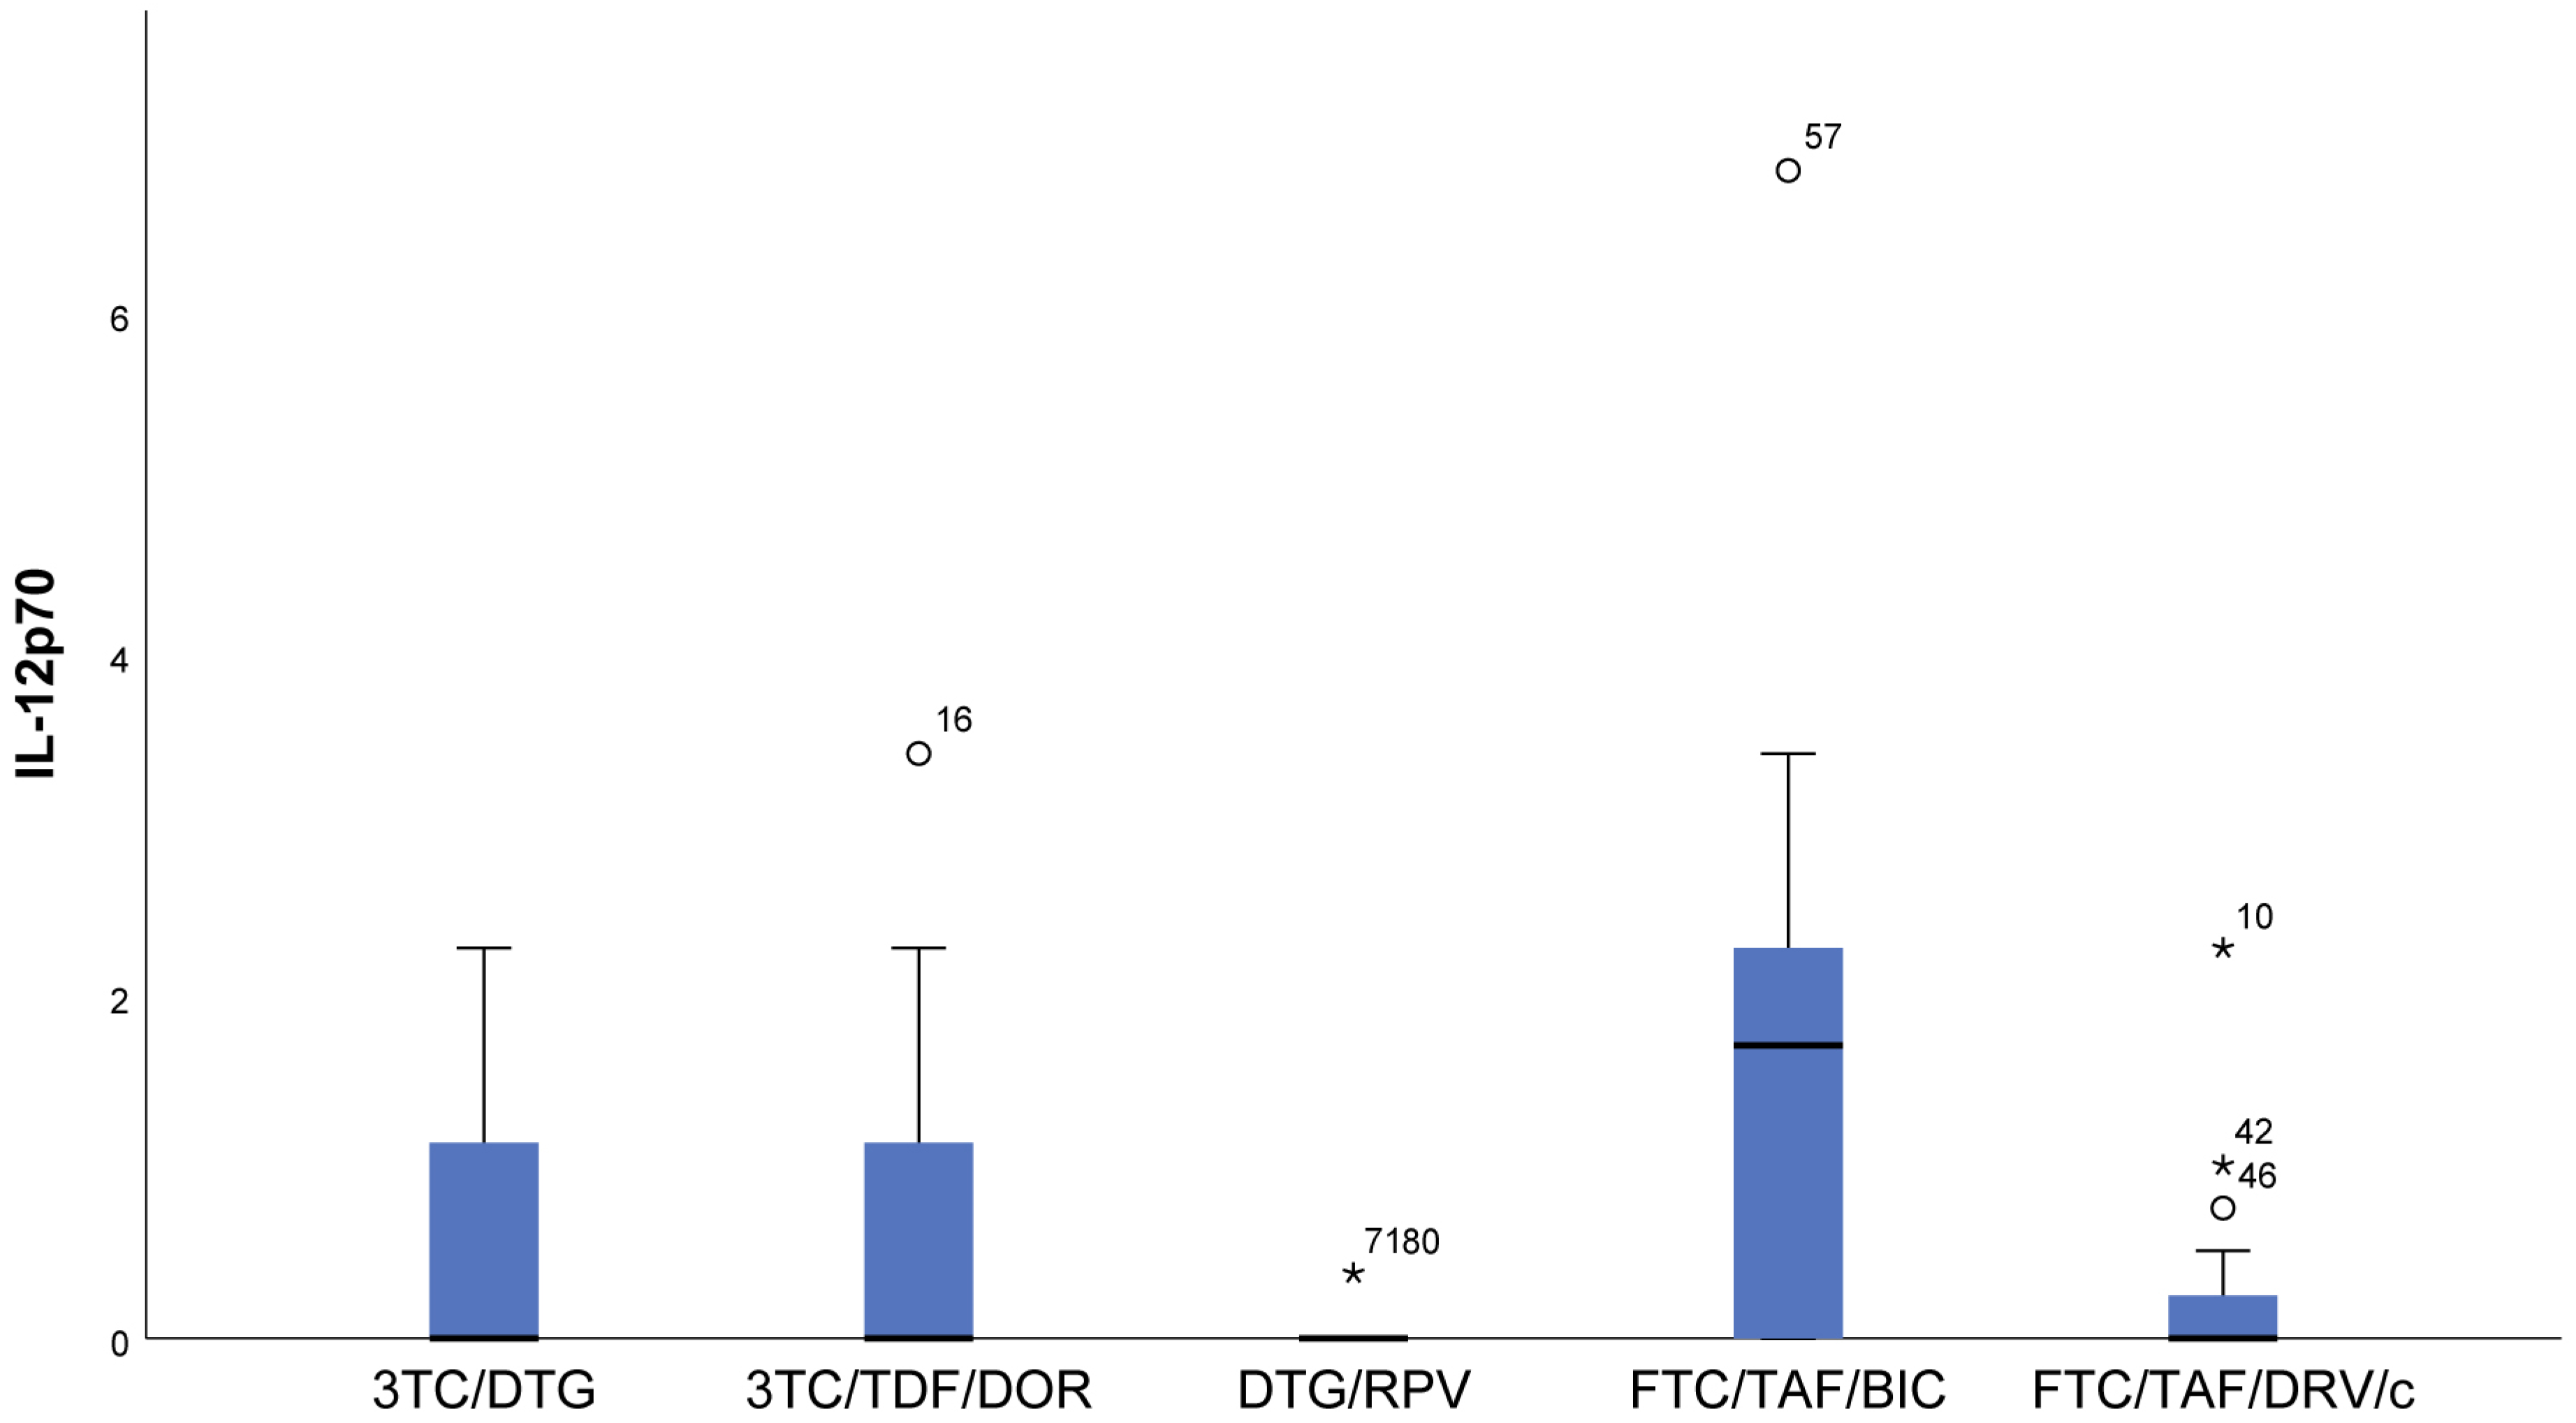
- With regards to IL12p70, only in the FTC/TAF/BIC regimen is the median distinctly higher, i.e., the patients from this group tend to show significantly higher values of this indicator compared to all other groups. Regarding the 3TC/DTG and 3TC/TFF/DOR regimens, the results are very similar (Figure 2).
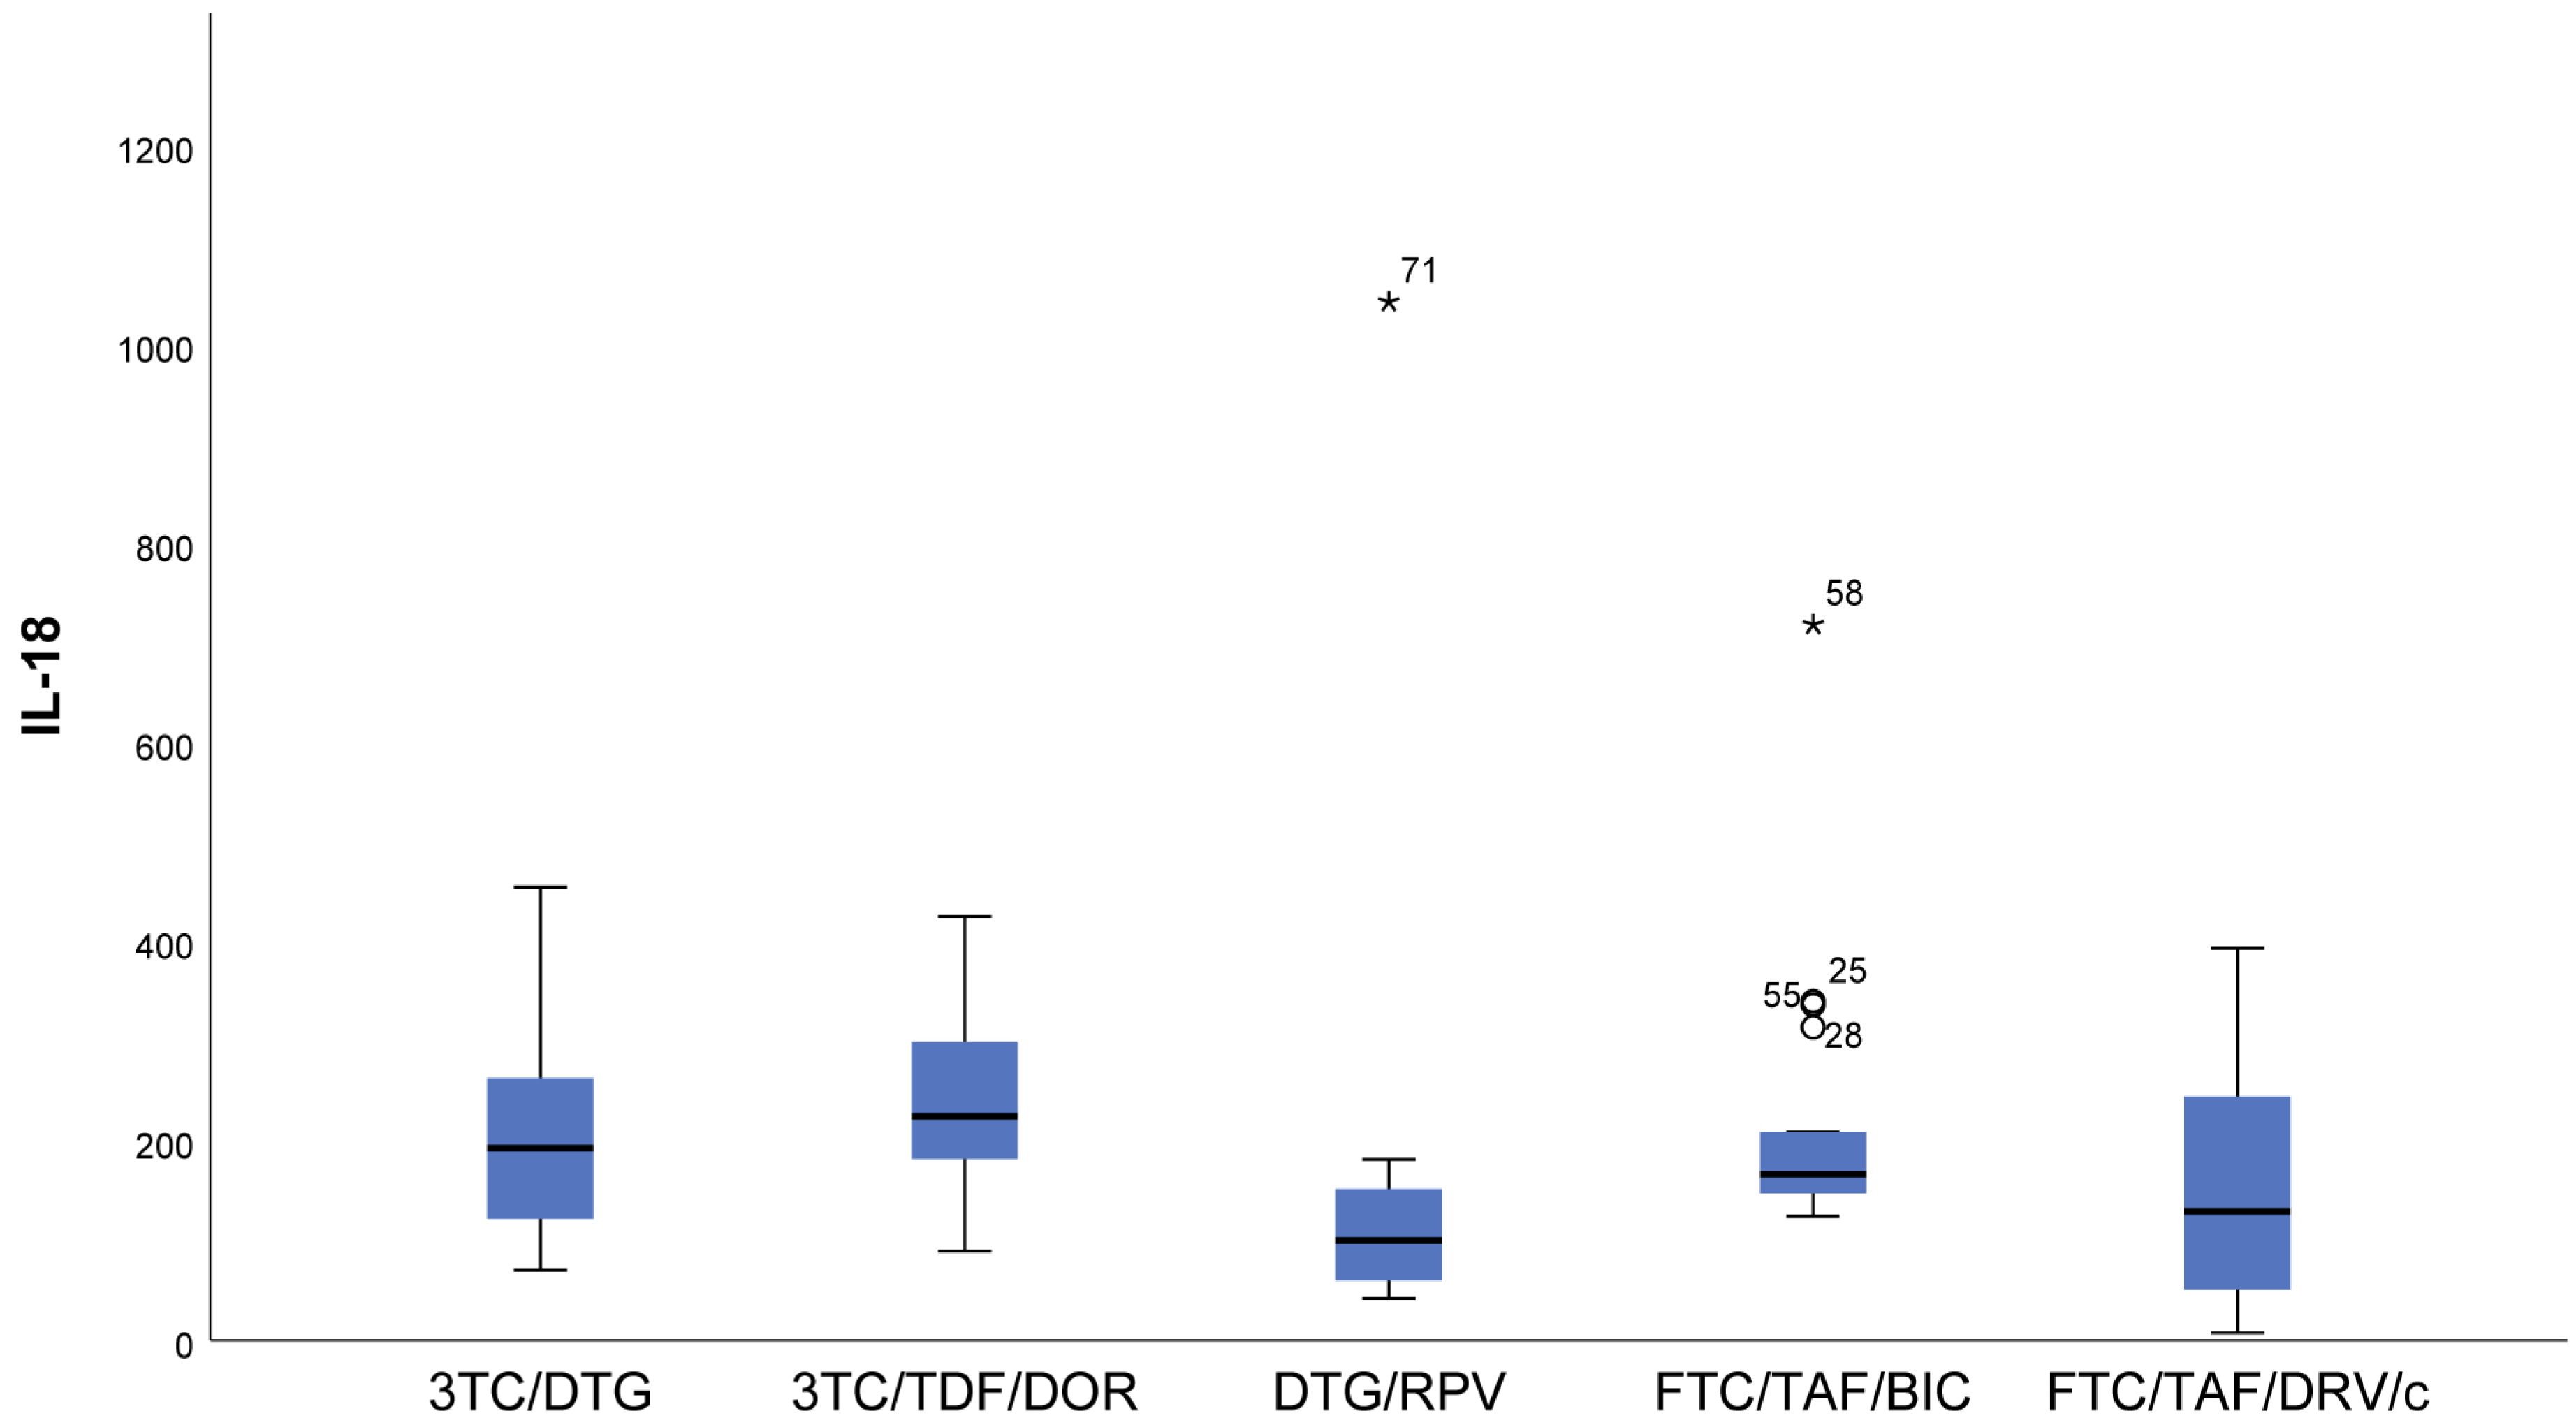
- IL-18 (p = 0.009) results showed that in patients following NRTIs+NNRTI (3TC/TDF/DOR) and NRTIs+INI or NRTI+INI (FTC/TAF/BIC and 3TC/DTG) regimens, higher values than in those following INI+NNRTI (DTG/RPV) and NRTIs+PI (FTC/TAF/DRV/c) regimens were observed, although we reported increased values for the other two regimens as well (Figure 3).
- In FTC/TAF/BIC patients, the lowest variation in the IL-18 values was observed, and in patients in the given group, close values of the studied parameter were observed, with the range corresponding approximately to the mean values of the measured parameter. Q3 (75th percentile) for the 3TC/TDF/DOR regimen is higher than that reported in all other groups, i.e., 25% of the highest measured values of 3TC/TDF/DOR were higher than that reported in the other groups (Figure 3).
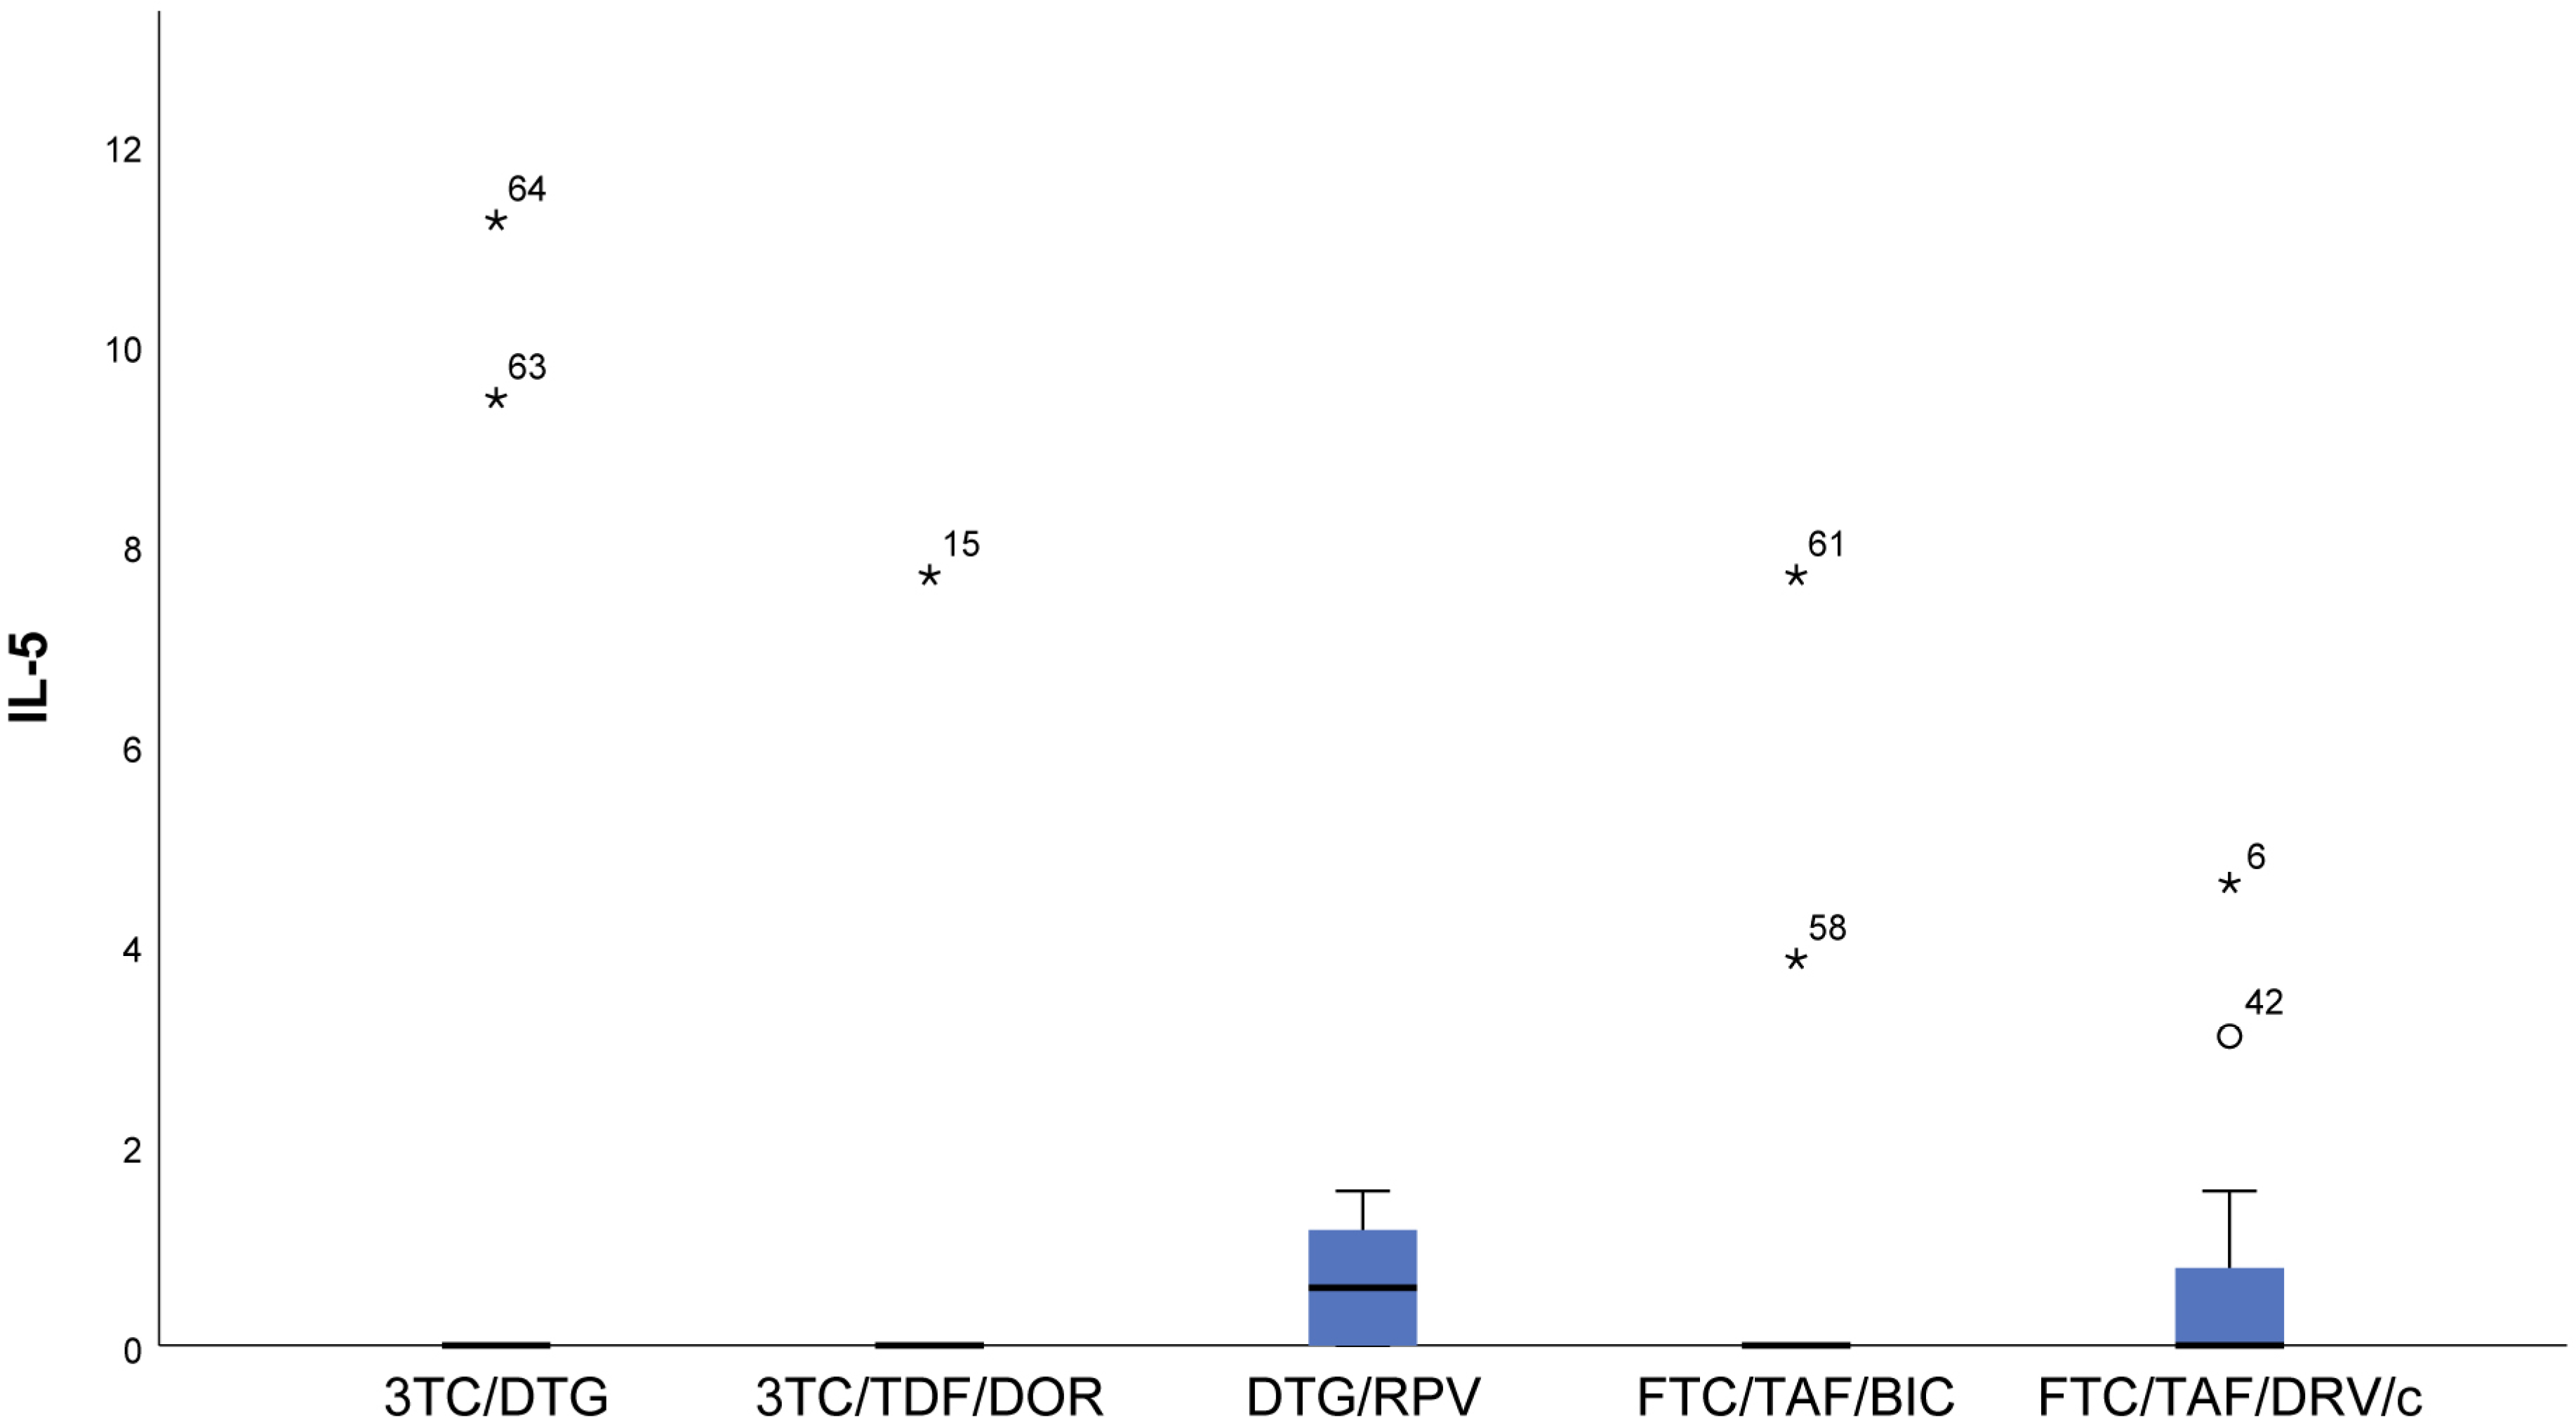
- Patients taking NRTIs+INI or NRTI+INI (FTC/TAF/BIC and 3TC/DTG) and NRTIs+NNRTI (3TC/TDF/DOR) showed the lowest IL-5 (p = 0.019) values (Figure 4).
- There was a trend toward measurement of increased IL-5 values in the DTG/RPV and FTC/TAF/DRV/c groups, with these values being slightly higher for the DTG/RPV regimen (Figure 4).
- The highest sCD14 (p = 0.082) values were reported in the NRTIs+PI (FTC/TAF/DRV/c) regimen, i.e., in a regimen containing a protease inhibitor. We found the lowest values in patients following NRTIs+INI or NRTI+INI (FTC/TAF/BIC and 3TC/DTG) and NRTIs+NNRTI (3TC/TDF/DOR) regimens (Figure 5).
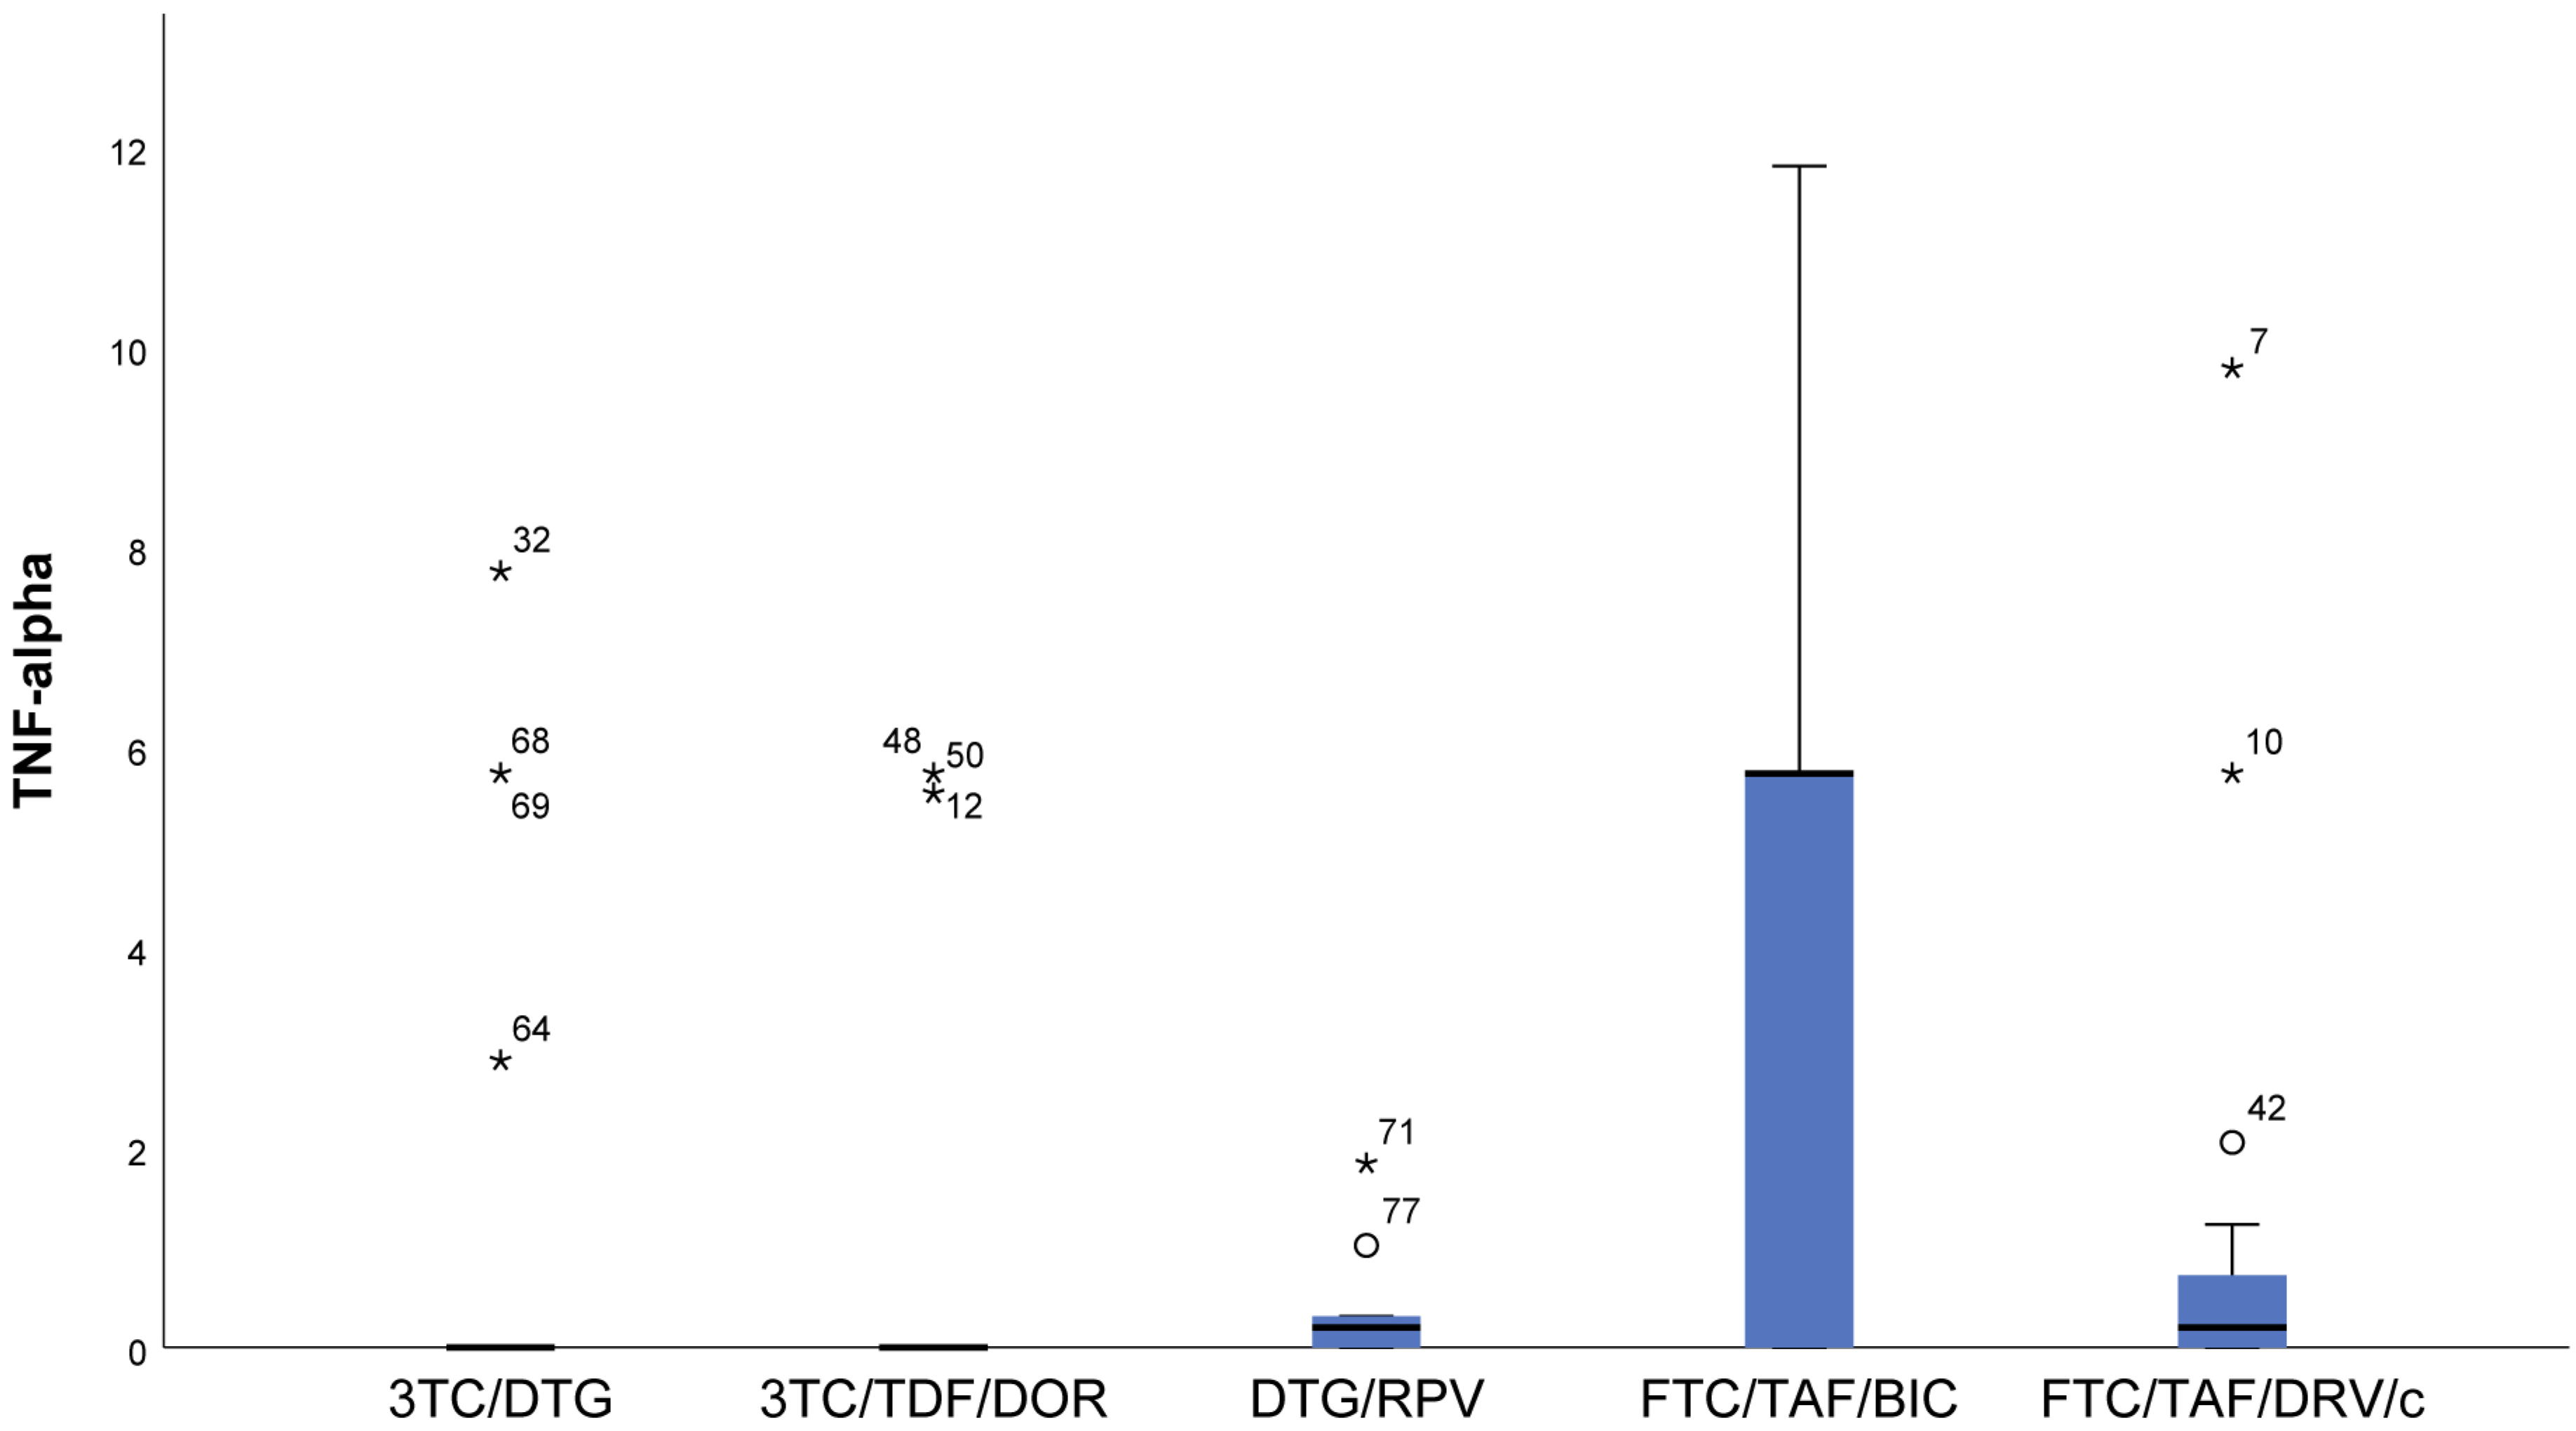
- In the FTC/TAF/BIC regimen, the IQR is the widest, and the median is high, which shows markedly higher values of TNF-α (p = 0.007) compared to all other groups (Figure 6).
3.3. Distribution of Biomarkers According to Drug Class
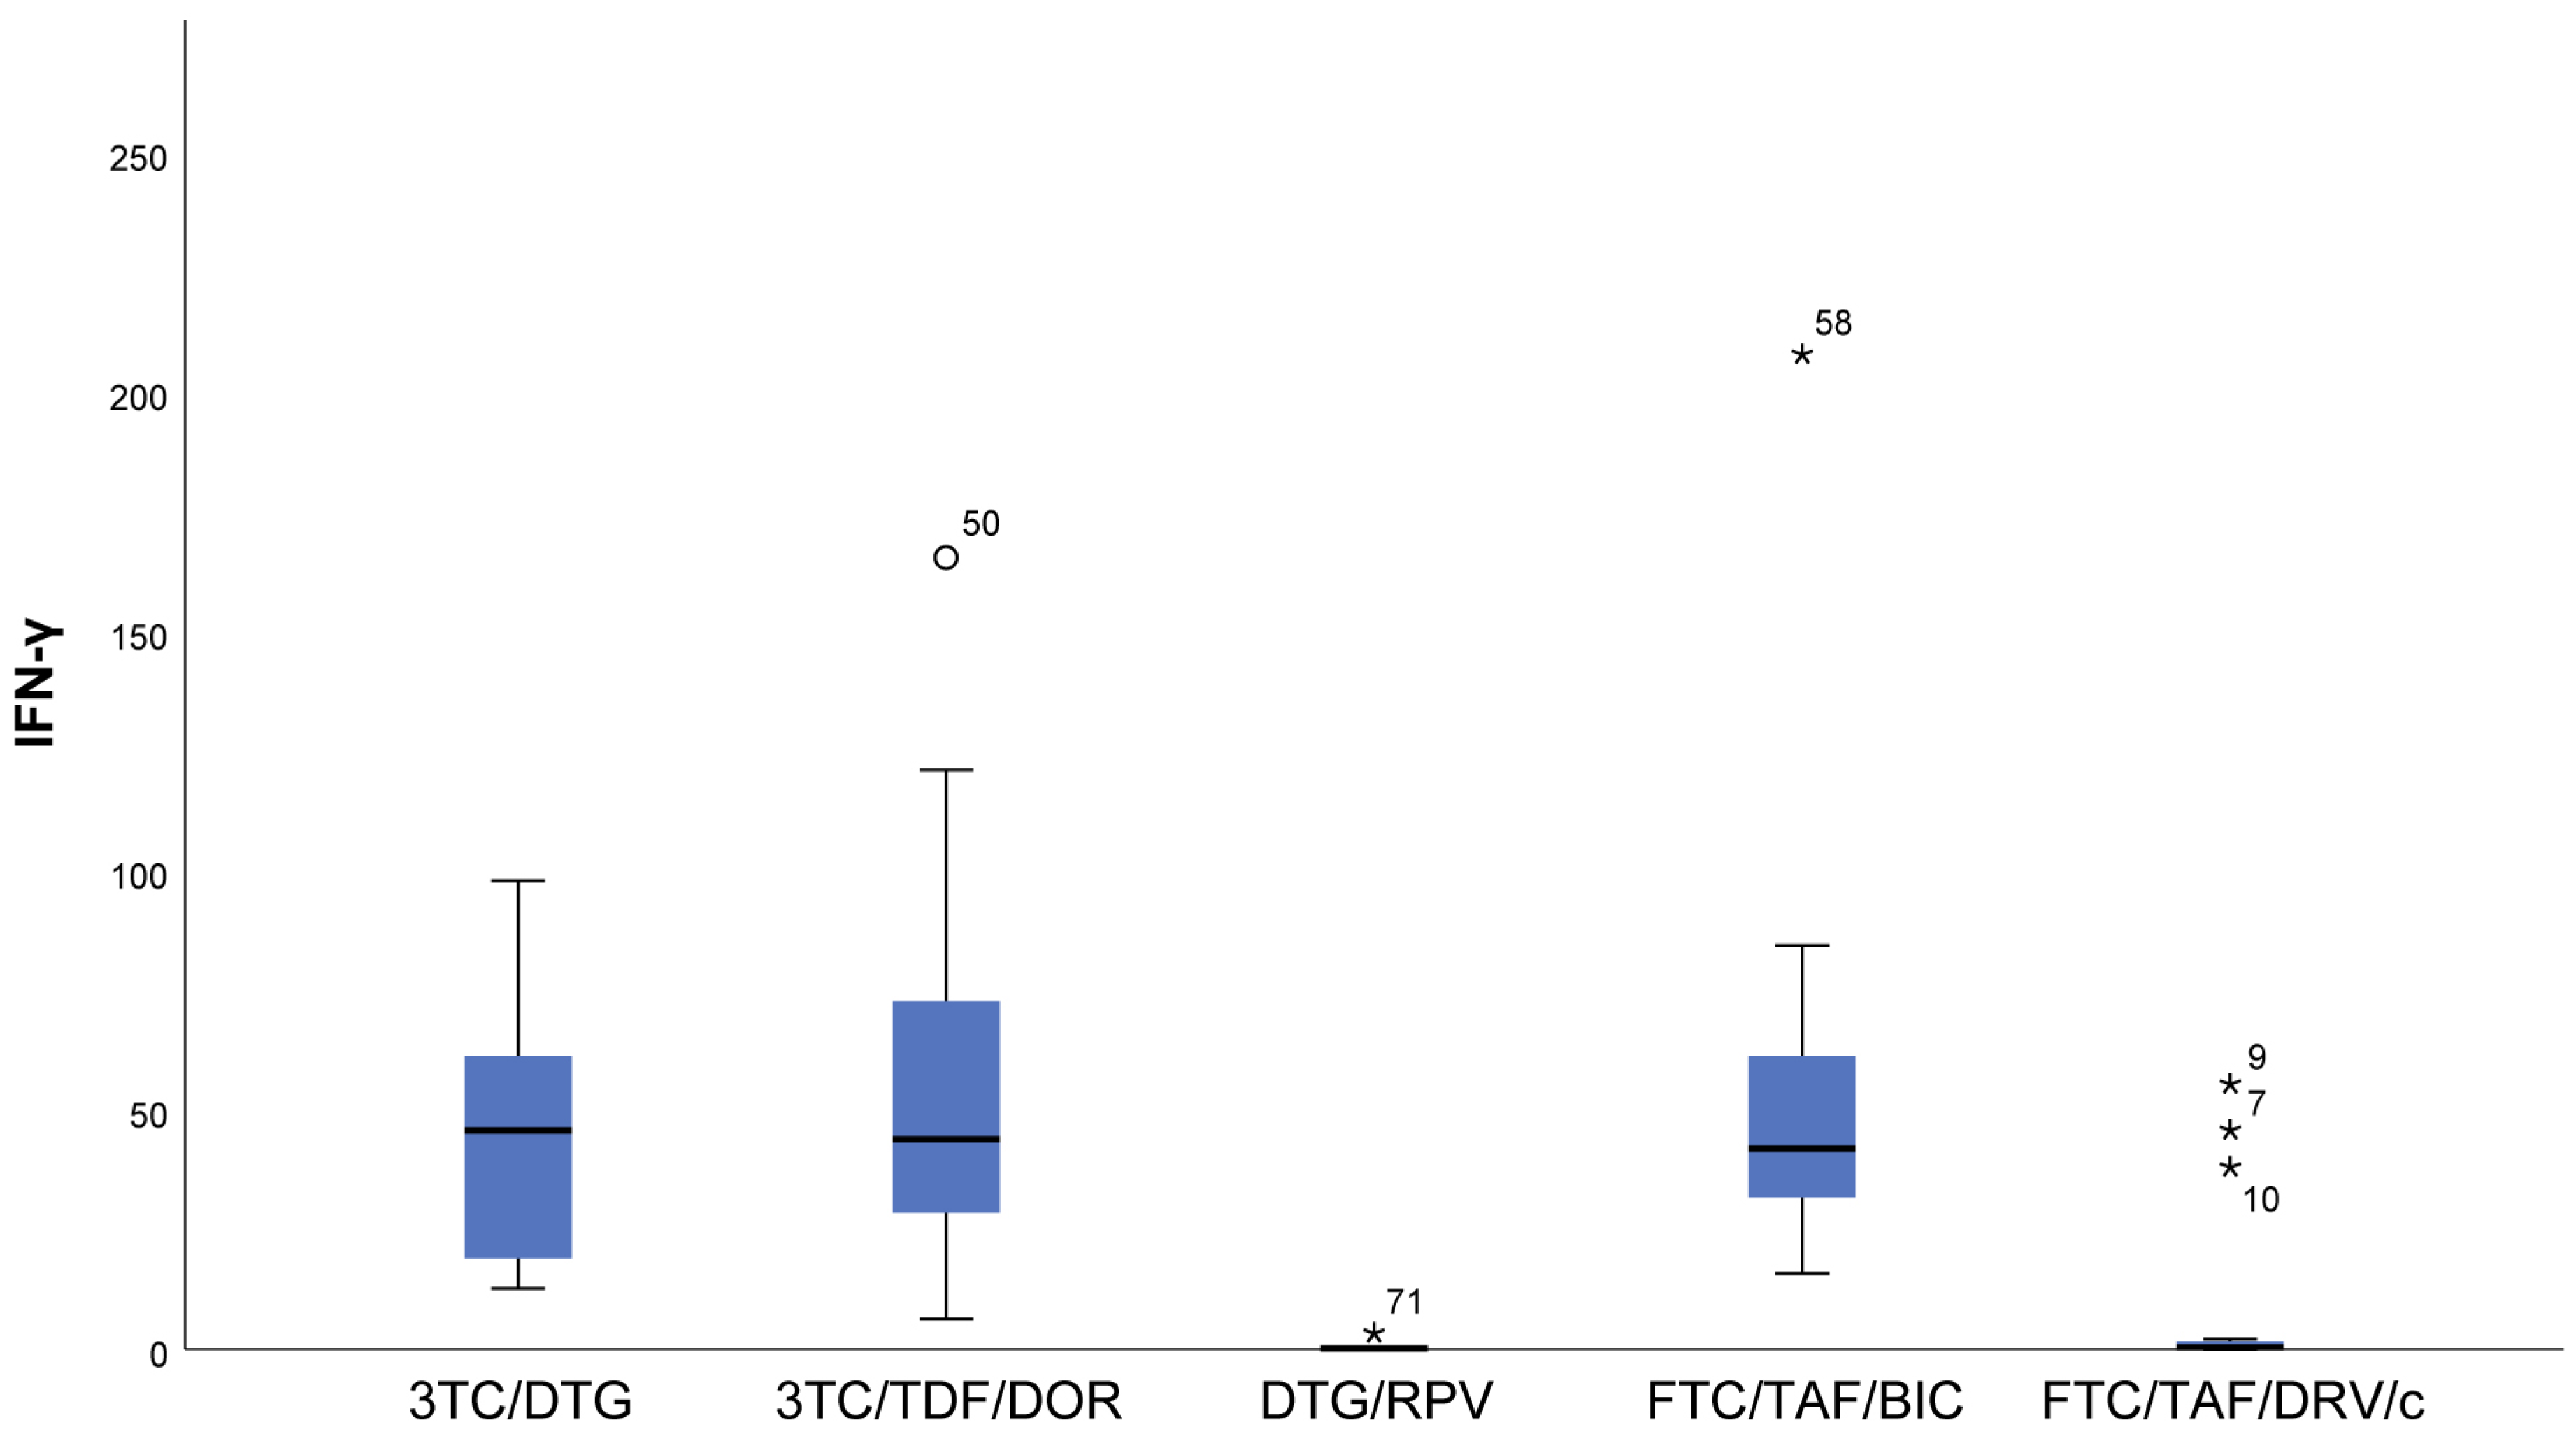
- We found significantly lower levels of IFN-γ (p < 0.001) in the protease inhibitor (darunavir-containing regimen) patients in the current therapy, lower levels of IL-18 (p = 0.023), and higher levels of sCD14 (p = 0.08) (Table 3).
- NNRTIs in current therapy are associated with lower levels of IL-1β (p = 0.048).
3.4. Relationships between the Studied Indicators
- IL-6 was moderately strongly positively related to GM-CSF (Sperman’s rho = 0.329, p = 0.003), IFN-γ (Sperman’s rho = 0.387, p = 0.000), and IL-12p70 (Sperman’s rho = 0.35, p = 0.004).
- No relationship between CRP, d-dimer, and sCD14 with any of the series (p > 0.05) was proven.
4. Discussion
5. Conclusions
Author Contributions
Funding
Institutional Review Board Statement
Informed Consent Statement
Data Availability Statement
Conflicts of Interest
References
- Joint United Nations Programme on HIV/AIDS. The Path That Ends AIDS: UNAIDS Global AIDS Update 2023; Joint United Nations Programme on HIV/AIDS: Geneva, Switzerland, 2023. [Google Scholar]
- Centers for Disease Control (CDC). Monitoring Selected National HIV Prevention and Care Objectives by Using HIV Surveillance Data: United States and 6 Dependent Areas–2013; HIV Surveillance Supplemental Report; Centers for Disease Control (CDC): Atlanta, GA, USA, 2018; Volume 20, pp. 1–70. [Google Scholar]
- Guaraldi, G.; Orlando, G.; Zona, S.; Menozzi, M.; Carli, F.; Garlassi, E.; Berti, A.; Rossi, E.; Roverato, A.; Palella, F. Premature age-related comorbidities among HIV-infected persons compared with the general population. Clin. Infect. Dis. 2011, 53, 1120–1126. [Google Scholar] [CrossRef] [PubMed]
- Rickabaugh, T.M.; Baxter, R.M.; Sehl, M.; Sinsheimer, J.S.; Hultin, P.M.; Hultin, L.E.; Quach, A.; Martinez-Maza, O.; Horvath, S.; Vilain, E.; et al. Acceleration of age-associated methylation patterns in HIV-1-infected adults. PLoS ONE 2015, 10, e0119201. [Google Scholar] [CrossRef] [PubMed]
- Guaraldi, G.; Prakash, M.; Moecklinghoff, C.; Stellbrink, H.J. Morbidity in older HIV-infected patients: Impact of long-term antiretroviral use. AIDS Rev. 2014, 16, 75–89. [Google Scholar] [PubMed]
- Ferrucci, L.; Fabbri, E. Inflammageing: Chronic inflammation in ageing, cardiovascular disease, and frailty. Nat. Rev. Cardiol. 2018, 15, 505–522. [Google Scholar] [CrossRef] [PubMed]
- Xia, S.; Zhang, X.; Zheng, S.; Khanabdali, R.; Kalionis, B.; Wu, J.; Wan, W.; Tai, X. An update on Inflamm-aging: Mechanisms, prevention, and treatment. J. Immunol. Res. 2016, 2016, 8426874. [Google Scholar] [CrossRef] [PubMed]
- Nasi, M.; Pinti, M.; Mussini, C.; Cossarizza, A. Persistent inflammation in HIV infection: Established concepts, new perspectives. Immunol. Lett. 2014, 161, 184–188. [Google Scholar] [CrossRef]
- McComsey, G.A.; Kitch, D.; Daar, E.S.; Tierney, C.; Jahed, N.C.; Melbourne, K.; Ha, B.; Brown, T.T.; Bloom, A.; Fedarko, N.; et al. Inflammation markers after randomization to abacavir/lamivudine or tenofovir/emtricitabine with efavirenz or atazanavir/ritonavir. AIDS 2012, 26, 1371–1385. [Google Scholar] [CrossRef]
- Rodés, B.; Cadiñanos, J.; Esteban-Cantos, A.; Rodríguez-Centeno, J.; Arribas, J.R. Ageing with HIV: Challenges and biomarkers. EBioMedicine 2022, 77, 103896. [Google Scholar] [CrossRef] [PubMed]
- Brenchley, J.M.; Price, D.A.; Schacker, T.W.; Asher, T.E.; Silvestri, G.; Rao, S.; Kazzaz, Z.; Bornstein, E.; Lambotte, O.; Altmann, D.; et al. Microbial translocation is a cause of systemic immune activation in chronic HIV infection. Nat. Med. 2006, 12, 1365–1371. [Google Scholar] [CrossRef]
- Schacker, T.W.; Nguyen, P.L.; Beilman, G.J.; Wolinsky, S.; Larson, M.; Reilly, C.; Haase, A.T. Collagen deposition in HIV-1 infected lymphatic tissues and T cell homeostasis. J. Clin. Investig. 2002, 110, 1133–1139. [Google Scholar] [CrossRef]
- Naeger, D.M.; Martin, J.N.; Sinclair, E.; Hunt, P.W.; Bangsberg, D.R.; Hecht, F.; Hsue, P.; McCune, J.M.; Deeks, S.G. Cytomegalovirus-specific T cells persist at very high levels during long-term antiretroviral treatment of HIV disease. PLoS ONE 2010, 5, e8886. [Google Scholar] [CrossRef]
- Tallah, N.; Adjibade, M.; Lelong, H.; Hercberg, S.; Galan, P.; Assmann, K.E.; Kesse-Guyot, E. How healthy lifestyle factors at midlife relate to healthy aging. Nutrients 2018, 10, 854. [Google Scholar] [CrossRef]
- Schank, M.; Zhao, J.; Moorman, J.P.; Yao, Z.Q. The impact of HIV-and ART-induced mitochondrial dysfunction in cellular senescence and aging. Cells 2021, 10, 174. [Google Scholar] [CrossRef]
- Osuji, F.N.; Onyenekwe, C.C.; Ahaneku, J.E.; Ukibe, N.R. The effects of highly active antiretroviral therapy on the serum levels of pro-inflammatory and anti-inflammatory cytokines in HIV infected subjects. J. Biomed. Sci. 2018, 25, 88. [Google Scholar] [CrossRef]
- Mugwe, J.N.; Gicheru, M.M.; Mwatha, J. Circulatory Cytokines and Hematological Profiles: Possible Biomarkers of HIV/AIDS Disease Progression. J. Health Life-Sci. 2019, 5, 105–118. [Google Scholar] [CrossRef]
- So-Armah, K.A.; Tate, J.P.; Chang, C.H.; Butt, A.A.; Gerschenson, M.; Gibert, C.L.; Leaf, D.; Rimland, D.; Rodriguez-Barradas, M.C.; Budoff, M.J.; et al. Do biomarkers of inflammation, monocyte activation, and altered coagulation explain excess mortality between HIV infected and uninfected people? J. Acquir. Immune Defic. Syndr. 2016, 72, 206–213. [Google Scholar] [CrossRef]
- Boulware, D.R.; Hullsiek, K.H.; Puronen, C.E.; Rupert, A.; Baker, J.V.; French, M.A.; Bohjanen, P.R.; Novak, R.M.; Neaton, J.D.; Sereti, I.; et al. Higher levels of CRP, Ddimer, IL-6, and hyaluronic acid before initiation of antiretroviral therapy (ART) are associated with increased risk of AIDS or death. J. Infect. Dis. 2011, 203, 1637–1646. [Google Scholar] [CrossRef]
- Sandler, N.G.; Wand, H.; Roque, A.; Law, M.; Nason, M.C.; Nixon, D.E.; Pedersen, C.; Ruxrungtham, K.; Lewin, S.R.; Emery, S.; et al. Plasma levels of soluble 14 independently predict mortality in HIV infection. J. Infect. Dis. 2011, 203, 780–790. [Google Scholar] [CrossRef]
- Szymańska, B.; Jurkowska, K.; Knysz, B.; Piwowar, A. Differences in Expression of Selected Interleukins in HIV-Infected Subjects Undergoing Antiretroviral Therapy. Viruses 2022, 14, 997. [Google Scholar] [CrossRef]
- Kelesidis, T.; Tran, T.T.T.; Stein, J.H.; Brown, T.T.; Moser, C.; Ribaudo, H.J.; Dube, M.P.; Murphy, R.; Yang, O.O.; Currier, J.S.; et al. Changes in inflammation and immune activation with atazanavir-, raltegravir-, darunavir-based initial antiviral therapy: ACTG 5260s. Clin. Infect. Dis. 2015, 61, 651–660. [Google Scholar] [CrossRef]
- Asmuth, D.M.; Ma, Z.-M.; Mann, S.; Knight, T.H.; Yotter, T.; Albanese, A.; Melcher, G.P.; Troia-Cancio, P.; Hayes, T.; Miller, C.J.; et al. Gastrointestinal-associated lymphoid tissue immune reconstitution in a randomized clinical trial of raltegravir versus non-nucleoside reverse transcriptase inhibitor-based regimens. AIDS 2012, 26, 1625–1634. [Google Scholar] [CrossRef] [PubMed]
- Massanella, M.; Negredo, E.; Puig, J.; Puertas, M.C.; Buzón, M.J.; Pérez-Álvarez, N.; Carrillo, J.; Clotet, B.; Martínez-Picado, J.; Blanco, J. Raltegravir intensification shows differing effects on CD8 and CD4 T cells in HIV-infected HAARTsuppressed individuals with poor CD4 T-cell recovery. AIDS 2012, 26, 2285–2293. [Google Scholar] [CrossRef] [PubMed]
- Asmuth, D.M.; Ma, Z.M.; Hayes, T. Raltegravir (RAL) therapy is associated with reduced microbial translocation (MT) and monocyte activation in HIV infected subjects naive to antiretroviral therapy (ART). AIDS 2014 [abstract WEPE013]. In Proceedings of the 20th International AIDS Conference, Melbourne, Australia, 20–25 July 2014. [Google Scholar]
- Hatano, H.; Hayes, T.L.; Dahl, V.; Sinclair, E.; Lee, T.H.; Hoh, R.; Lampiris, H.; Hunt, P.W.; Palmer, S.; McCune, J.M.; et al. A randomized, controlled trial of raltegravir intensification in antiretroviral-treated, HIV-infected patients with a suboptimal CD4+ T cell response. J. Infect. Dis. 2011, 203, 960–968. [Google Scholar] [CrossRef] [PubMed]
- Lake, J.; McComsey, G.; Hulgan, T.; Wanke, C.; Mangili, A.; Walmsley, S.; Stramotas, S.; Tracy, R.; Currier, J. Switch to raltegravir decreases soluble CD14 in virologically suppressed overweight women: The Women, Integrase and Fat Accumulation Trial. HIV Med. 2014, 15, 431–441. [Google Scholar] [CrossRef] [PubMed]
- Vecchiet, J.; Dalessandro, M.; Travasi, F.; Falasca, K.; Di Iorio, A.; Schiavone, C.; Zingariello, P.; Di Ilio, E.; Pizzigallo, E.; Paganelli, R. Interleukin-4 and interferon-gamma production during HIV-1 infection and changes induced by antiretroviral therapy. Int. J. Immunopathol. Pharmacol. 2003, 16, 157–166. [Google Scholar] [CrossRef] [PubMed]
- Watanabe, D.; Uehira, T.; Yonemoto, H.; Bando, H.; Ogawa, Y.; Yajima, K.; Taniguchi, T.; Kasai, D.; Nishida, Y.; Shirasaka, T. Sustained high levels of serum interferon-γ during HIV-1 infection: A specific trend different from other cytokines. Viral Immunol. 2010, 23, 619–625. [Google Scholar] [CrossRef] [PubMed]
- Reuben, J.M.; Lee, B.-N.; Paul, M.; Kline, M.W.; Cron, S.G.; Abramson, S.; Lewis, D.; Kozinetz, C.A.; Shearer, W.T. Magnitude of IFNgamma production in HIV-1-infected children is associated with virus suppression. J. Allergy Clin. Immunol. 2002, 110, 255–261. [Google Scholar] [CrossRef]
- Miller, E.A.; Spadaccia, M.R.; O’Brien, M.P.; Rolnitzky, L.; Sabado, R.; Manches, O.; Frleta, D.; Bhardwaj, N. Plasma factors during chronic HIV-1 infection impair IL-12 secretion by myeloid dendritic cells via a virus-independent pathway. J. Acquir. Immune Defic. Syndr. 2012, 61, 535–544. [Google Scholar] [CrossRef] [PubMed]
- Mugwe, J.N.; Gicheru, M.M.; Mwatha, J. Plasma cytokine profiles as predictive biomarkers of HIV and AIDS progression among HIV patients attending Nakuru Provincial General Hospital, Kenya. Am. J. Med. Biol. Res. Am. J. Med. Biol. Res. 2016, 4, 20–25. [Google Scholar] [CrossRef]
- Maritati, M.; Alessandro, T.; Zanotta, N.; Comar, M.; Bellini, T.; Sighinolfi, L.; Contini, C. A comparison between different anti-retroviral therapy regimes on soluble inflammation markers: A pilot study. AIDS Res. Ther. 2020, 17, 61. [Google Scholar] [CrossRef]
- Balogun, O.; Shuaib, B.I.; Usman, A.; Yusuf, A.A.; Musa, B.O.P.; Reginald, O.O.; Babadoko, A.A. Effects of anti-retroviral therapy on baseline serum interleukin-18 levels in HIV–I infected patients relative to viral suppression and CD4+ gain: A prospective pilot study. BioMedicine 2023, 13, 24. [Google Scholar] [CrossRef] [PubMed]
- Torre, D.; Pugliese, A. Interleukin-18: A proinflammatory cytokine in HIV-1 infection. Curr. HIV Res. 2006, 4, 423–430. [Google Scholar] [CrossRef] [PubMed]
- Shete, A.; Kurle, S.; Dhayarkar, S.; Patil, A.; Kulkarni, S.; Ghate, M.; Sangale, S.; Medhe, U.; Rajan, S.; Verma, V.; et al. High IL-5 levels possibly contributing to HIV viremia in virologic non-responders at one year after initiation of anti-retroviral therapy. Microb. Pathog. 2020, 143, 104117. [Google Scholar] [CrossRef] [PubMed]
- Borges, H.; O’Connor, J.L.; Phillips, A.N.; Rönsholt, F.F.; Pett, S.; Vjecha, M.J.; French, M.A.; Lundgren, J.D. Factors associated with plasma IL-6 levels during HIV infection. J. Infect. Dis. 2015, 212, 585–595. [Google Scholar] [CrossRef]
- Funderburg, N.T.; Zidar, D.A.; Shive, C.; Lioi, A.; Mudd, J.; Musselwhite, L.W.; Simon, D.I.; Costa, M.A.; Rodriguez, B.; Sieg, S.F.; et al. Shared monocyte subset phenotypes in HIV-1 infection and in uninfected subjects with acute coronary syndrome. Blood 2012, 120, 4599–4608. [Google Scholar] [CrossRef] [PubMed]
- Kelesidis, T.; Kendall, M.A.; Yang, O.O.; Hodis, H.N.; Currier, J.S. Biomarkers of microbial translocation and macrophage activation: Association with progression of subclinical atherosclerosis in HIV-1 infection. J. Infect. Dis. 2012, 206, 1558–1567. [Google Scholar] [CrossRef] [PubMed]
- Burdo, T.H.; Lo, J.; Abbara, S.; Wei, J.; DeLelys, M.E.; Preffer, F.; Rosenberg, E.S.; Williams, K.C.; Grinspoon, S. Soluble CD163, a novel marker of activated macrophages, is elevated and associated with noncalcified coronary plaque in HIV-infected patients. J. Infect. Dis. 2011, 204, 1227–1236. [Google Scholar] [CrossRef]
- Wada, N.I.; Jacobson, L.P.; Margolick, J.B.; Breen, E.C.; Macatangay, B.; Penugonda, S.; Martínez-Maza, O.; Bream, J.H. The effect of HAART-induced HIV suppression on circulating markers of inflammation and immune activation. Aids 2015, 29, 463–471. [Google Scholar] [CrossRef]


| Mean | Standard Deviation | Median | Percentile 25 | Percentile 75 | |
|---|---|---|---|---|---|
| Age | 41 | 8 | |||
| Baseline CD4 count | 370 | 252 | 537 | ||
| Baseline CD8 count | 1012 | 707 | 1290 | ||
| Baseline CD4/CD8 count | 0.37 | 0.23 | 0.55 | ||
| Baseline VL copies/mL count | 64,429 | 14,300 | 150,318 | ||
| Baseline log10 | 4.69 | 0.92 | |||
| Duration of cART (years) | 3.5 | 2.5 | 6.8 | ||
| Present CD4 | 740 | 336 | |||
| Present CD8 | 836 | 297 | |||
| Present CD4/CD8 | 0.86 | 0.63 | 1.22 | ||
| PI (currently) | 3 | 3 | 3 | ||
| INI (currently) | 2.5 | 2.0 | 3.0 | ||
| NNRTI (currently) | 3 | 2 | 3 | ||
| NRTI (currently) | 2.5 | 2.0 | 3.0 | ||
| PI (previous) | 5 | 4 | 7 | ||
| INI (previous) | 3 | 1 | |||
| NNRTI (previous) | 4 | 4 | 5 | ||
| NRTI (previous) | 4 | 3 | 5 | ||
| PI (total) | 4.5 | 3.0 | 7.8 | ||
| INI (total) | 3 | 3 | 4 | ||
| NNRTI (total) | 3 | 2 | 7 | ||
| NRTI (total) | 3.5 | 2.5 | 5.8 |
| Count | Column N % | ||
|---|---|---|---|
| Sex | Female | 8 | 10.0% |
| Male | 72 | 90.0% | |
| cART (Antiretroviral therapy) | 3TC/DTG | 18 | 22.5% |
| 3TC/TDF/DOR | 17 | 21.3% | |
| DTG/RPV | 10 | 12.5% | |
| FTC/TAF/BIC | 18 | 22.5% | |
| FTC/TAF/DRV/c | 17 | 21.3% | |
| Switched | no | 40 | 50.0% |
| yes | 40 | 50.0% | |
| Previous cART | 3TC/ZDV+LPV/r | 1 | 2.5% |
| ABC/3TC/DTG | 8 | 20.0% | |
| ABC/3TC+ATV+RTV | 1 | 2.5% | |
| ABC/3TC+DRV/c | 2 | 5.0% | |
| ABC/3TC+DRV+RTV | 2 | 5.0% | |
| ABC/3TC+RAL | 1 | 2.5% | |
| ABC/3TC+RPV | 2 | 5.0% | |
| DDI+ZDV+LPV/r | 1 | 2.5% | |
| FTC/TDF+DRV/c | 2 | 5.0% | |
| FTC/TDF+DRV+RTV | 5 | 12.5% | |
| FTC/TDF+DTG | 7 | 17.5% | |
| FTC/TDF+RAL | 1 | 2.5% | |
| FTC/TDF+RPV | 6 | 15.0% | |
| TDF+EFV | 1 | 2.5% | |
| HIV stages at cART initiation | CD4 over 500 cells/µL | 31 | 38.8% |
| CD4 from 250 to 499 cells/µL | 33 | 41.3% | |
| CD4 under 250 cells/µL | 16 | 20.0% | |
| Duration of VL < 40 | to 3 years | 38 | 47.5% |
| from 3 to 5 years | 14 | 17.5% | |
| from 5 to 10 years | 28 | 35.0% | |
| Clinical presentation | A | 48 | 60.0% |
| B | 18 | 22.5% | |
| C | 14 | 17.5% | |
| CVDs | no | 72 | 90.0% |
| yes | 8 | 10.0% | |
| STDs | no | 53 | 66.3% |
| yes | 27 | 33.8% | |
| Others | no | 65 | 81.3% |
| yes | 15 | 18.8% | |
| Smoking | no | 48 | 60.0% |
| yes | 32 | 40.0% | |
| Psychoactive drugs | no | 76 | 95.0% |
| yes | 4 | 5.0% | |
| Alcohol | no | 76 | 95.0% |
| yes | 4 | 5.0% | |
| Other harmful factors | no | 79 | 98.8% |
| yes | 1 | 1.3% | |
| Harmful factors | no | 42 | 52.5% |
| yes | 38 | 47.5% | |
| Transmission group | IVDU | 9 | 11.3% |
| MSM | 58 | 72.5% | |
| unknown | 13 | 16.3% | |
| PIs in present therapy | no | 63 | 78.8% |
| yes | 17 | 21.3% | |
| INIs in present therapy | no | 34 | 42.5% |
| yes | 46 | 57.5% | |
| NNRTIs in present therapy | no | 53 | 66.3% |
| yes | 27 | 33.8% | |
| NRTIs in present therapy | no | 10 | 12.5% |
| yes | 70 | 87.5% | |
| PIs in previous therapy | no | 27 | 67.5% |
| yes | 13 | 32.5% | |
| INIs in previous therapy | no | 23 | 57.5% |
| yes | 17 | 42.5% | |
| NNRTIs in previous therapy | no | 31 | 77.5% |
| yes | 9 | 22.5% | |
| NRTIs in previous therapy | no | 0 | 0.0% |
| yes | 40 | 100.0% | |
| GM-CSF | IFN-γ | IL-1β | IL-12p70 | IL-13 | IL-18 | IL-2 | IL-4 | IL-5 | IL-6 | TNF-alpha | CRP | d-dimer | sCD14 | ||
|---|---|---|---|---|---|---|---|---|---|---|---|---|---|---|---|
| Duration of rho cART (years) | pho | 0.116 | −0.271 | 0.030 | −0.069 | −0.087 | −0.067 | 0.266 | 0.164 | 0.306 | 0.057 | 0.146 | 0.058 | 0.228 | 0.148 |
| p | 0.305 | 0.015 | 0.793 | 0.545 | 0.442 | 0.556 | 0.017 | 0.147 | 0.006 | 0.615 | 0.197 | 0.610 | 0.043 | 0.219 | |
| N | 80 | 80 | 80 | 80 | 80 | 80 | 80 | 80 | 80 | 80 | 80 | 79 | 79 | 71 | |
| PI (сurrently) | pho | 0.459 | 0.266 | −0.379 | −0.017 | 0.149 | 0.190 | −0.415 | −0.224 | −0.308 | 0.119 | 0.246 | 0.014 | 0.199 | 0.205 |
| p | 0.064 | 0.302 | 0.134 | 0.948 | 0.567 | 0.465 | 0.097 | 0.387 | 0.229 | 0.648 | 0.340 | 0.958 | 0.444 | 0.481 | |
| N | 17 | 17 | 17 | 17 | 17 | 17 | 17 | 17 | 17 | 17 | 17 | 17 | 17 | 14 | |
| INI (сurrently) | pho | −0.194 | −0.184 | −0.044 | −0.171 | −0.115 | −0.047 | −0.140 | −0.157 | −0.008 | −0.326 | 0.076 | −0.101 | 0.107 | −0.046 |
| p | 0.201 | 0.226 | 0.775 | 0.262 | 0.452 | 0.761 | 0.360 | 0.302 | 0.959 | 0.029 | 0.618 | 0.514 | 0.490 | 0.777 | |
| N | 45 | 45 | 45 | 45 | 45 | 45 | 45 | 45 | 45 | 45 | 45 | 44 | 44 | 41 | |
| NNRTI (сurrently) | pho | −0.201 | −0.028 | 0.319 | 0.078 | −0.113 | 0.069 | 0.442 | 0.247 | 0.099 | 0.239 | 0.438 | 0.046 | 0.254 | 0.004 |
| p | 0.306 | 0.886 | 0.098 | 0.691 | 0.566 | 0.726 | 0.019 | 0.205 | 0.617 | 0.220 | 0.020 | 0.815 | 0.193 | 0.983 | |
| N | 28 | 28 | 28 | 28 | 28 | 28 | 28 | 28 | 28 | 28 | 28 | 28 | 28 | 26 | |
| NRTI (сurrently) | pho | −0.005 | −0.097 | −0.037 | −0.101 | −0.159 | −0.048 | −0.018 | −0.053 | −0.101 | −0.081 | 0.109 | −0.026 | 0.200 | 0.116 |
| p | 0.967 | 0.425 | 0.758 | 0.405 | 0.189 | 0.694 | 0.880 | 0.664 | 0.405 | 0.504 | 0.371 | 0.830 | 0.099 | 0.373 | |
| N | 70 | 70 | 70 | 70 | 70 | 70 | 70 | 70 | 70 | 70 | 70 | 69 | 69 | 61 | |
| PI (previous) | pho | −0.207 | −0.407 | −0.212 | 0.020 | 0.342 | −0.180 | 0.472 | −0.083 | −0.244 | 0.124 | 0.004 | −0.131 | −0.231 | |
| p | 0.477 | 0.149 | 0.467 | 0.945 | 0.232 | 0.539 | 0.089 | 0.778 | 0.400 | 0.673 | 0.988 | 0.656 | 0.427 | ||
| N | 14 | 14 | 14 | 14 | 14 | 14 | 14 | 14 | 14 | 14 | 14 | 14 | 14 | 14 | |
| INI (previous) | pho | 0.038 | −0.485 | 0.015 | −0.262 | −0.165 | −0.465 | 0.078 | −0.174 | 0.132 | −0.191 | −0.250 | −0.133 | 0.133 | 0.439 |
| p | 0.885 | 0.049 | 0.954 | 0.310 | 0.528 | 0.060 | 0.766 | 0.505 | 0.614 | 0.463 | 0.333 | 0.610 | 0.612 | 0.117 | |
| N | 17 | 17 | 17 | 17 | 17 | 17 | 17 | 17 | 17 | 17 | 17 | 17 | 17 | 14 | |
| NNRTI (previous) | pho | 0.210 | −0.402 | 0.349 | −0.112 | −0.332 | 0.131 | 0.420 | 0.436 | 0.490 | −0.152 | −0.443 | −0.004 | −0.110 | |
| p | 0.588 | 0.284 | 0.357 | 0.774 | 0.383 | 0.738 | 0.261 | 0.241 | 0.181 | 0.696 | 0.233 | 0.991 | 0.795 | ||
| N | 9 | 9 | 9 | 9 | 9 | 9 | 9 | 9 | 9 | 9 | 9 | 9 | 9 | 8 | |
| NRTI (previous) | pho | −0.076 | −0.404 | −0.030 | −0.254 | −0.043 | −0.194 | 0.051 | 0.136 | 0.138 | −0.107 | −0.179 | −0.106 | 0.137 | 0.078 |
| p | 0.643 | 0.010 | 0.853 | 0.114 | 0.792 | 0.231 | 0.753 | 0.404 | 0.395 | 0.510 | 0.269 | 0.517 | 0.399 | 0.649 | |
| N | 40 | 40 | 40 | 40 | 40 | 40 | 40 | 40 | 40 | 40 | 40 | 40 | 40 | 36 | |
| PI (total) | pho | −0.015 | −0.029 | 0.043 | 0.010 | 0.316 | 0.139 | 0.102 | 0.352 | 0.115 | 0.007 | 0.161 | −0.010 | 0.312 | 0.055 |
| p | 0.944 | 0.893 | 0.843 | 0.964 | 0.133 | 0.516 | 0.634 | 0.092 | 0.593 | 0.973 | 0.453 | 0.964 | 0.138 | 0.814 | |
| N | 24 | 24 | 24 | 24 | 24 | 24 | 24 | 24 | 24 | 24 | 24 | 24 | 24 | 21 | |
| INI (total) | pho | 0.101 | 0.057 | 0.009 | 0.095 | 0.003 | 0.123 | 0.117 | 0.148 | 0.214 | 0.022 | 0.153 | −0.072 | 0.077 | 0.179 |
| p | 0.503 | 0.707 | 0.952 | 0.532 | 0.984 | 0.414 | 0.438 | 0.328 | 0.154 | 0.886 | 0.309 | 0.639 | 0.613 | 0.256 | |
| N | 46 | 46 | 46 | 46 | 46 | 46 | 46 | 46 | 46 | 46 | 46 | 45 | 45 | 42 | |
| NNRTI (total) | pho | 0.255 | −0.249 | 0.197 | −0.050 | −0.371 | −0.176 | 0.326 | 0.056 | 0.320 | 0.158 | 0.265 | 0.111 | 0.194 | −0.172 |
| p | 0.200 | 0.211 | 0.325 | 0.804 | 0.057 | 0.380 | 0.097 | 0.783 | 0.103 | 0.431 | 0.181 | 0.581 | 0.333 | 0.411 | |
| N | 27 | 27 | 27 | 27 | 27 | 27 | 27 | 27 | 27 | 27 | 27 | 27 | 27 | 25 | |
| NRTI (total) | pho | 0.123 | −0.181 | 0.070 | −0.011 | −0.061 | −0.003 | 0.259 | 0.195 | 0.270 | 0.099 | 0.153 | 0.055 | 0.252 | 0.160 |
| p | 0.278 | 0.108 | 0.537 | 0.924 | 0.590 | 0.979 | 0.020 | 0.083 | 0.015 | 0.384 | 0.177 | 0.632 | 0.025 | 0.184 | |
| N | 80 | 80 | 80 | 80 | 80 | 80 | 80 | 80 | 80 | 80 | 80 | 79 | 79 | 71 |
Disclaimer/Publisher’s Note: The statements, opinions and data contained in all publications are solely those of the individual author(s) and contributor(s) and not of MDPI and/or the editor(s). MDPI and/or the editor(s) disclaim responsibility for any injury to people or property resulting from any ideas, methods, instructions or products referred to in the content. |
© 2024 by the authors. Licensee MDPI, Basel, Switzerland. This article is an open access article distributed under the terms and conditions of the Creative Commons Attribution (CC BY) license (https://creativecommons.org/licenses/by/4.0/).
Share and Cite
Grozdeva, R.; Ivanov, D.; Strashimirov, D.; Kapincheva, N.; Yordanova, R.; Mihailova, S.; Georgieva, A.; Alexiev, I.; Grigorova, L.; Partsuneva, A.; et al. Relationship between Modern ART Regimens and Immunosenescence Markers in Patients with Chronic HIV Infection. Viruses 2024, 16, 1205. https://doi.org/10.3390/v16081205
Grozdeva R, Ivanov D, Strashimirov D, Kapincheva N, Yordanova R, Mihailova S, Georgieva A, Alexiev I, Grigorova L, Partsuneva A, et al. Relationship between Modern ART Regimens and Immunosenescence Markers in Patients with Chronic HIV Infection. Viruses. 2024; 16(8):1205. https://doi.org/10.3390/v16081205
Chicago/Turabian StyleGrozdeva, Rusina, Daniel Ivanov, Dimitar Strashimirov, Nikol Kapincheva, Ralitsa Yordanova, Snejina Mihailova, Atanaska Georgieva, Ivailo Alexiev, Lyubomira Grigorova, Alexandra Partsuneva, and et al. 2024. "Relationship between Modern ART Regimens and Immunosenescence Markers in Patients with Chronic HIV Infection" Viruses 16, no. 8: 1205. https://doi.org/10.3390/v16081205
APA StyleGrozdeva, R., Ivanov, D., Strashimirov, D., Kapincheva, N., Yordanova, R., Mihailova, S., Georgieva, A., Alexiev, I., Grigorova, L., Partsuneva, A., Dimitrova, R., Gancheva, A., Kostadinova, A., Naseva, E., & Yancheva, N. (2024). Relationship between Modern ART Regimens and Immunosenescence Markers in Patients with Chronic HIV Infection. Viruses, 16(8), 1205. https://doi.org/10.3390/v16081205