Abstract
Alfalfa mosaic virus (AMV) is one of the most widely distributed viruses; it often exhibits combined infection with white clover mosaic virus (WCMV). Even so, little is known about the effects of co-infection with AMV and WCMV on plants. To determine whether there is a synergistic effect of AMV and WCMV co-infection, virus co-infection was studied by electron microscopy, the double-antibody sandwich enzyme-linked immunosorbent assay (DAS-ELISA), and real-time fluorescence quantitative PCR (RT-qPCR) of AMV and WCMV co-infection in Nicotiana benthamiana. Meanwhile, measurements were carried out on the photosynthetic pigments, photosynthetic gas exchange parameters, and chlorophyll fluorescence parameters. The results showed that the most severe disease development was induced by AMV and WCMV co-infection, and the disease grade was scale 7. N. benthamiana leaves induced mottled yellow-green alternating patterns, leaf wrinkling, and chlorosis, and chloroplasts were observed to be on the verge of disintegration. The relative accumulation of AMV CP and WCMV CP was significantly increased by 15.44-fold and 10.04-fold upon co-infection compared to that with AMV and WCMV single infection at 21 dpi. In addition, chlorophyll a, chlorophyll b, total chlorophyll, the net photosynthetic rate, the water use efficiency, the apparent electron transport rate, the PSII maximum photochemical efficiency, the actual photochemical quantum yield, and photochemical quenching were significantly reduced in leaves co-infected with AMV and WCMV compared to AMV- or WCMV-infected leaves and CK. On the contrary, the carotenoid content, transpiration rate, stomatal conductance, intercellular CO2 concentration, minimal fluorescence value, and non-photochemical quenching were significantly increased. These findings suggest that there was a synergistic effect between AMV and WCMV, and AMV and WCMV co-infection severely impacted the normal function of photosynthesis in N. benthamiana.
1. Introduction
Plant diseases caused by pathogens decrease crop yields and quality in the world, about half of which are caused by viruses [1,2]. Thus, the timely assessment of viral infection and spread in host plants is the prerequisite for an efficient crop protection plan, either in the field or in the greenhouse [3,4]. However, with the further study of viruses, the phenomenon of co-infection with multiple viruses has been found [5,6]. This co-infection not only aggravated the occurrence of the disease but also caused more serious disease symptoms such as chlorosis, wrinkling, and the mottling of plants, resulting in a reduced chloroplast pigment content, destruction of chloroplast structure, changes in their structure and function, a significantly decreased photosynthesis rate, and a greatly reduced yield and quality of the crop [7,8,9].
Alfalfa mosaic virus (AMV)—also known as Alfamovirus AMV—which is a member of the genus Alfamovirus in the family Bromoviridae [10], and white clover mosaic virus (WCMV/WCIMV), defined in this paper as WCMV and also known as Potexvirus trifolii—which is a member of the genus Potexvirus in the family Alphaflexiviridae [11]—exhibit naturally combined infections on a wide range of plant species, including forages such as alfalfa and clover, and cash crops such as Nicotiana benthamiana, Solanum tuberosum, and Capsicum annuum, resulting in serious economic losses [12,13,14,15,16]. In our preliminary studies on naturally infected alfalfa, we detected a high rate of co-infection with two viruses, AMV and WCMV, which resulted in the yellowing and shrinking of alfalfa leaves. The chlorophyll content and soluble protein content were lower than those of AMV and WCMV single infections [17]. Studies have also revealed that the co-infection with AMV and WCMV aggravated the symptoms of the disease in N. benthamiana, such as mottled, crumpled, and rebloomed leaves that appeared yellowish-green or in shades of green [12]. When the mixture ratio of AMV and WCMV was 3:1, the most severe symptoms were observed in the co-infection, with an average disease index of 80.12, which was increased by 22.36% and 45.28%, respectively, when compared with AMV and WCMV single infections [16]. It has also been reported that when the virus infects plants, chloroplasts are the main target for its pathogenicity, replication, and multiplication, resulting in the destruction of chloroplast structure and a decrease in chlorophyll content, with the host showing symptoms such as leaf mosaic and yellowing, which affect photosynthesis [9,18]. However, the effects of AMV and WCMV co-infection on the destruction of chloroplast structure, pigment content, and photosynthetic parameters of N. benthamiana have not been reported.
Thus, in this study, we used AMV and WCMV as research subjects and N. benthamiana as treatment hosts. After inoculation with a mixed viral solution of AMV and WCMV (3:1) and a single inoculation with AMV and WCMV, respectively, symptoms of the disease and the morphological structure of chloroplasts were observed; AMV and WCMV concentrations were assayed; and the relative accumulation of viral capsid proteins and photosynthetic pigment content and the changes in photosynthetic characteristics were determined. The objective of this study was to determine the symptoms and virus accumulation caused by AMV and WCMV co-infections. The effects of AMV, WCMV, and host interaction on chloroplast ultrastructure and photosynthetic characteristics were investigated, and the results will provide a theoretical basis for revealing the pathogenic mechanism of AMV and WCMV combined infection on plants and formulating new strategies for virus prevention and control.
2. Materials and Methods
2.1. Plant and Virus Materials
N. benthamiana plants were soil-grown in an artificial intelligence climate chamber (Hangzhou Qisheng Electronic Technology Co., Ltd., Hangzhou, China) under a 16 h light/8 h dark cycle at 25 °C with a relative humidity of 50%. AMV- and WCMV-purified viruses were stored in a −80 °C refrigerator (Gansu Agricultural University, Lanzhou, China) at a concentration of 300 pg·mL−1.
2.2. Virus Inoculation
Leaves of N. benthamiana plant seedlings with a mixture inoculated with AMV and WCMV (3:1) were used as treatments, AMV and WCMV were single-inoculated as positive controls, and only 0.02 moL·L−1 of phosphate-buffered solution (PBS, pH 7.0) was used as the blank control (CK) through the friction inoculation method [17]. Briefly, there were at least three biological replicates of each treatment, and for each replicate, at least 10 seedlings. The plants were labeled and placed in an artificial intelligence climate chamber to observe the symptoms of disease day by day. Samples were collected at 9 days post inoculation (dpi), 15 dpi, 21 dpi, and 27 dpi for the following experimental observation and determination. The scale for rating the disease of N. benthamiana was as follows: scale 0, asymptomatic; scale 1, leaf shrinkage; scale 3, slight mosaic and wrinkled; scale 5, moderate mosaic or chlorosis; and scale 7, severe mosaic or necrosis.
2.3. Chloroplast Ultrastructure Observations
The treated and control leaves of N. benthamiana were collected 21 dpi. Sample treatment for chloroplast ultrastructure observation was as described previously with slight modifications [19]. The processed samples were placed under a JEM1230 LV (Olympus, Osaka, Osaka Prefecture, Japan) for observation and photography.
2.4. RT-qPCR Detection
The N. benthamiana leaves with AMV and WCMV were analyzed by conventional RT-qPCR. Total RNA was extracted from N. benthamiana with TRIzol reagent (Tiangen Company, Beijing, China) according to the manufacturer’s instructions. Next, the extracted RNA was reverse-transcribed to cDNA using the One-Step cDNA kit (Tiangen Company, Beijing, China) in a 20 μL volume, containing 4 μL of 5× FastKing-RT SuperMin, 1 μL of total RNA, and 15 μL of RNase-free water at 42 °C for 15 min and 95 °C for 3 min. Subsequently, quantitative analysis of the AMV and WCMV coat protein (CP) genes was performed by RT-qPCR amplification using the viral cDNA as a template (Tiangen Company, Beijing, China).
The specific primer pairs were AMV-F (5′-GCATCCCTAGGGGCATTCATGCA-3′) and AMV-R (5′-ATCATTGATCGGTAATGGGCCGTT-3′) for AMV CP, and WCMV-F (5′-AAACTCGAGCATGGACTTCACTACTTTA-3′) and WCMV-R (5′-CAGGTACCCTGAA ATTTTATTAAACAGAAAGCACACAC-3′) for the WCMV CP. The 25S ribosomal RNA gene and the β-Actin gene were selected as internal references according to the literature. The specific primer pair was 25S rRNA-F (5′-AAGGCCGAAGAGGAGAAAGG T-3′) and 25S rRNA-R (5′-CGTCCCTTAGGATCGGCTTAC-3′) for the 25S rRNA gene, and β-Actin-F (5′-GAGCACCCTGTTCTTCTGACTG-3′) and β-Actin-R (5′-GAGAAAGAACAGCCTG AATTGC-3′) for the β-Actin gene were selected as the internal reference. These primers were designed using primer software (Oligo Primer Analysis Software v.6.0) based on the coat protein genes of AMV and genomic sequences of WCMV reported in NCBI and synthesized by Shanghai Biological Engineering Company (Shanghai, China).
RT-qPCR was performed in a 20 μL volume, containing 10 μL of Fast Real qPCR Per Mix, 6.5 μL of RNase-free water, 1 μL of upstream and downstream primers (180 nM), 1 μL of cDNA template (100 ng), and 0.5 μL of ROX Reference Dye. The reaction conditions were as follows: pre-denaturation at 95 °C for 15 min, denaturation at 95 °C for 10 s, annealing at 60 °C for 20 s, and extension at 72 °C for 32 s for 40 cycles. Finally, the melting curve analysis was performed at 60 to 95 °C per 0.6 °C increment. Quantitative real-time RT-qPCR analysis was performed on an ABI7300HT Sequence Detection System with Cham QTM SYBR qPCR Master Mix (Applied Biosystems, Foster, CA, USA).
2.5. Production and Quantitative Analysis of Standard Curves of Target Gene and Internal Gene
cDNA from the AMV and WCMV co-infection of N. benthamiana was used as a standard [20], and it was subjected to 5× gradient dilutions at concentrations of 10 ng·μL−1, 2 ng·μL−1, 0.4 ng·μL−1, 0.080 ng·μL−1, and 0.016 ng·μL−1, respectively. The primer sequences for amplification, the reaction system, and the amplification procedure are shown in the previous section, and finally, the standard curves for qPCR of the target and internal reference genes were made. The amplification efficiencies (E) of AMV CP, WCMV CP, 25S rRNA, and β-Actin genes were calculated, and the relative accumulation of AMV CP and WCMV CP genes was calculated using the 2−ΔΔCt method.
where E represents the amplification efficiency and K represents the slope of the standard curve.
2.6. Chlorophyll Extraction and Photosynthetic Pigment Measurement
The photosynthetic pigments were extracted from diseased N. benthamiana leaves. Briefly, the veins were removed from each leaf sample. The leaves were homogenized in 95% ethanol with a small amount of CaCO3, and the homogenate was centrifuged at 5000 rpm for 5 min (Eppendorf 5430R, Beijing, China) [21]. The absorbance of the supernatant was recorded at wavelengths of 665 nm, 649 nm, and 470 nm (Unicam UV 9000S, Thermo Spectronic, Shanghai, China). The contents of Ch1a and Ch1b and the sum of carotenoids (Car) were calculated using the following equations.
where Ch1a and Ch1b represent the concentrations of chlorophyll a and chlorophyll b (mg·L−1), respectively; T-Ch1 represents the concentration of total chlorophyll (mg·L−1); Car represents the concentration of carotenoid (mg·L−1); and A665, A649, and A470 denote the absorbance values of the extracting solution at wavelengths of 665 nm, 649 nm, and 470 nm, respectively.
2.7. Photosynthetic Gas Exchange Measurements
Net photosynthetic rate (Pn), intercellular CO2 concentration (Ci), transpiration rate (Tr), and stomatal conductance (Gs) in N. benthamiana leaves were quantified during sunny mornings from 9:30 to 12:00 on different days after inoculation with AMV and WCMV combined. The gas exchange measurement system gas analyzer GFS-3000 (WALZ, Effeltrich, Germany) is equipped with a standard 8 cm2 leaf chamber [22]. The measuring conditions consisted of a light intensity of 150 μmol·m−2·s−1 and a CO2 concentration of 360 μmol·mol−1. The air temperature was set at 25 °C and the relative humidity at 48%. The duration of the measurements at each light intensity was 2 min in order to obtain a steady state. Each treatment was replicated three times. All data were based on the average measurements performed on one upper, middle, and lower leaf per replicate [23].
2.8. Chlorophyll Fluorescence Parameters Measurement
For the PSII quantum yield in the light-adapted state or effective PSII quantum yield (ΦPSII), PSII maximum photon yield (Fv/Fm), minimal fluorescence value (F0), fluorescence (Fm), photochemical quenching coefficient (qP), and non-photochemical quenching coefficient (qN), a variable chlorophyll fluorescence imaging system (Imaging PAM-MIN, WALZ, Effeltrich, Germany) was used [24]. F0 was measured under a light intensity of ≤0.5 μmol·m−2·s−1. Next, Fm was measured using a saturating pulse (2800 μmol·m−2·s−1). Subsequently, the steady-state fluorescence values (Ft) were measured after exposing the plants to actinic light (600 μmol·m−2·s−1) for five minutes and then opening a saturating pulse every twenty seconds to measure the adapted maximum fluorescence values ().
2.9. Data Analysis
All statistical analyses were performed using SPSS 21.0. Differences were analyzed using multiple analyses of variance with Duncan’s significant difference tests. A p value ≤ 0.05 was considered statistically significant. The data are presented as the mean ± standard error (SE). By comparing the threshold cycle (Ct) values, the relative accumulation of the AMV CP and WCMV CP was analyzed using the comparative 2−ΔΔCt method [25]. Excel 2023 was used to plot the standard curve and every graph.
3. Results
3.1. Diseased Symptoms and Chloroplast Ultrastructural Changes of N. benthamiana After AMV and WCMV Co-Infection
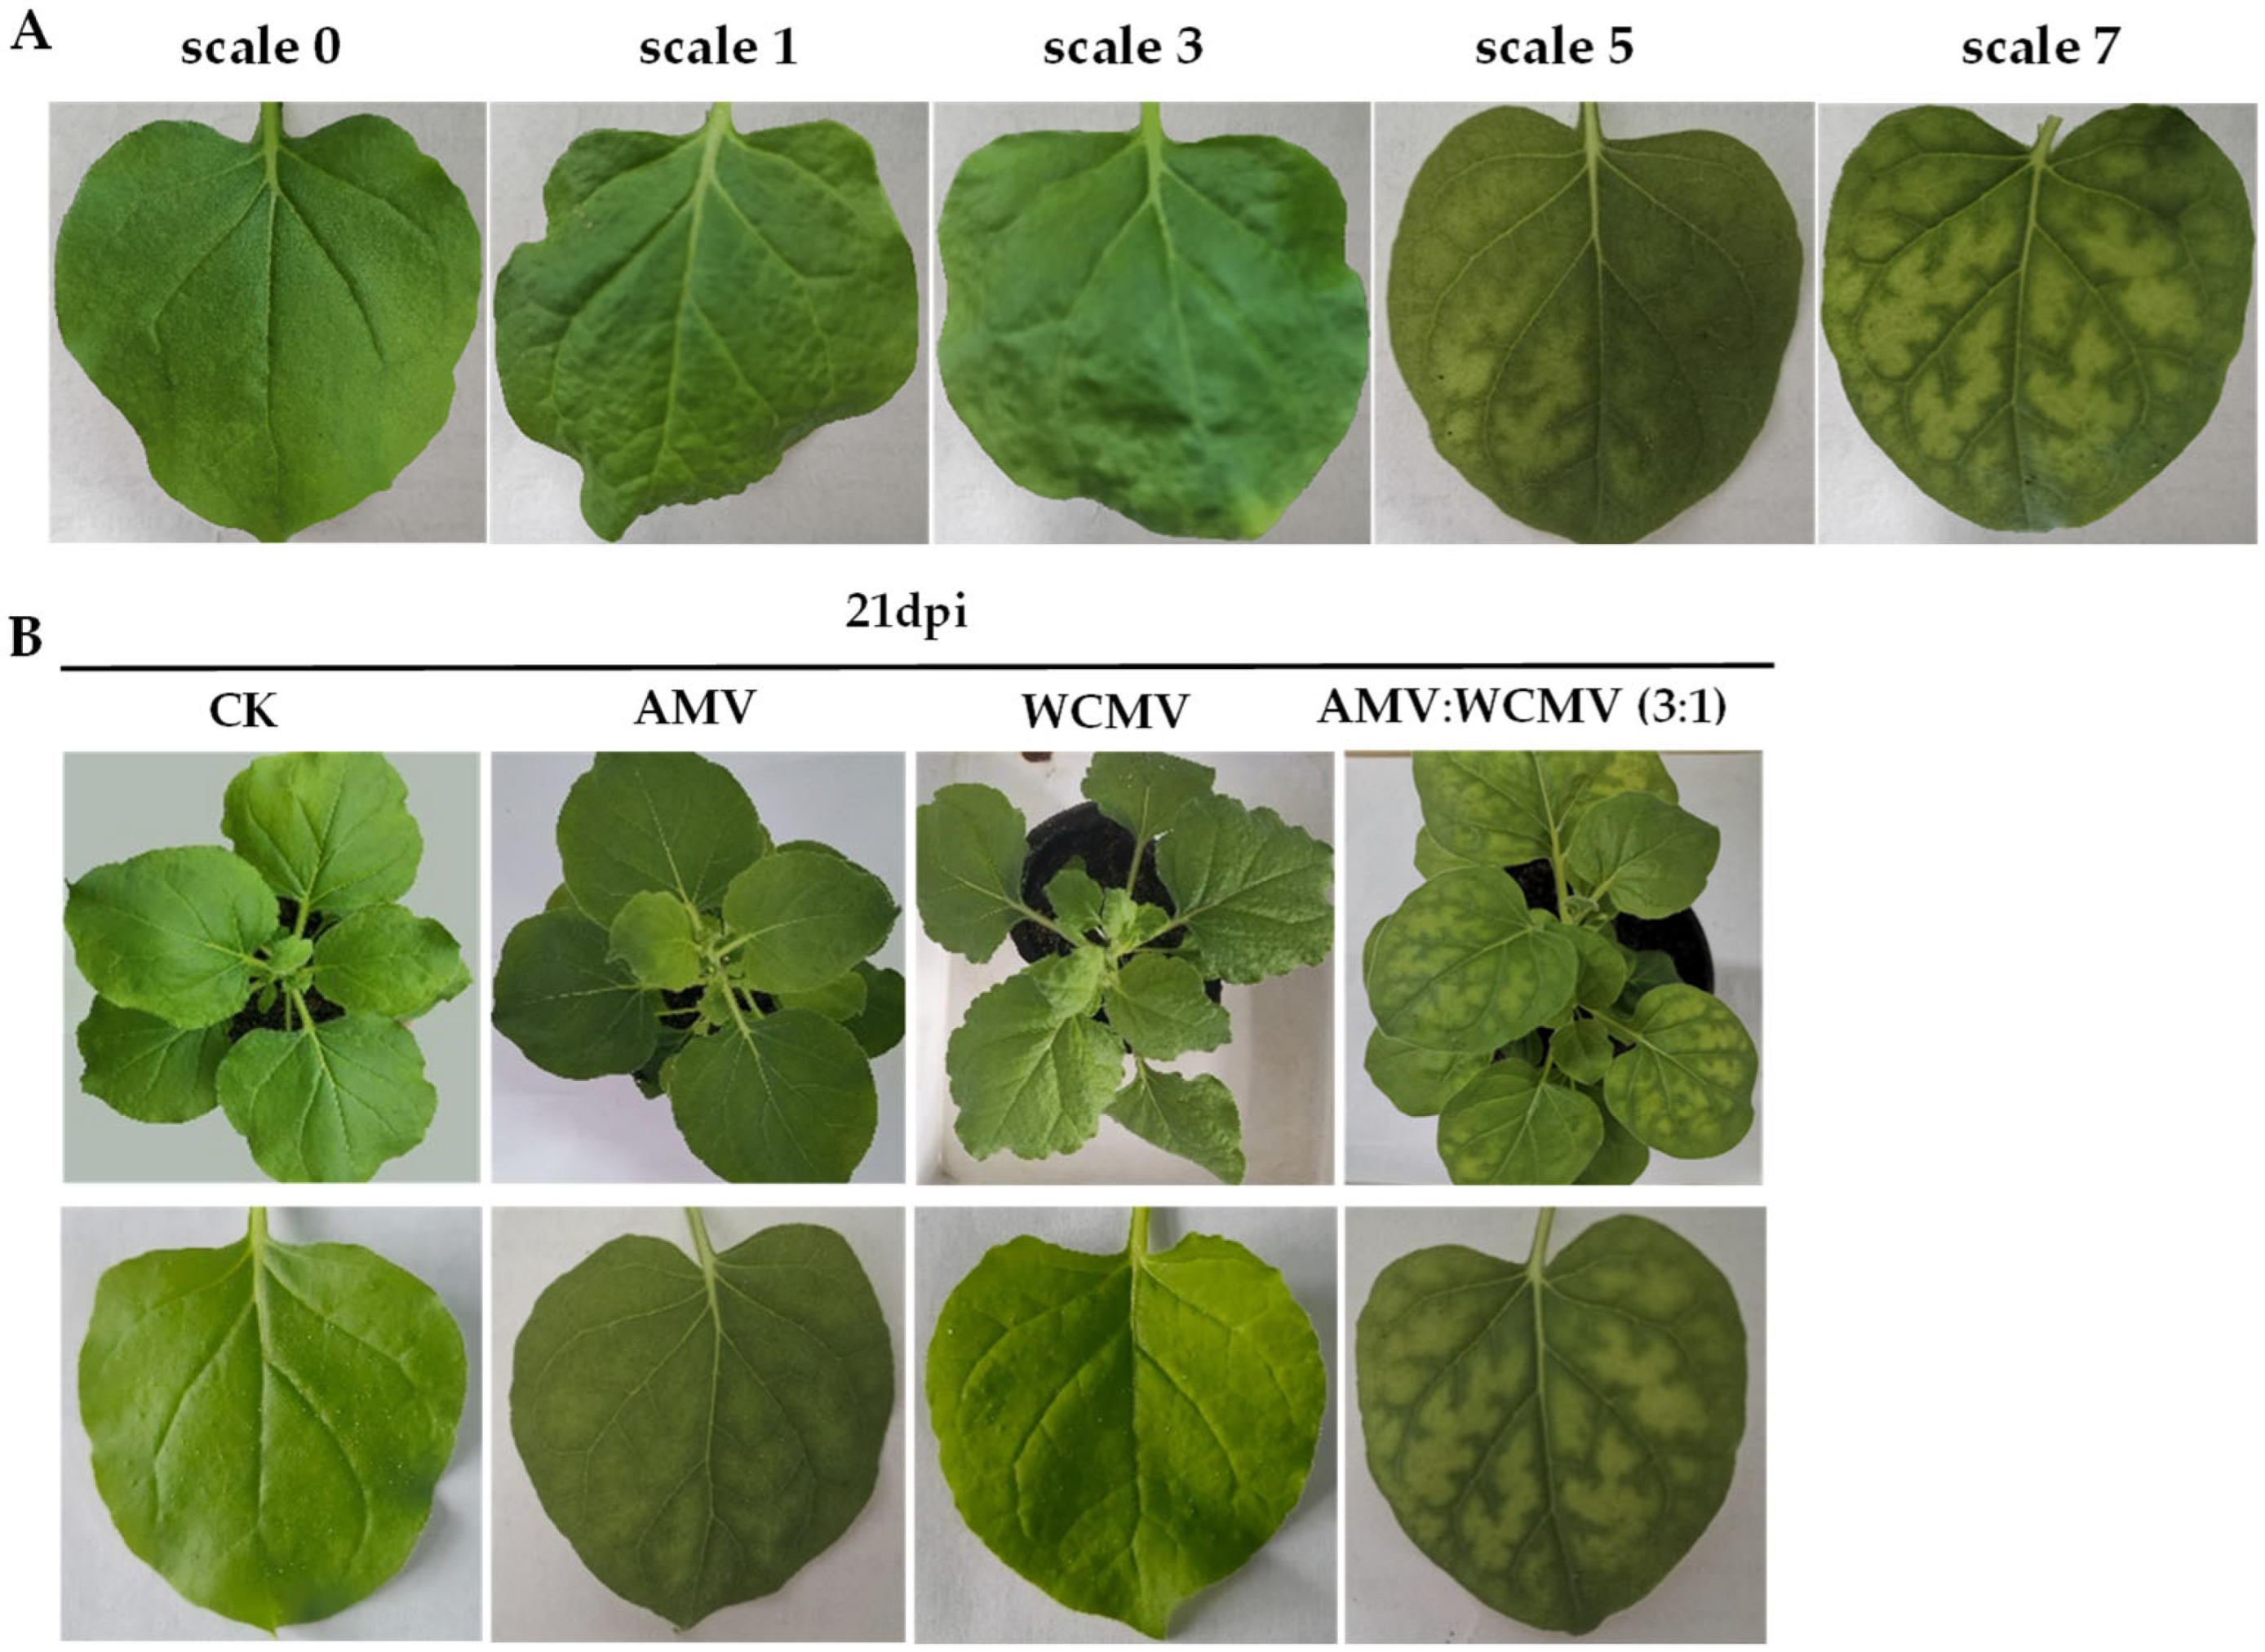
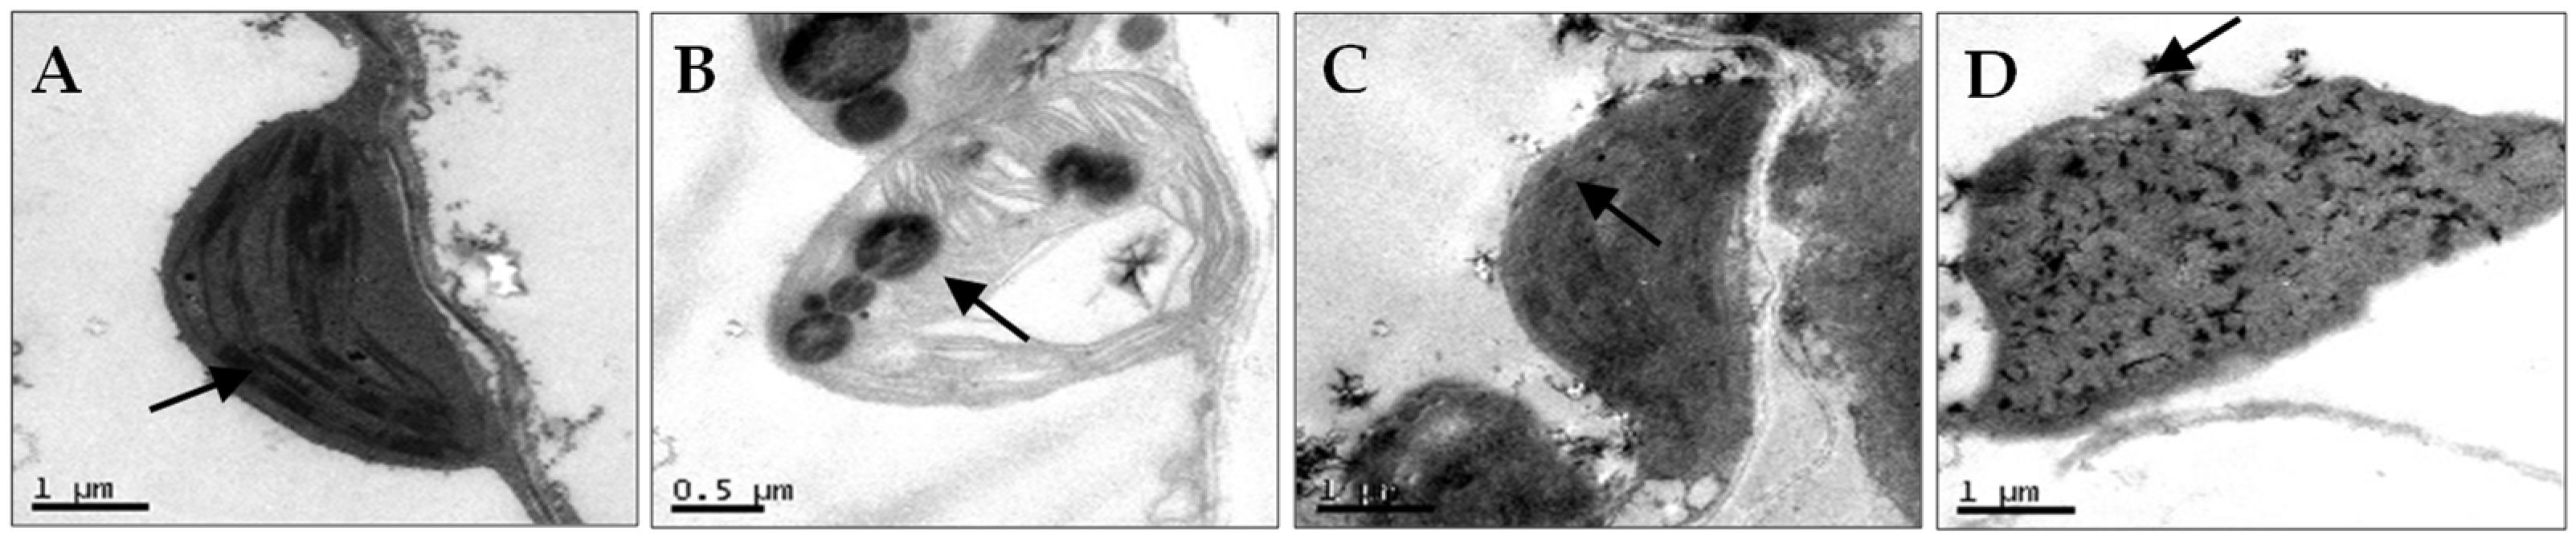
N. benthamiana leaves co-infected with AMV and WCMV exhibited more pronounced disease symptoms than those infected with single AMV or WCMV, and the disease grade reached scale 7 (Figure 1A). The manifested symptoms on co-infected plants included mottle mosaic, crumpling, chlorosis, and deformity (Figure 1B). Meanwhile, the chloroplast was on the verge of disintegration, the cell wall showed wavy deformation, and the periplasm was completely destroyed by N. benthamiana leaves co-infected with AMV and WCMV (Figure 2D). Chloroplasts exhibited morphological enlargement with AMV single infection, starch particles were larger than those of plants without inoculation (Figure 2B), and chloroplast grana were diffuse with WCMV single infection (Figure 2C).
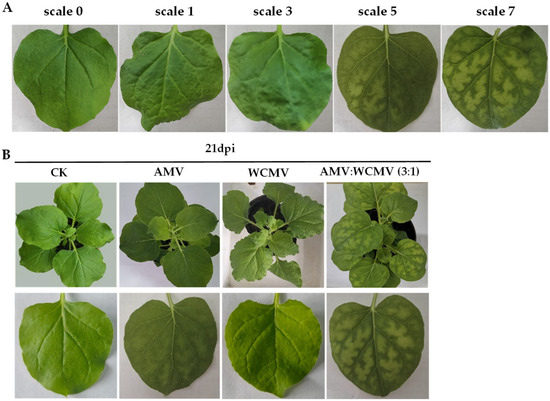
Figure 1.
Symptoms of N. benthamiana after AMV and WCMV co-infection. (A) The rating of disease symptoms of N. benthamiana is as follows: scale 0, asymptomatic; scale 1, leaf shrinkage; scale 3, slight mosaic and wrinkled; scale 5, moderate mosaic; and scale 7, severe mosaic. (B) Symptoms of N. benthamiana after AMV and WCMV co-infection and AMV and WCMV single infection. (CK) Whole plant and simple leaf of healthy N. benthamiana. (AMV) AMV infection of whole plant and single leaf of N. benthamiana. (WCMV) WCMV infection of whole plant and single leaf of N. benthamiana. (AMV:WCMV 3:1) AMV and WCMV co-infection of whole plant and single leaf of N. benthamiana. Lower panels are images of upper leaves.
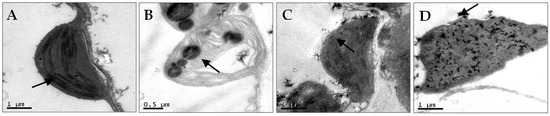
Figure 2.
Chloroplast ultrastructural changes of N. benthamiana after AMV and WCMV co-infection (21 dpi). (A) Image showing the chloroplast structure from CK; the arrow points to a normal granum (magnification, 25,000×). (B) The chloroplasts of AMV-infected cells had swollen lipid pellets; the arrow points to starch particles were larger (magnification 40,000×). (C) WCMV-infected cells showed abnormal chloroplast structure with no clear grana definition; the arrow points to chloroplast grana were diffuse (magnification, 25,000×). (D) Chloroplast inclusions of dissolved AMV- and WCMV-co-infected cells; the chloroplast was on the verge of disintegration; the arrow points to the cell wall showed wavy deformation (magnification, 25,000×).
3.2. Production of Standard Curves and Relative Accumulation of AMV CP and WCMV CP after AMV and WCMV Co-Infection
Four standard curves and amplification efficiencies were obtained by plotting standard curves with the Ct value as the vertical coordinate and the logarithmic value of cDNA concentration as the horizontal coordinate (Figure 3). The R2 values of the standard curves for the target genes AMV CP and WCMV CP and the internal reference genes 25S rRNA and β-Actin were 0.9939, 0.9898, 0.9882, and 0.9885, respectively, and the amplification efficiencies ranged from 98% to 104% (Table 1). This shows that the linear correlation of the standard curve was good and the amplification efficiency was in the normal range, which is suitable for use in fluorescence quantitative PCR analysis.
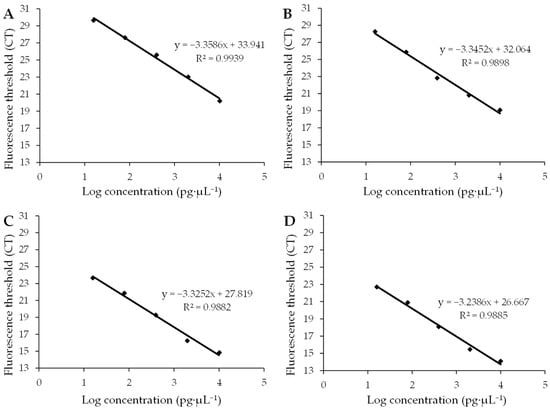
Figure 3.
Standard curves of the target gene and internal gene. (A) Standard curves of the target gene AMV CP show that the amplification efficiency was 0.9849 with an average standard error of 0.2082. (B) Standard curves of the target gene WCMV CP show that the amplification efficiency was 0.9904 with an average standard error of 0.0992. (C) Standard curves of the internal gene 25S rRNA show that the amplification efficiency was 0.9986 with an average standard error of 0.0779. (D) Standard curves of the internal gene β-Actin show that the amplification efficiency was 1.0360 with an average standard error of 0.1325. R2 is a statistic used to measure the degree to which the independent variable explains the change in the dependent variable. When R2 approaches 1, it indicates that the independent variable can explain most of the change in the dependent variable’s ability; therefore, the regression equation fits the data well. And when R2 approaches 0, the explanatory power of the independent variable compared to the dependent variable is weak, and the regression equation fits the data to a poor degree.

Table 1.
Standard curve formulas for target gene and internal gene.
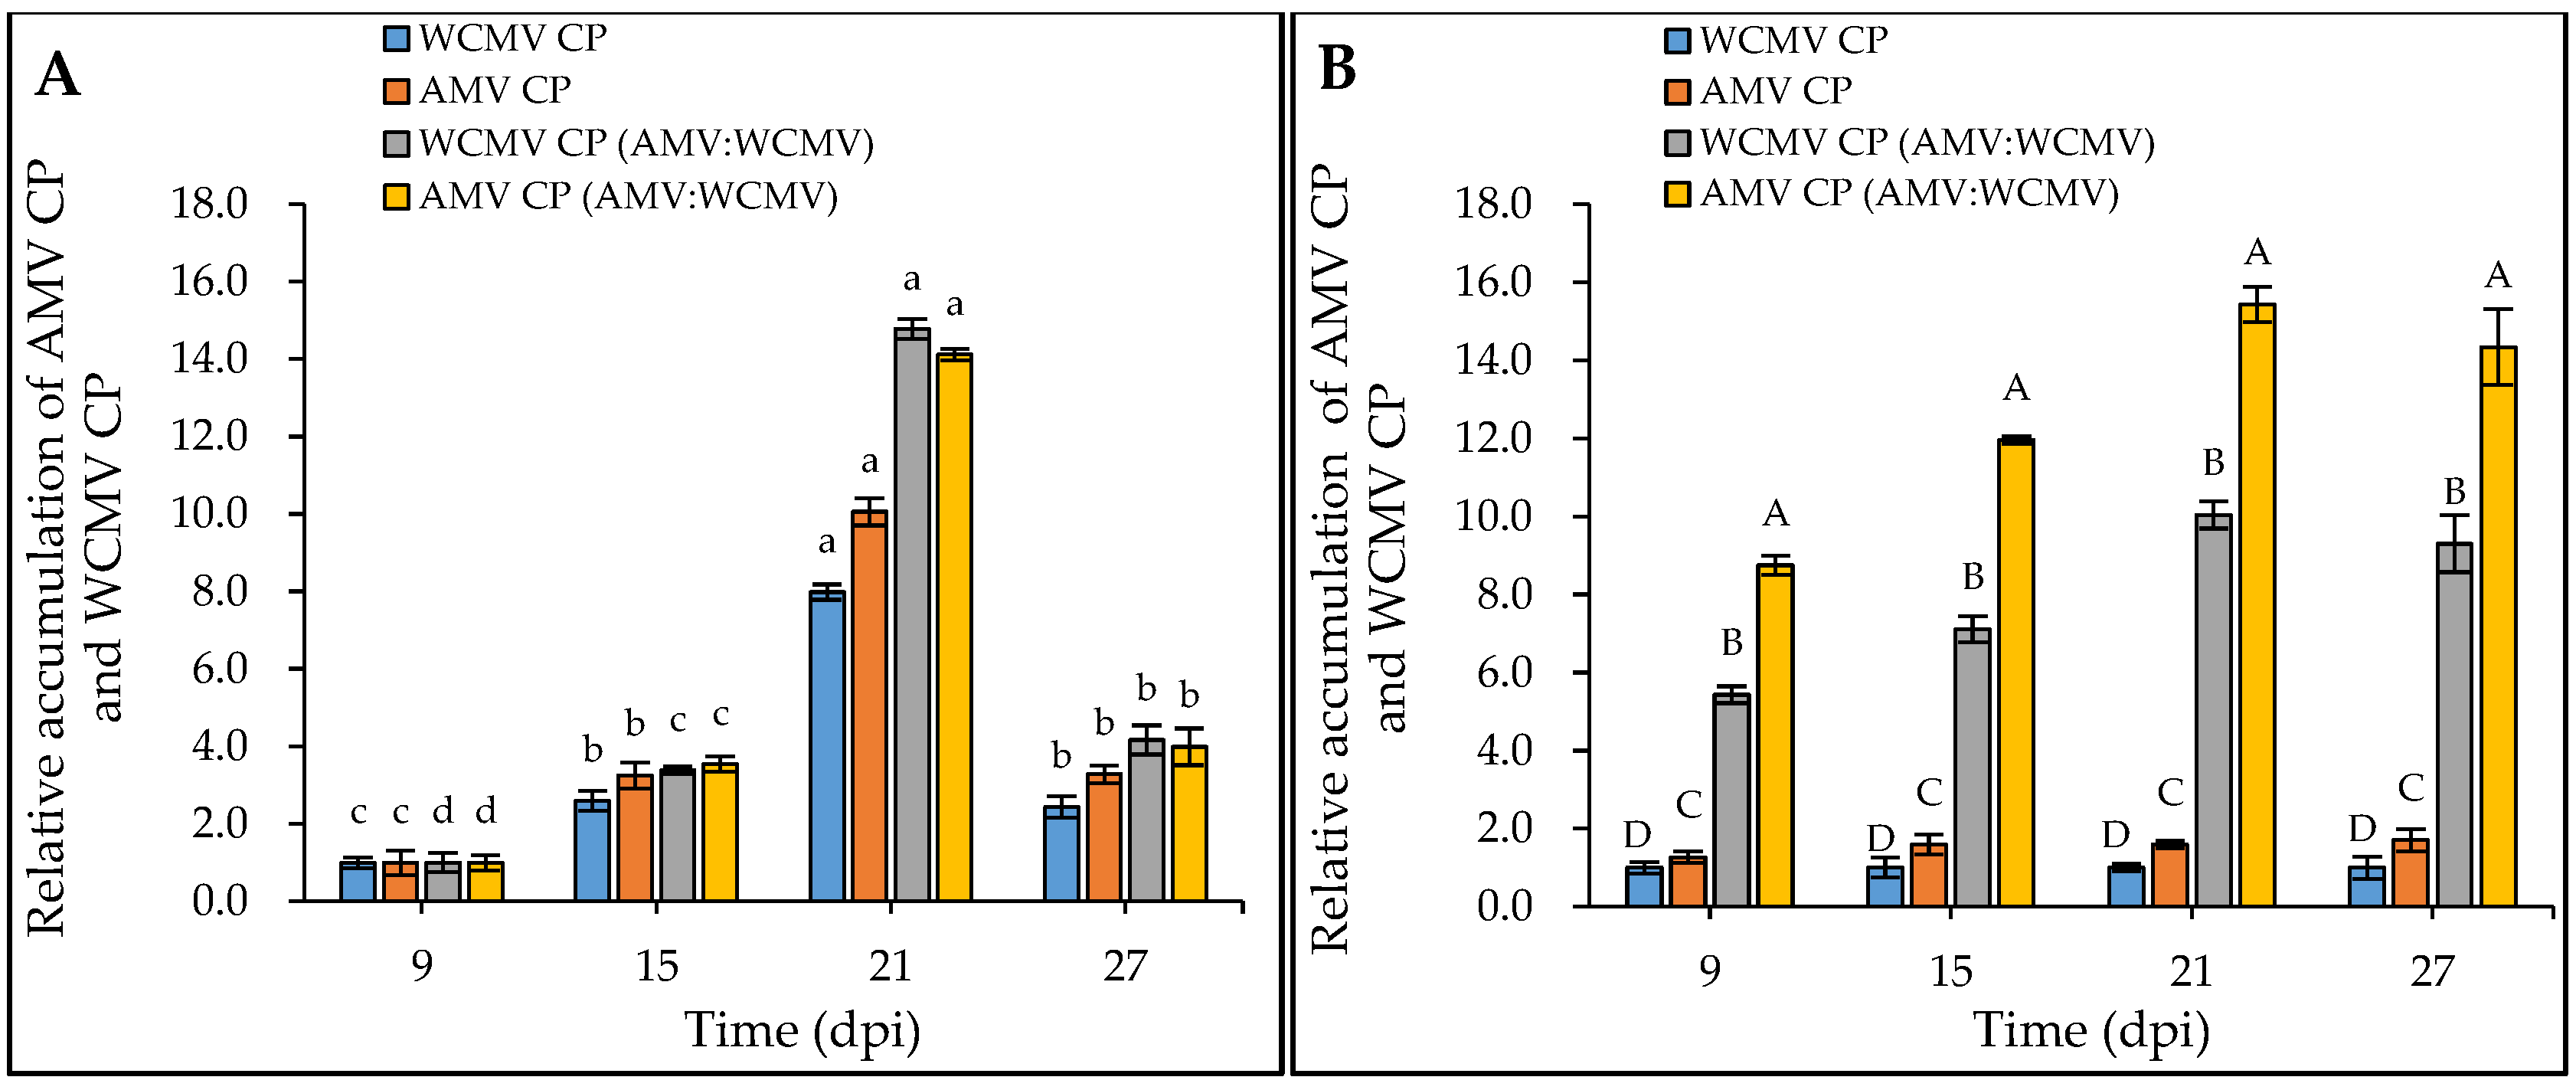
Meanwhile, the RT-qPCR determination results showed that the relative accumulation of AMV CP and WCMV CP in N. benthamiana co-infections was significantly higher than that in AMV and WCMV single infections. When 9 dpi samples were normalized to 1.00 for each treatment, the relative accumulation of AMV CP and WCMV CP reached a higher level at 21 dpi (Figure 4A). When the relative accumulation of WCMV CP in the single infection was normalized to 1.00, the relative accumulation of AMV CP and WCMV CP in co-infection was 15.44-fold and 10.04-fold greater than the respective values for single virus infection, respectively (Figure 4B). Generally, the concentrations of AMV and WCMV and the relative accumulation of AMV CP and WCMV CP were increased in the co-infection, indicating a synergistic effect between AMV and WCMV.
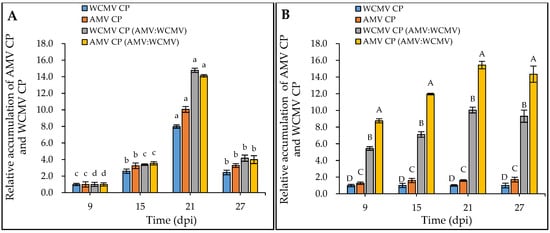
Figure 4.
Relative accumulation of AMV CP and WCMV CP in N. benthamiana after AMV and WCMV co-infection. WCMV CP, relative accumulation of WCMV CP of WCMV single infection. AMV CP, relative accumulation of AMV CP of AMV single infection. WCMV CP (AMV:WCMV), relative accumulation of WCMV CP of AMV and WCMV co-infection. AMV CP (AMV:WCMV), relative accumulation of AMV CP of AMV and WCMV co-infection. (A) The 9 dpi samples were normalized to 1.0 for each treatment. The relative accumulation of AMV CP and WCMV CP at 15 dpi, 21 dpi, and 27 dpi was calculated. The different lowercase letters indicate significant differences at the 0.05 level between AMV and WCMV co-infections and AMV or WCMV single infections at different times in the same treatment. (B) The WCMV single-infection samples were normalized to 1.0 each time (dpi). The relative accumulation of AMV CP and WCMV CP (AMV:WCMV) at 9 dpi, 15 dpi, 21 dpi, and 27 dpi was calculated. The different capital letters indicate significant differences at the 0.01 level between AMV and WCMV co-infection and AMV or WCMV single infection at different treatments at the same time.
3.3. Changes in the Contents of Photosynthetic Pigments in N. benthamiana after AMV and WCMV Co-Infection
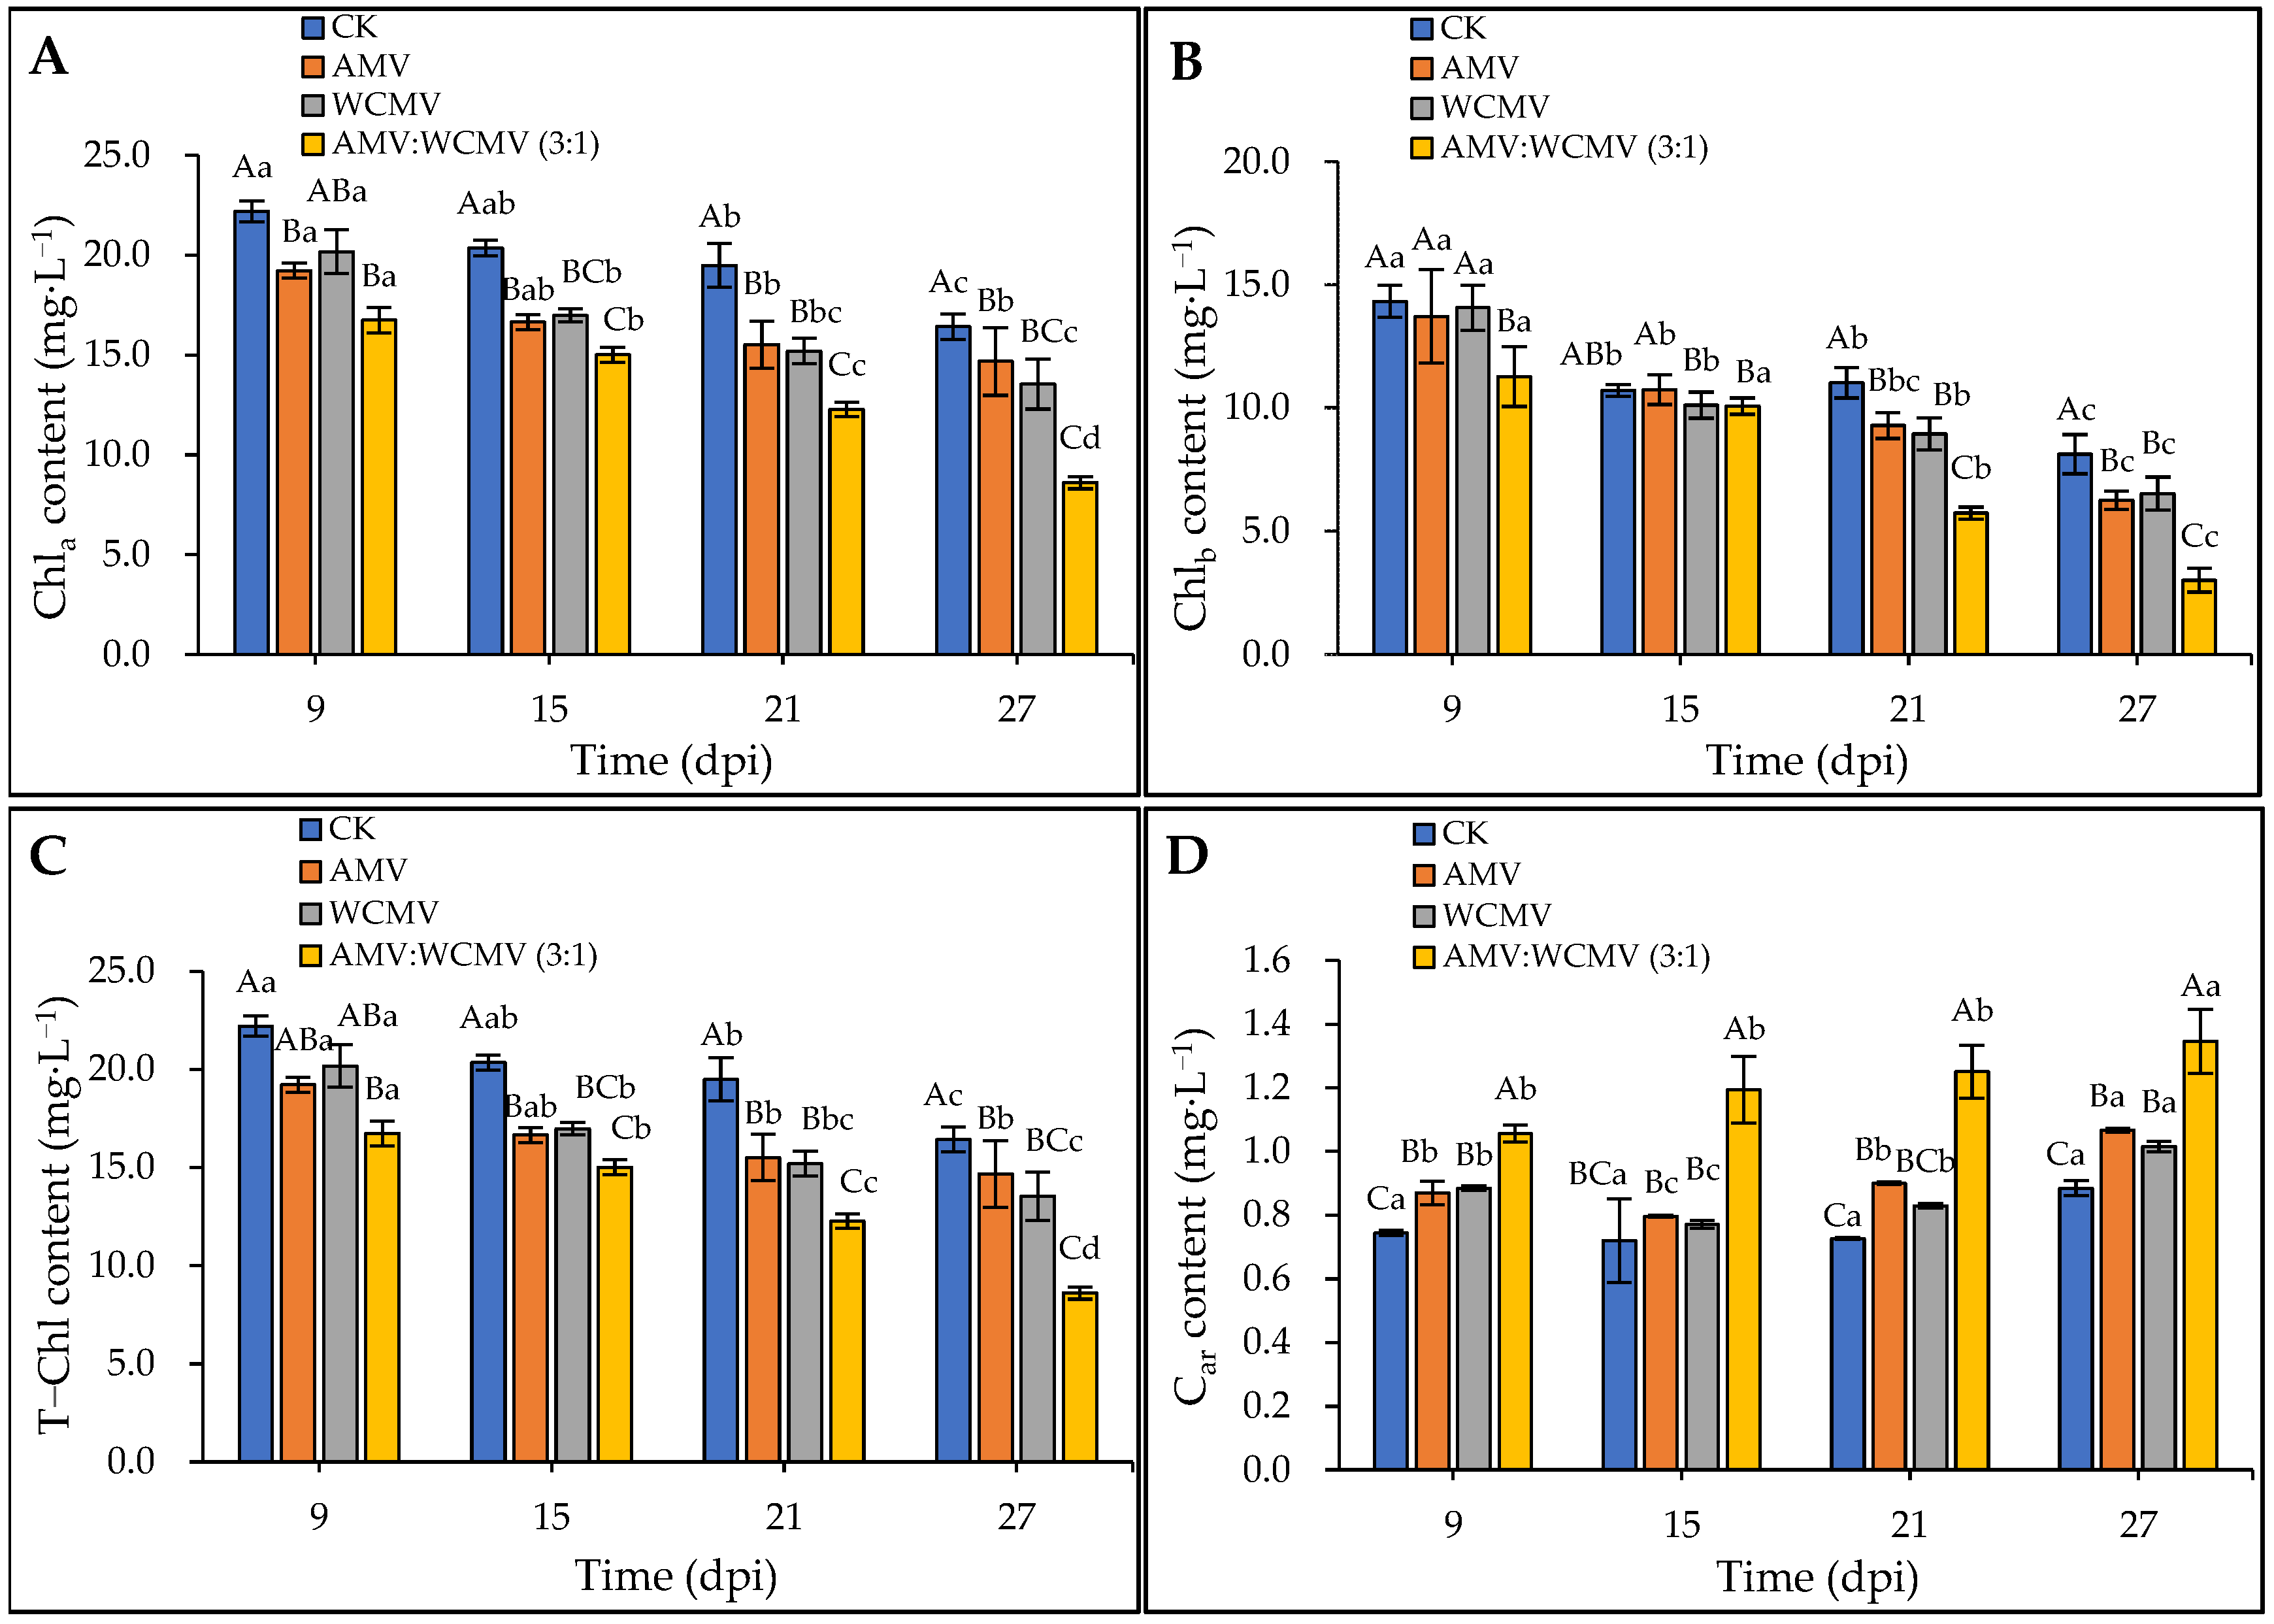
The AMV and WCMV co-infections significantly influenced the photosynthetic pigments in N. benthamiana leaves. Specifically, the Ch1a, Ch1b, and T-Ch1 contents exhibited a decreasing trend over time. In addition, AMV and WCMV co-infection significantly reduced the N. benthamiana Ch1a, Ch1b, and T-Ch1 contents compared to AMV or WCMV single infections and CK (Figure 5). At 27 dpi, the Ch1a content was 8.60 mg·L−1 in N. benthamiana after co-infection with AMV and WCMV and reduced by 21.88, 10.51, and 30.84% compared to AMV (14.68 mg·L−1) and WCMV (13.54 mg·L−1) single infections and CK (16.42 mg·L−1), respectively (Figure 5A). On the other hand, there was no significant difference in the Ch1b content in N. benthamiana leaves co-infected with AMV and WCMV compared to WCMV single infection and CK at 15 dpi. At 27 dpi, the Ch1b content was 3.02 mg·L−1 in N. benthamiana after being co-infected with AMV and WCMV and reduced by 51.81%, 53.81%, and 62.92% compared to AMV (6.26 mg·L−1) and WCMV (6.53 mg·L−1) single infections and CK (8.14 mg·L−1), respectively (Figure 5B). Additionally, the T-Ch1 content in the leaves co-infected with AMV and WCMV reached its lowest value of 11.62 mg·L−1, which was 51.81%, 53.81%, and 62.92% lower than in the N. benthamiana with AMV (6.26 mg·L−1) and WCMV (6.53 mg·L−1) single infections and CK (8.14 mg·L−1), respectively (Figure 5C). On the contrary, the Car content exhibited an increasing trend over time. The N. benthamiana with AMV and WCMV co-infection had a significantly higher Car content than AMV and WCMV single infections and CK. At 27 dpi, the Car content was 1.35 mg·L−1 in N. benthamiana after co-infection with AMV and WCMV and reduced by 20.71%, 24.54%, and 34.30% compared to AMV (1.07 mg·L−1) and WCMV (1.02 mg·L−1) single infections and CK (0.88 mg·L−1), respectively (Figure 5D).
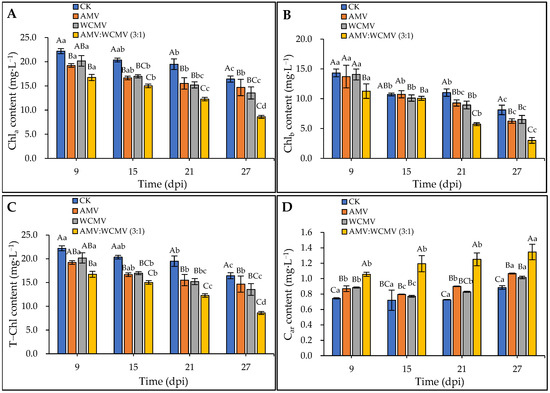
Figure 5.
Changes in photosynthetic pigment content of N. benthamiana after AMV and WCMV co-infection. (A) The changes in Ch1a content in N. benthamiana. (B) The changes in Ch1b content in N. benthamiana. (C) The changes in T-Ch1 content in N. benthamiana. (D) The changes in Car content in N. benthamiana. The different capital letters indicate significant differences at the 0.01 level between AMV and WCMV co-infection and AMV or WCMV single infection in different treatments at the same time, and the different lowercase letters indicate significant differences at the 0.05 level between AMV and WCMV co-infection and AMV or WCMV single infection at different times in the same treatments.
3.4. The Changes in Gas Exchange During Photosynthesis in N. benthamiana after AMV and WCMV Co-Infection
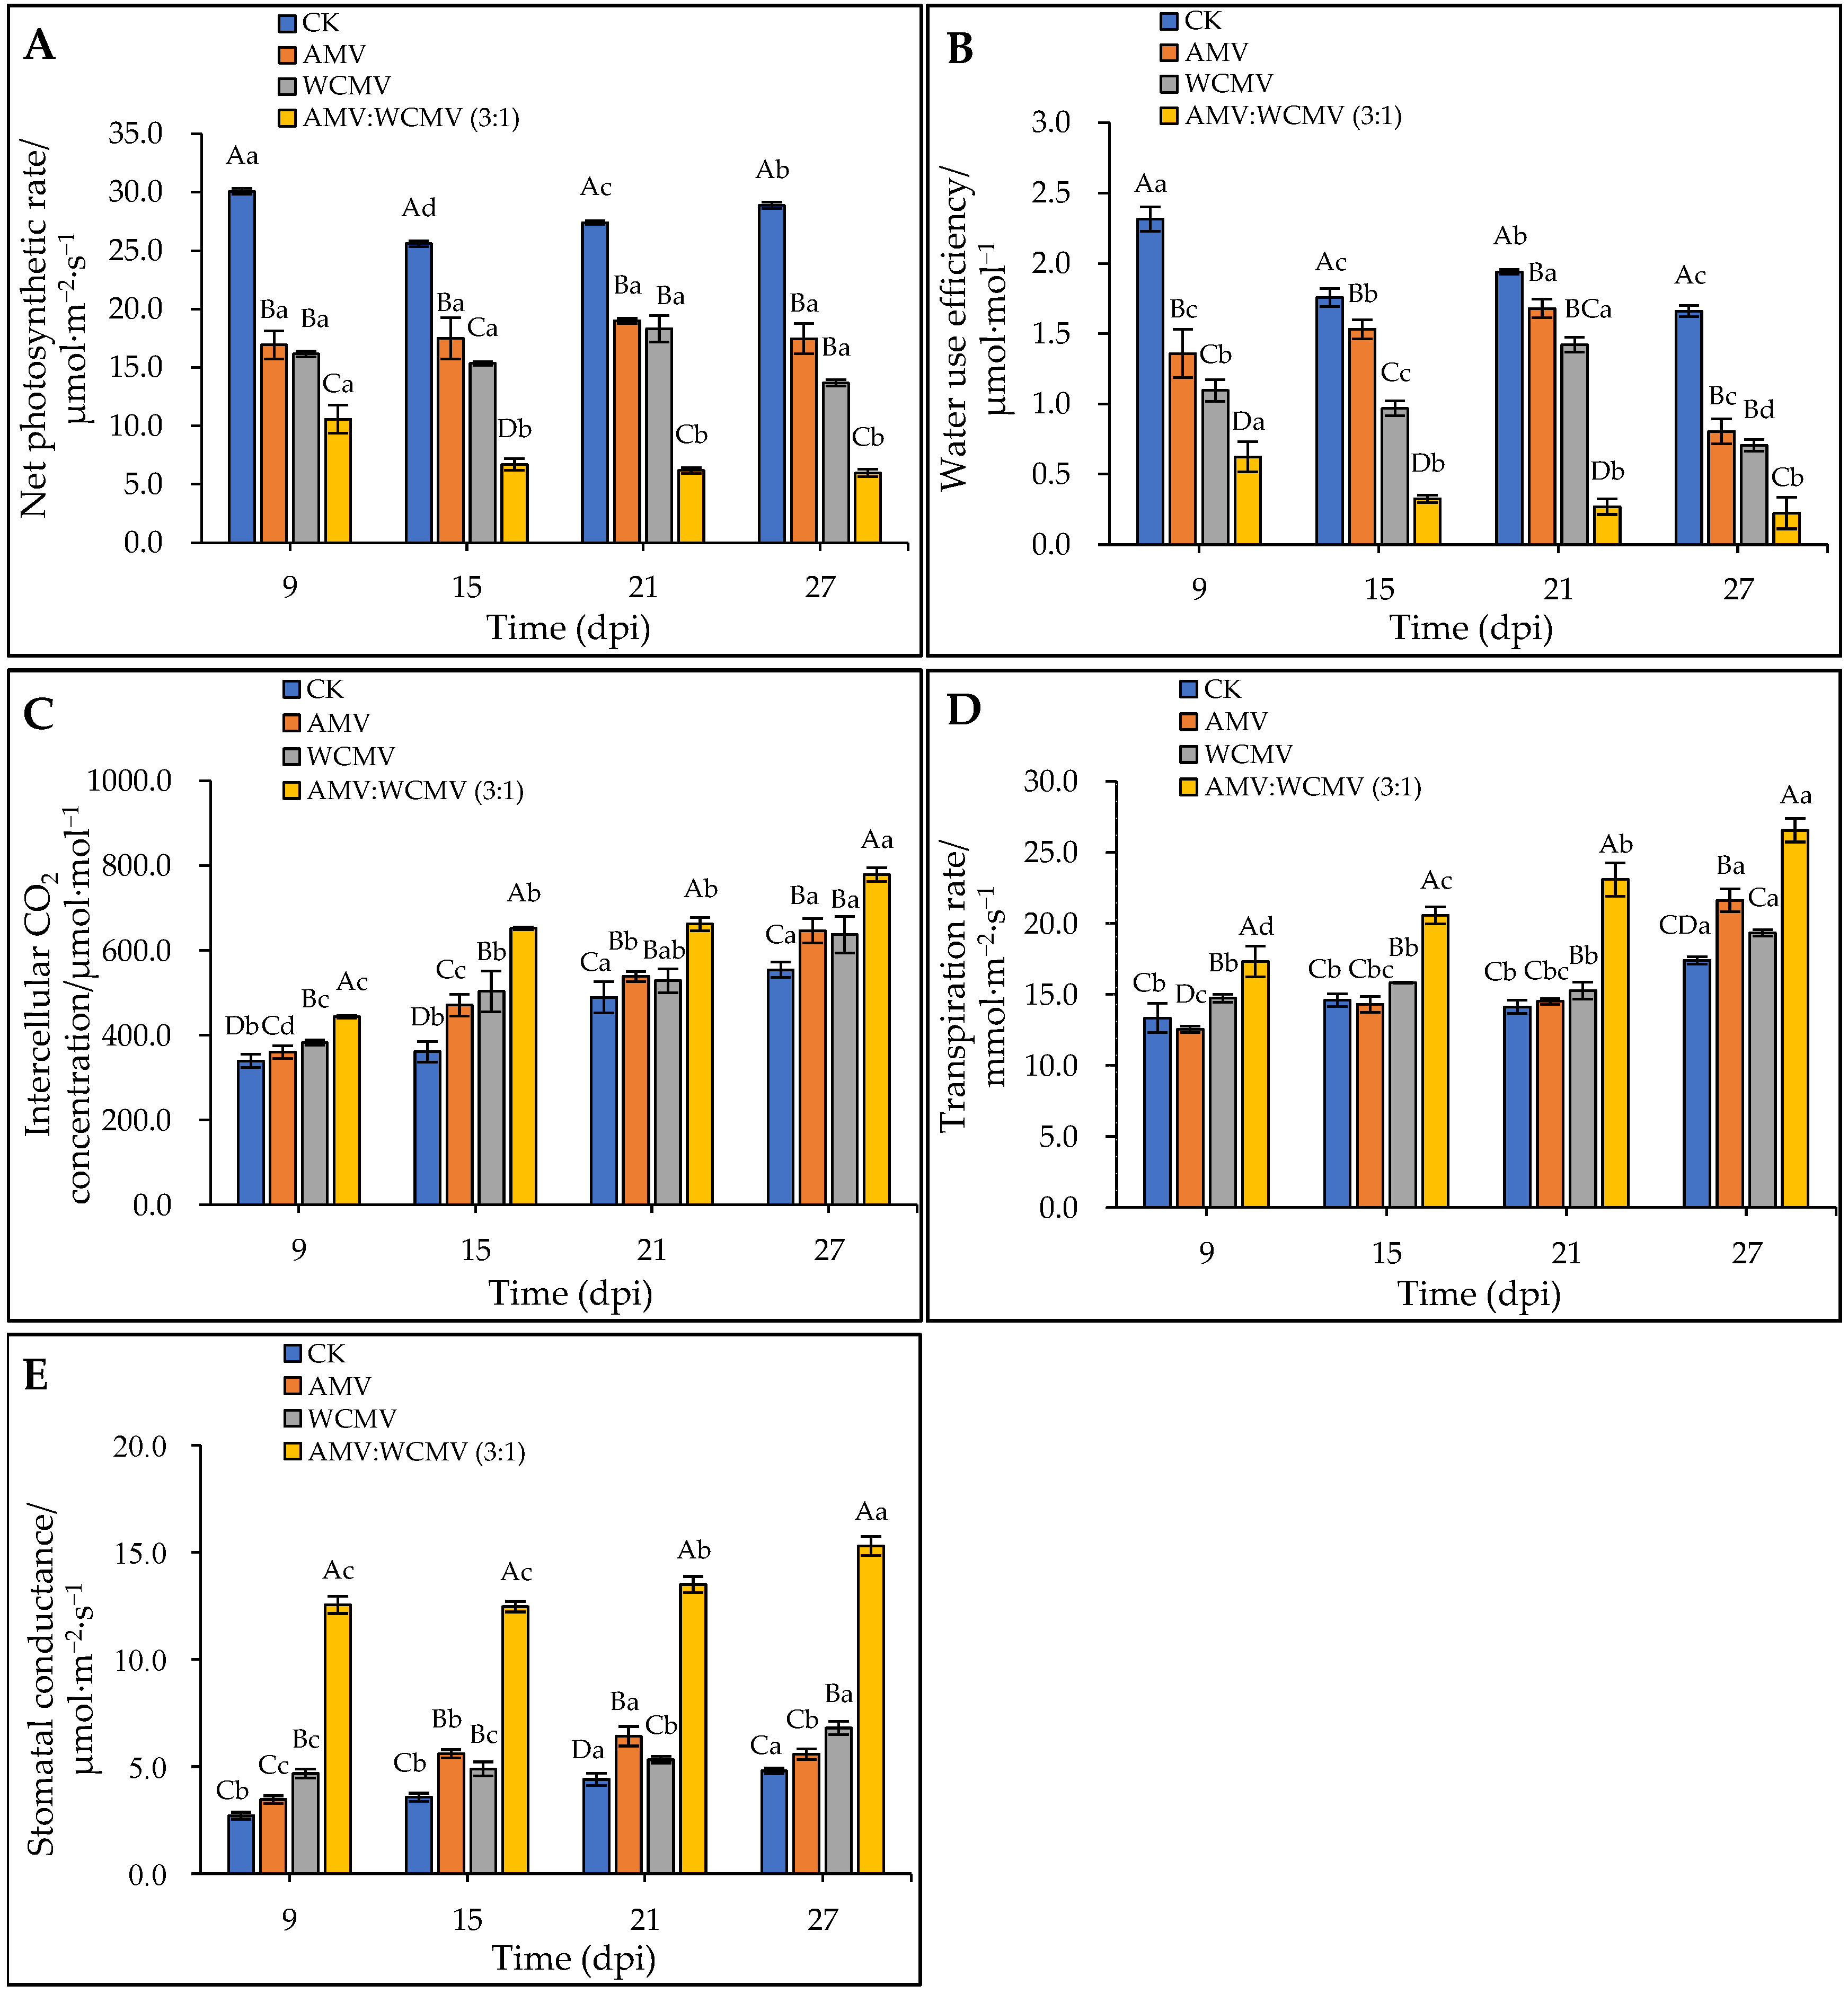
To verify the impact of AMV and WCMV on photosynthesis, the change in gas exchange was measured after AMV and WCMV co-infection in N. benthamiana. The AMV and WCMV co-infection of N. benthamiana had a decreasing trend in Pn and WUE contents with the increase in time, whereas at the same time, the Pn and WUE contents of the AMV and WCMV co-infection were significantly lower than those of the AMV and WCMV single infection, or CK. Meanwhile, the Pn and WUE contents of the two single-infection viruses were significantly lower than those of the CK. At 27 dpi, the content of Pn was 5.96 μmol·m−2·s−1, which was 65.84%, 56.37%, and 79.36% lower than those of AMV (17.45 μmol·m−2·s−1) and WCMV (13.66 μmol·m−2·s−1) single infections and CK (28.88 μmol·m−2·s−1), respectively (Figure 6A). The WUE content was 0.22 μmol·mol−1, which was 72.06%, 68.21%, and 86.48% lower than those of AMV (0.80 μmol·mol−1) and WCMV (0.71 μmol·mol−1) single infections and CK (1.66 μmol·mol−1), respectively (Figure 6B).

Figure 6.
Effect on parameters for gas exchange in the photosynthesis of N. benthamiana leaves after AMV and WCMV co-infection. (A) Net photosynthetic rate (Pn). (B) Water use efficiency (WUE). (C) Intercellular CO2 concentration (Ci). (D) Transpiration rate (Tr). (E) Stomatal conductance (Gs). The different capital letters indicate significant differences at the 0.01 level between AMV and WCMV co-infection and AMV or WCMV single infection in different treatments at the same time, and the different lowercase letters indicate significant differences at the 0.05 level between AMV and WCMV co-infection and AMV or WCMV single infection at different times in the same treatments.
In contrast, AMV and WCMV co-infection in N. benthamiana had an increasing trend of Ci, Tr, and Gs contents with the increase in time, whereas at the same time, the Ci, Tr, and Gs contents of AMV and WCMV co-infection were significantly higher than those of AMV and WCMV single infection, or CK. Meanwhile, the Ci, Tr, and Gs contents of the two single-infection viruses were significantly higher than those of the CK. By 27 dpi, the content of Ci was 778.77 μmol·mol−1, which was 16.70%, 18.20%, and 28.81% lower than those of AMV (646.40 μmol·mol−1) and WCMV (637.07 μmol·mol−1) single infections and CK (554.41 μmol·mol−1) (Figure 6C). The content of Tr was 26.54 mmol·m−2·s−1, which was 18.54%, 27.18%, and 34.46% lower than those of AMV (21.62 mmol·m−2·s−1) and WCMV (19.33 mmol·m−2·s−1) single infections and CK (17.40 mmol·m−2·s−1) (Figure 6D). The content of Gs was 15.31 μmol·m−2·s−1, which was 63.55%, 55.58%, and 68.62% lower than those of AMV (5.58 μmol·m−2·s−1) and WCMV (6.80 μmol·m−2·s−1) single infections and CK (4.80 μmol·m−2·s−1), respectively (Figure 6E). Thus, these results indicate that AMV and WCMV co-infection changes the content of the gas exchange parameter, making N. benthamiana more susceptible to disease.
3.5. The Changes in Chlorophyll Fluorescence Parameters in N. benthamiana after AMV and WCMV Co-Infection
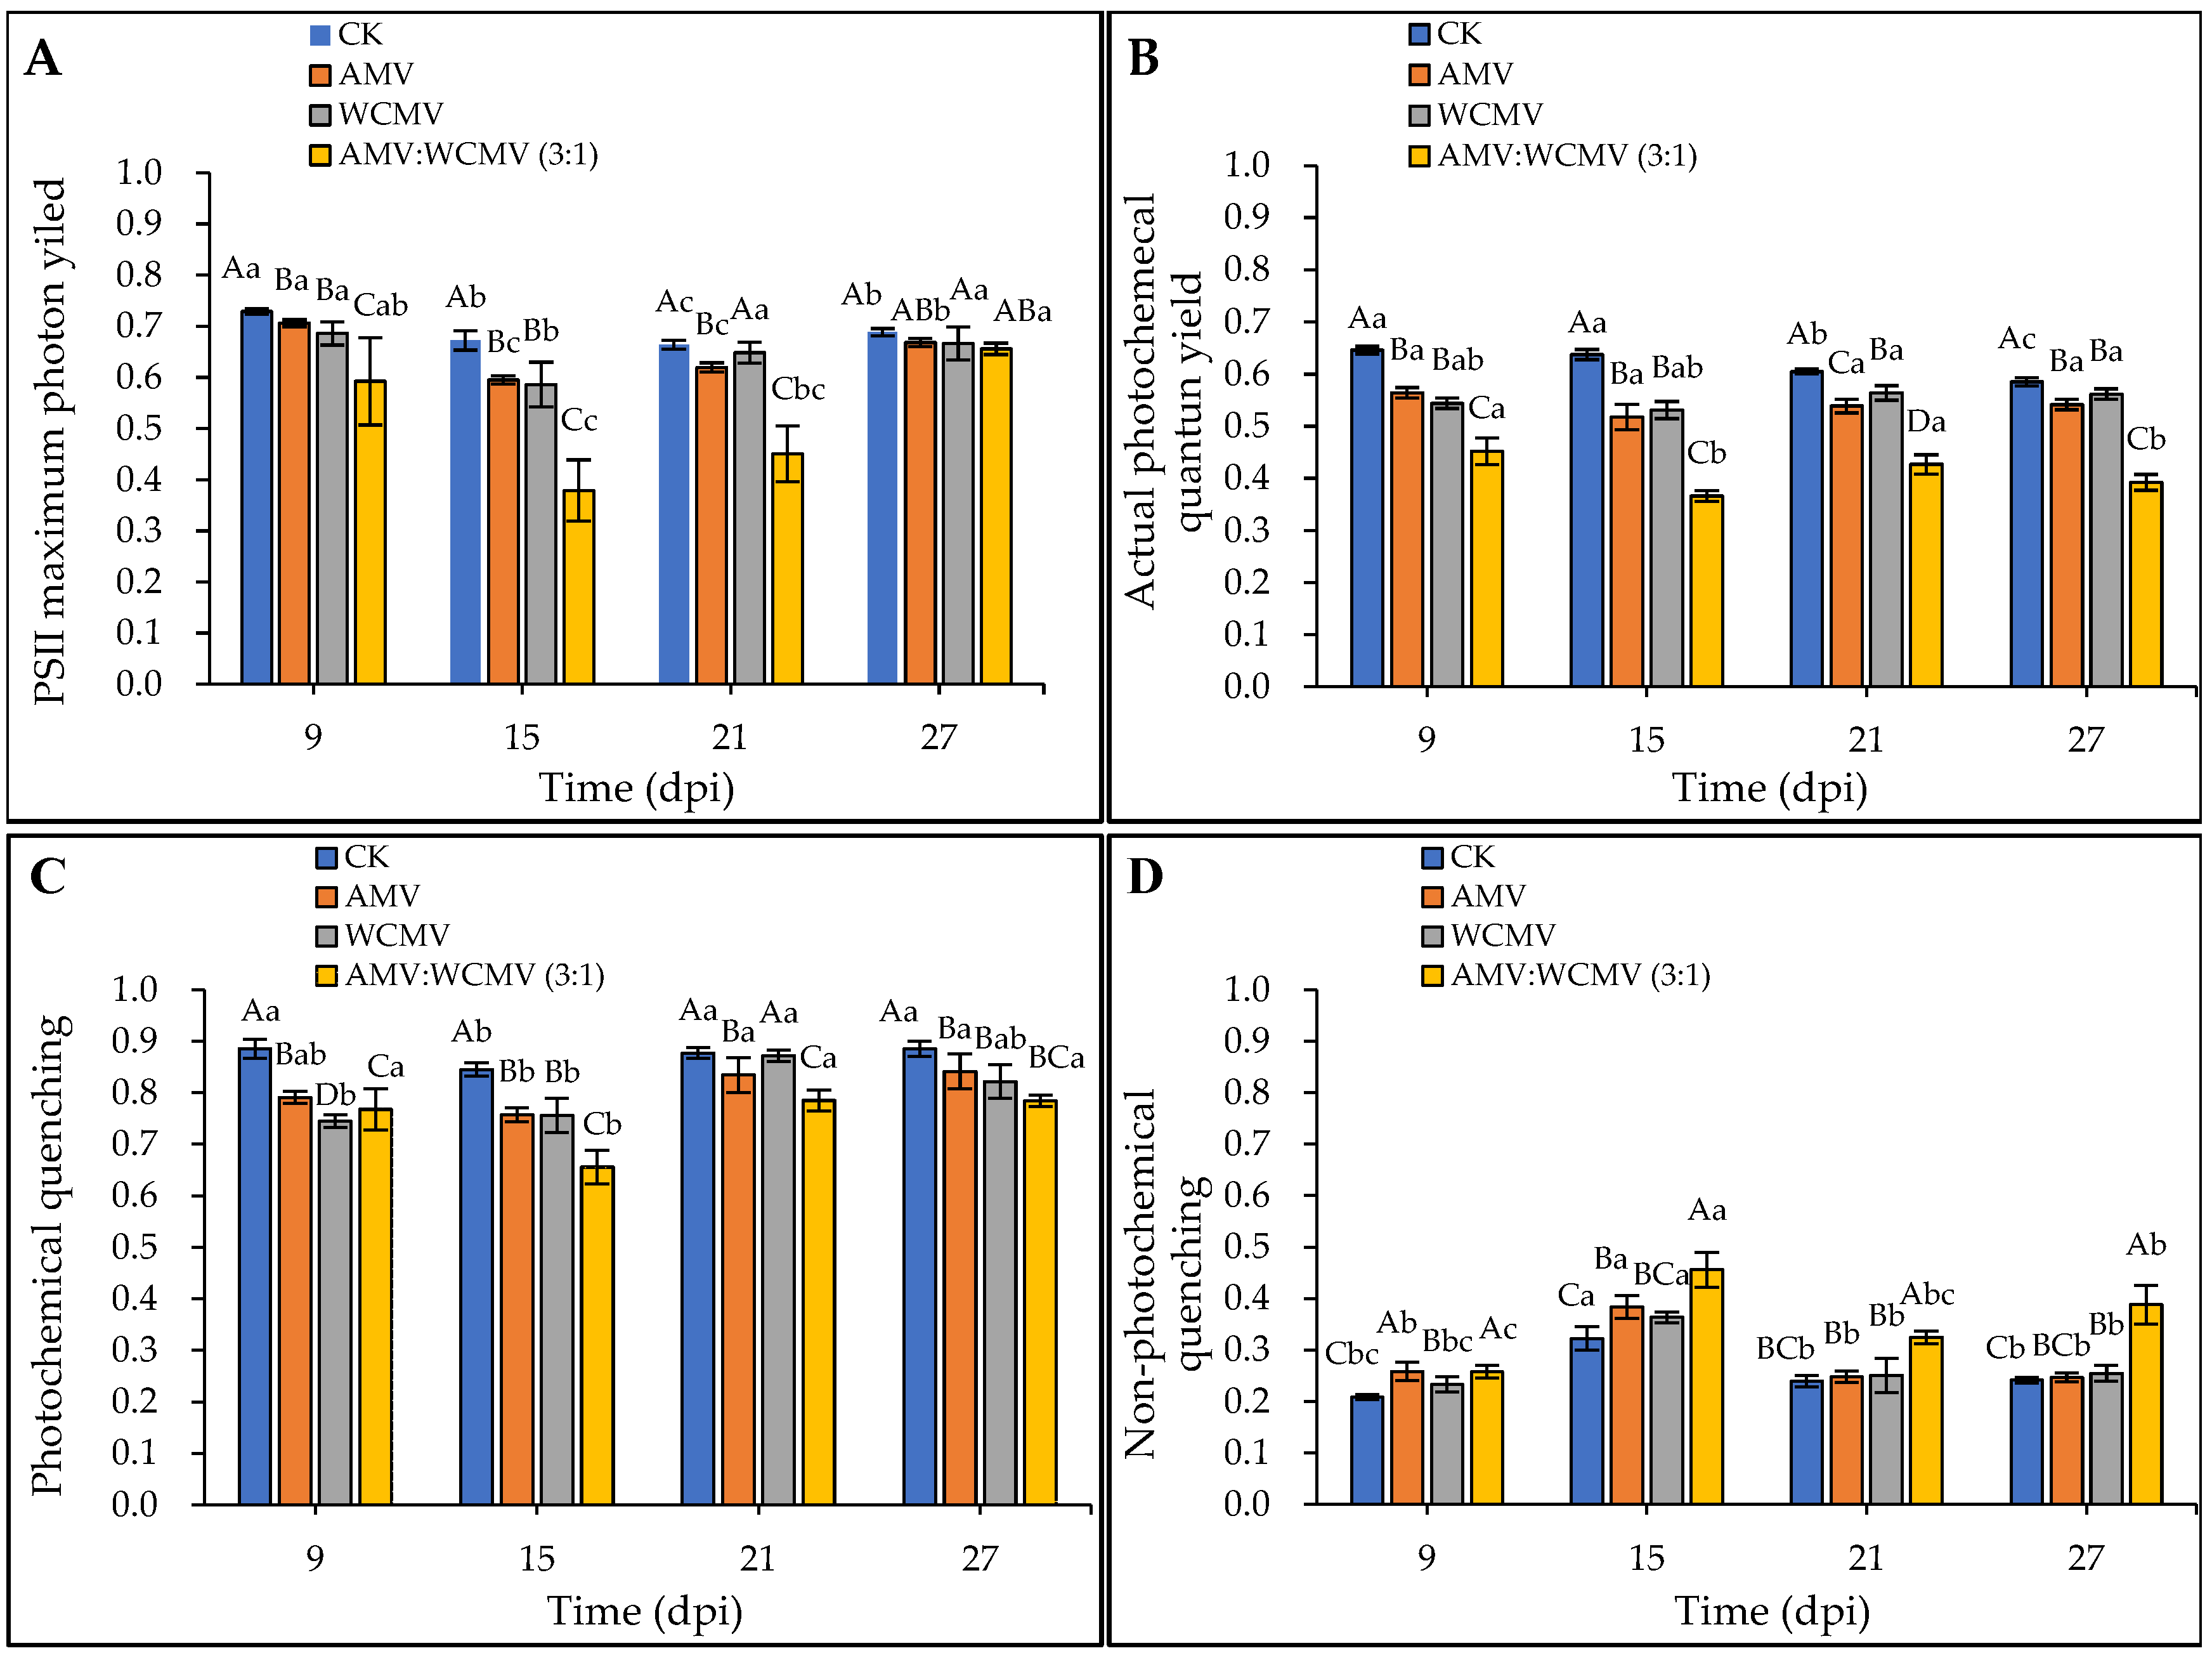
The effect of the AMV and WCMV co-infection on chlorophyll fluorescence parameters in N. benthamiana was determined. The Fv/Fm, ΦPSII, and qP of AMV and WCMV co-infection were significantly lower than those of AMV and WCMV single infection and CK, exhibiting an initial decline followed by a subsequent increase at a different time. At 15 dpi, the Fv/Fm, ΦPSII, and qP reduced the value to the minimum in N. benthamiana of AMV and WCMV co-infection, and the Fv/Fm values were 0.38 and significantly reduced by 36.29%, 35.32%, and 43.64% compared to the values recorded in N. benthamiana with AMV (0.60) and WCMV (0.59) single infection and CK (0.67), respectively (Figure 7A). The ΦPSII values were lowest (0.37), which were 29.31%, 31.06%, and 42.57% lower than those of AMV (0.52), WCMV (0.53), and CK (0.64), respectively (Figure 7B). The qP value was 0.66, which was 13.39%, 13.25%, and 22.45% lower than those of AMV (0.76) and WCMV (0.76) single infections and CK (0.85), respectively (Figure 7C).

Figure 7.
Dynamics of chlorophyll fluorescence parameters in N. benthamiana after AMV and WCMV co-infection. (A) PSII maximum photon yield (Fv/Fm). (B) Actual photochemical quantum yield (ΦPSII). (C) Photochemical quenching (qP). (D) Non-photochemical quenching (qN). The different capital letters indicate significant differences at the 0.01 level between AMV and WCMV co-infection and AMV or WCMV single infection in different treatments at the same time, and the different lowercase letters indicate significant differences at the 0.05 level between AMV and WCMV co-infection and AMV or WCMV single infection at different times in the same treatments.
Additionally, AMV and WCMV co-infection in N. benthamiana had a rising and then decreasing trend in qN values with the increase in time; it rose to its maximum at 15 dpi. The qN values of AMV and WCMV co-infection were significantly higher than those of AMV and WCMV single infection and CK at the same time. Meanwhile, the qN values of the two viruses per single infection were significantly higher than those of the CK. At 15 dpi, the qN was 0.46, which was 15.87%, 20.31%, and 29.29% lower than those of AMV (0.38) and WCMV (0.36) single inoculations and CK (0.32), respectively (Figure 7D). These results also indicate that AMV and WCMV co-infection changes the chlorophyll fluorescence parameters, destroys the photoprotective mechanism, and increases the degree of disease in N. benthamiana.
4. Discussion
4.1. Synergistic Effect of AMV and WCMV Co-Infection
At present, although the mechanisms of pathogenicity of AMV and WCMV in single infections of different plants have been thoroughly studied [26,27], the interaction between AMV and WCMV co-infection in plants is less well understood. Our previous study revealed that clover virus disease caused by AMV and WCMV is widespread, there is a co-infection phenomenon that can lead to substantial losses, and the relative contents of the two viruses were significantly increased in co-infected white clover [19]. Several studies have revealed that chloroplasts are the most susceptible organelles to viral infection and the first organelles attacked by most plant viruses [28,29,30]. Here, we have demonstrated that AMV and WCMV co-infection results in a synergistic interaction, leading to more severe disease symptoms of mosaic, mottling, and dwarfing of the whole N. benthamiana than AMV and WCMV single infections. Meanwhile, the changes in chloroplast structure include the contents dissolving, with the cell membrane structure being disorganized, and even the chloroplast structure disintegrating [31]. In addition, the relative accumulation of AMV CP and WCMV CP was significantly increased by 15.44-fold and 10.04-fold upon co-infection compared to that with a single virus infection at 21 dpi. It is worth noting why the concentration of AMV and WCMV and the relative accumulation of AMV CP and WCMV CP reached their max at 21 dpi. This may be due to the fact that after the virus invades the host chloroplast, it causes corresponding damage to the host cell while providing raw materials for its replication [19]. At 21 dpi, the host cell damage rate reaches its maximum, and the virus cannot be provided with raw materials for replication, resulting in a gradual decrease in the virus’s replication rate [32,33]. The specific reasons remain to be further studied.
4.2. Effect on Photosynthetic Characteristics of N. benthamiana after AMV and WCMV Co-Infection
The effect of virus infection on host photosynthesis has been widely reported [34]. It has been suggested that altered photosynthesis is a common and conservative strategy for viral pathogenesis [35,36]. Plant viruses impede the normal physiological metabolism of the host after infestation, increase the activity of chlorophyll catabolic enzymes, and decrease the chlorophyll content [29,37,38]. In addition, viral infections affecting the electron transfer activity within plant chloroplasts significantly restrain the absorption and capture capacity of the light system [39]. This means that chloroplast–virus interactions include decreases in chlorophyll pigments, changes in photosynthetic gas exchange parameters, and chlorophyll fluorescence [40,41].
We therefore investigated the effect of AMV and WCMV co-infection on the photosynthetic properties of N. benthamiana leaves. This result indicated that the Ch1a, Ch1b, and T-Ch1 contents of the AMV and WCMV co-infection were significantly lower than those of the AMV and WCMV single infection, or CK; the contents of Car were increased. Meanwhile, connected with the timing of virus inoculation, the Ch1a, Ch1b, and T-Ch1 content decreased gradually with increasing inoculation time and car content, on the contrary [42]. Moreover, under AMV and WCMV co-infection, the gas exchange during the photosynthesis effects of N. benthamiana were more severe, and the Pn and WUE content significantly reduced compared to AMV and WCMV single inoculations and CK. With increasing inoculation time, the Ci, Tr, and Gs content has been increasing with decreasing inoculation time. With the enhancement in inoculation time over a range, the PS II photosystem potential activity was significantly lower, with lower Fv/Fm, ΦPSII, and qP values than the AMV and WCMV single inoculations and CK, and higher qN values than these three treatments [43,44]. It was further confirmed that the disease symptoms of N. benthamiana after AMV and WCMV co-infection were more serious than those of AMV and WCMV single infection, with more serious harm to the host and a stronger effect of viral infection on the structure of the chloroplasts, which leads to a reduction in the chlorophyll content and a change in the photosynthetic activity of the host [45].
In addition, we inoculated a mixture of AMV and WCMV (3:1) on different host plants of the Leguminosae, Solanaceae, Poaceae, Cucurbitaceae, Asteraceae, Brassicaceae, and Chenopodiaceae, which are different host plants. It was found that under these conditions, the co-infection of these two viruses would aggravate the disease symptoms of the host plants, and the damage was higher than that caused by the single infection of the viruses. At the same time, Nicotiana tabacum, S. tuberosum, and C. annuum in the Solanaceae family are the main cash crops in China, which are widely planted and are also the main hosts of AMV and WCMV infection, especially N. tabacum, which is planted in a large area in rural areas. We have conducted research on the photosynthetic characteristics of N. tabacum after inoculation with AMV and WCMV, and the results showed that the impact of the co-infection with AMV and WCMV on N. tabacum was consistent with that on N. benthamiana. This indicates that the synergistic effect among viruses significantly inhibited the normal conduct of photosynthesis and reduced the photosynthetic efficiency of the plant compared with a single infection, affecting the physiological functions and growth of the hosts [45,46]. Thus, these findings will provide a more comprehensive understanding of the inhibitory synthesis of photosynthetic pigments and chloroplast photosynthesis with virus-co-infected plants [47].
Our results provide the first evidence that the combined infection of AMV and WCMV aggravated the morbidity symptoms of N. benthamiana, severely damaged the chloroplast morphology results, and interfered with the normal conduct of photosynthesis. There was a synergistic effect between AMV and WCMV, with WCMV as the synergistic virus and AMV as the passive synergistic virus.
Author Contributions
Conceptualization, Y.C. and Q.L.; data curation, Y.C. and X.Z.; formal analysis, Y.C.; investigation, X.Z. and Y.C.; methodology, visualization, Y.C., X.Z. and Q.L.; writing—original draft preparation, Y.C.; conceptualization, X.Z. and Q.L.; funding acquisition, X.Z. and Q.L.; supervision Y.C.; writing—review and editing, Y.C. and Q.L.; writing—review and editing, Y.C., X.Z. and Q.L.; funding acquisition, Y.C. and X.Z.; software, L.W. All authors have read and agreed to the published version of the manuscript.
Funding
This work was supported by the National Natural Science Foundation of China (31860039) to Q.L.
Institutional Review Board Statement
Not applicable.
Informed Consent Statement
Not applicable.
Data Availability Statement
The raw data supporting the conclusions of this article will be made available by the authors without undue reservation.
Acknowledgments
We deeply thank Qiaolan Liang for providing technical supports, and the High-Performance Computing Center of Gansu Agricultural University for providing computing resources.
Conflicts of Interest
The authors declare no conflict of interest.
References
- Basu, S.; Singh, K.; Singh, D.; Sahu, S.K.; Chakraborty, S. Role of viral suppressors governing asymmetric synergism between tomato-infecting be gomoviruses. Appl. Microbiol. Biotechnol. 2021, 105, 1107–1121. [Google Scholar] [CrossRef] [PubMed]
- Culver, J.N.; Padmanabhan, M.S. Virus-induced disease: Altering host physiology one interaction at a time. Annu. Rev. Phytopathol. 2007, 45, 221–243. [Google Scholar] [CrossRef]
- Bellah, H.; Seiler, N.F.; Croll, D. Divergent outcomes of direct conspecific pathogen strain interaction and plant co-infection suggest consequences for disease dynamics. Microbiol. Spectr. 2023, 11, e0444322. [Google Scholar] [CrossRef] [PubMed]
- Fajardo, T.V.M.; Peiró, A.; Pallás, V.; Sánchez-Navarro, J. Systemic transport of alfalfa mosaic virus can be mediated by the movement proteins of several viruses assigned to five genera of the 30K family. J. Gen. Virol. 2013, 94, 677–681. [Google Scholar] [CrossRef]
- Janeczko, A.; Dziurka, M.; Gullner, G.; Kocurek, M.; Rys, M.; Saja, D.; Skoczowski, A.; T’obi´as, I.; Kornas, A.; Barna, B. Comparative studies of compatible and incompatible pepper–Tobamovirus interactions and the evaluation of effects of 24-epibrassinolide. Photosynthetica 2018, 56, 763–775. [Google Scholar] [CrossRef]
- Crescenzi, A.; Viggiano, A.; Fanigliulo, A. Resistance breaking tomato spotted wilt virus isolates on resistant pepper varieties in Italy. Commun. Agric. Appl. Biol. Sci. 2013, 78, 609–612. [Google Scholar] [PubMed]
- Bhat, S.; Folimonova, S.Y.; Cole, A.B.; Ballard, K.D.; Lei, Z.; Watson, B.S.; Sumner, L.W.; Nelson, R.S. Influence of host chloroplast proteins on Tobacco mosaic virus accumulation and intercellular movement. Plant Physiol. 2013, 161, 134–147. [Google Scholar] [CrossRef]
- Else, M.A.; Janowiak, F.; Atkinson, C.J.; Jackson, M.B. Root signals and stomatal closure in relation to photosynthesis, chlorophyll a fluorescence and adventitious rooting of flooded tomato plants. Ann. Bot. 2009, 103, 313–323. [Google Scholar] [CrossRef]
- Hallik, L.; Niinemets, U.; Kull, O. Photosynthetic acclimation to light in woody and herbaceous species: A comparison of leaf structure, pigment content and chlorophyll fluorescence characteristics measured in the field. Plant Biol. 2012, 14, 88–99. [Google Scholar] [CrossRef]
- Guo, Z.; Zhang, T.; Chen, Z.; Niu, J.; Cui, X.; Mao, Y.; Hassan, M.U.; Kareem, H.A.; Xu, N.; Sui, X.; et al. Occurrence, distribution, and genetic diversity of alfalfa (Medicago sativa L.) viruses in four major alfalfa producing provinces of China. Front. Microbiol. 2022, 12, 771361. [Google Scholar] [CrossRef]
- Li, J.; Shang, Q.; Liu, Y.; Dai, W.; Li, X.; Wei, S.; Hu, G.; McNeill, M.R.; Ban, L. Occurrence, distribution, and transmission of alfalfa viruses in China. Viruses 2022, 14, 1519. [Google Scholar] [CrossRef] [PubMed]
- Tian, L.; Liang, Q.L.; Wei, L.X.; Chen, Y.E.; Cheng, S.F. Effects of Alfalfa Mosaic Virus (AMV) and White Clover Mosaic Virus (WCMV) Co-infection on Four Endogenous Hormones in Nicotiana benthamiana. Chin. J. Grassl. 2023, 45, 99–108. [Google Scholar]
- Piñeyro, M.J.; Albrecht, K.A.; Mondjana, A.M.; Grau, C.R. First Report of Alfalfa mosaic virus in Kura Clover (Trifolium amgibuum) in Wisconsin. Plant Dis. 2002, 86, 695–706. [Google Scholar] [CrossRef] [PubMed]
- Abdalla, O.A.; Ali, A. First Report of Alfalfa mosaic virus Associated with Severe Mosaic and Mottling of Pepper (Capsicum annuum) and White Clover (Trifolium repens) in Oklahoma. Plant Dis. 2012, 96, 1705. [Google Scholar] [CrossRef] [PubMed]
- Jones, R.A.C.; Congdon, B.S. Australian Cool-Season Pulse Seed-Borne Virus Research: 1. Alfalfa and Cucumber Mosaic Viruses and Less Important Viruses. Viruses 2024, 16, 144. [Google Scholar] [CrossRef] [PubMed]
- Chen, Y.E.; Liang, Q.L.; Wei, L.X.; Wang, D.; Tian, L.; Tong, F.Y.; Zhang, G.Y.; Cheng, S.F. Study on the epidemic factors of alfalfa mosaic virus and white clover mosaic virus co-infection Nicotiana benthamiana. Pratacultural Sci. 2023, 40, 90–100. [Google Scholar]
- Cheng, S.F.; Liang, Q.L.; Wei, L.X.; Sang, X.W.; Jiang, Y.L. Detection of alfalfa mosaic virus and white clover mosaic virus in alfalfa and their effects on physiological and biochemical characteristics of alfalfa plants. Acta Prataculturae Sin. 2020, 29, 140–149. [Google Scholar]
- Jang, C.; Seo, E.Y.; Nam, J.; Bae, H.; Gim, Y.G.; Kim, H.G.; Cho, I.S.; Lee, Z.W.; Bauchan, G.R.; Hammond, J.; et al. Insights into Alternanthera mosaic virus TGB3 functions: Interactions with Nicotiana benthamiana PsbO correlate with chloroplast vesiculation and veinal necrosis caused by TGB3 over-expression. Front. Plant Sci. 2013, 4, 5–16. [Google Scholar] [CrossRef] [PubMed]
- Liang, Q.L.; Wei, L.X.; Xu, B.L.; Calderón-Urrea, A.; Xiang, D. Study of viruses co-infecting white clover (Trifolium repens) in China. J. Integr. Agric. 2017, 16, 1990–1998. [Google Scholar] [CrossRef]
- Livak, K.J.; Wills, Q.F.; Tipping, A.J.; Datta, K.; Mittal, R.; Goldson, A.J.; Sexton, D.W.; Holmes, C.C. Methods for qPCR gene expression profiling applied to 1440 lymphoblastoid single cells. Methods 2013, 59, 71–79. [Google Scholar] [CrossRef]
- Song, X.S.; Wang, Y.J.; Mao, W.H.; Shi, K.; Zhou, Y.H.; Nogués, S.; Yu, J.Q. Effects of cucumber mosaic virus infection on electron transport and antioxidant system in chloroplasts and mitochondria of cucumber and tomato leaves. Physiol. Plant. 2009, 135, 246–257. [Google Scholar] [CrossRef] [PubMed]
- Tobar, M.; Fiore, N.; Pérez-Donoso, A.G.; León, R.; Rosales, I.M.; Gambardella, M. Divergent molecular and growth responses of young “Cabernet Sauvignon” (Vitis vinifera) plants to simple and mixed infections with Grapevine rupestris stem pitting-associated virus. Hortic. Res. 2020, 7, 2–14. [Google Scholar] [CrossRef] [PubMed]
- Vitti, A.; Pellegrini, E.; Nali, C.; Lovelli, S.; Sofo, A.; Valerio, M.; Scopa, A.; Nuzzac-i, M. Trichoderma harzianum T-22 Induces Systemic Resistance in Tomato Infected by Cucumber mosaic virus. Front. Plant Sci. 2016, 7, 1520. [Google Scholar] [CrossRef] [PubMed]
- Farooq, T.; Liu, D.; Zhou, X.; Yang, Q. Tomato Yellow Leaf Curl China Virus Impairs Photosynthesis in the Infected Nicotiana benthamiana with βC1 as an Aggravating Factor. Plant Pathol. J. 2019, 35, 521–529. [Google Scholar] [CrossRef] [PubMed]
- Niu, E.; Liu, H.; Zhou, H.; Luo, L.; Wu, Y.; Andika, I.B.; Sun, L. Autophagy Inhibits Intercellular Transport of Citrus Leaf Blotch Virus by Targeting Viral Movement Protein. Viruses 2021, 13, 2189. [Google Scholar] [CrossRef] [PubMed]
- Shin, J.C.; Kim, M.K.; Kwak, H.R.; Choi, H.S.; Kim, J.S.; Park, C.Y.; Cha, B.J. First report of clover yellow vein virus on glycine max in Korea. Plant Dis. 2014, 98, 1283. [Google Scholar] [CrossRef] [PubMed]
- Trębicki, P.; Dáder, B.; Vassiliadis, S.; Fereres, A. Insect-plant-pathogen interactions as shaped by future climate: Effects on biology, distribution, and implications for agriculture. Insect Sci. 2017, 24, 975–989. [Google Scholar] [CrossRef] [PubMed]
- Wang, J.; Zhao, G.Q.; Chai, J.K.; Wang, M.M.; Jia, X.J.; Guo, Z.F.; Sun, L.L.; Nie, X.M. Effect of barley yellow dwarf virus infection on photosynthesis and chlorophyll fluorescence parameters of oat. Acta Agrestia Sin. 2020, 28, 923–931. [Google Scholar]
- Tseliou, E.; Chondrogiannis, C.; Kalachanis, D.; Goudoudaki, S.; Manoussopoulos, Y.; Grammatikopoulos, G. Integration of biophysical photosynthetic parameters into one photochemical index for early detection of tobacco mosaic virus infection in pepper plants. J. Plant Physiol. 2021, 267, 153542. [Google Scholar] [CrossRef]
- Li, D.X.; Yuan, H.Y.; Guo, Y.X.; Mu, F.; Gong, X.Y.; Zhang, M. Mixture solution soaking extraction efficiencies of chlorophyll from maize. J. Maize Sci. 2006, 14, 117–119. [Google Scholar]
- Lehto, K.; Tikkanen, M.; Hiriart, J.B.; Paakkarinen, V.; Aro, E.M. Depletion of the photosystem II core complex in mature tobacco leaves infected by the flavum strain of tobacco mosaic virus. Mol. Plant-Microbe Interact. 2003, 16, 1135–1144. [Google Scholar] [CrossRef] [PubMed]
- Medina, C.A.; Kaur, H.; Ray, I.; Yu, L.X. Strategies to increase prediction accuracy in genomic selection of complex traits in Alfalfa (Medicago sativa L.). Cells 2021, 10, 3372. [Google Scholar] [CrossRef]
- Otulak, K.; Chouda, M.; Bujarski, J.; Garbaczewska, G. The evidence of tobacco rattle virus impact on host plant organelles ultrastructure. Micron 2015, 70, 7–20. [Google Scholar] [CrossRef]
- Sperdouli, I.; Moustakas, M. A better energy allocation of absorbed light in photosystem II and less photooxidative damage contribute to acclimation of Arabidopsis thaliana young leaves to water deficit. J. Plant Physiol. 2014, 171, 587–593. [Google Scholar] [CrossRef]
- Torrance, L.; Talianksy, M.E. Potato virus Y emergence and evolution from the andes of south america to become a major destructive pathogen of potato and other solanaceous crops worldwide. Viruses 2020, 12, 1430. [Google Scholar] [CrossRef] [PubMed]
- Torres, R.; Romero, J.M.; Lagorio, M.G. Effects of sub-optimal illumination in plants. Comprehensive chlorophyll fluorescence analysis. J. Photochem. Photobiol. B Biol. 2021, 218, 112182. [Google Scholar] [CrossRef]
- Wilhelmová, N.; Procházková, D.; Sindelarova, M.; Sindelar, L. Photosynthesis in leaves of Nicotiana tabacum L. infected with tobacco mosaic virus. Photosynthetica 2005, 43, 597–602. [Google Scholar] [CrossRef]
- Wall, S.; Vialet-Chabrand, S.; Davey, P.; Van Rie, J.; Galle, A.; Cockram, J.; Lawson, T. Stomata on the abaxial and adaxial leaf surfaces contribute differently to leaf gas exchange and photosynthesis in wheat. New Phytol. 2022, 235, 1743–1756. [Google Scholar] [CrossRef] [PubMed]
- Zhao, J.P.; Zhang, X.; Hong, Y.G.; Liu, Y.L. Chloroplast in Plant-Virus Interaction. Front. Microbiol. 2016, 59, 71565. [Google Scholar] [CrossRef]
- Zanini, A.A.; Liliana, D.F.; Luna, D.F.; Paccioretti, P.; Collavino, A.; Rodriguez, M.S. Cassava common mosaic virus infection causes alterations in chloroplast ultrastructure, function, and carbohydrate metabolism of cassava plants. Plant Pathol. 2020, 70, 195–205. [Google Scholar] [CrossRef]
- Tatineni, S.; Alexander, J.; Qu, F. Differential synergistic interactions among four different wheat infecting viruses. Front. Microbiol. 2022, 12, 800318. [Google Scholar] [CrossRef] [PubMed]
- Sakoda, K.; Yamori, W.; Groszmann, M.; Evans, J.R. Stomatal, mesophyll conductance, and biochemical limitations to photosynthesis during induction. Plant Physiol. 2021, 185, 146–160. [Google Scholar] [CrossRef] [PubMed]
- Zhang, X.; Liu, W.; Lv, Y.; Li, T.; Tang, J.; Yang, X.; Bai, J.; Jin, X.; Zhou, H. Effects of drought stress during critical periods on the photosynthetic characteristics and production performance of Naked oat (Avena nuda L.). Sci. Rep. 2022, 12, 11199. [Google Scholar] [CrossRef] [PubMed]
- Yu, L.; Guo, S.R.; Zhu, W.M.; Yan, J.; Hei, Y.X. Effects of tomato yellow leaf curl virus on photosynthetic characteristics and chloroplast ultra-structure of the tomato leaves. Acta Bot. Boreali-Occident. Sin. 2011, 31, 1355–1359. [Google Scholar]
- Pradhan, G.P.; Xue, Q.; Jessup, K.E.; Hao, B.; Price, J.A.; Rush, C.M. Physiological responses of hard red winter wheat to infection by wheat streak mosaic virus. Phytopathology 2015, 105, 621–627. [Google Scholar] [CrossRef] [PubMed]
- Ontiveros, I.; López-Moya, J.J.; Díaz-Pendón, J.A. Coinfection of tomato plants with tomato yellow leaf curl virus and tomato chlorosis virus affects the interaction with host and white flies. Phytopathology 2022, 112, 944–952. [Google Scholar] [CrossRef]
- Razi, K.; Muneer, S. Drought stress-induced physiological mechanisms, signaling pathways and molecular response of chloroplasts in common vegetable crops. Crit. Rev. Biotechnol. 2021, 41, 669–691. [Google Scholar] [CrossRef]

Disclaimer/Publisher’s Note: The statements, opinions and data contained in all publications are solely those of the individual author(s) and contributor(s) and not of MDPI and/or the editor(s). MDPI and/or the editor(s) disclaim responsibility for any injury to people or property resulting from any ideas, methods, instructions or products referred to in the content. |
© 2024 by the authors. Licensee MDPI, Basel, Switzerland. This article is an open access article distributed under the terms and conditions of the Creative Commons Attribution (CC BY) license (https://creativecommons.org/licenses/by/4.0/).