2.1. Monomeric ASBVd (+) and (−) RNAs Containing the Full Hammerhead Ribozyme, Exhibit Different Self-Cleavage Time Course Experiments
To evaluate the catalytic activity of monomeric ASBVd (+) and (−) encompassing the full hammerhead ribozyme (HHR), self-cleavage time course experiments of mASBVd-HHR (+) and mASBVd-HHR (−) RNAs were performed as indicated in the Experimental Section. Similar profiles of self-cleavage were observed whether 10 mM sodium cacodylate (pH 7.2) or 45 mM Tris-HCl (pH 7.5) was used as a buffer. With 20 mM MgCl
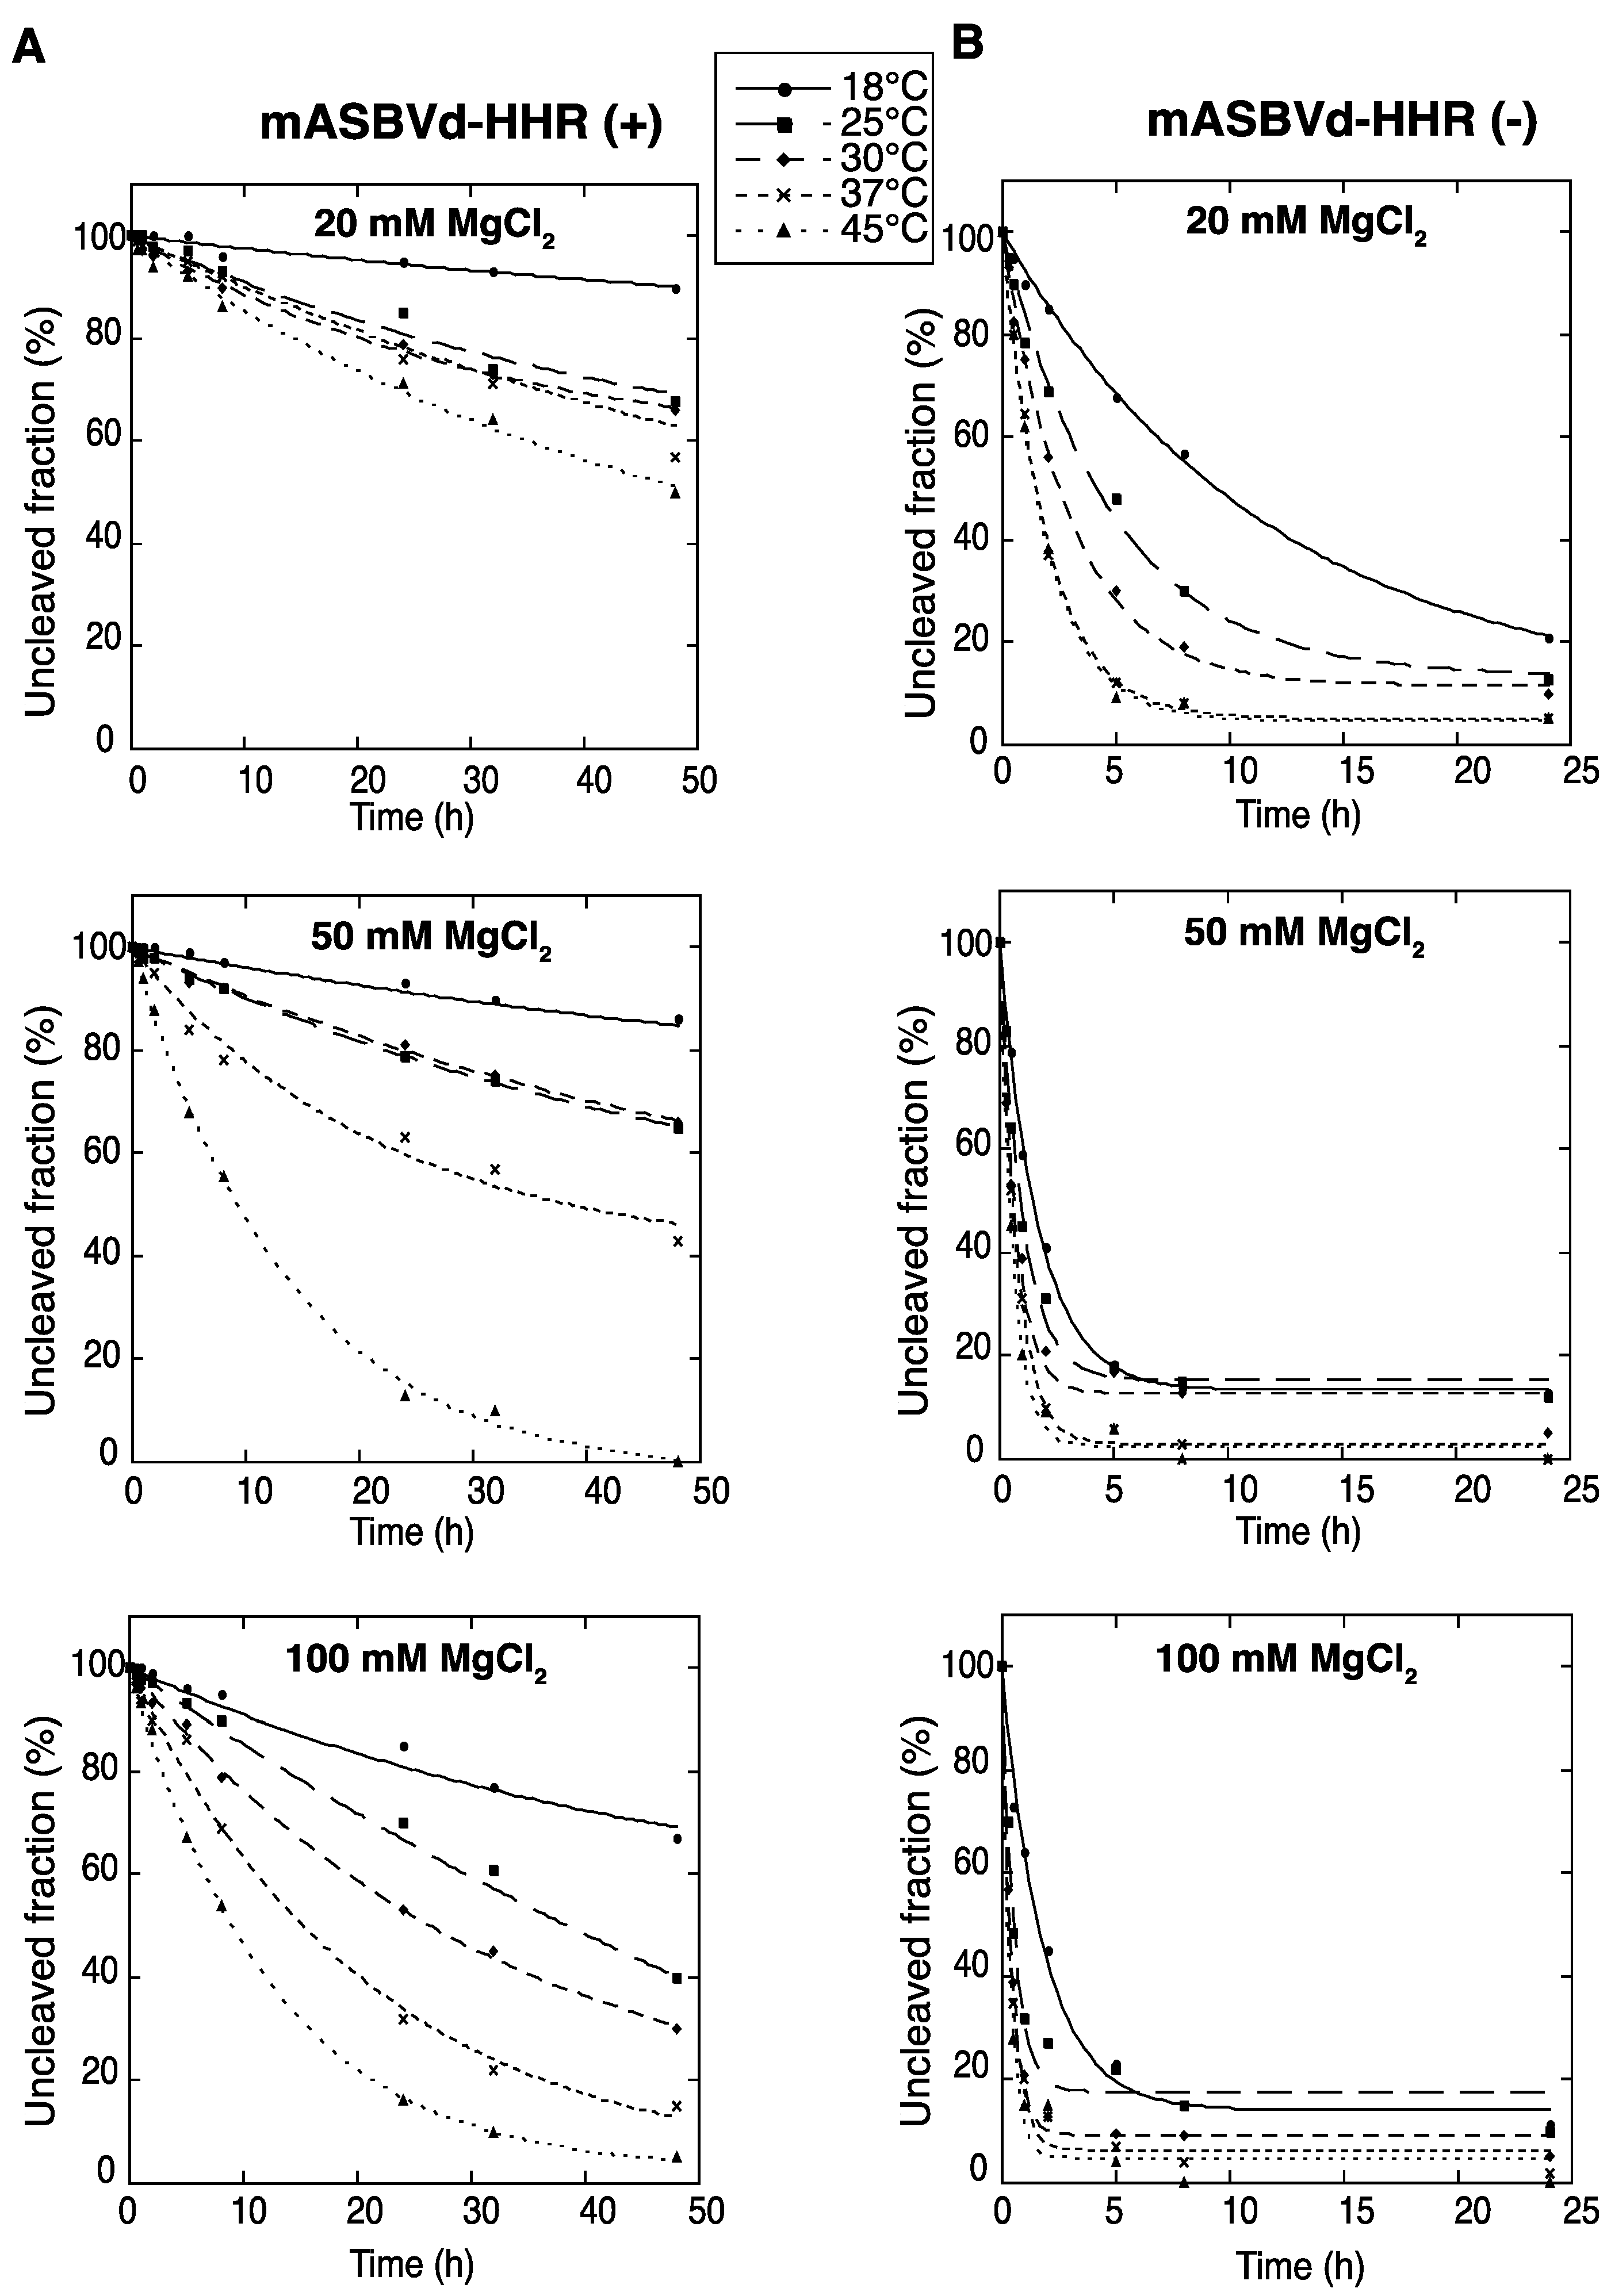
2, mASBVd-HHR (+) remained essentially intact (95%) after 5 hours of incubation at 37 °C, whereas 88% of the mASBVd-HHR (−) was cleaved under the same conditions. The fraction of uncleaved mASBVd-HHR (+) molecules reached 20% at 50 mM MgCl
2, only at 45 °C and after 20 hours of incubation (
Figure 1A, note that some RNA degradation was observed after 24 hours in 100 mM MgCl
2 at 45 °C). In contrast, similar self-cleavage time course experiments were observed for the mASBVd-HHR (−) at 50 mM and 100 mM MgCl
2 at each temperature, with the fraction of uncleaved molecules at the end-point of the reaction being less than 20% in all cases (
Figure 1B). Altogether, these results indicate that the majority of monomeric ASBVd-HHR (+) molecules are not able to adopt a catalytically active conformation compared to mASBVd-HHR (−) RNAs. This difference in the self-cleavage characteristic of (+) and (−) monomeric RNA transcripts is consistent with the difference previously observed with the dimeric transcripts [
17]. It is worth noting that it has been shown that self-cleavage of the hammerheads of CChMVd and PLMVd as well as of satellite viruses of
Tobacco ringspot virus (sTRSV) and
Chicory yellow mottle virus (sCYMV) were greatly favored by tertiary interactions between the peripheral regions that stabilize the active conformation [
23,
24]. Similarly, the significant differences observed in catalytic activities for the (+) and (−) polarities of ASBVd could at least partially originate from interactions with sequence elements outside of the conserved catalytic core.
Figure 1.
Self-cleavage kinetics of purified monomeric ASBVd-HHR (+) (
A) and ASBVd-HHR (−) (
B) transcripts. Self-cleavage reactions were carried out at 18 °C, 25 °C, 30 °C, 37 °C and 45 °C in buffers containing either 20 mM, 50 mM or 100 mM MgCl
2. Aliquots were removed at different time up to 48 h for ASBVd (+) (panels
A) and 24 h for ASBVd (−) (panels
B), quenched with an excess of stop solution and separated on 10% polyacrylamide gels. After ethidium bromide staining, the percentage of uncleaved molecules was quantified using the ImageJ Software [
25]. Quantitative data were fitted to multiexponential curves with the KaleidaGraph program (Synergy Software, Reading, PA, USA).
2.2. TGGE and UV Melting Analyses of the (+) and (−) Polarities of ASBVd RNAs
Both polarities of monomeric ASBVd transcripts were analyzed by temperature gradient gel electrophoresis analysis (TGGE), which allows the detection of co-existing alternative structures for a single type of RNA, over a range of temperatures (for review see [
26]). It is important to note that for these analyses, purified unit-length transcripts of both polarities of ASBVd were used,
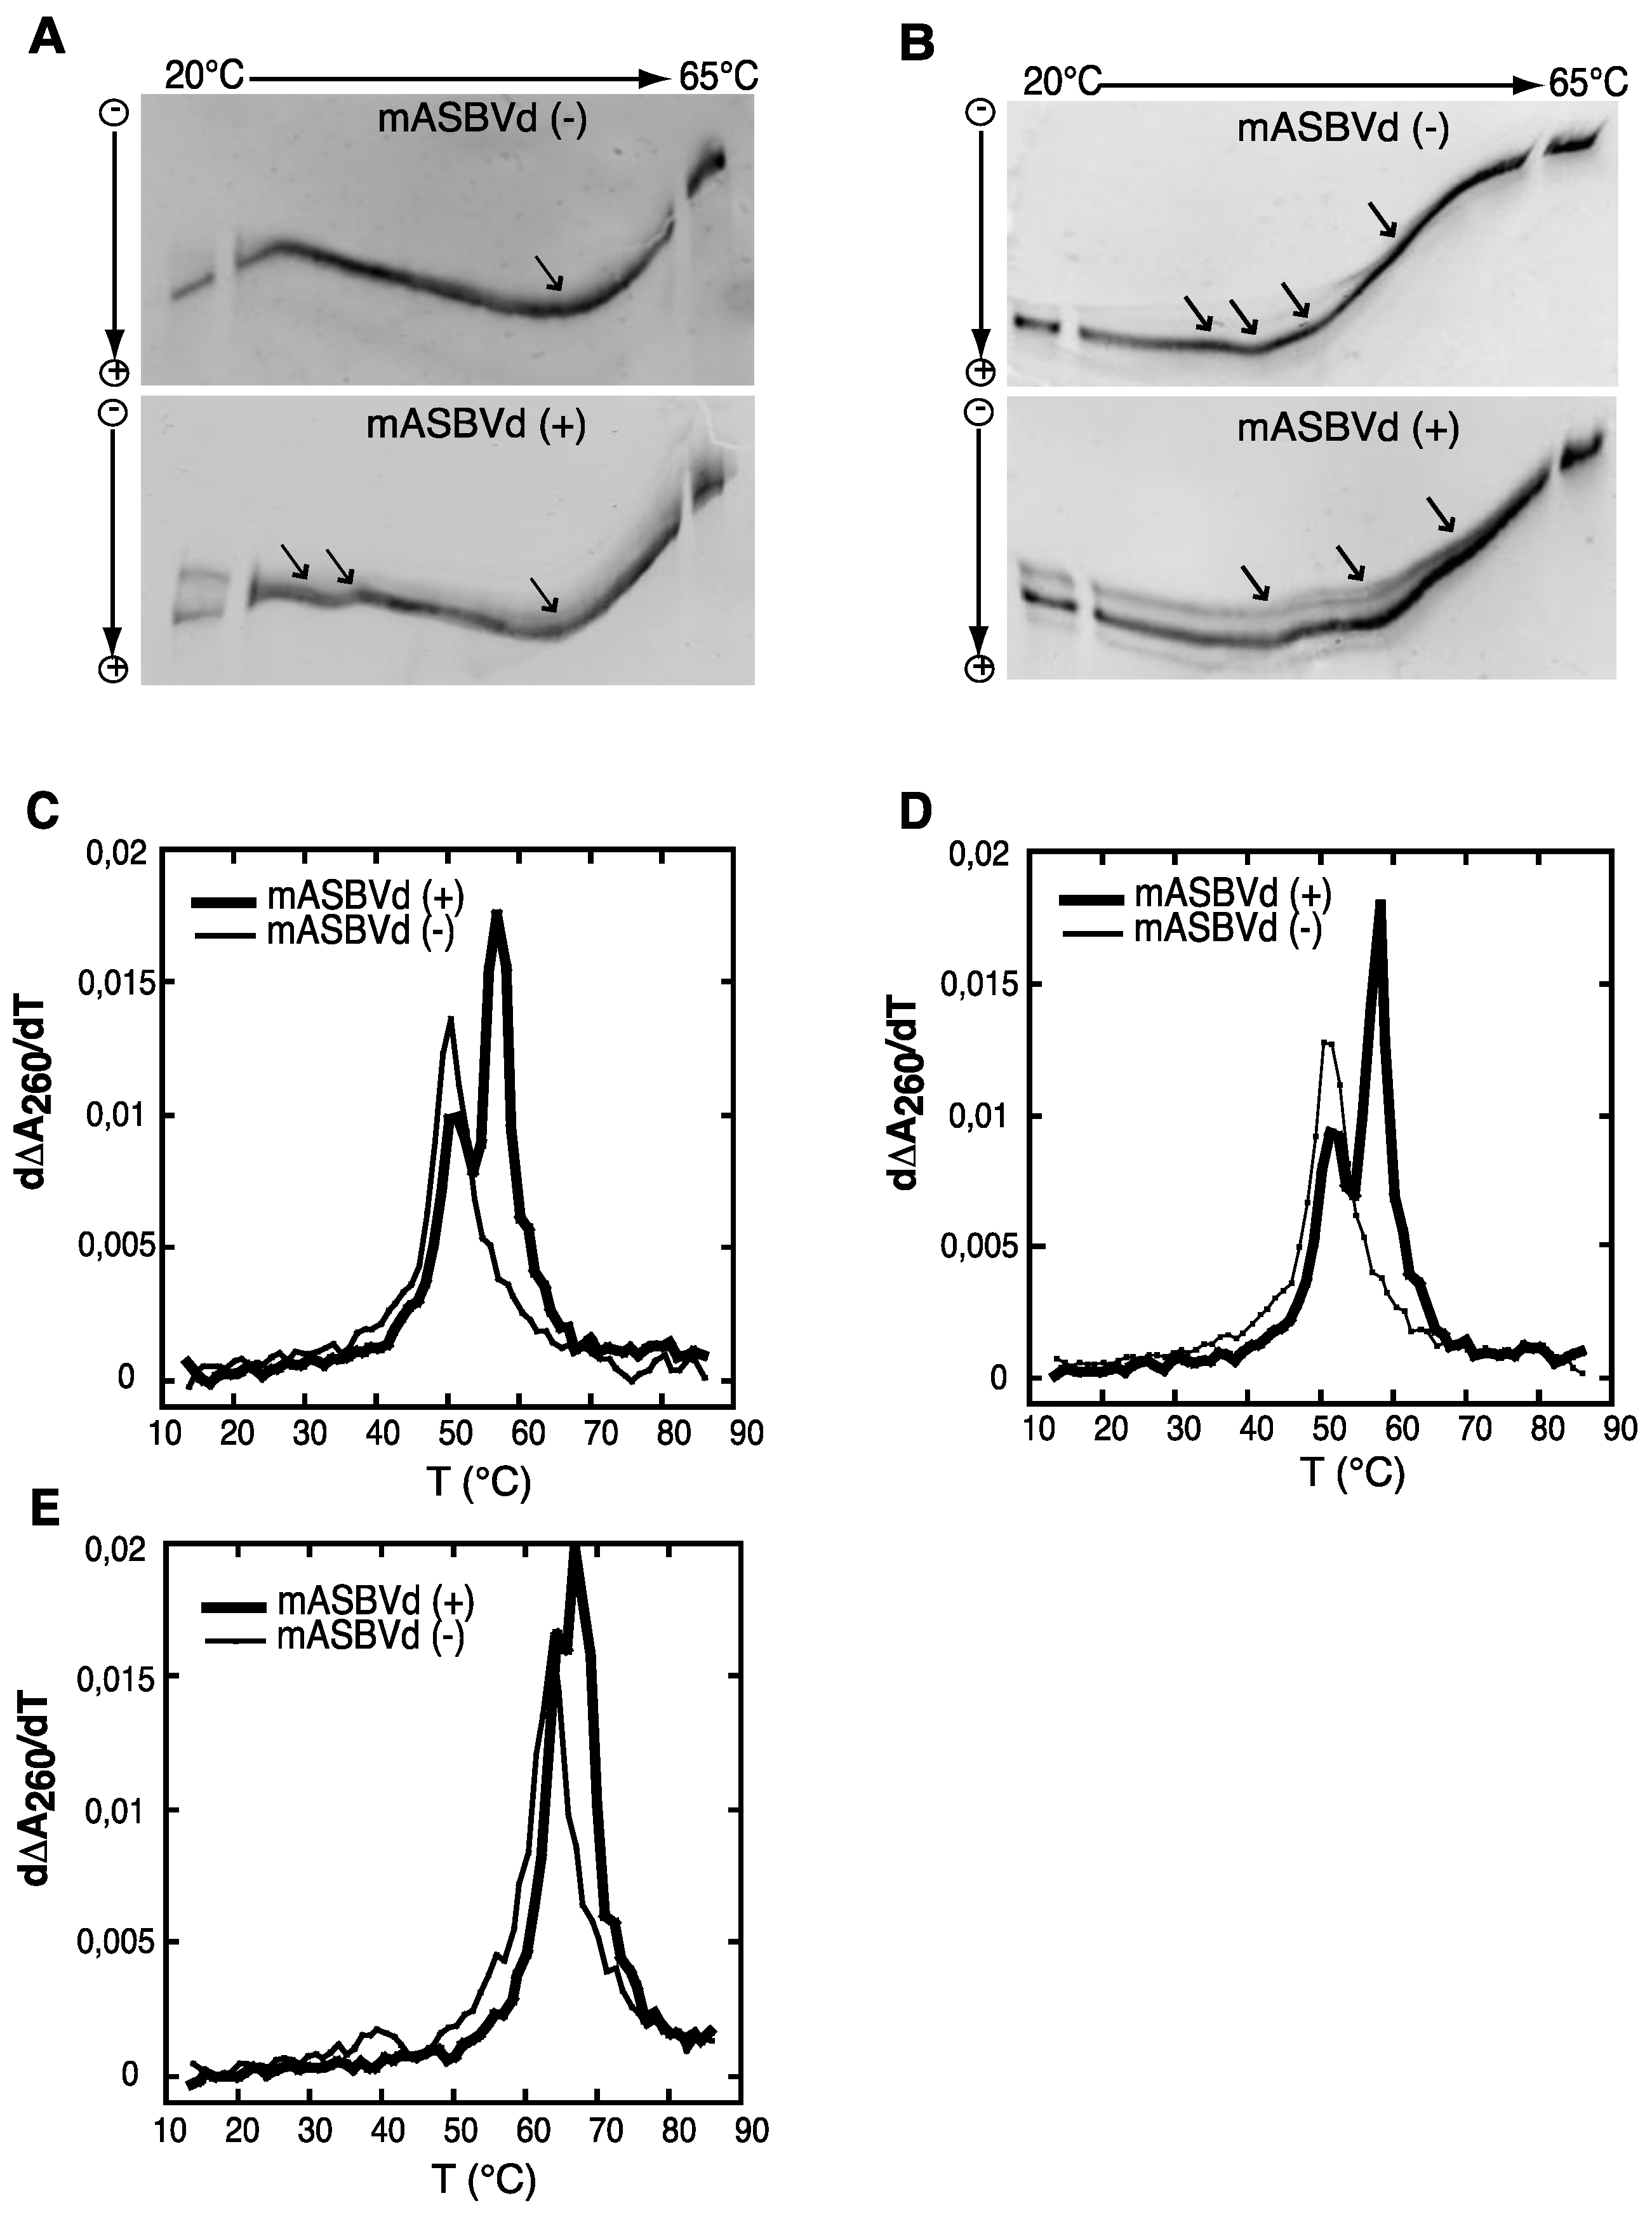
i.e., similar to monomeric species obtained after self-cleavage of multimeric forms and consequently different from the one used previously for the self-cleavage time course experiments (see Experimental Section). The TGGE denaturation profiles obtained for mASBVd (+) and mASBVd (−) transcripts, with a linear temperature gradient between 20 °C and 65 °C in the gel, are shown in
Figure 2A. Monomeric (−) strand transcripts exhibited one transition at about 20 °C, and an upper temperature transition at about 50 °C. A similar transition at about 50 °C was observed for monomeric (+) strand transcripts in addition to transitions between 29 °C and 37 °C. Moreover, distinct co-existing structures could be detected especially at the lowest temperature of the gradient. Thus, mASBVd (+) transcripts adopt alternative folds at lower temperatures whereas only one major electrophoretic profile is observed for the mASBVd (−) transcripts at all temperatures.
In order to allow the generation of higher-order structures including tertiary interactions, mASBVd transcripts of both polarities were subjected to TGGE in buffer containing 20 μM magnesium acetate (
Figure 2B). Under these conditions, mASBVd (−) transcripts migrated as a dominant single band with some weak transitions between 32 °C and 43 °C and an additional faint transition at about 51 °C. Addition of magnesium modified the transition at the lower temperatures, however, no important modifications could be observed concerning the second transition. This is consistent with what has been previously observed when PLMVd transcripts were subjected to TGGE in the same range of magnesium concentration [
12]. More importantly, the TGGE profile indicated the presence of only one major conformation for mASBVd (−) transcripts that undergoes denaturation in successive transitions in the presence of magnesium. On the other hand, in the TGGE profile of mASBVd (+) transcripts, one major band and at least two additional minor bands were distinguished which present three major transitions at about 42 °C, 50 °C and 54 °C, suggesting the presence of more than one conformation. Interestingly, the co-existing structures show very similar denaturation profiles, suggesting that although they are different, these conformers share common features.
Structures were also investigated by analyzing the melting behavior of mASBVd (+) and (−) transcripts using UV-absorbance measurements under different conditions. UV-melting analyze has been shown to be a useful method to study the extensive intramolecular self-complementarity of viroids by characterizing their thermodynamic properties and structural transitions [
6]. The first derivative of the melting curve (dΔA
260/dT) plotted
versus temperature is shown in
Figure 2C,D,E. For the monomeric transcripts of (−) polarity, a major unfolding transition gave rise to a single main peak at about 51 °C in buffer containing 150 mM KCl and 10 mM sodium cacodylate (pH 7.2) (
Figure 2C). The narrowness of the transition suggests a cooperative process. On the other hand, monomeric transcripts of (+) polarity exhibited an additional transition at about 58 °C, overlapping the first transition and corresponding to the main peak (
Figure 2C). This observation suggests either the presence of another RNA population with a more stable folding and/or the successive denaturations of distinct regions in the mASBVd (+) transcripts. Since Mg
2+ is well known to influence RNA tertiary structure, its presence should result in modifying the melting profiles. However, similar melting transitions were obtained when the experiments were repeated with addition of 100 μM MgCl
2 (
Figure 2D). Under those conditions, the melting behaviors of mASBVd (+) and (−) transcripts did not seem to be influenced by Mg
2+ concentration, showing that no tertiary interactions could be detected by this analysis. When the same experiments were performed with higher salt concentration (1 M NaCl) (
Figure 2E), mASBVd (+) transcript exhibited only one major peak at about 68 °C that almost completely overlaps a minor peak at 66 °C. These observations strongly suggest that both peaks correspond to secondary structures stabilized under such conditions.
Figure 2.
Temperature gradient gel electrophoresis (TGGE) and melting curves of mASBVd (+) and mASBVd (−) transcripts. (A) TGGE analysis performed by native 8% PAGE in 0.2× TBE buffer. (B) TGGE analysis performed by native 8% PAGE in 0.2× TB buffer containing 20 μM magnesium acetate. Migration was monitored between 20 °C and 65 °C. The arrows denote the transition temperatures. Derivative absorbance melting profiles were determined either in 150 mM KCl and 10 mM sodium cacodylate (pH 7.2) (C) or with, in addition, 100 μM MgCl2 (D) or 1 M NaCl (E). The first derivative profiles (d∆A260/dT) are shown with a thick curve for mASBVd (+) and a thin curve for mASBVd (−).
The analysis of RNA transcripts by TGGE and UV melting curves suggests that one conformation of the mASBVd (+) is thermodynamically more stable than the mASBVd (−) transcripts. Altogether, the results show that monomeric (−) and (+) transcripts exhibit different thermodynamic properties. Under different conditions, the (−) strands behave as expected for a population of molecules dominated by a major single conformation. In contrast, the (+) polarity strands seem to present either two co-existing structures or a single structure with two distinct fusion domains. TGGE experiments suggest that this rather corresponds to alternative conformers that are not necessarily detected with optical melting curve technique in which the resultant of the superimposition of all curves is observed.
2.3. SHAPE Analysis Suggests the Existence of a Kissing-Loop Interaction in the (−) Strands
mASBVd (+) and mASBVd (−) RNA species were first analyzed using denaturing and native gel analyses. After heat denaturation, RNA molecules were separated on 8% denaturing polyacrylamide gel. As expected, both strands showed the same mobility under denaturing conditions confirming a similar molecular weight (
Figure 3A). Indeed, the length of mASBVd (+) and mASBVd (−) strands are different by only two nt, since two guanosines have been added at the 5' terminus of mASBVd (+) to promote efficient transcription from the T7 promoter. In addition, (+) and (−) mASBVd strands were analyzed on non-denaturing 8% polyacrylamide gels (
Figure 3B). Under such conditions, both the molecular weight and structure influenced the electrophoretic mobility of the RNA molecules. Before loading, the RNAs were heat denatured, and then slowly renatured in the presence of 150 mM KCl to allow them to fold into their most stable native structure. A significant difference in migration between the two strands was observed (
Figure 3B, NB: the same migration profiles were observed upon renaturation in either 150 mM NaCl buffer or sterile water). Migration of mASBVd (+) is faster than mASBVd (−) suggesting that the monomeric (+) strands fold into a more compact secondary structure than the monomeric (−) strands. Similar observations have been described for the PLMVd (+) and (−) polarities; the two strands were subsequently shown to fold into different structures [
12]. Then, both RNA samples were run on native 8% polyacrylamide gels using TB buffer with 10 μM magnesium acetate (
Figure 3C). Under these conditions, no difference of migration could be detected between the major forms of mASBVd (+) and (−). Interestingly, two low intensity bands were also visible, above and below the major band of mASBVd (+) confirming the presence of multiple conformations, as seen in TGGE (
Figure 2B).
The structures of mASBVd (+) and mASBVd (−) RNA species were then probed using 1-methyl-7-nitroisatoic anhydride (1M7) in the presence or absence of Mg
2+ (see Experimental Section and [
27] for details on SHAPE). The modification site and intensity were determined as 1M7 dependent reverse transcription (RT) stops. Recently, this relatively new technique, that investigates both RNA structures and dynamics at single-nucleotide resolution, has been used to characterize the structure of the PLMVd as well as five members of the family
Pospiviroidae [
14,
28].
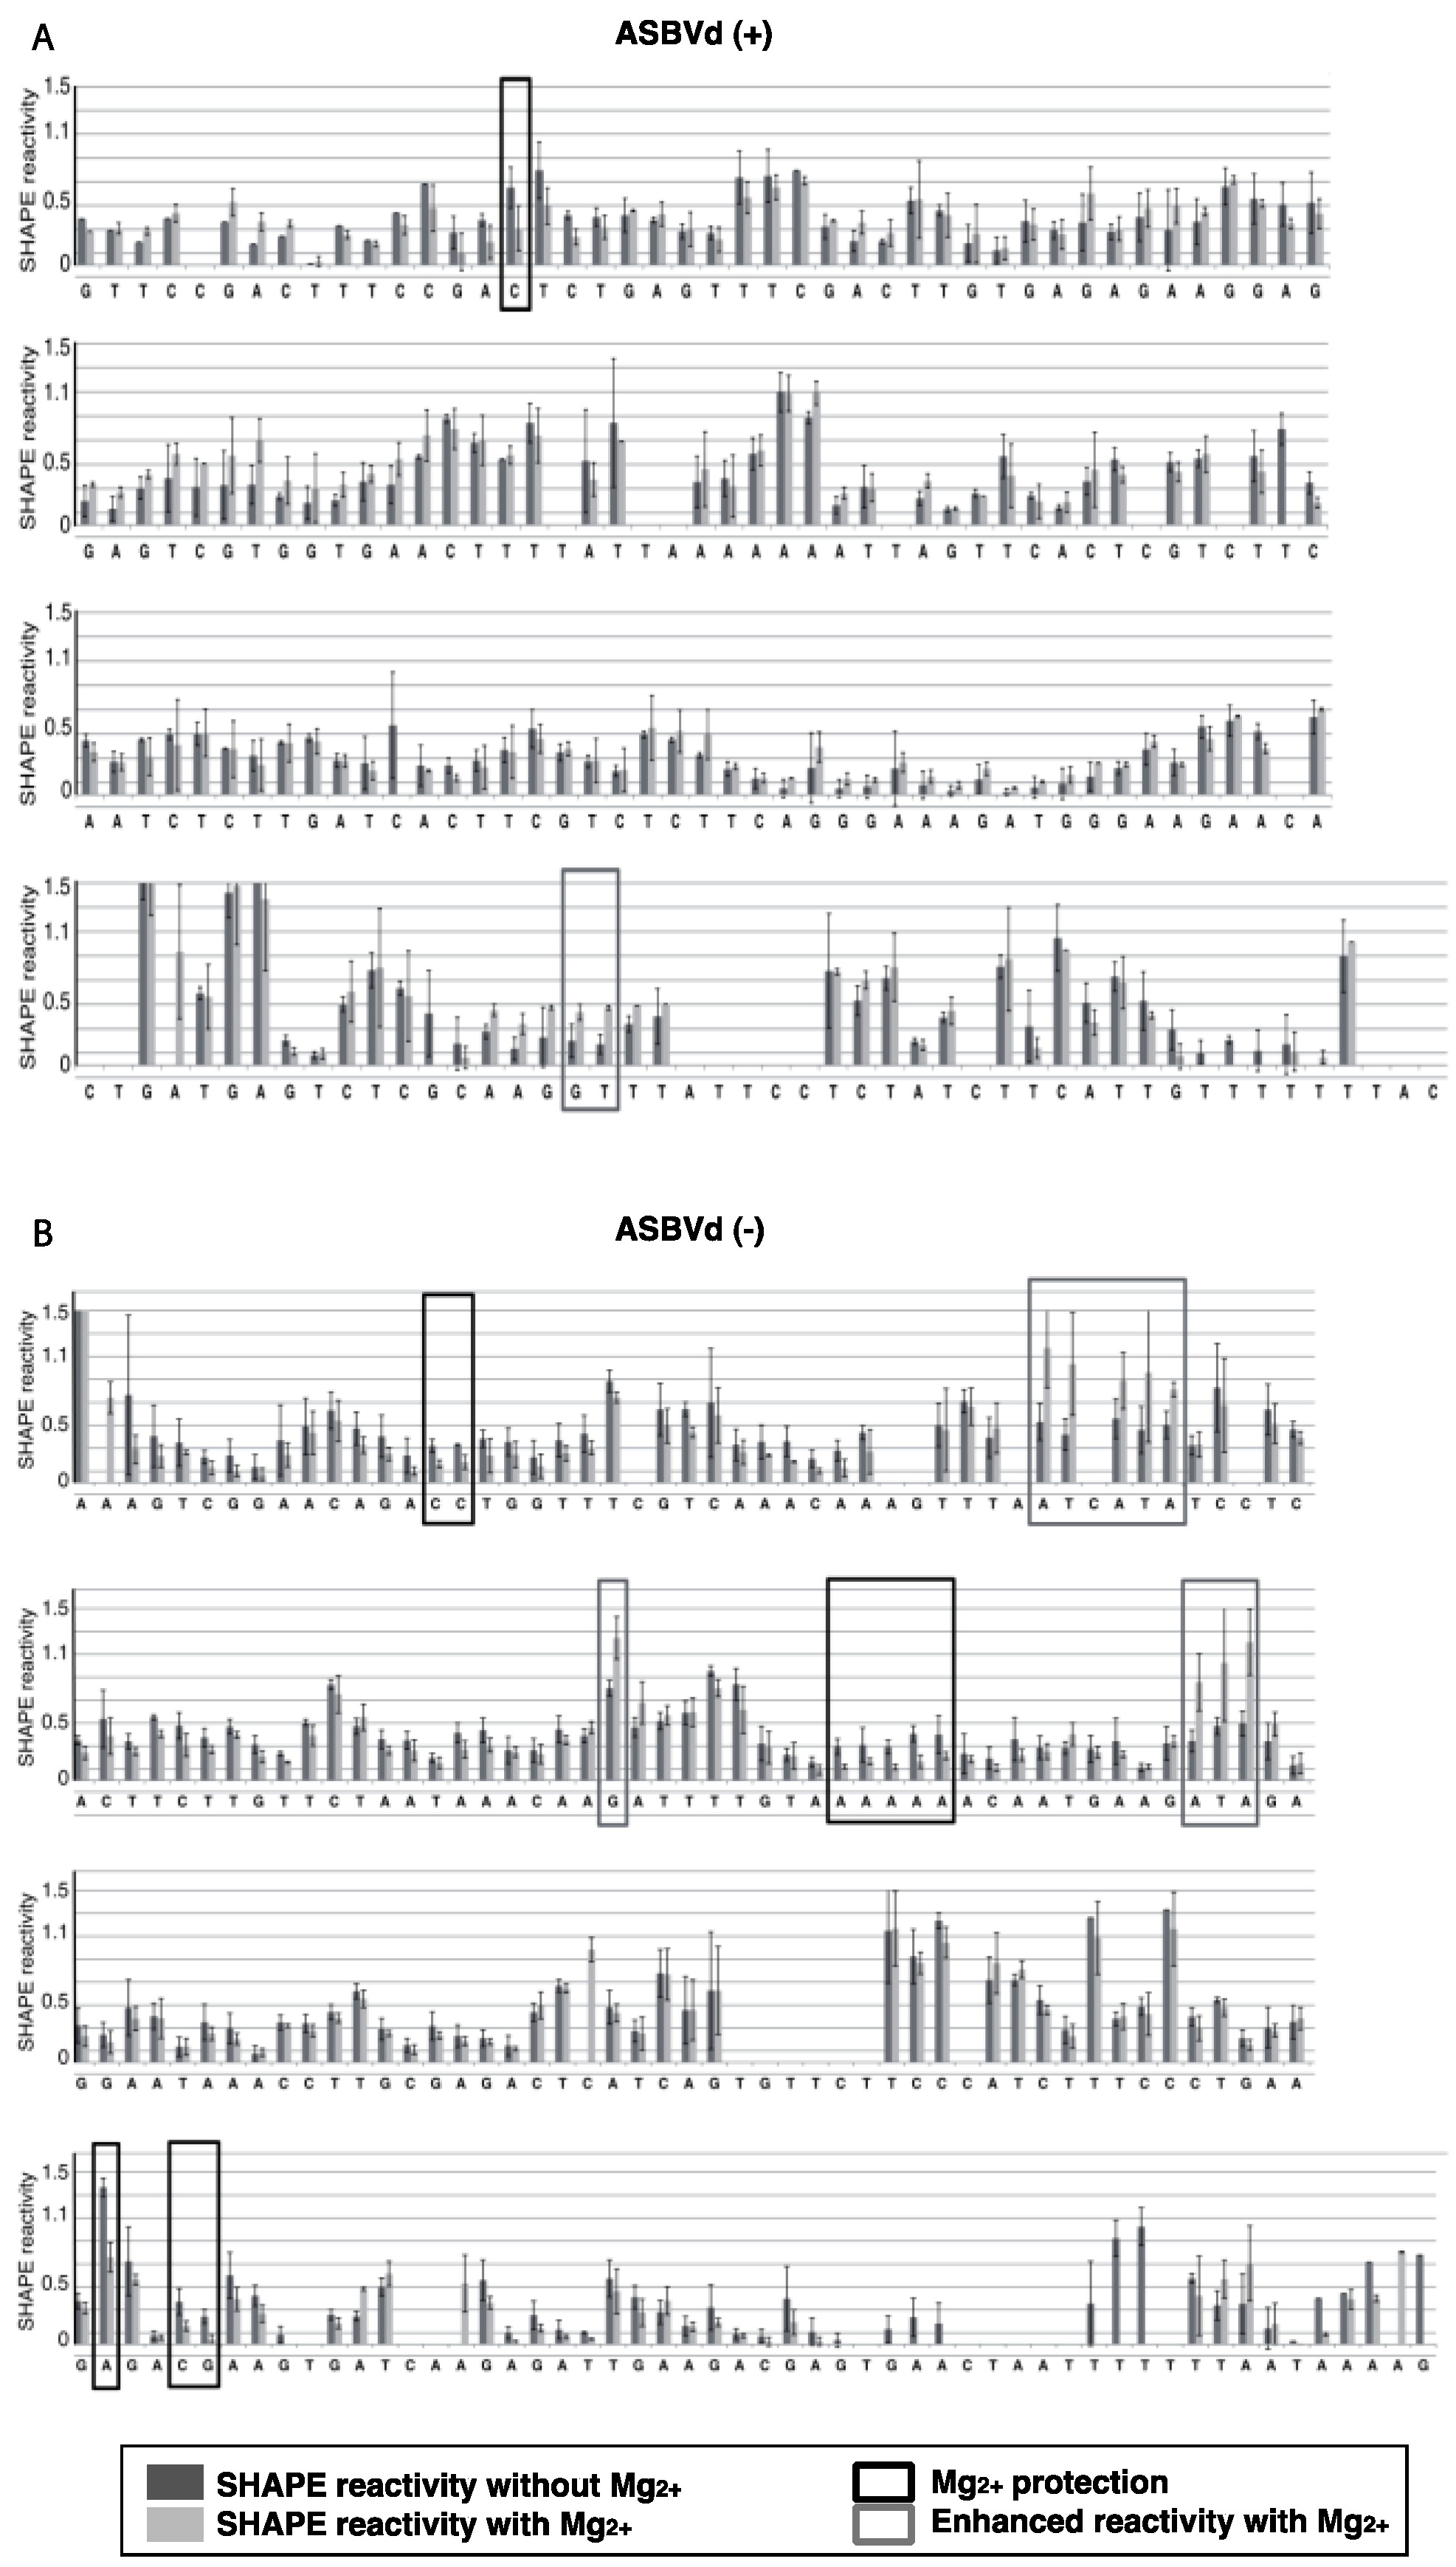
The results were analyzed with ShapeFinder [
29] (
Appendix Figure A1), the significance of the differences observed in the presence or absence of Mg
2+ was established using a bilateral student test (
p < 0.05). RNA secondary structure models were first built with the help of the RNA structure software [
30], using as constraints the SHAPE values obtained in absence of Mg
2+. These models were then evaluated in the light of the probing pattern observed in presence of magnesium, and the possibility of postulating tertiary contact in this context was examined.
Figure 3.
Electrophoretic mobility of mASBVd RNAs. The mASBVd (+) and mASBVd (−) transcripts were separated on 8% PAGE gels in 1× TBE buffer under denaturing (A) and native (B) conditions. The RiboRulerTM low range RNA ladder (Fermentas, Thermo Fisher Scientific Inc., Waltham, MA, USA) was loaded in parallel with mASBVd (+) and (−) into the denaturing gel (A). (C) RNA transcripts were analyzed on 8% PAGE native gel in 1× TB buffer containing 10 μM magnesium acetate.
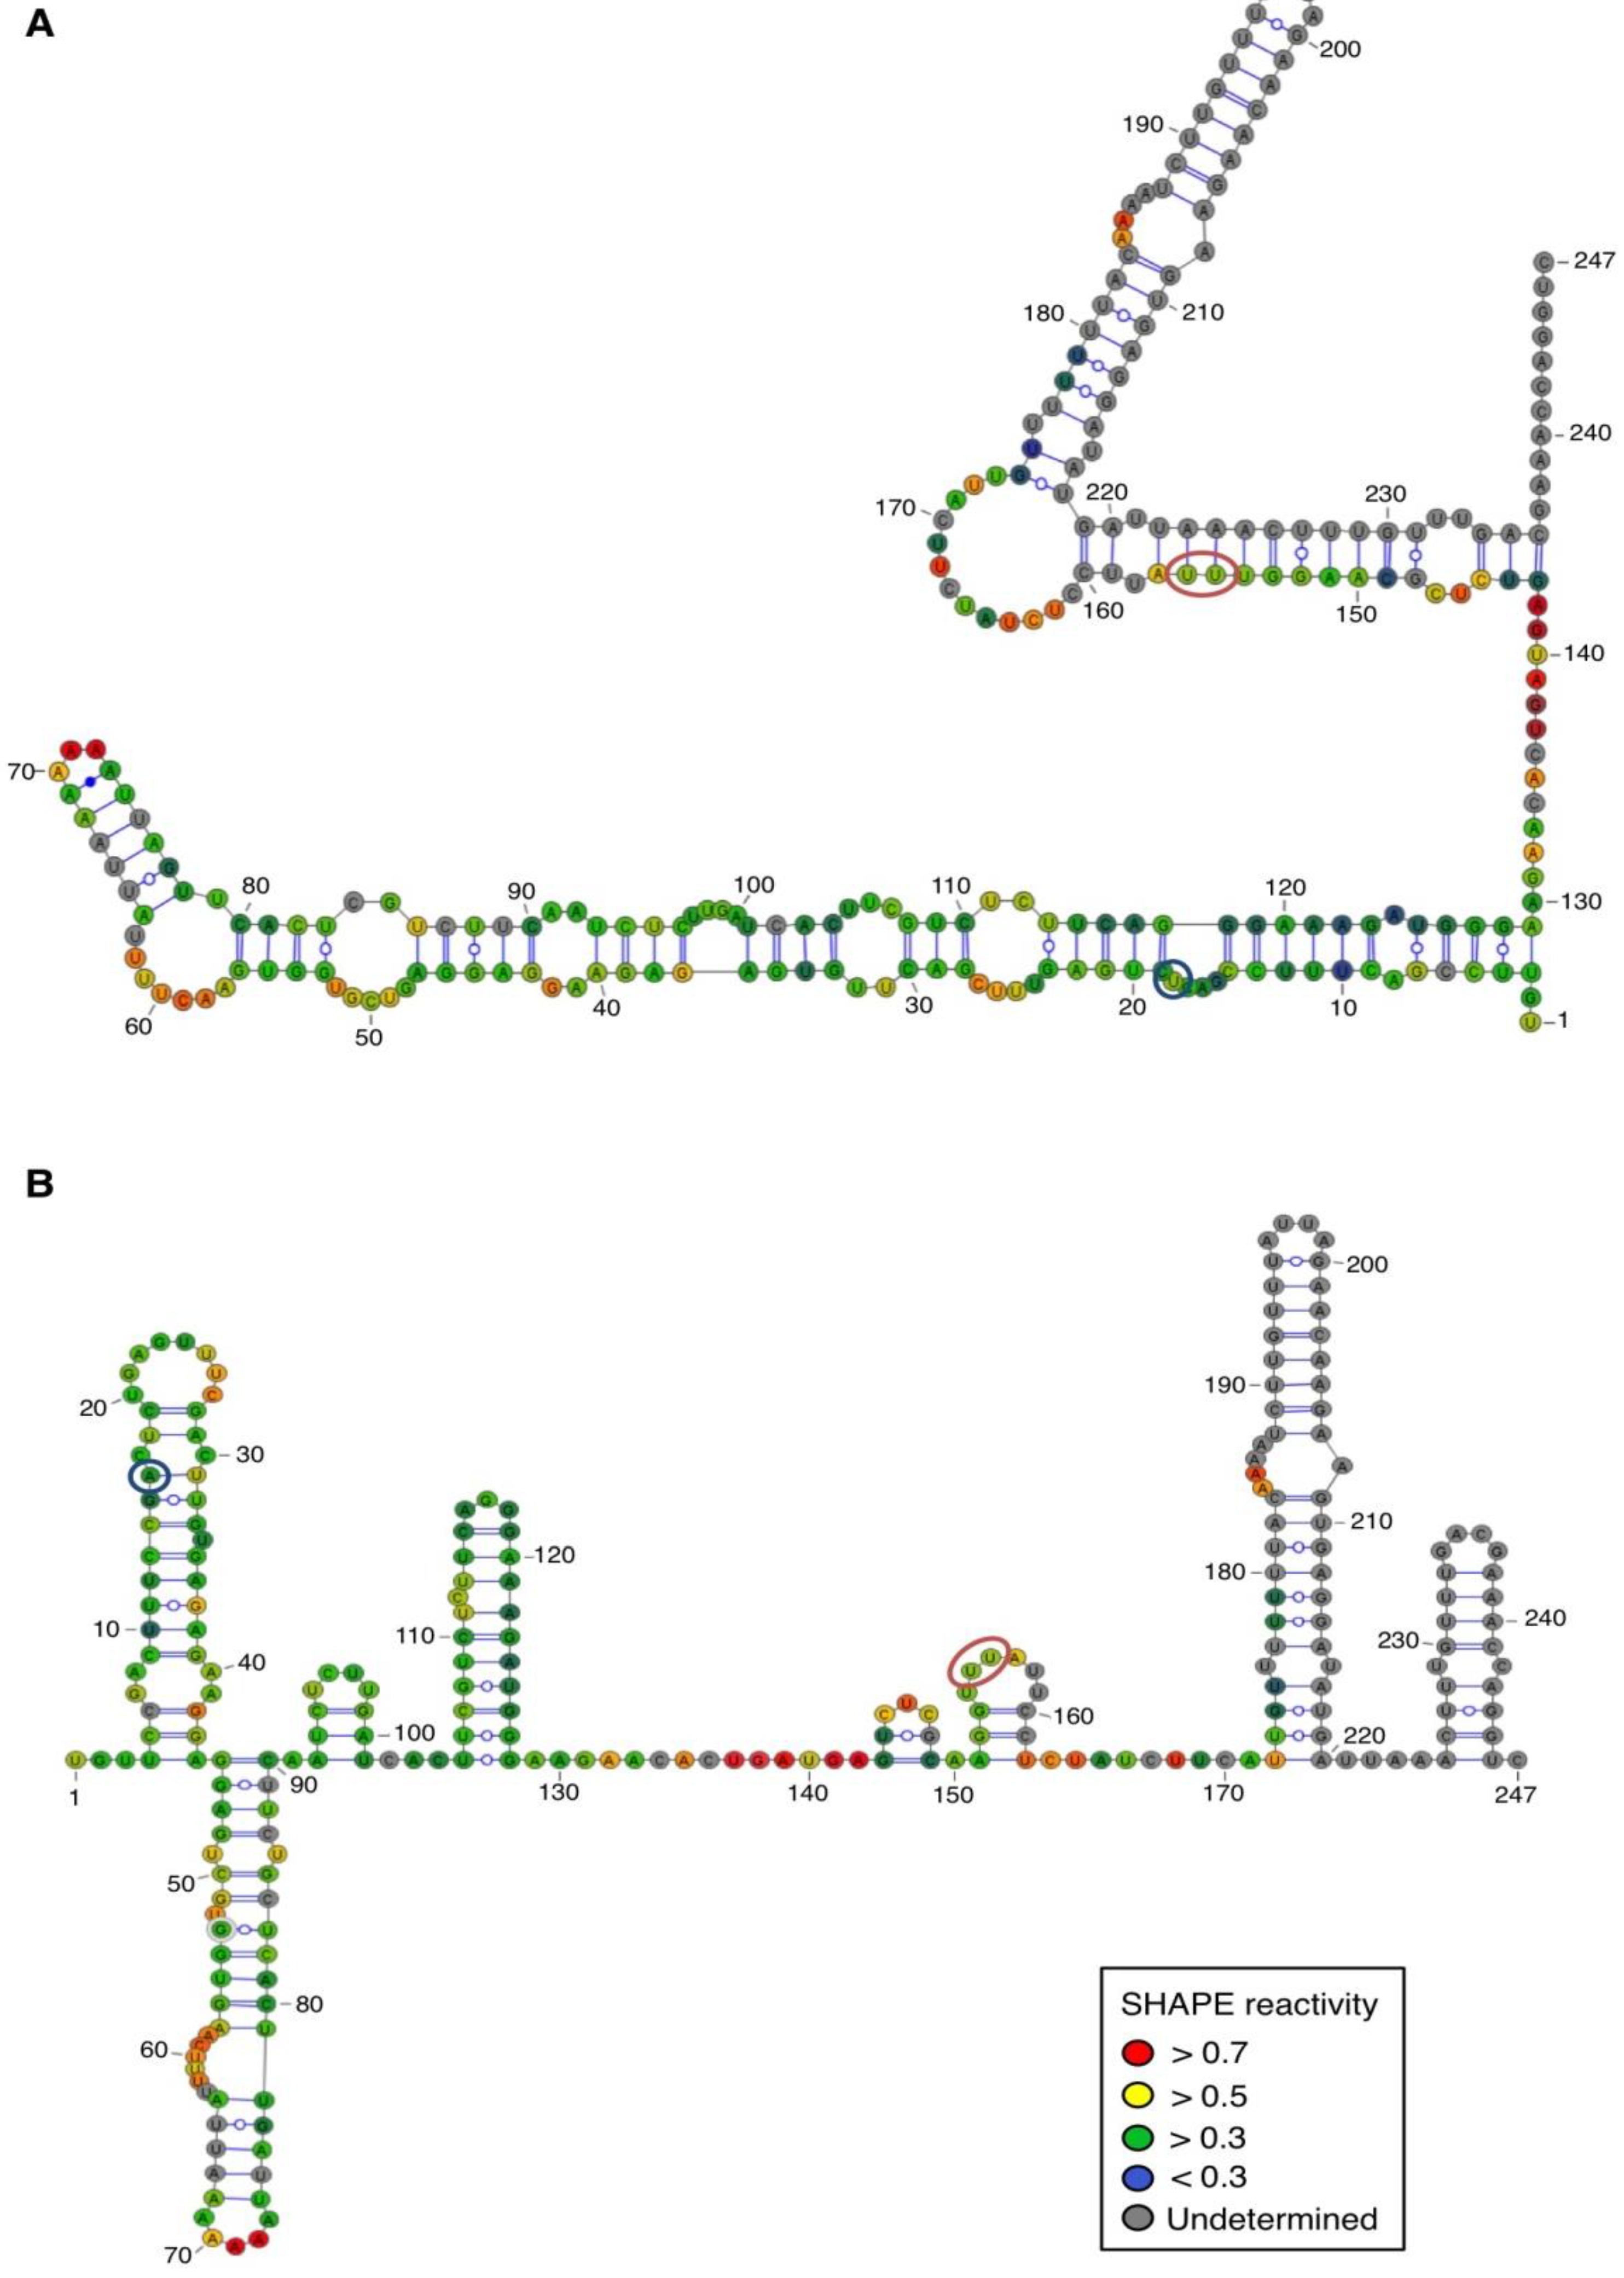
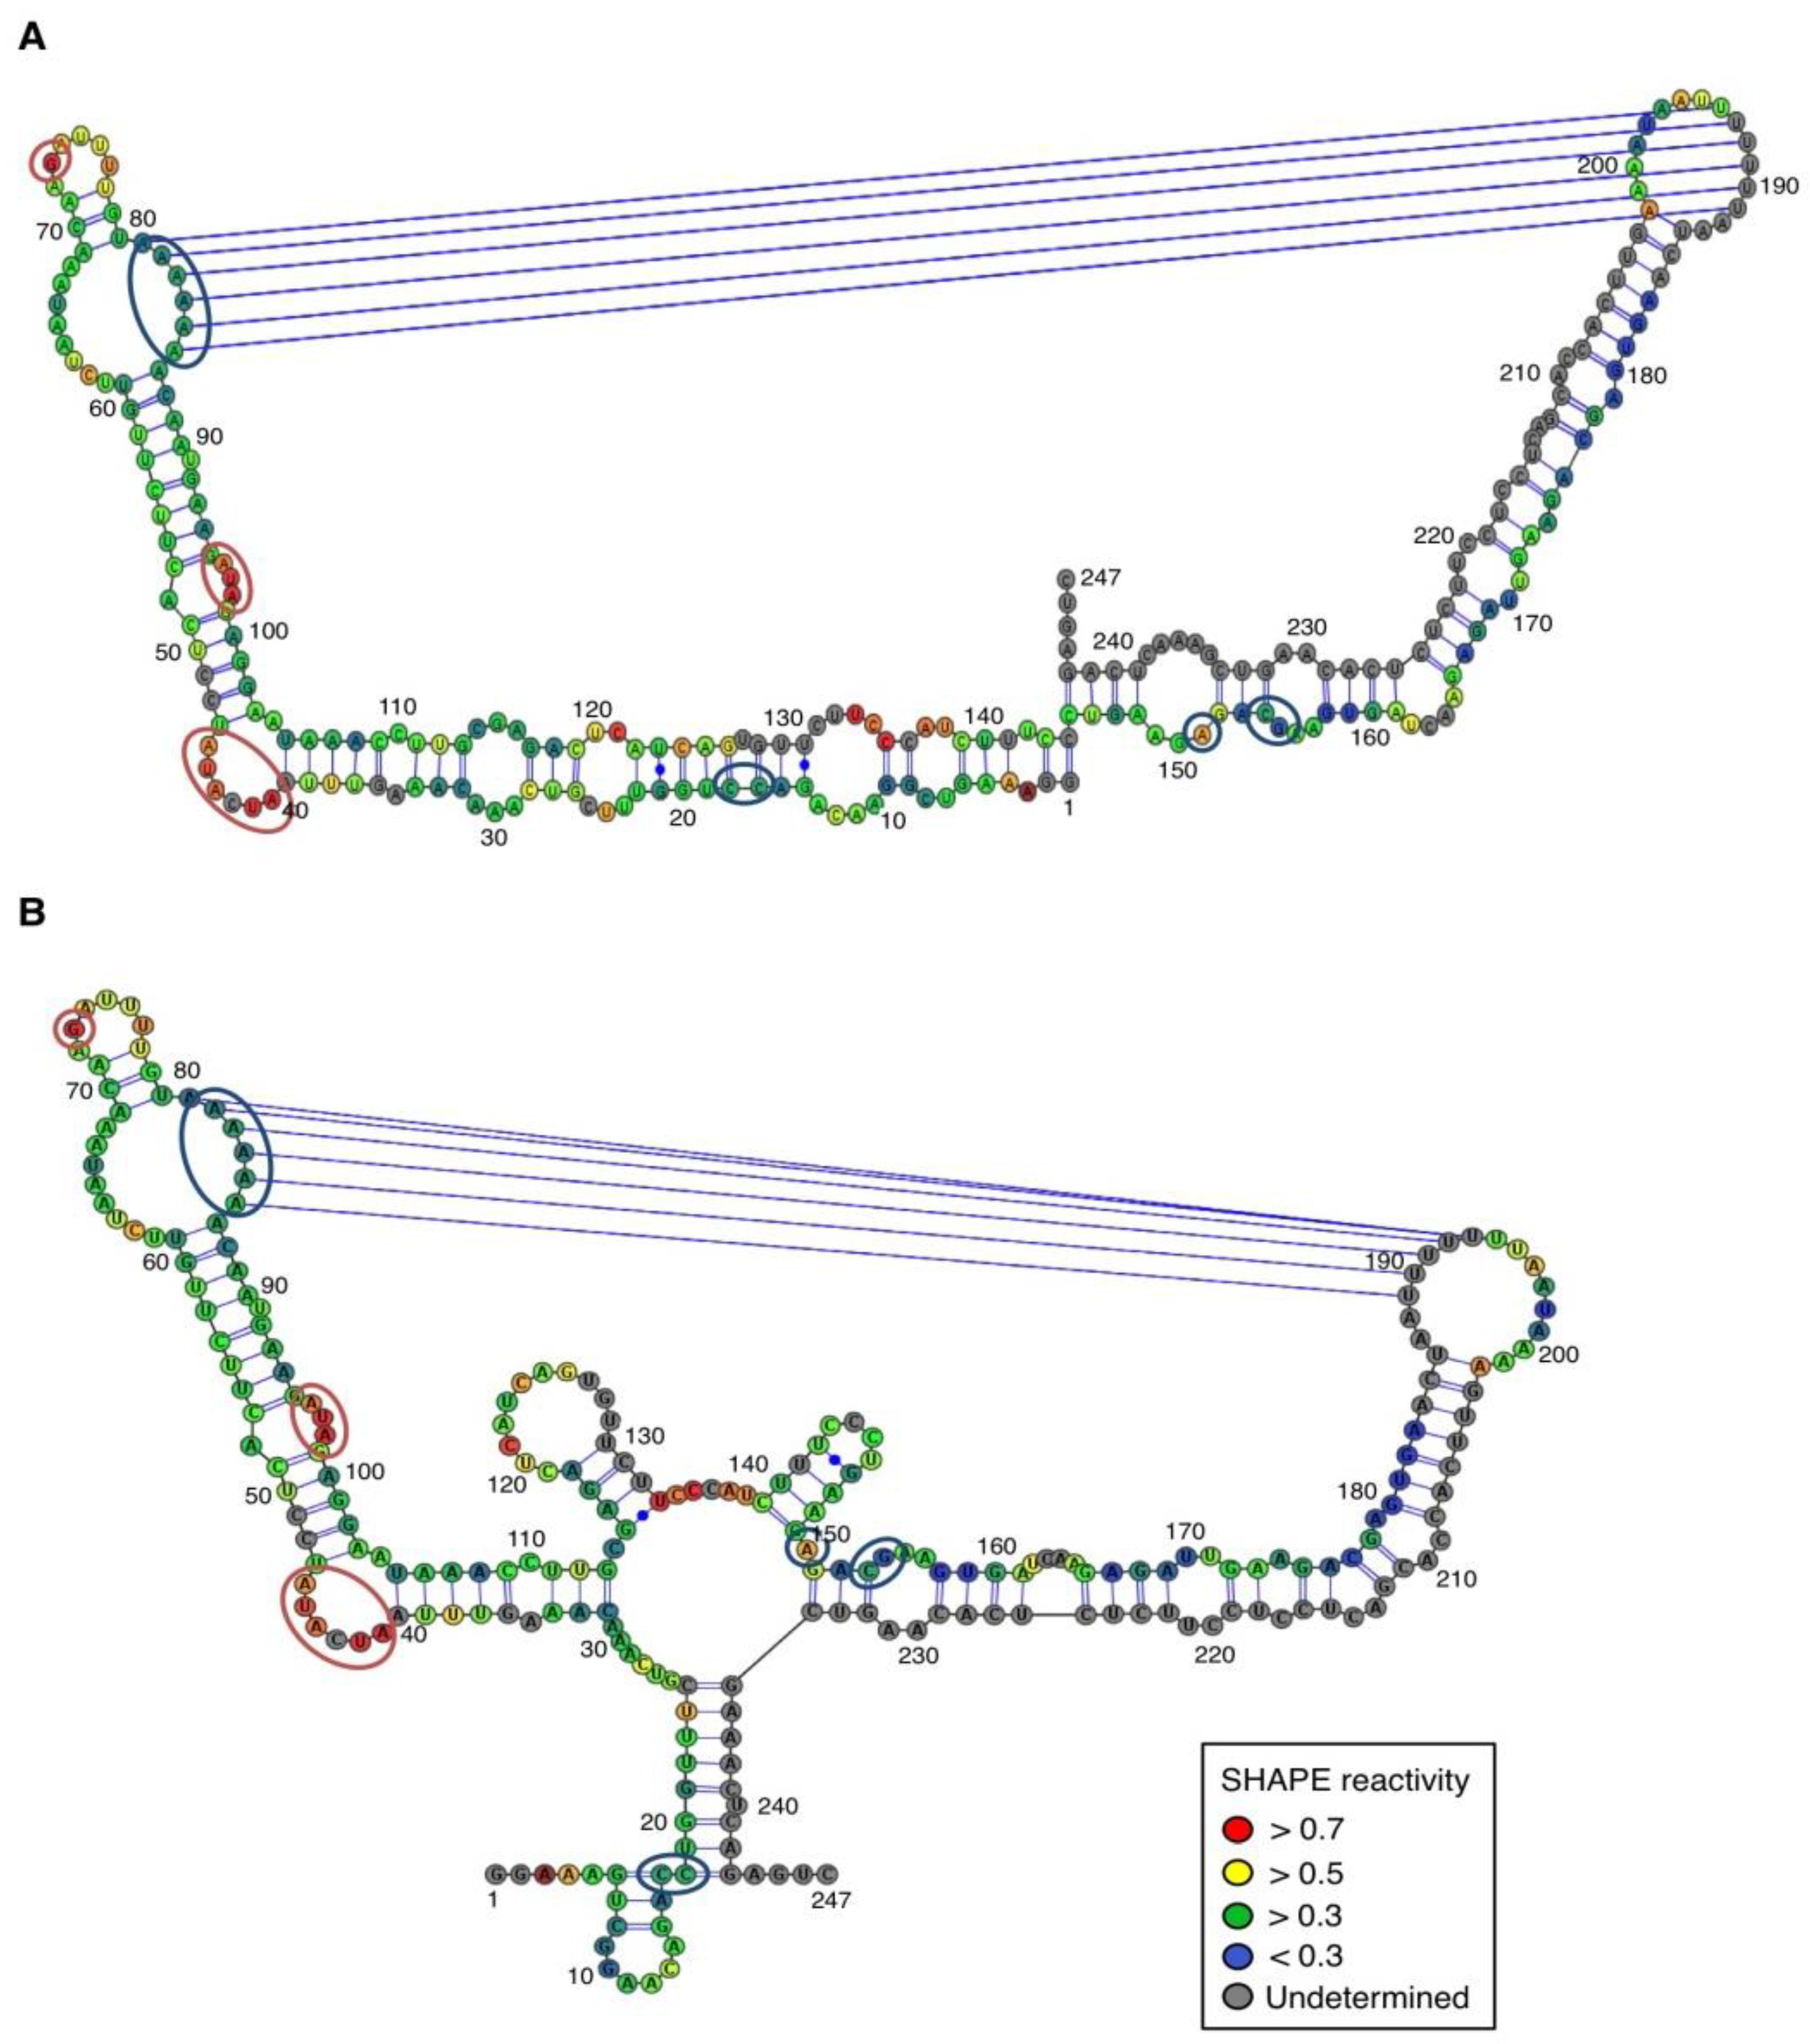
For both polarities, two models (
Figure 4 and
Figure 5)—a quasi-rod-like and a branched model—consistent with the reactivity profile are proposed. They are equiprobable models to date, but they may not represent different conformers. The experiments were repeated three times with good reproducibility. However, experimental noise is often noticed at 5' and 3' end, and in regions where unspecific RT stops occur (the positions before and after a stop are often variable). In addition, we noticed that the reactivity of stretches of nucleotides in specific regions showed an unusually high standard deviation. Such observations were more frequent in ASBVd (+) (see
Appendix Figure A1-A nucleotides 25–26; 39–40; 43–4; 49–57; 107; 141–142; 145–146) than in ASBVd (−) (see
Appendix Figure A1-B nucleotides 45; 53; 96–98; 124–125; 177). This could reflect the presence of different conformations, the relative proportion of which can vary from one experiment to another. This observation is consistent with the results obtained in native gels with Mg
2+ (
Figure 2B and
Figure 3C), where alternative structures are detected, mostly in the case of the ABSVd (+). For the (+) strand, the reactivity of only two nt significantly varies upon Mg
2+ addition; this could reflect a lack of important tertiary folding under these Mg
2+ conditions, or that only a small portion of the molecules adopts a tertiary structure (
Figure 4).
In contrast, for the (−) strand we observed a clear protection of the adenosine stretch 5'
82AAAAA
863'. In addition, we noticed that positions U
190 and U
191, which are reactive in the absence of Mg
2+, are detected as strong RT stops when RNA is folded in the presence of Mg
2+ ions (
Figure 5 and
Appendix Figure A1). Surrounding nucleotides, U
189, U
192 and U
193, are also detected as non–specific stops even in the absence of Mg
2+. Since kissing-loop interactions are stabilized in the presence of divalent ions, there are difficult structures to resolve for RT as they induce stops. Our results suggest the existence of a kissing-loop interaction between nucleotides 5'
82AAAAA
863' and 5'
189UUUUU
1933' (
Figure 5).
Figure 4.
Secondary structure models of ASBVd (+) based on the SHAPE analysis. (
A) and (
B) are the two secondary structure models proposed for ASBVd (+). The color of the circle surrounding each nucleotide reveals their relative reactivity to 1M7 in the presence of 10 mM Mg
2+, as mentioned in the box. High reactivity reflects single-stranded region, while paired nucleotides are not reactive. Nucleotides for which the reactivity could not be determined are shown in grey and correspond to the primer binding site, or to nucleotide right 3' to the primer for which the electrophoresis resolution is not good enough, or to RT stops. The same experiments were carried out without Mg
2+ and differences in reactivity are represented on the scheme: nucleotides circled in red show enhanced reactivity in the presence of Mg
2+, and those in blue are less reactive. The models were designed using VaRNA [
31].
Figure 5.
Secondary structure models of ASBVd (−) based on the SHAPE analysis. (
A) and (
B) are the two secondary structure models proposed for ASBVd (−). The color of the circle surrounding each nucleotide reveals their relative reactivity to 1M7 in the presence of 10 mM Mg
2+, as mentioned in the box. High reactivity reflects single-stranded region, while paired nucleotides are not reactive. Nucleotides for which the reactivity could not be determined are shown in grey and correspond to the primer binding site, or to nucleotide right 3' to the primer for which the electrophoresis resolution is not good enough, or to RT stops. The same experiments were carried out without Mg
2+ and differences in reactivity are represented on the scheme: nucleotides circled in red show enhanced reactivity in the presence of Mg
2+, and those in blue are less reactive. Blue lines represent the potential kissing-loop interaction. The models were designed using VaRNA [
31].
2.4. Sequences Implicated in the Potential Kissing-Loop Interaction of ASBVd (−) RNAs Are Conserved in ASBVd Variants
The base pairing ability was examined in the natural sequences available. Among the 96 different sequences of ASBVd identified and listed in the Subviral RNA database [
1], 90 variants (94%) encompass both the stretches of six consecutive adenines and six consecutive uracils, involved in the kissing-loop interaction of (−) ASBVd. Amongst the six exceptions identified, ASBVd.038 and the ASBVd.069 variants (accession number AF404029 and AF404060 respectively) present a stretch of five instead of six uracils, and ASBVd.052 (accession number AF404043) has a G in the A stretch and was identified in symptomless trees. Two others show important deletions and were identified in symptomless trees (
i.e., ASBVd.083 variant, accession number AF404074, and ASBVd.082 variant, accession number AF404073). It cannot be excluded that the latter two variants, identified by RT-PCR among total RNAs extracted from leaf and flower tissue of infected avocado, represent defective viroids. The last exception is ASBVd.090 variant (accession number EU519467) in which large stretches of the sequence are significantly divergent from other ASBVd variants and notably lack both A and U repetitions. Although the existence of a putative kissing loop remains to be confirmed by mutation, the high conservation of these regions in most ASBVd sequence variants supports its existence in this particular area of ASBVd (−) strand.
In addition, it is worth noting that the postulated tertiary interaction is located near the replication initiation site of ASBVd (−) RNAs [
32]. Indeed, initiation sites of strands on both polarities have been located in the terminal hairpin loops of the predicted structures [
32]. Structural differences in the regions neighboring the initiation sites of both ASBVd (−) and (+) RNAs may influence their respective interactions with the RNA polymerase and/or transcription factors. ASBVd replicates via a symmetric RNA-dependant rolling-circle process, then the presence of a kissing-loop interaction could allow the ASBVd (−) strand to be efficiently transcribed into the ASBVd (+) strand. Such a speculative hypothesis might also partially explain the higher concentrations of ASBVd (+) RNAs observed in infected tissue compared to the ASBVd (−) RNA concentrations [
18,
19].
