Abstract
Herein, we present the investigation of catalytical and fluorescence properties for Ni11(HPO3)8(OH)6 materials obtained through a hydrothermal approach. As part of the constant search for new materials that are both cost effective and electrocatalytically active for the oxygen evolution reaction (OER) in alkaline medium, the present study involves several graphite electrodes modified with Ni11(HPO3)8(OH)6 mixed with reduced graphene oxide (rGO) and carbon black. The experimental results obtained in 0.1 mol L–1 KOH electrolyte solution show the electrode modified with rGO, 5 mg carbon black and 1 mg nickel phosphite as displaying the highest current density. This performance can be attributed to the synergistic effect between nickel phosphite and the carbon materials. Investigation of the electrode’s OER performance in 0.1 mol L–1 KOH solution revealed a Tafel slope value of just 46 mV dec–1. By increasing the concentration to 0.5 and 1 mol L–1, this value increased as well, but there was a significant decrease in overpotential. Fluorescence properties were analyzed for the first time at the excitation length of 344 nm, and the observed strong and multiple emissions are described.
1. Introduction
Due to growing environmental pollution concerns from vehicles and industry, and the rapid consumption of fossil fuels, the need to satisfy the demand for sustainable and clean energy resources has attracted great interest, and it has become an increasing preoccupation of the research and development field [1]. Since hydrogen is considered a clean energy source, water splitting using a photoelectric or electric current is widely regarded as an encouraging approach to obtain eco-friendly fuel for tomorrow’s energy supply [2,3]. As an example, electrocatalytic water splitting is viewed as a very convenient and environmentally friendly technology for generating oxygen and hydrogen to supply PEMFC-driven vehicles [4]. Electrochemical water splitting is a process that implies the dividing of the H2O molecule into H2 and O2, with both resulting molecules being considered as fuels with zero carbon emission [5].
Basically, there are two unfolding half-cell reactions: at the anode, water splits into O2 gas through the oxygen evolution reaction (OER), while, at the cathode, H2 gas evolves via the hydrogen evolution reaction (HER) [6]. The HER is catalyzed with a very facile kinetics, but the OER requires more energy, since it is a four-electron reaction [7,8].
Theoretically, the electrochemical potential for O2 evolution is 1.23 V vs. the Normal Hydrogen Electrode, but in practice, in order to overcome the energy barrier, a higher value needs to be applied [9,10]. In other words, from a kinetic point of view, the OER is difficult to control since it involves higher energy intermediates and multiple proton-coupled electron transfer steps [11,12]. There are materials that can serve as OER catalysts by lowering the reaction active energy, and they can be grouped into two categories: metal-based and carbon-based compounds [13,14,15].
Currently, noble metal-based electrocatalysts display the highest OER catalytic activity, especially the ones containing Ir and Ru [16,17]. However, noble metals are expensive and have a low abundance, which impedes their use in large-scale applications and impose the development of alternative strategies.
Transition metals that have been identified as efficient OER catalysts include divalent cations, such as Mn, Fe, Co, and Ni [5], that exhibit their electrocatalytic activity in the following order: Mn2+ < Fe2+ < Co2+ < Ni2+ [18]. The success of eco-friendly water splitting-based technologies depends on the development of efficient and earth abundant transition metal catalysts, and this outlines the importance of directing the research focus toward metals such as Fe, Co, and Ni [19,20]. Their complexes display high OER electrocatalytic activity, and Ni-based complexes in particular have proven to be attractive due to their notable performance and relative low cost [21,22,23].
The present work is a continuation of previous investigations [24], and it consists in an electrochemical study involving several graphite electrodes modified with compositions containing Ni11(HPO3)8(OH)6, reduced graphene oxide (rGO), and carbon black. The catalytic material, a member of the metal phosphites class, was selected based on literature reports that indicated nickel phosphites as promising electrocatalysts for water splitting [12,23]. Considering that there are not many published studies evaluating the water splitting electrocatalytic properties of nickel phosphites, the aim of this paper is to complement the current literature by outlining the catalytic properties of the mentioned nickel phosphite-based compositions for the OER in alkaline medium. Furthermore, the compound’s fluorescence properties are presented and interpreted for the first time in the case of nickel phosphite samples obtained by the hydrothermal method but in different synthesis conditions characterized by different morphology. In light of the limited research performed on the investigated material’s electrocatalytic and fluorescence properties, this work relies on the proposal that the additional evaluation of these characteristics will provide the scientific community with the opportunity to better understand it.
2. Materials and Methods
Reagents and materials. Ni11(HPO3)8(OH)6 material was synthesized by the hydrothermal method at high pressure and temperature, according to [25]. Graphene PureSheets Quattro (NanoIntegris, Menlo Park, California ) was concentrated up to 0.6 mg mL–1 by centrifugation and redispersion, Carbon Black—Vulcan XC 72 (Fuell Cell Store, Texas) and Nafion® 117 solution (Sigma-Aldrich, Saint Louis, MO, USA) were used as purchased, together with reagent grade C2H5OH, C3H7OH, KOH, KNO3, and K3[Fe(CN)6]. The two conductive carbon materials were selected because of the important roles such compounds have been shown to play in the field of oxygen evolution catalysis [26,27]. The graphite tablets for electrode manufacturing were obtained from spectroscopic graphite rods (⌀ = 6 mm), type SW. 114 (Kablo Bratislava, National Corporation “Electrocarbon Topolcany” Factory, Bratislava, Slovakia). Double-distilled water was used throughout the study.
Preparation of modified electrodes. The graphite tablets were polished using silicon carbide paper (grit size: 1200 and 2400) and felt. They were subsequently washed with double-distilled water and ethanol and dried at room temperature. The tablet’s surface modification consisted of the application via the drop-casting method [28] of a 10 µL volume from suspensions having the compositions shown in Table 1. After a drying period of 24 h in air and at room temperature, twelve types of modified graphite electrodes were obtained. The codes used to identify the unmodified electrode and each of the modified ones are also presented in Table 1.

Table 1.
The codes used to identify the electrodes, together with the compositions of the suspensions employed to modify the graphite tablets.
Electrochemical measurements. A PGZ402 (VoltaLab 80) Universal Potentiostat from Radiometer Analytical and an electrochemical glass cell equipped with three electrodes were used for the electrochemical experiments. The counter electrode was a Pt plate (Sgeom = 0.8 cm2), and Ag/AgCl (sat. KCl) was the reference electrode. Each of the graphite tablets, modified and unmodified, was inserted into an electrically nonconductive support and employed as the working electrode (Sgeom = 0.07 cm2).
The specimens were investigated in terms of their OER electrocatalytic properties by recording linear sweep voltammograms (LSVs) in 0.1 mol L–1 KOH electrolyte solution (pH = 13), and the most catalytically active electrode was further studied in 0.5 and 1 mol L–1 KOH solutions (pH = 13.7 and 14, respectively). Cyclic voltammetry was used for electric double-layer capacitance experiments, carried out in 0.1 mol L–1 KOH solution, and also for electroactive surface area (EASA) and electroactive species diffusion coefficient estimations, in 1 mol L–1 KNO3 containing 4 mmol L–1 K3[Fe(CN)6]. All electrochemical experiments were performed at 23 ± 2 °C.
Unless otherwise specified, the LSVs were recorded by applying iR compensation, and the current densities mentioned in the text are geometrical current densities. Conversion of the measured potentials to the Reversible Hydrogen Electrode (RHE) scale, calculation of the OER overpotential (η), and estimation of the EASA and diffusion coefficient were performed using the same equations that have been employed in the previous study concerning Ni11(HPO3)8(OH)6 [24] and have also been reported in the literature [29,30]. They are presented in the Supplementary Materials.
SEM and EDX investigations. Scanning electron microscopy (SEM) investigations and energy-dispersive X-ray (EDX) analyses were performed using a scanning electron microscope equipped with the EDX module, INSPECT S model from FEI Company.
An AFM analysis was performed by a Nanonics MultiView 2000 scanner (Nanonics, Jerusalem, Israel, using the intermittent mode at ambient conditions (24–25 °C). The studied materials were placed on a polished glass slide. The scanner was equipped with a silicone-type probe Cr-coated, having a tip radius of 20 nm and resonance frequency of 30–40 kHz.
A fluorescence analysis was performed in the 475–700 nm range with a Perkin Elmer LS55 Spectrofluorometer, Hamburg, Germany. The excitation scan between 300 and 500 nm revealed an excitation peak with the highest signal at approximately 344 nm. The slits used for these measurements were 15 nm for λ excitation and 15 nm for λ emission. The employed excitation length was 344 nm. No filter was used. The analysis was carried out in a suspension of water and ethyl–alcohol.
3. Results
3.1. Electrochemical Investigations
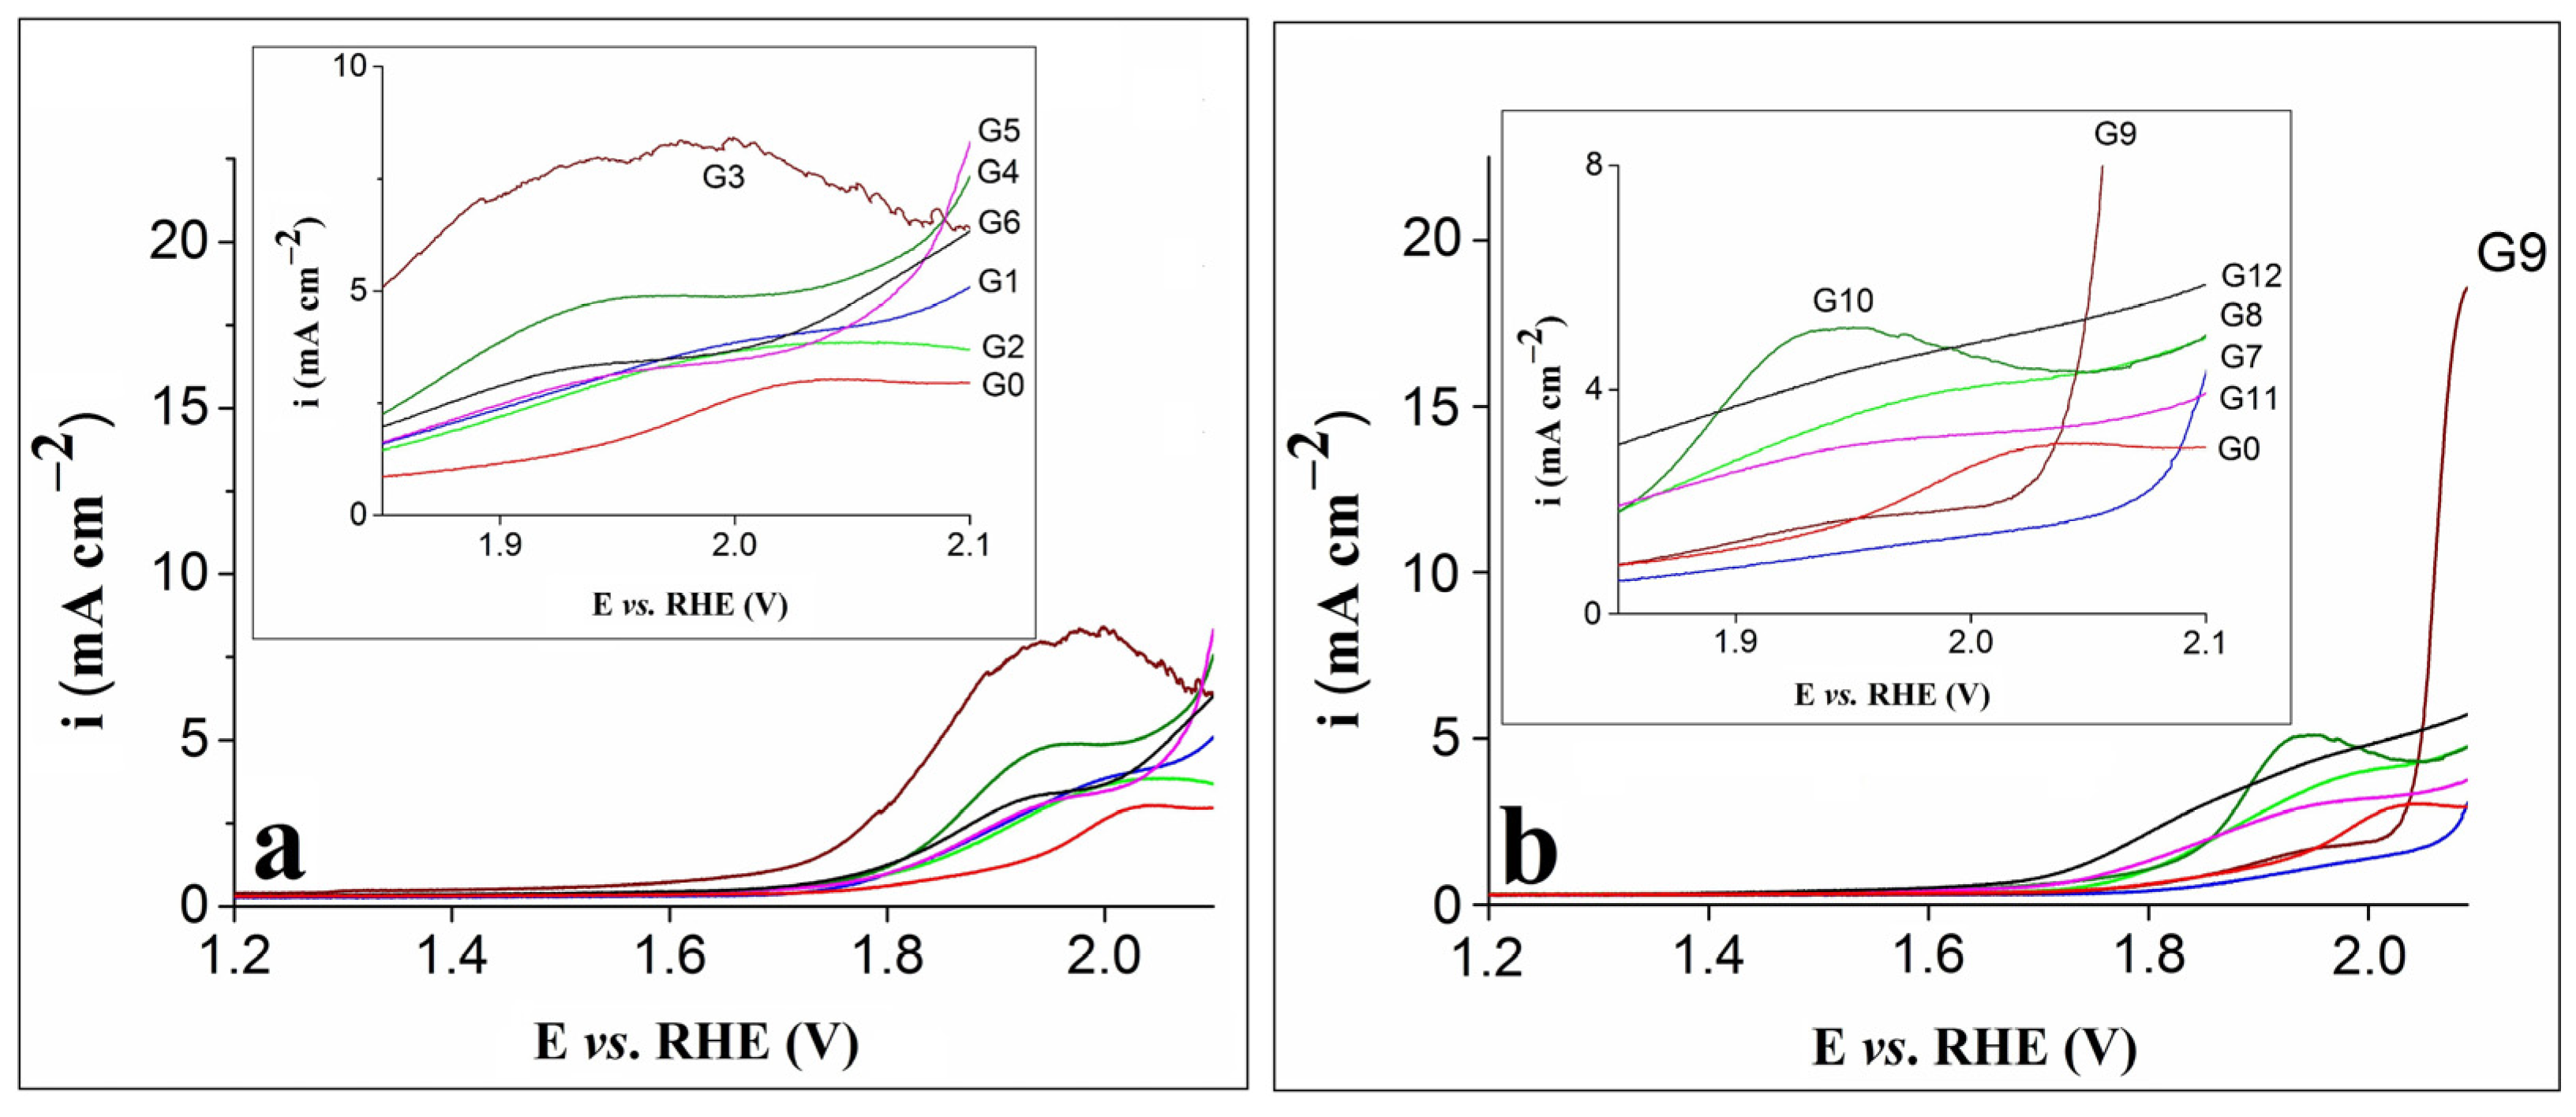
The anodic polarization curves obtained on the G0–G6 electrodes are presented in Figure 1a, while Figure 1b shows the LSVs traced on the G0 and G7–G12 electrodes. The measurements were performed in 0.1 mol L–1 KOH electrolyte solution at a scan rate (v) of 1 mV s–1.
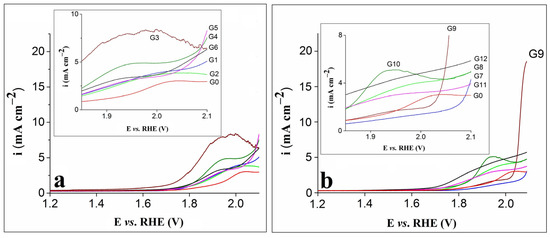
Figure 1.
(a) LSVs recorded on the G0–G6 electrodes. (b) LSVs recorded on the G0 and G7–G12 electrodes. Insets in (a) and (b) correspond to enlarged regions of the LSVs.
Based on Figure 1a,b, the LSV recorded on the G0 electrode shows an oxidation feature at 2.03 V vs. RHE that is shifted towards more negative potential values in case of the modified electrodes. Furthermore, for most modified electrodes, the feature appeared at higher current densities, and the highest value was observed for G3. The LSV obtained on this electrode is not as smooth as the ones traced on the other modified electrodes, probably because of the intense bubbling effect noticed during the experiment. Basically, the OER overlapped with the process corresponding to the anodic feature [31], while the bubbles formed on its surface affected the maximum current density value by decreasing the electroactive area and hindering the reaction. Of all the differences between the LSVs recorded on the modified electrodes, the most obvious was observed for G9. The current density it exhibited was significantly higher than that of the other electrodes, and in the field of water splitting, a high-current density is an important requirement [23].
The fact that the electrode displaying the highest current density was the one modified with a composition containing rGO, 5 mg carbon black and just 1 mg nickel phosphite highlights the importance of experiments aimed at identifying the proper ratio between the materials of the compositions used to obtain the modified electrodes. The performance of the G9 electrode may be attributed to the synergistic effect of the nickel phosphite and the carbon materials. The latter ensured an improved charge transport during the OER process and, to some extent, prevented the nickel phosphite particles from aggregating into larger structures, making them better distributed into the composition and promoting the formation of catalytically active sites on the electrode surface [32].
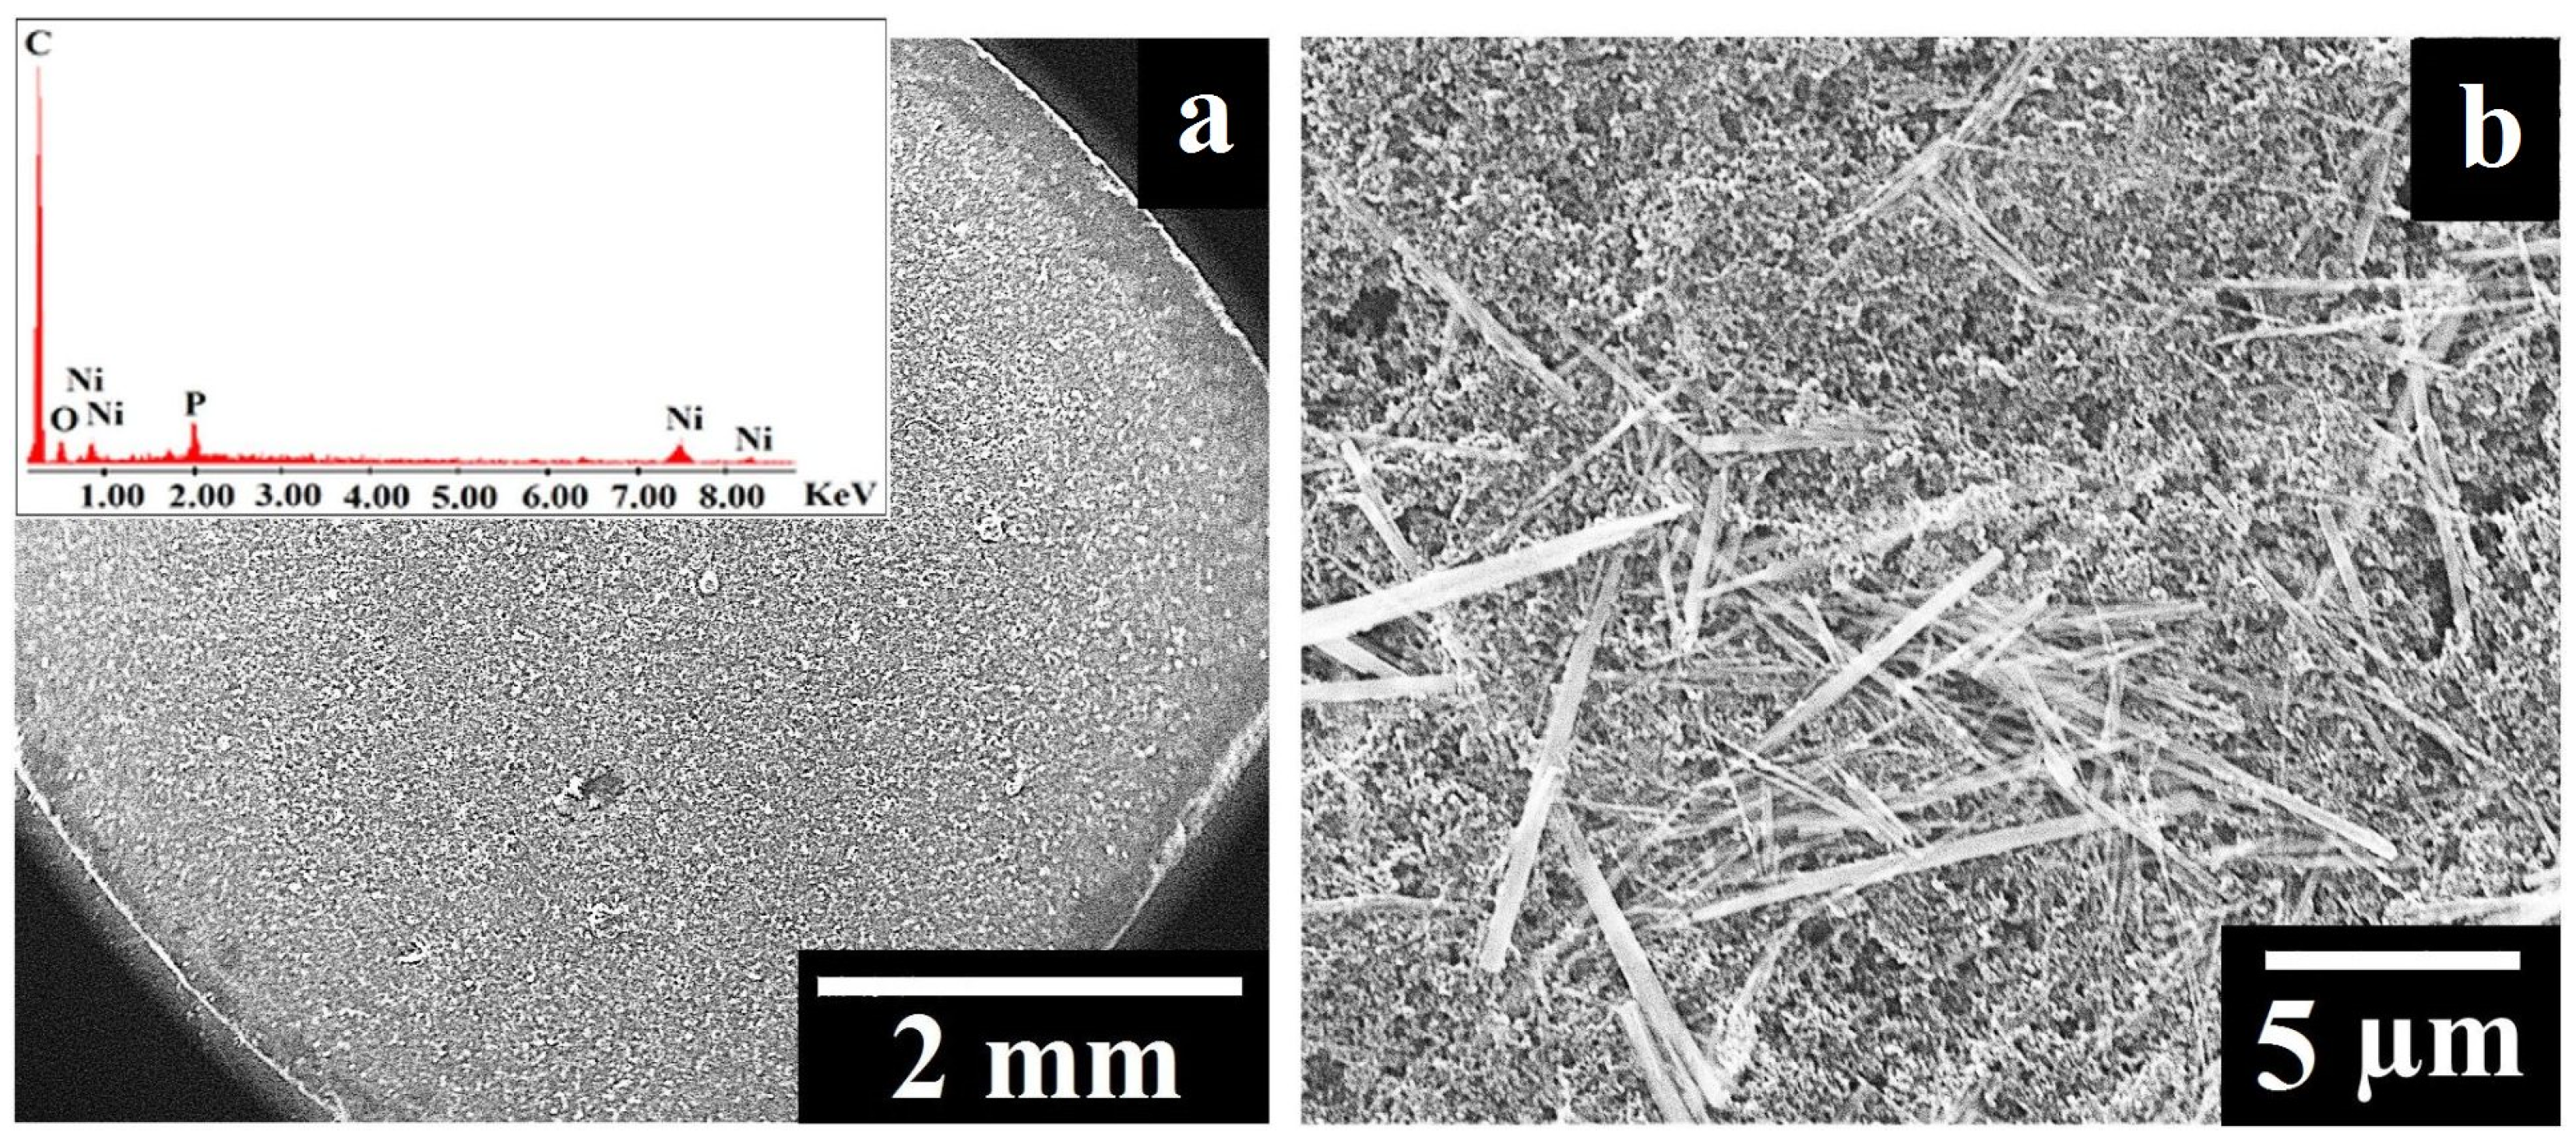
The G9 electrode was investigated by SEM (Figure 2), and the top-view image recorded at low magnification (Figure 2a) shows that the suspension applied on the surface of the graphite tablet led to the formation of areas that differ in terms of the deposited composition’s homogeneity. This observation is in agreement with other studies in which the drop-casting method was used to obtain modified electrodes [33,34]. The high-magnification image presented in Figure 2b displays the rod-shaped Ni11(HPO3)8(OH)6 particles with lengths between 1.2 and 10.2 µm and diameters between 0.08 and 0.6 µm. The particles investigated by Menezes et al. [23] had the same shape, but their lengths and diameters were not as big, most likely due to the different synthesis method used to obtain the samples from the current study [25].
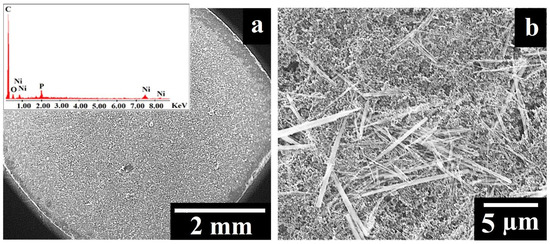
Figure 2.
(a) SEM image recorded on the surface of the G9 electrode at low magnification. Inset: EDX spectrum of the G9 electrode. (b) SEM image recorded on the surface of the G9 electrode at high magnification.
The presence of nickel and phosphorus in the composition deposited on the surface of the graphite tablet was confirmed by EDX analysis (Figure 2a inset). The other identified elements (carbon and oxygen) were also expected to be present in the sample, considering the contents of the suspension used to obtain the G9 electrode.
Further characterization of the G9 electrode was performed using cyclic voltammetry, and it was aimed at determining the electric double-layer capacitance at the electrode/electrolyte solution interface and estimating both the electrode’s EASA, as well as the diffusion coefficient of ferricyanide ions.
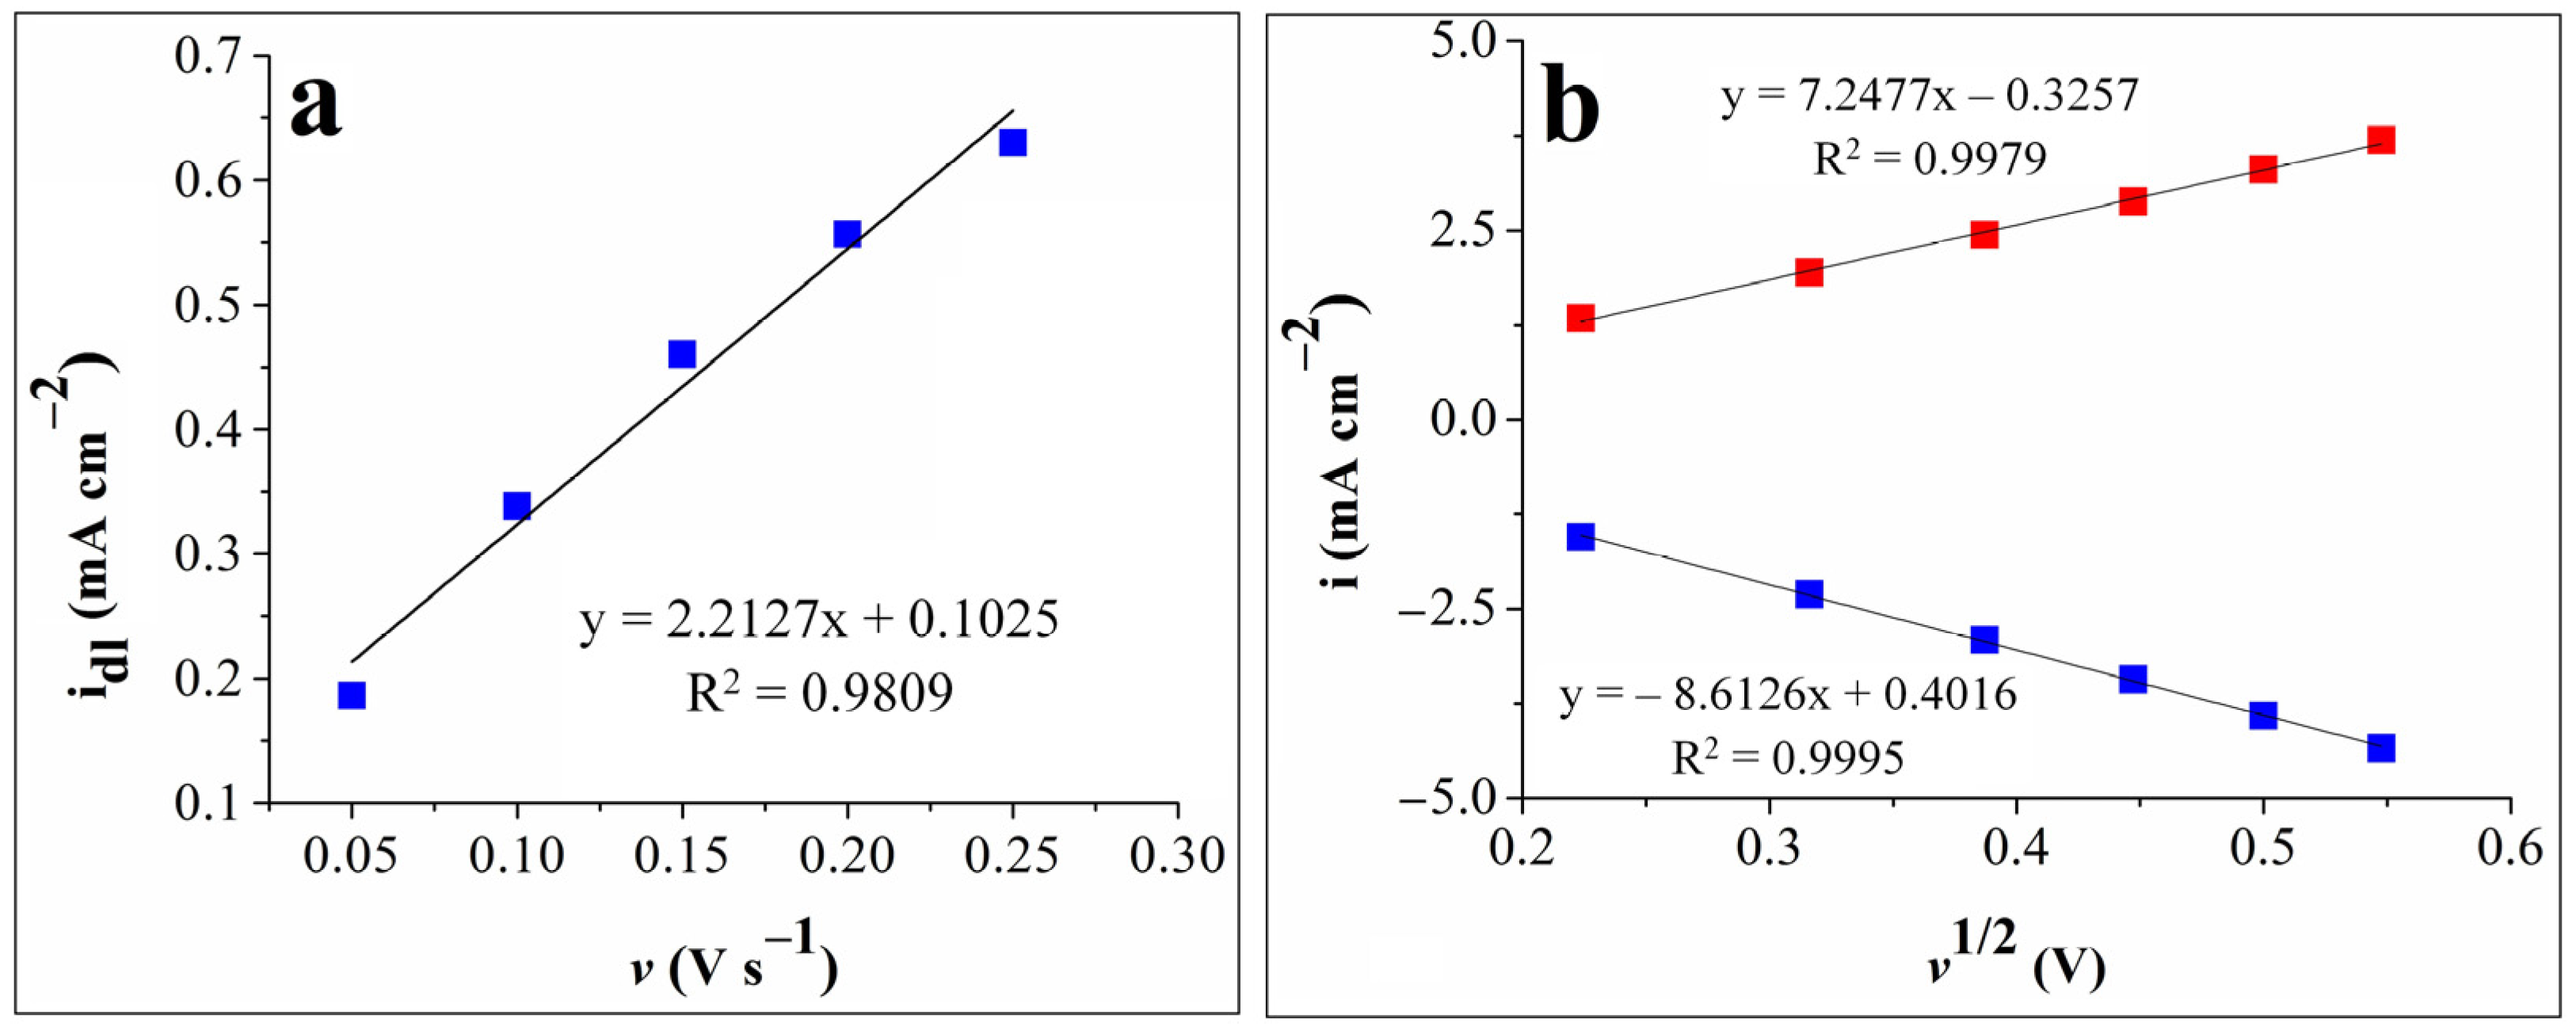
The double-layer capacitance (Cdl) was obtained by first recording cyclic voltammograms in 0.1 mol L–1 KOH solution at various scan rates (v = 0.05, 0.1, 0.15, 0.2, and 0.25 V s–1) in the –0.2 ÷ –0.1 V vs. Ag/AgCl (sat. KCl) potential range, where no faradic currents were present. The capacitive current density (idl) was then calculated as the average of the absolute values of the anodic and cathodic current densities, selected at –0.15 V vs. Ag/AgCl (sat. KCl), where only double-layer adsorption and desorption features were present [35,36,37]. The Cdl value was determined as the absolute value of the slope obtained for the linear dependence between idl and the scan rate [38]. Figure 3a shows the idl-v dependence plot and the slope value of 2.2127 mF cm–2.
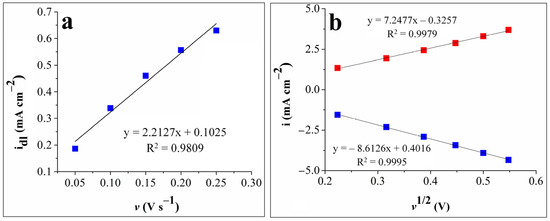
Figure 3.
(a) The plot of the capacitive current density vs. the scan rate for the G9-modified electrode. (b). The graphical representations of the anodic peak current densities vs. the square root of the scan rate (red squares) and of the cathodic peak current densities vs. the square root of the scan rate (blue squares) for the G9-modified electrode.
Cyclic voltammograms were also recorded on the G9 electrode in the 1 mol L–1 KNO3 electrolyte solution in the presence and absence of 4 mmol L–1 K3[Fe(CN)6] at various scan rate values (v = 0.05, 0.1, 0.15, 0.2, 0.25, and 0.3 V s−1) and in the 0 ÷ 0.8 V vs. Ag/AgCl (sat. KCl) potential range, where the signals corresponding to the [Fe(CN)6]4–/3– redox couple appeared (see Figure S1 from the Supplementary Materials). The experimental data were used in the Randles–Sevcik equation to estimate the EASA and diffusion coefficient of ferricyanide ions, and their values were found to be 0.13 cm2 and 2.33 x 10⁻⁵ cm2 s–1, respectively. The plot of the anodic and cathodic peak current densities vs. the square root of the scan rate for the same electrode is presented in Figure 3b. As can be seen, the redox peak currents are proportional to the square root of the scan rate, which indicates a diffusion-controlled electron transfer process [24,28].
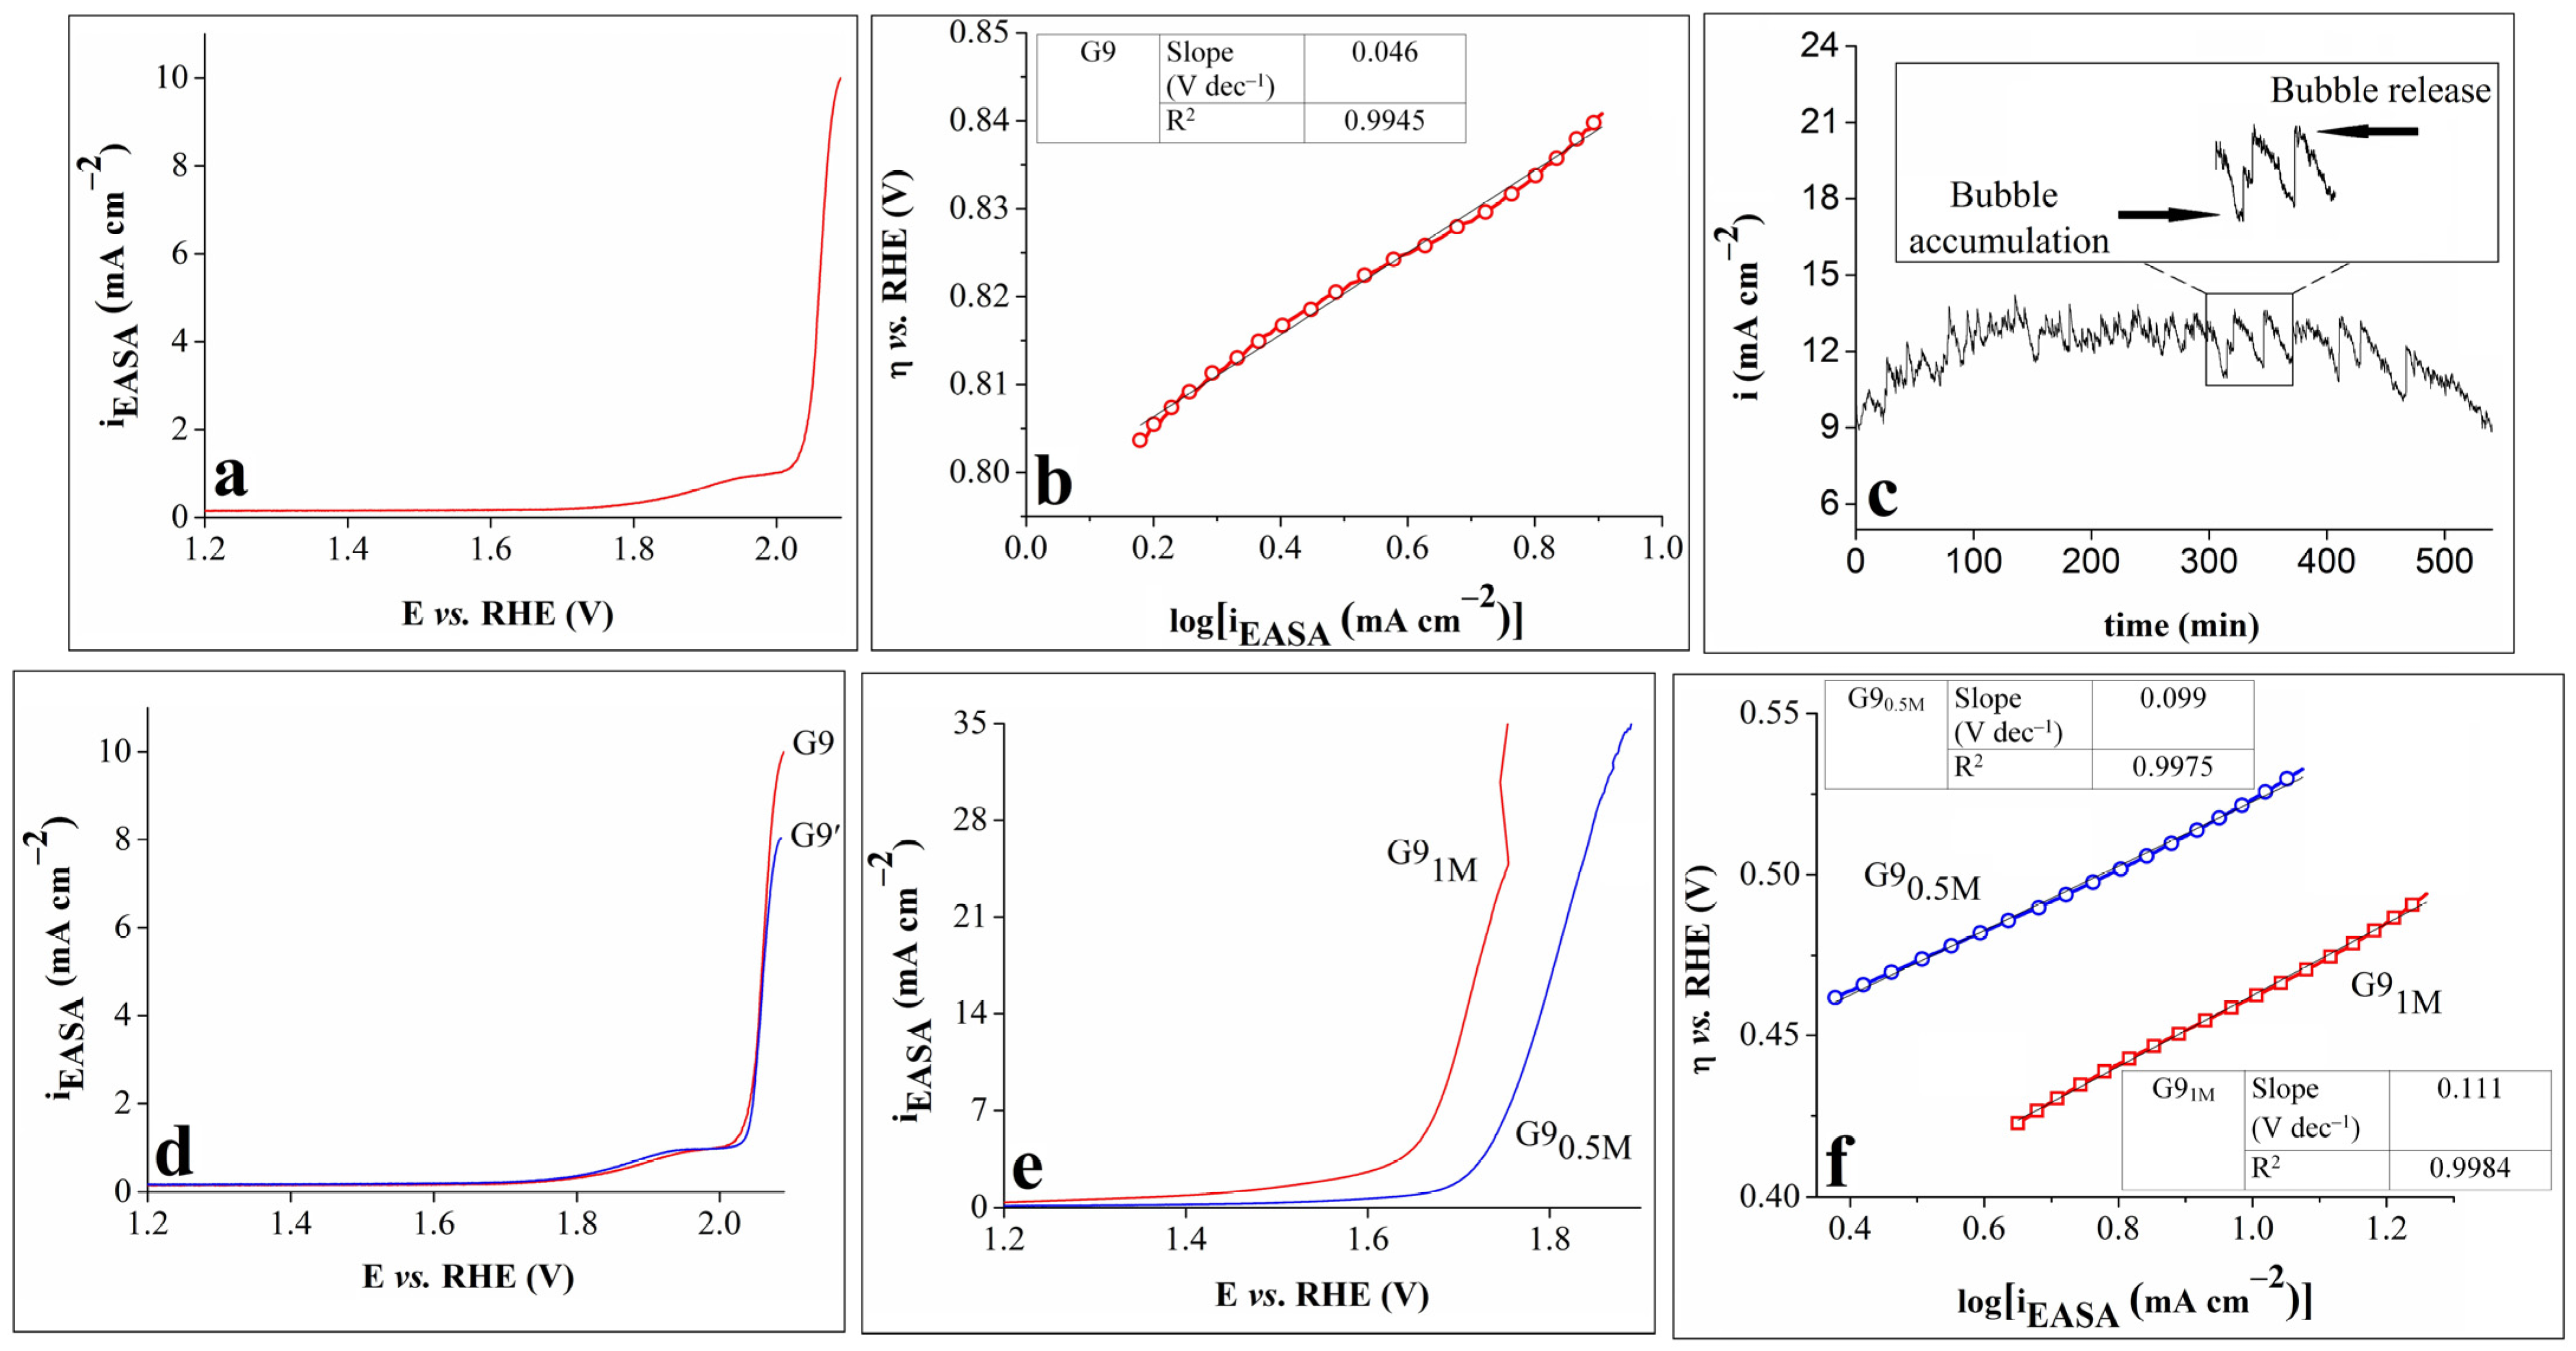
The results obtained from subsequent OER experiments performed on the G9 electrode are shown in Figure 4. The geometric area of the sample was replaced with the estimated EASA value, and the modified LSV, differing from the initial one in terms of the current density values, is presented in Figure 4a.
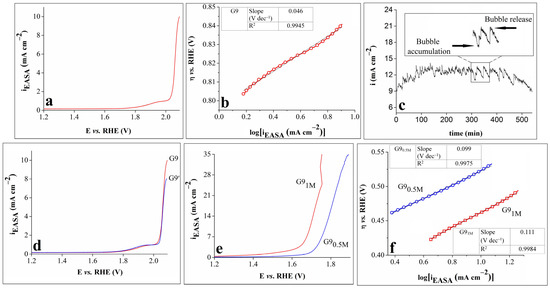
Figure 4.
(a) LSV obtained on the G9 electrode in 0.1 mol L–1 KOH solution. (b) The Tafel curve for the G9 electrode in 0.1 mol L–1 KOH solution and inserted table showing the Tafel slope and R2 values; (c) i-t curve recorded on the G9 electrode in 0.1 mol L–1 KOH solution, with inset showing an enlarged region of the curve. (d) LSVs traced on the G9 electrode in 0.1 mol L–1 KOH solution, before and after the stability test. (e) LSVs recorded on the G9 electrode in 0.5 mol L–1 KOH (G90.5M) and 1 mol L–1 KOH (G91M) solutions. (f) The Tafel curves of the G9 electrode in 0.5 mol L–1 KOH (G90.5M) and 1 mol L–1 KOH (G91M) solutions and an inserted table showing the Tafel slopes and R2 values. All LSVs were recorded at v = 1 mV s–1.
An important parameter in the study of the OER kinetics at the electrode/electrolyte interface is the Tafel slope, which reveals the relationship between the overpotential and the current density. A smaller Tafel slope usually suggests better electrocatalytic properties [27,32,39]. Figure 4b displays the Tafel curve for G9 in 0.1 mol L–1 KOH electrolyte solution. The value of the slope was calculated using the Tafel equation: η = b x log(i) + a, where η is the overpotential, i is the current density, and b is the Tafel slope. A low value of 46 mV dec–1 was obtained, indicating enhanced reaction kinetics.
The electrochemical stability of electrocatalysts is another important parameter used to evaluate their OER performance [32]. The stability of G9 in 0.1 mol L–1 KOH solution was studied chronoamperometrically by maintaining constant the potential value corresponding to i = 10 mA cm–2. The time-dependent current density (i-t) curve was recorded for 9 h (Figure 4c), and the following observations were made: the current density increased until it reached the maximum value of 14 mA cm–2 after 135 min (an increase of 40%), and then, it gradually decreased to 8.9 mA cm–2 at the 540 min mark. The shape of the curve was affected by the alternate processes of bubble accumulation and bubble release (Figure 4c inset), and the decrease in the current density seen during the experiment can be ascribed to the reaction hindering the O2 bubbles that stayed on the surface of the electrode and perhaps also to the partial detachment of the catalyst caused by the continuous bubble release [40].
The anodic polarization curves obtained on the G9 electrode before and after the stability test (denoted G9 and G9′) are presented in Figure 4d. A comparison between them reveals that they overlap almost perfectly up to the current density value of 6 mA cm–2, but they gradually separate at higher values. The LSV recorded after the stability test reached 8.02 mA cm–2, which was lower than the initially attained 10 mA cm–2. This result outlined the stability limitations of the G9 electrode.
Lastly, the study of the electrocatalytic properties of the G9 electrode focused on the concentration of the electrolyte solution. It has been shown that, by modifying this parameter, specifically by increasing the concentration of the KOH solution, higher current densities and lower overpotential values are obtained [41]. Thus, the polarization curves were traced on G9 in 0.5 mol L–1 and 1 mol L–1 KOH electrolyte solutions (Figure 4e). By comparing Figure 4a,e, it can be seen that higher current densities were achieved when the KOH concentration of the electrolyte solution was 0.5 or 1 mol L–1 than when it was 0.1 mol L–1. Furthermore, the OER overpotential values corresponding to the current density values became significantly smaller as the KOH concentration increased.
The Tafel curves of the G9 electrode in 0.5 mol L−1 and 1 mol L–1 KOH electrolyte solutions are presented in Figure 4f, together with the values of the Tafel slopes and R2 values. These values are higher than the one calculated for the same sample but not in the 0.1 mol L–1 KOH solution. The result indicates that, when studying the OER properties of G9, even though higher KOH concentrations lead to higher anodic current densities and lower overpotential values, they also affect the OER kinetics at the electrode/electrolyte interface.
As was specified in the introduction section, the present study continues the previous work on the OER electrocatalytic properties of graphite electrodes modified with compositions containing Ni11(HPO3)8(OH)6. The most electrocatalytically active electrode identified in the preceding study [24] was obtained by drop-casting a suspension containing 5 mg Ni11(HPO3)8(OH)6 and 10 µL Nafion solution on the surface of a graphite tablet. Since the working conditions were very similar to the ones from the present study, a comparison can be made between the properties exhibited by that electrode and G9. In this sense, Table 2 shows the values of some electrochemical parameters—EASA, the OER overpotential (η) at 5 mA cm–2, and the Tafel slope in 0.1 mol L–1 KOH electrolyte solution—for the two modified electrodes.

Table 2.
The values of some electrochemical parameters for the two modified electrodes.
As can be seen in Table 2, the G9 electrode exhibits a lower Tafel slope value, which indicates faster OER kinetics. However, the electrode also exhibits a higher overpotential value.
The OER experiments from the previous study were performed only in 0.1 mol L–1 KOH electrolyte solution, but Menezes et al. [23] investigated the catalytic properties of Ni11(HPO3)8(OH)6 in 1 mol L–1 KOH solution as well. A comparison between the OER electrocatalytic activity in this strong alkaline medium of the best electrode identified by the researchers (nickel phosphite electrophoretically deposited on nickel foam) and that of the G9 electrode evidenced similar Tafel slope values of 0.111 V dec–1 for G9 and 0.091 V dec–1 for the reported sample. As for their OER overpotential values at 10 mA cm–2, these were 0.47 V for the former and 0.232 V for the latter. Additionally, for comparative purposes, it should be pointed out that the IrO2 and RuO2 OER overpotential values at i = 10 mA cm–2 and in alkaline medium were reported as 0.45 V and 0.42 V, while their Tafel slope values were found to be 0.083 V dec–1 and 0.074 V dec–1 [42,43,44].
Table S1 (see the Supplementary Materials) shows the OER electrocatalytic performance of the G9 electrode and that of other electrocatalysts reported in the scientific literature. The presented data indicate that, in most cases, the reported OER overpotential and Tafel slope values are smaller than the ones obtained for G9, and this points to a requirement for further experiments aimed at identifying a nickel phosphite-based composition that will display an improved OER activity. Regarding the more recent studies mentioned in Table S1, some of them evidenced specimens with catalytic activity surpassing that of G9 in terms of both overpotential and Tafel slope, while others outlined modified electrodes that exhibited a lower activity than the electrode identified in the current study. In the first type of investigations, the composite Co-Fe-1,4-benzenedicarboxylate catalyst displayed an OER overpotential of 0.295 V and a Tafel slope of ~0.035 V dec–1 [45], while for FeNi metal–organic framework nanoarrays on Ni foam, an overpotential of 0.213 V and a Tafel slope of ~0.052 V dec–1 were found [46]. In the second type, electrodes manufactured either with a composition containing MnO2 [47] or with a Pt(II)-porphyrin [14] revealed OER overpotentials of either 0.53 V or 0.64 V. The requirement for further experiments is also indicated by the stability test result that outlines a lower degree of stability vs. that of IrO2, considered highly stable in the rough oxidizing conditions of the OER [48,49].
3.2. Physicochemical Characterization and Fluorescence Study
The multifunctionality aspect of these phosphate materials [24,50,51,52] has led us to the study of their fluorescence properties. It is known that the fluorescence spectrum can be influenced by the morphology of the materials [53], and in this context, a new nickel phosphite sample was obtained by using a slightly modified low temperature and pressure hydrothermal synthesis [54]. The starting reactants—NaH2PO4•H2O (0.2758 g), NiCl2•6H2O (1.0228 g), and CH3COONa•3H2O (1.8958 g)—were introduced in a Teflon steel autoclave (total volume of 65 mL) filled at 80%, and the thermal treatment occurred at 200 °C for 48 h. In the following, in order to distinguish between both materials, this sample obtained by low-temperature and low-pressure hydrothermal synthesis will be denoted SLowTP, and the material described in the previous section, obtained by high-temperature and high-pressure synthesis, according to [24], will be denoted SHighTP.
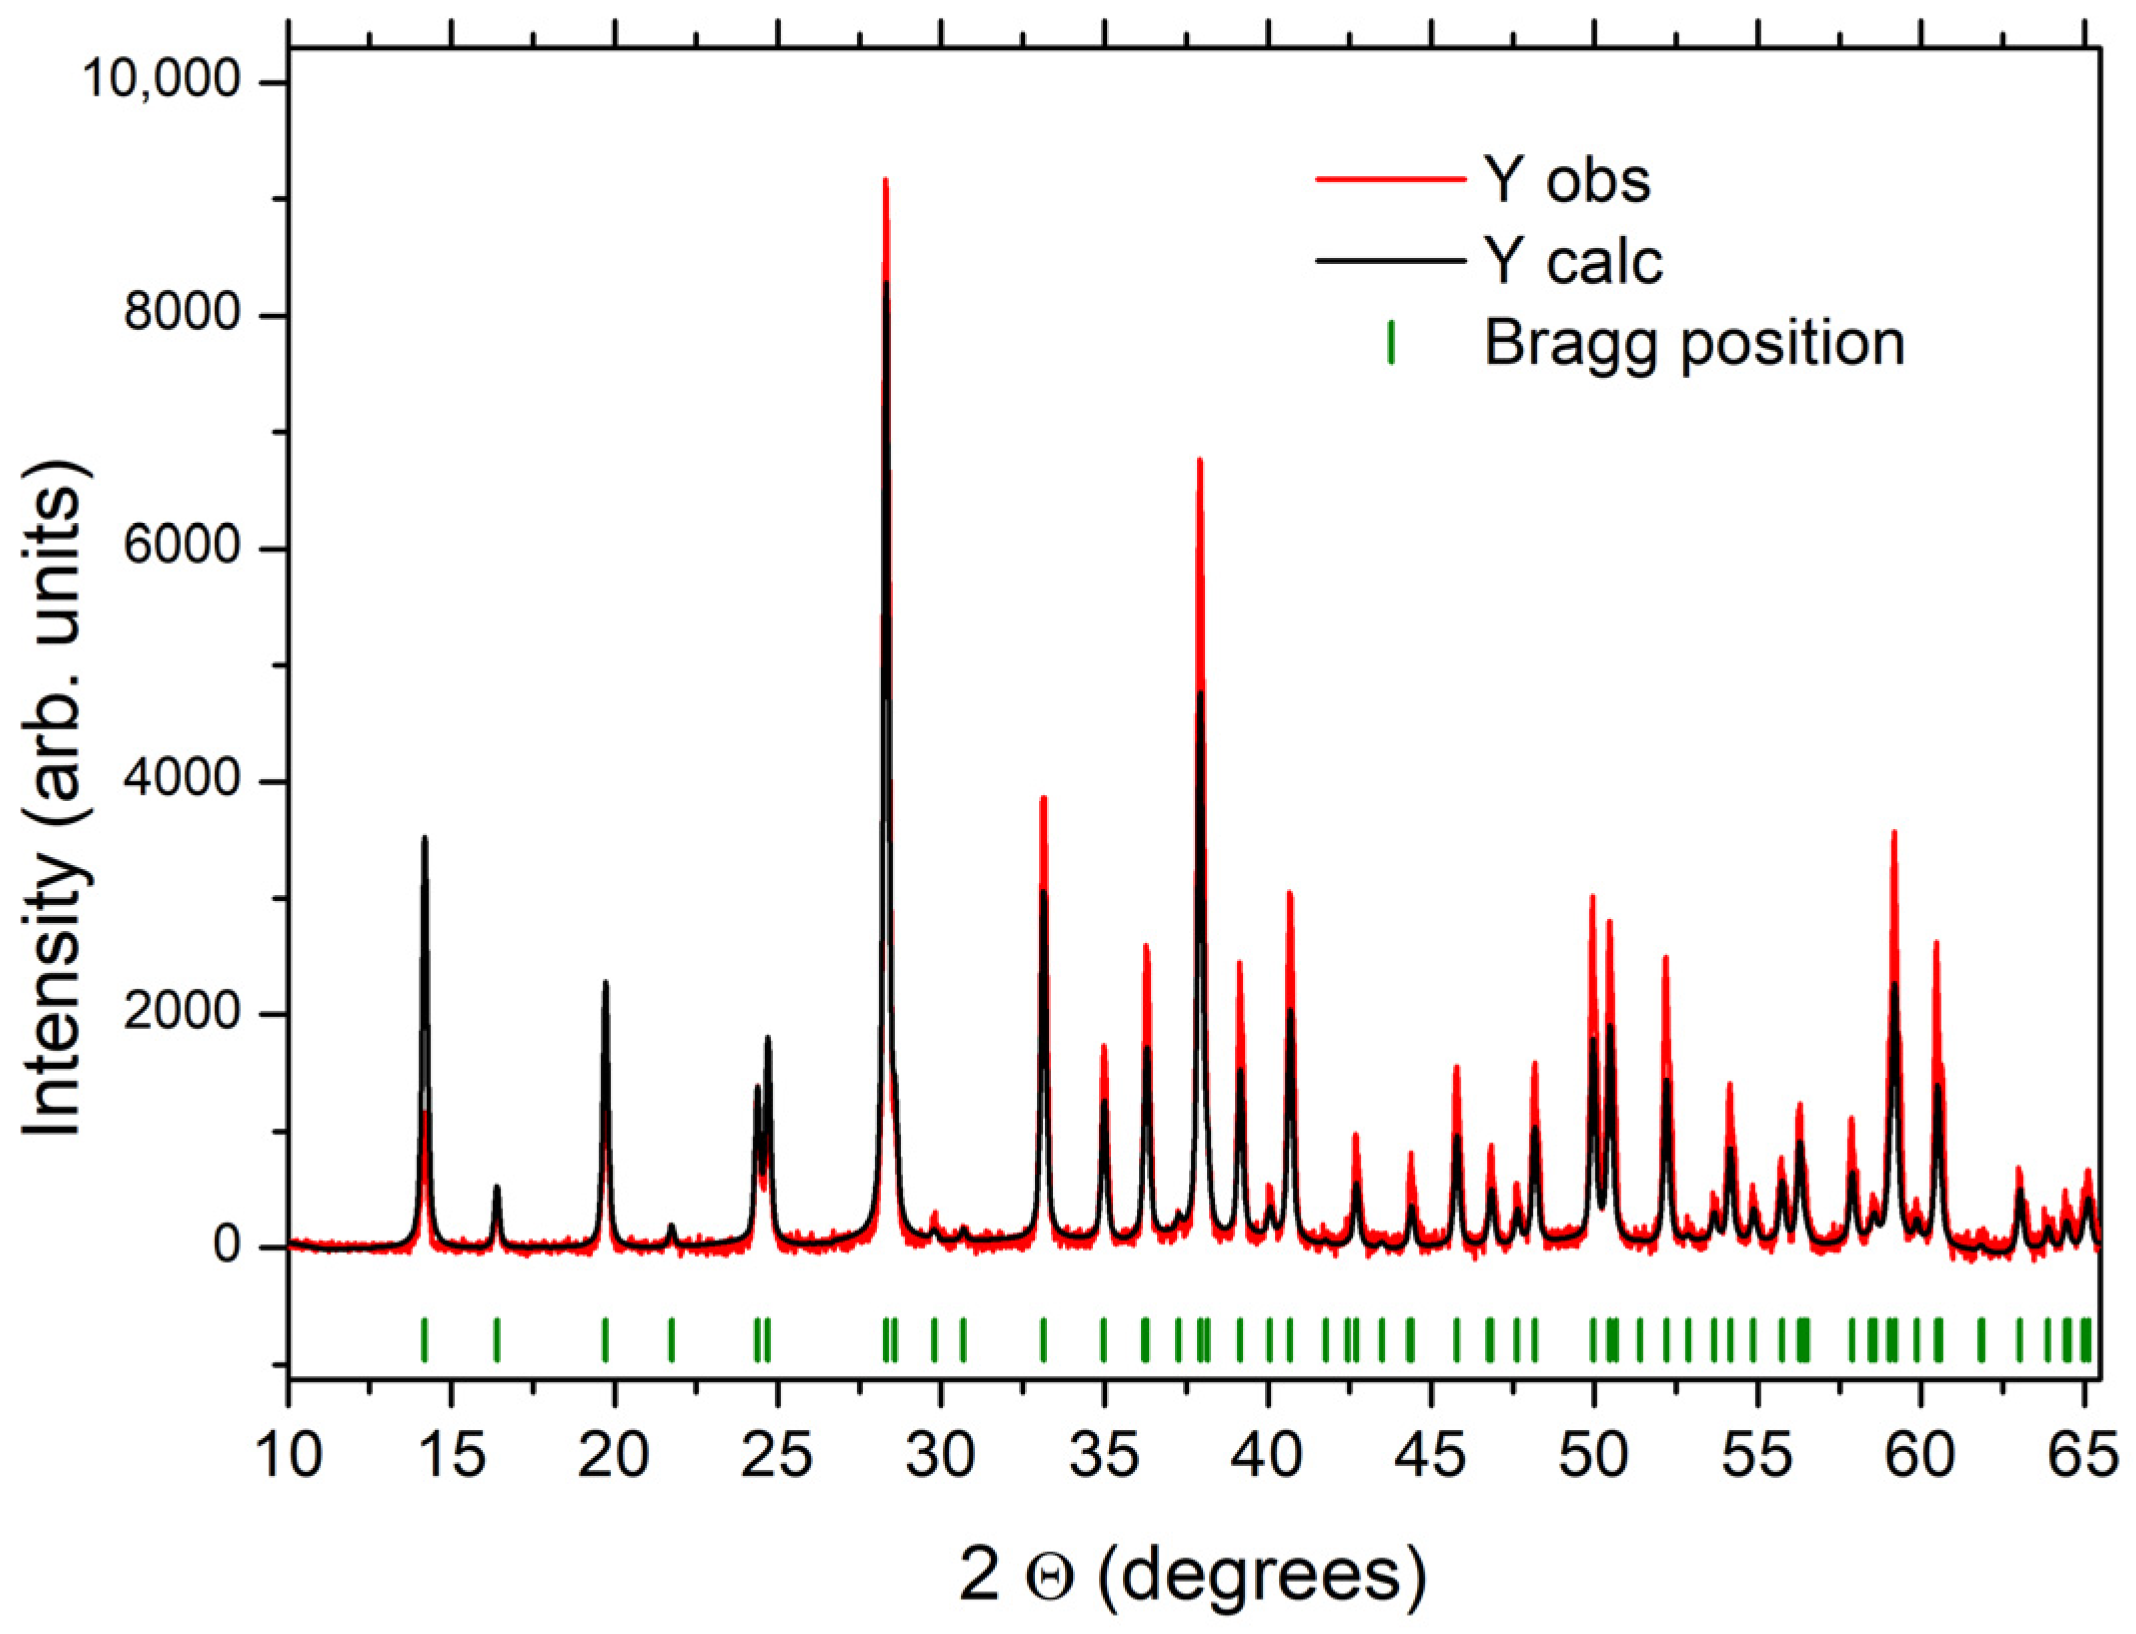
The XRD analysis by Rietveld refinement (Figure 5) shows that the SLowTP compound was well crystallized, and the calculated lattice parameters were as follows: a = b = 12.4764 (4) Å, c= 4.9464 (2) Å, and P63 mc space group—parameter values in accordance with the literature [24,25,55]. The P63mc space group was used also to index the crystallized ShighTP samples obtained for this study, as in [25].
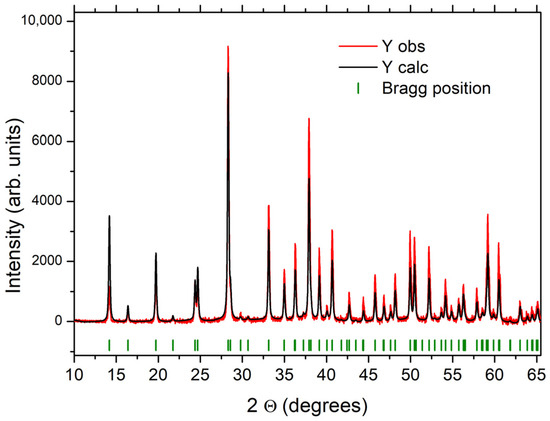
Figure 5.
Rietveld refinement of the X-ray Diffractogram for the SLowTP sample in the P63mc space group. The experimental XRD pattern is a red line, the calculated pattern a black line.
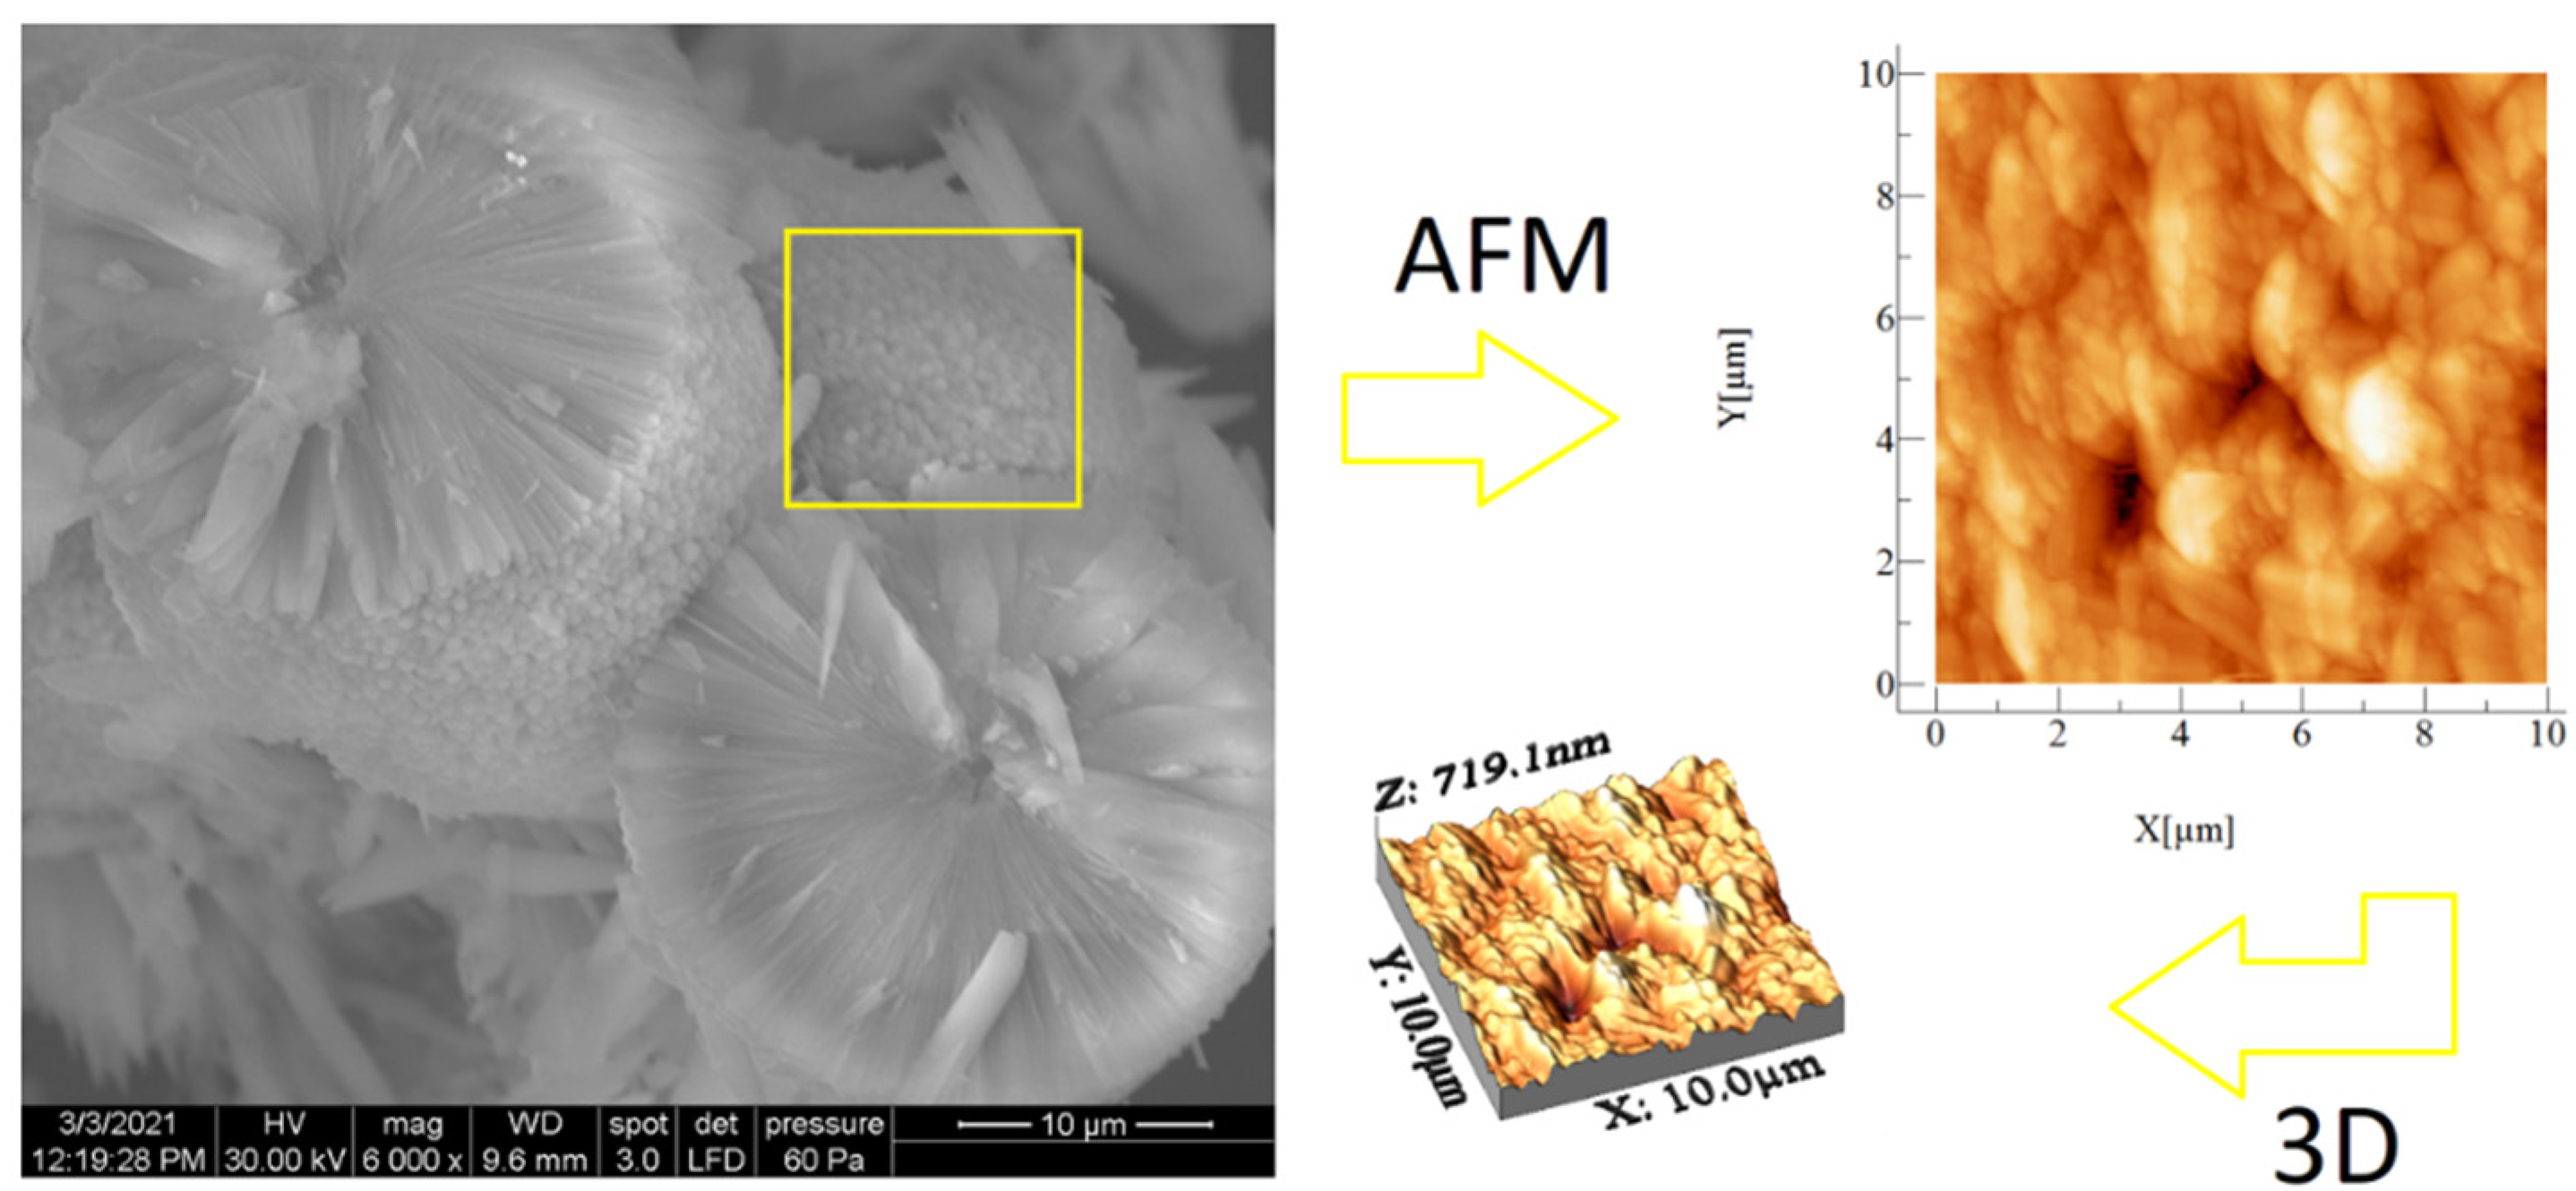
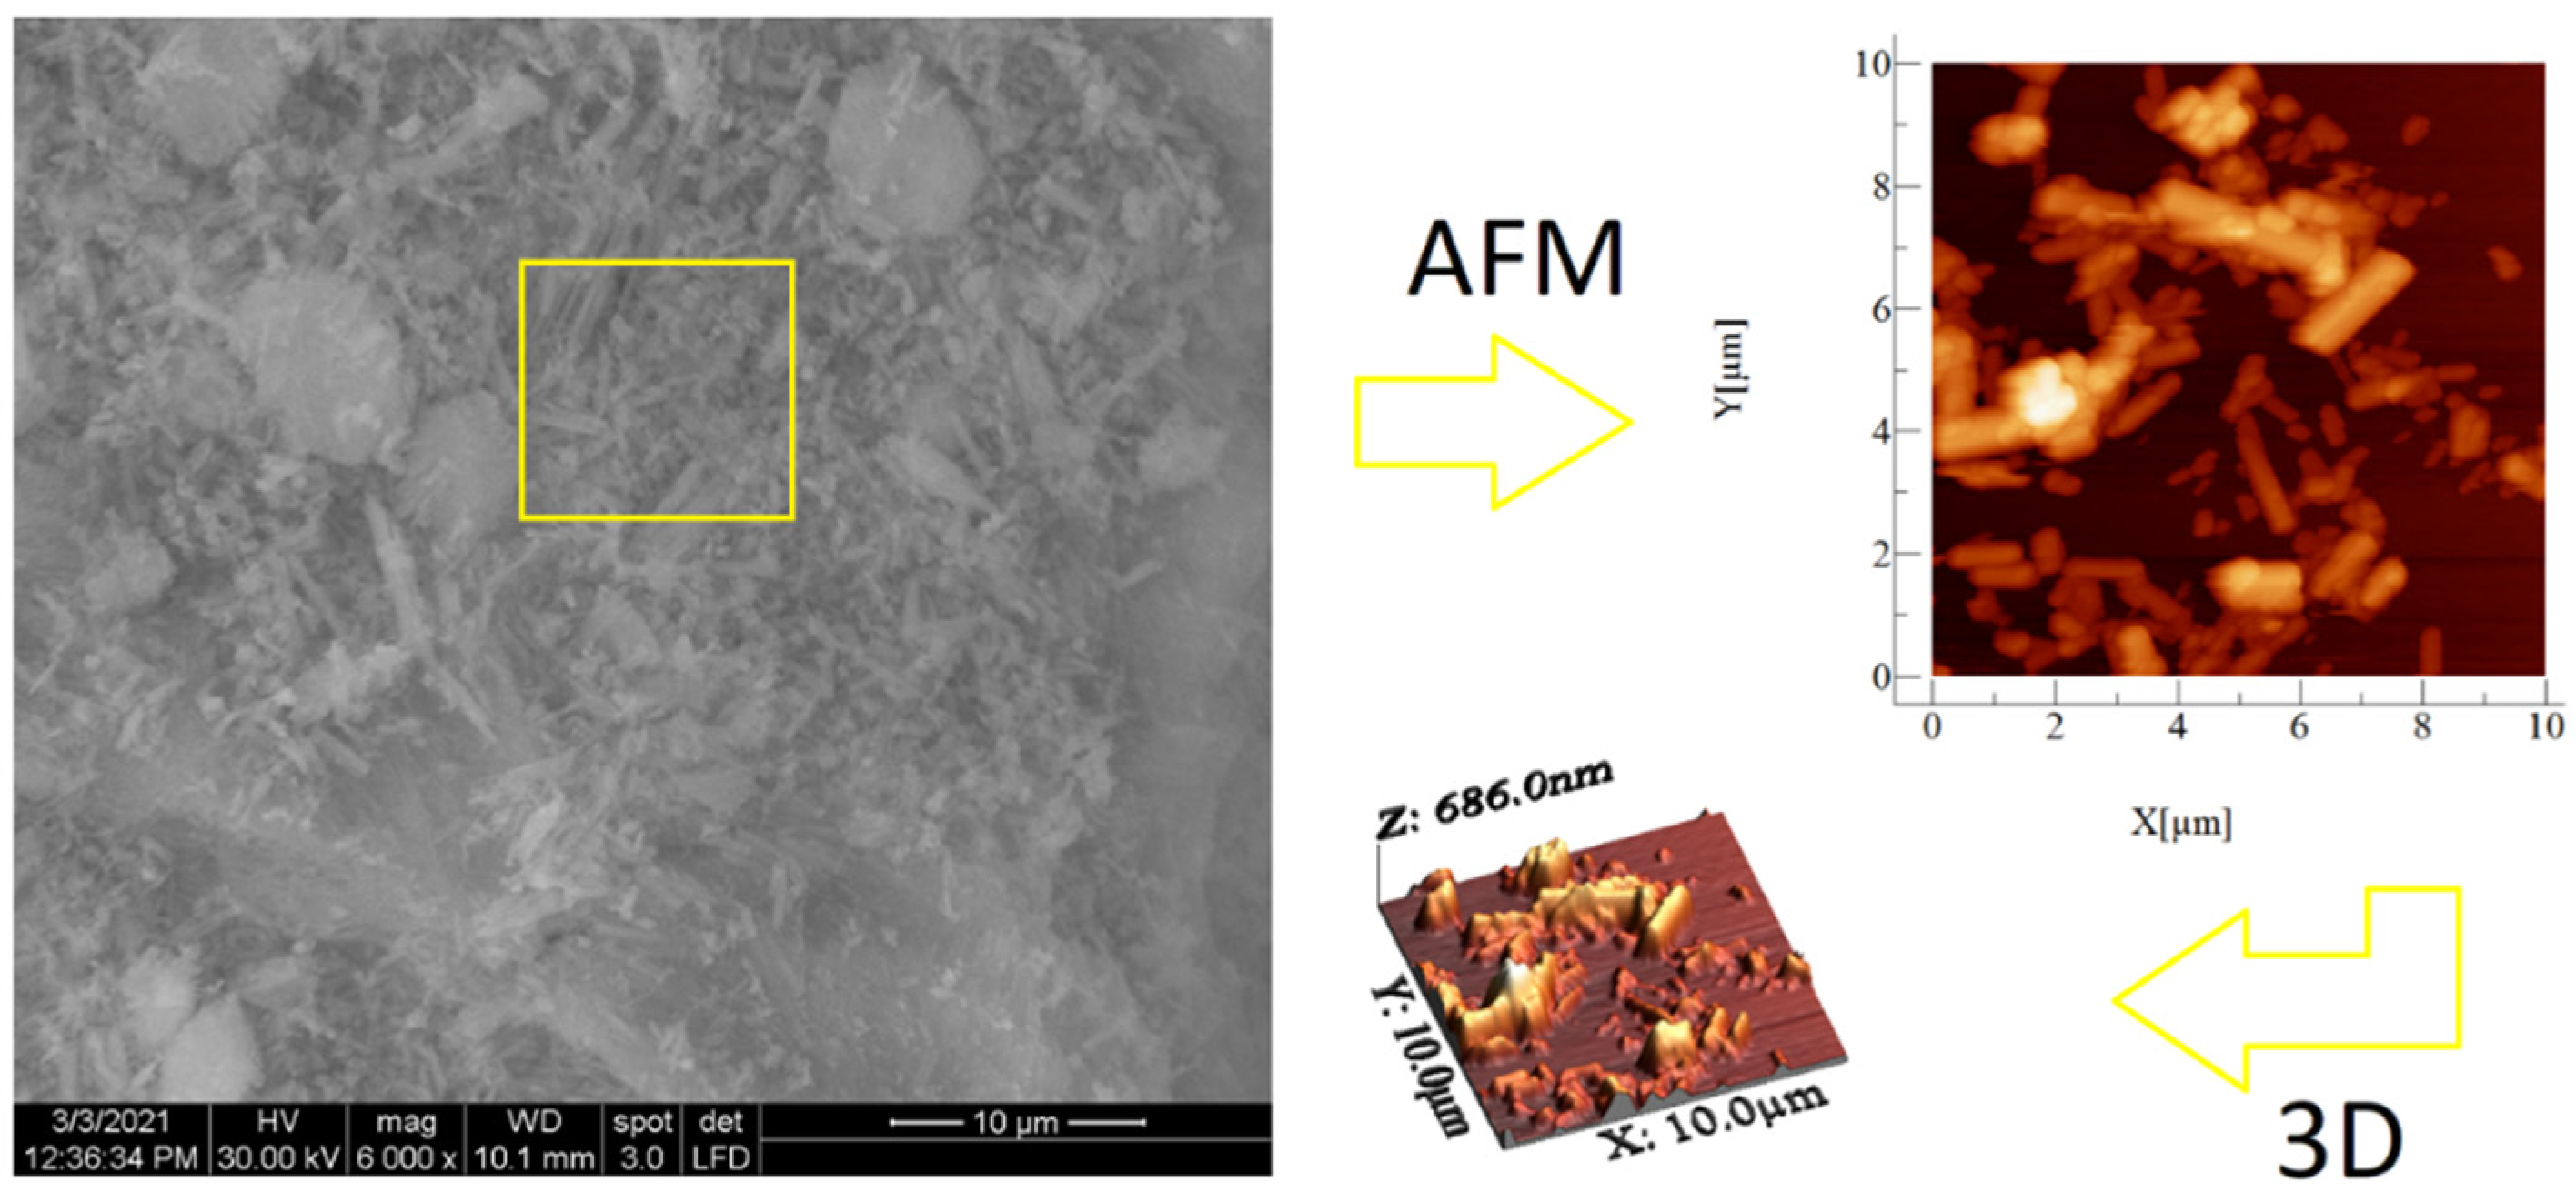
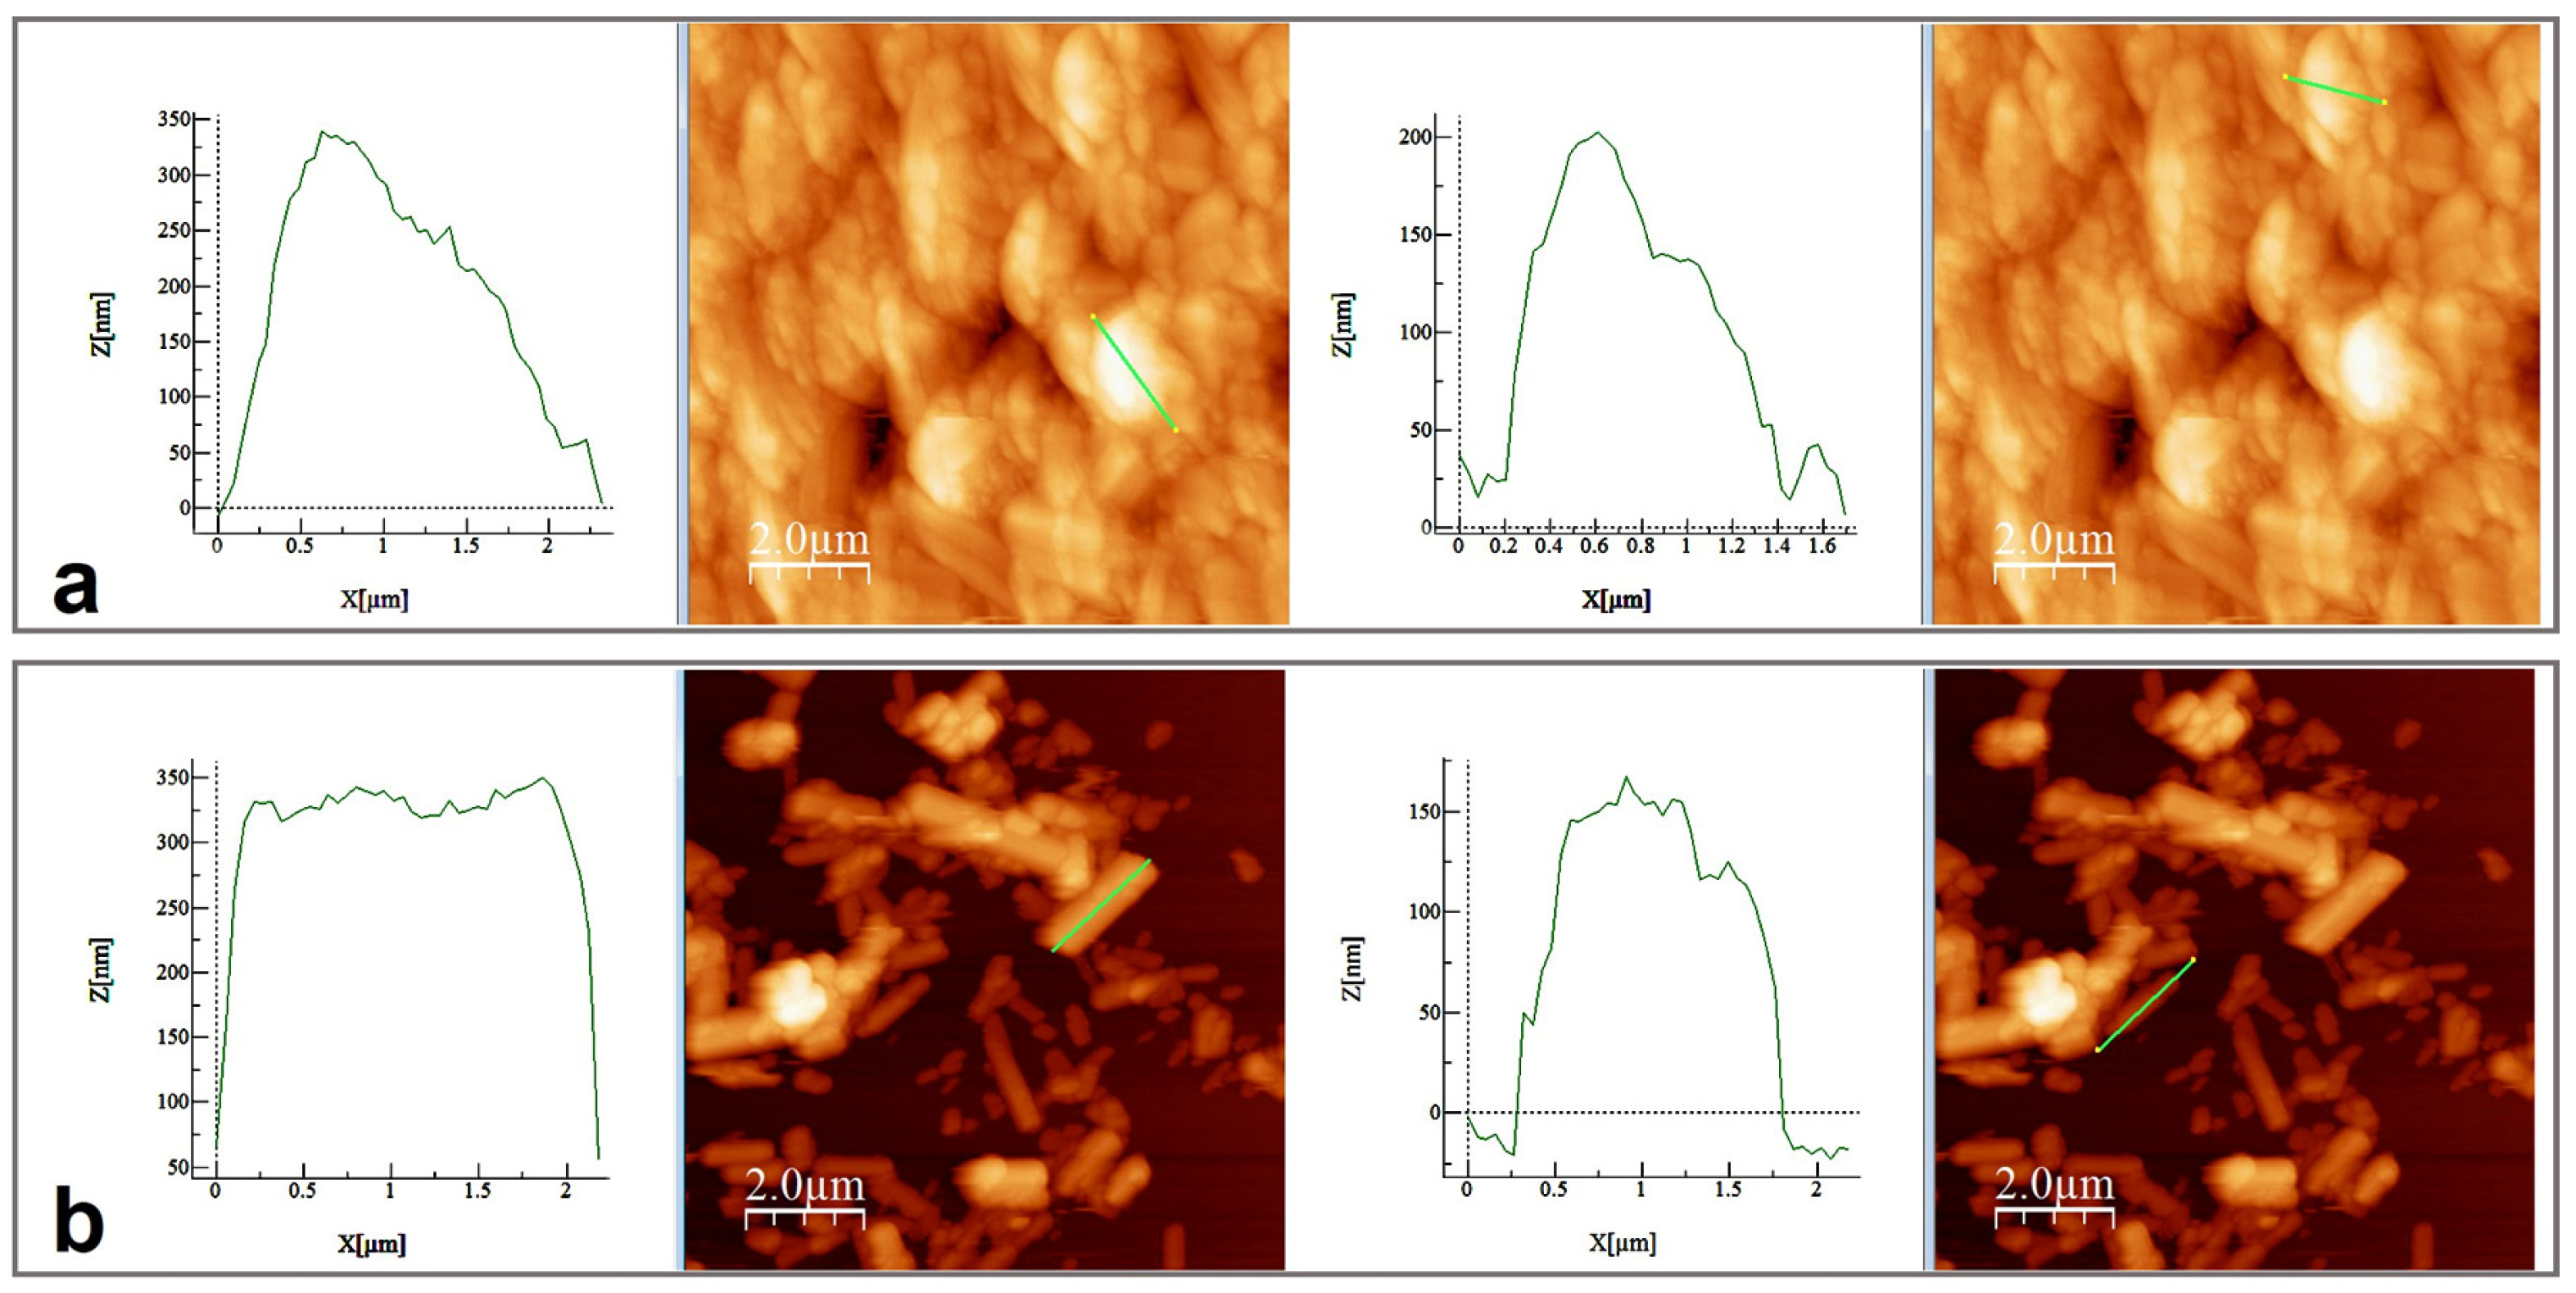
SEM and AFM analyses performed for both samples are presented in Figure 6 and Figure 7. SEM images revealed spherical superstructures made of platelet-like particles (SLowTP) in Figure 6 and rods with sparse round-like formations (SHighTP) in Figure 7. Thereby, it was difficult to obtain AFM images on certain areas of SLowTP where the plates are present, due to the existence of large heights (>2 µm) and abrupt differences (Figure 6a). In the SHighTP sample, the rod-like morphology predominated with a smaller proportion of round particles (Figure 7b), as seen in the SEM image as well. Round formations from the AFM analysis may be a result of the sample preparation process. Furthermore, individual areas were selected and measured; the height and width of some formations are shown in Figure 8.
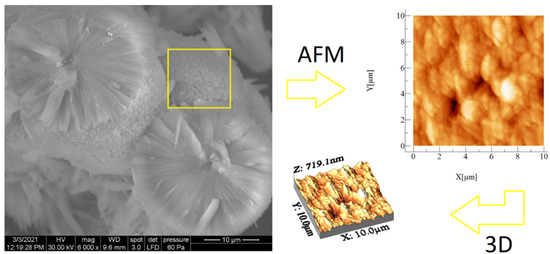
Figure 6.
SEM and AFM images at different scales for the SLowTP sample. The yellow square on the SEM image it’s indicative of the surface area analyzed by AFM (image at right).
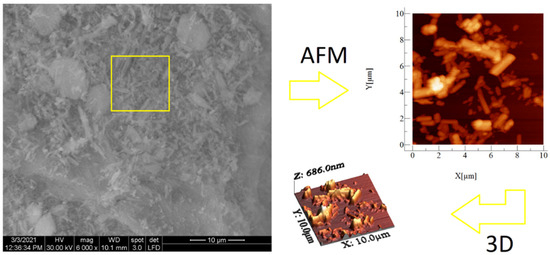
Figure 7.
SEM and AFM images at different scales for the SHighTP sample. The yellow square on the SEM image it’s indicative of the surface area analyzed by AFM (image at right).
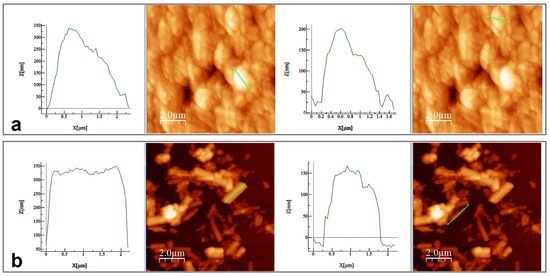
Figure 8.
Height and width measurements on the selected area for SLowTP (a) and for SHighTP (b).
Table 3 displays the values obtained for several AFM parameters in the case of the SLowTP and SHighTP samples.

Table 3.
Calculated values from AFM images—Average roughness (Sa), Mean square root roughness (Sq), Maximum peak height (Sp), Maximum valley depth (Sv), and Maximum peak-to-valley height (Sy)—for SLowTP and SHighTP.
The iron area in the AFM technique depends on the majority of asperities being found on the material surface, and usually, a smoother surface is characterized by a lower value for this parameter. Sp and Sv are the indicators for the highest peaks and the lowest valleys present in the analyzed area and, together, determine the Sy value. This latter parameter reveals the compaction of the deposited material or some information about the surface homogeneity. The roughness is obtained from both Rq and Ra, whereas the Sy value may indicate which sample displays a predominant tendency for valleys or heights. The results show higher roughness values for SHighTP and the highest Sy value for SLowTP. SLowTP had lower valleys (Sv = −0.336 µm for SLowTP and −0.049 µm for SHighTP) in comparison to SHighTP with higher Sp values (0.352 µm for SLowTP and 0.636 µm for SHighTP). The obtained data are explained by the fact that the rods (SHighTP) were placed one on another randomly, forming angles and, therefore, higher heights, whereas the conglomerates (SLowTP) were packed very closely, therefore influencing the main line calculus formula for the Sp value and Sv value, respectively [56].
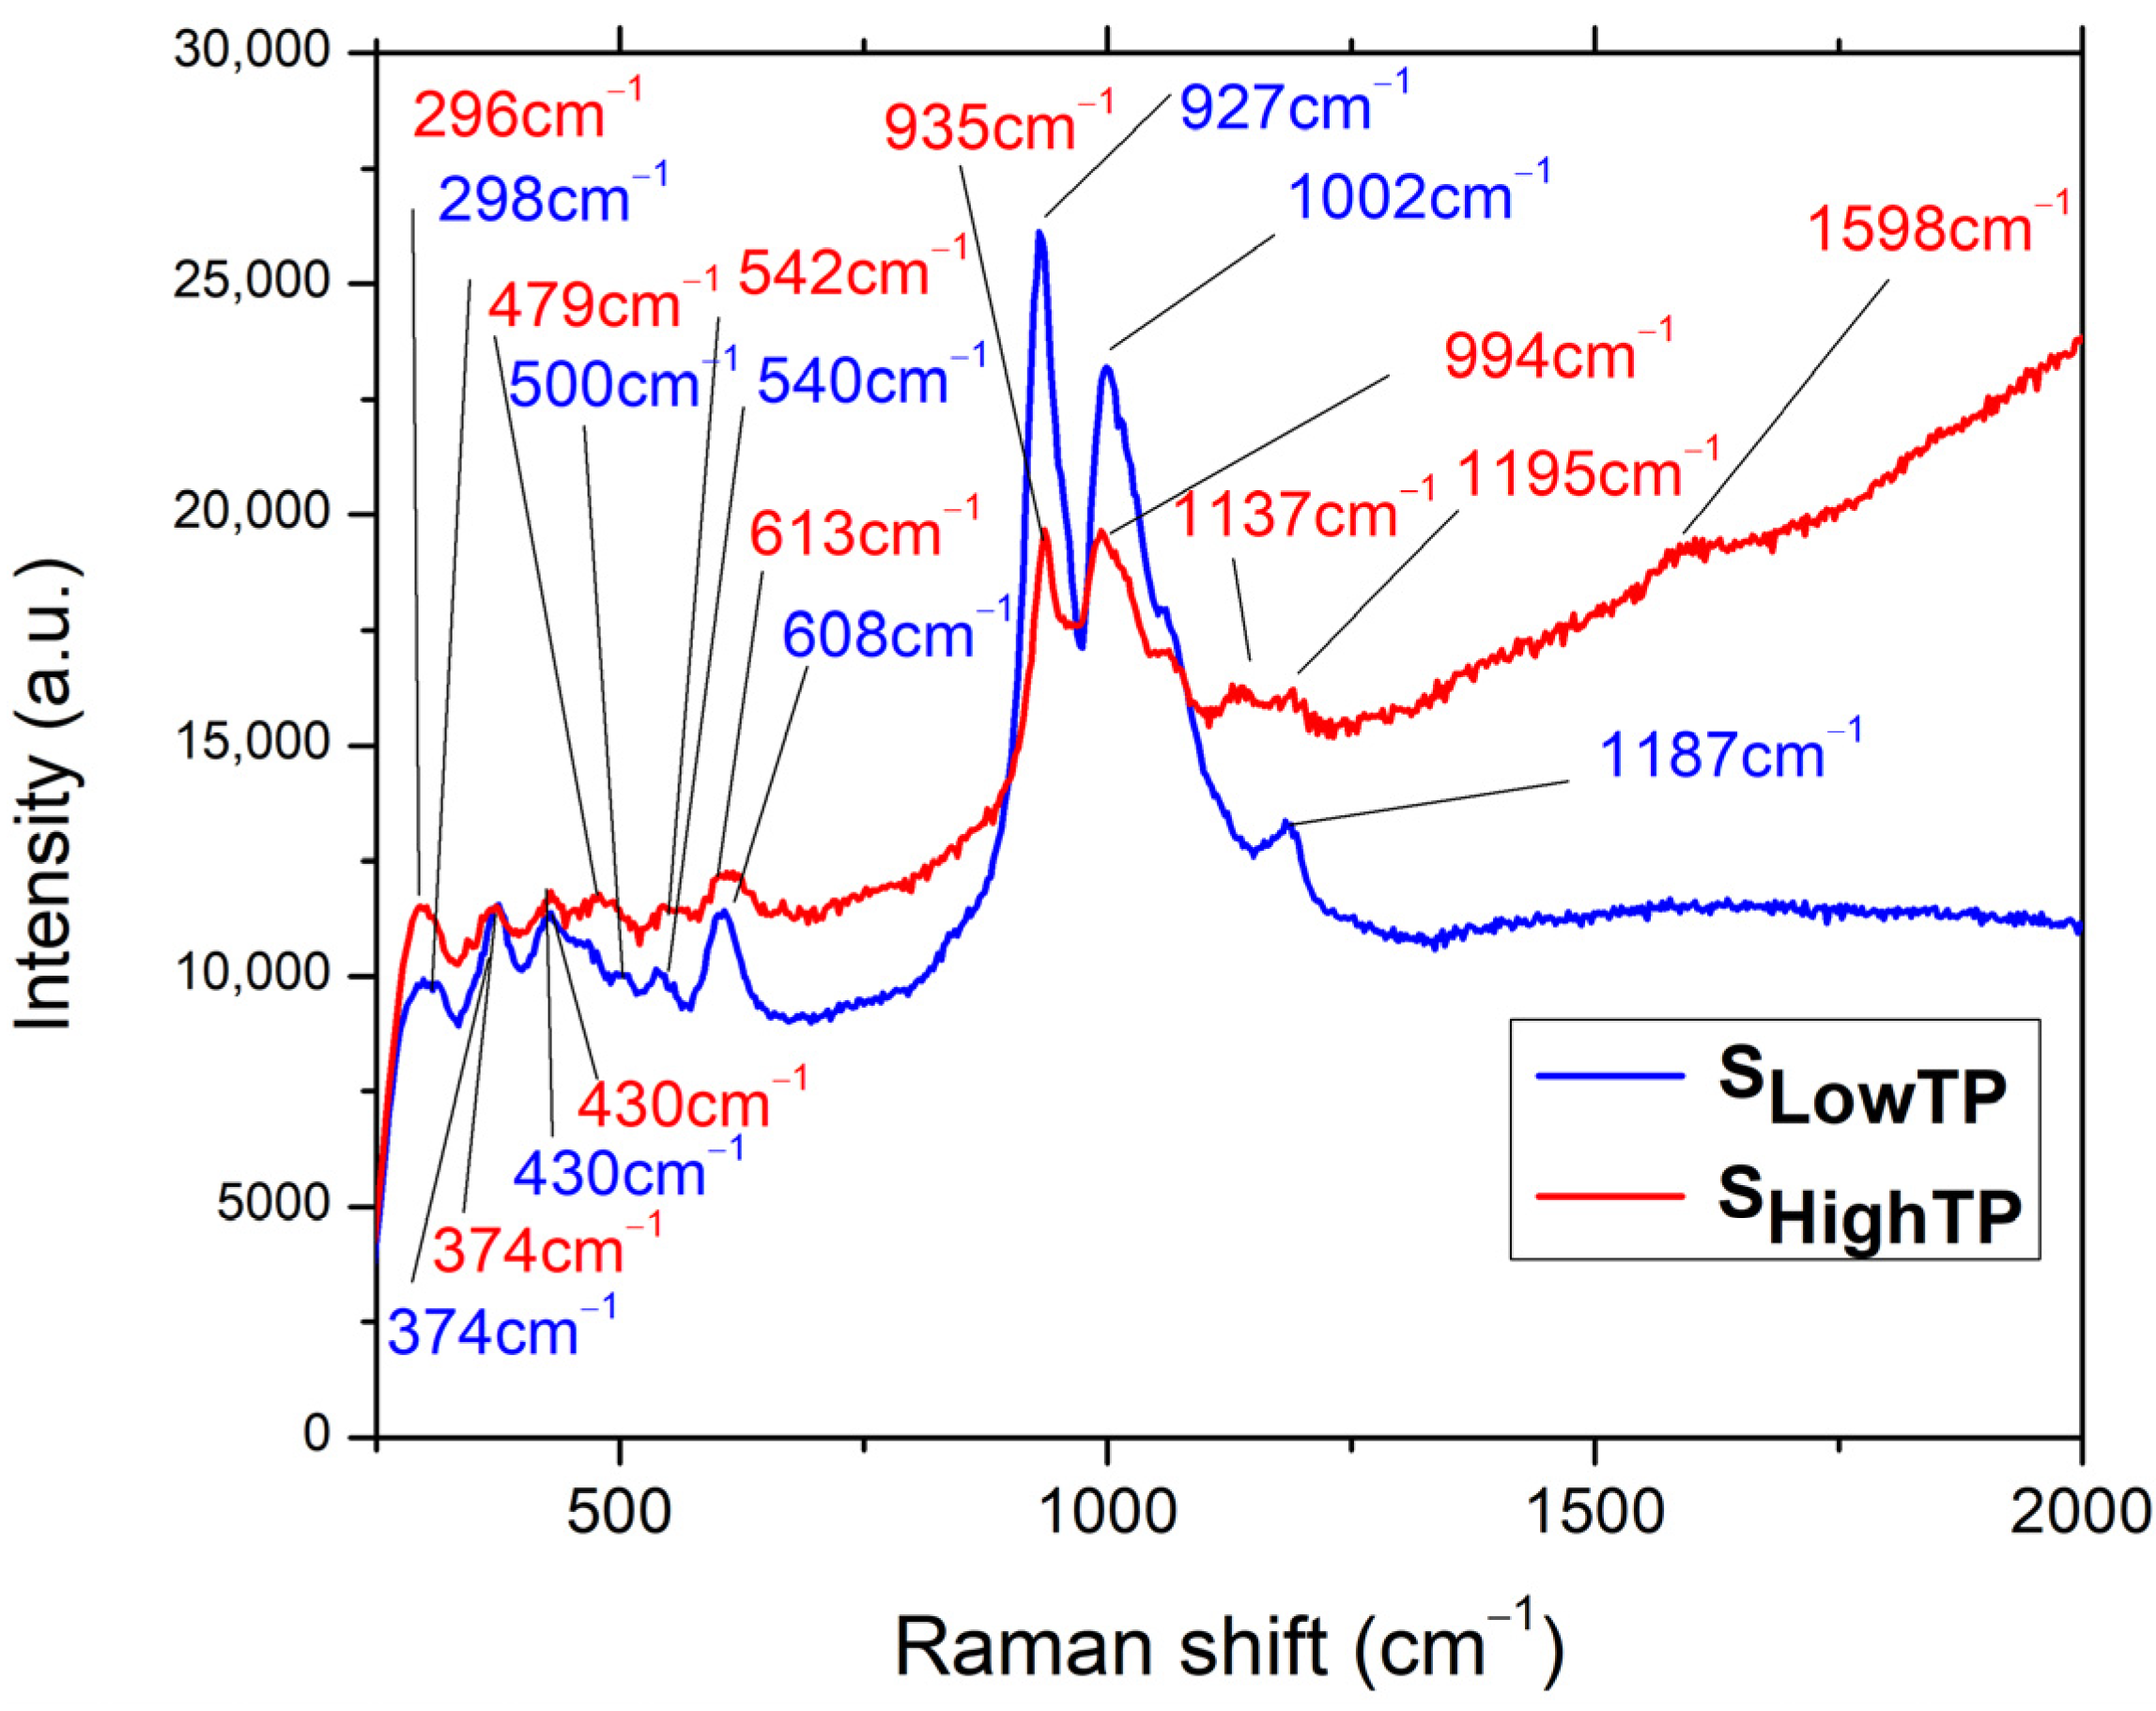
A Raman analysis was performed on both SLowTP and SHighTP materials (Figure 9), for which the fluorescence properties are characterized in the last part of this research work. The following bands can be observed for the SLowTP sample: 298, 374, 430, 500, 540, 608, 927, 1002, and 1187 cm–1. There are more bands outlined in the spectrum of SHighTP: 296, 374, 430, 479, 542, 613, 935, 994, 1137, 1195, and 1598 cm–1. As it can be seen, some SHighTP bands are slightly shifted compared to the SLowTP ones, and this could be due to the different sample morphology, since it has already been shown for other materials that Raman scattering spectra can depend on the morphology of microparticles [57].
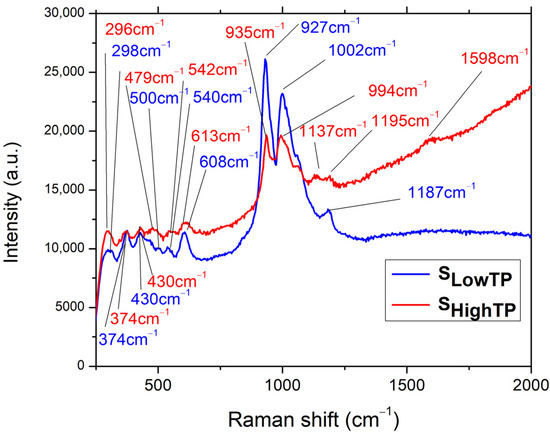
Figure 9.
Raman spectra for SLowTP and SHighTP.
As assigned in [24], for the Ni11(HPO3)8(OH)6 compound, which was from the same batch as SHighTP from this study, the (PO4)3– ions are indicated by the 380 cm–1 band, which may also include the PO3 deformations and rocking modes, whereas, at 296 cm–1, POP deformations may take place. In the case of SLowTP, a small band at 500 cm–1 is observed that was not registered in SHighTP and was not evidenced in the previous study either. The band located at 474 cm–1 in [24] is also present at 479 cm–1 for SHighTP and as a shoulder for SLowTP and corresponds to the PO3 symmetric and asymmetric deformations. In the same region (470–500 cm–1), overlapped Ni-O bond bands are expected and are responsible for the peak-broadening evidenced for both SLowTP and SHighTP materials. When comparing the present results with the previously reported ones [24], the general tendency of the bands is to blueshift. The differences observed in the Raman spectra for the samples coming from the same batch, SHighTP from this study, and the previously studied Ni11(HPO3)8(OH)8 in [24], may be due to the fact that the Raman analysis is focused on small amounts of material, whereas a large quantity of materials was obtained from the hydrothermal synthesis at a high pressure and temperature. Due to this, it could be that some inhomogeneities were present in the products from the synthesis or from the autoclave.
In comparison with the Ni11(HPO3)8(OH)8 Raman spectrum from [24], a higher intensity is noticed for the bands at 608 cm–1 (SLowTP) and 613 cm–1 (SHighTP), respectively. These are connected to the 474–479 cm–1 region referring to the symmetric and asymmetric PO3 deformations. The highest difference is detected in the 900–1000 cm–1 region, where the SLowTP is distinguished from the other two samples, displaying the most intense peak at 927 cm–1, followed by the one at 1002 cm–1. In the case of SHighTP, both peaks have the same intensity and are slightly shifted in relation to SLowTP. The specified bands are owed to the PO3– symmetric and asymmetric stretching vibrations and are the most prominent changes in the sample. In the same domain, NiO bands are expected and are less visible as a result of overlapping with the PO3 bands, followed by the broadening of the specific peaks (994 cm–1 and 1002 cm–1, respectively) [24].
By comparison with the previous study [24], a lower intensity is observed in the 1137–1197 cm–1 region. For the SHighTP sample, splitting of the peak at 1137 cm–1 could take place due to the secondary phases and is accompanied by the red shift occurrence [58]. Compared to SLowTP, the red-shifted bands of SHighTP are also broader, and this may be attributed to the material synthesis, as suggested in the literature [59,60]. The differences between the Raman spectra of the SLowTP and SHighTP samples can be attributed to their different morphology, synthesis method, and even to the presence of any impurities. Nguyen et al. [59] confirmed the fact that phonon wavenumbers and the line shape depend strongly on impurities or doping, indicating a lower symmetry of the crystal structure. Their XRD analysis revealed no noticeable differences, as was also the case with the current study, in which impurities such as barbosalite Fe3(PO4)2(OH)2 could have been present in the SHighTP sample obtained by high-temperature and high-pressure hydrothermal synthesis, as mentioned in [25].
The low intensity peak (1598 cm–1) corresponding to the O-H stretching vibration is observed only in the case of SHighTP and is red-shifted in relation to Ni11(HPO3)8(OH)8 (1580 cm–1) [24].
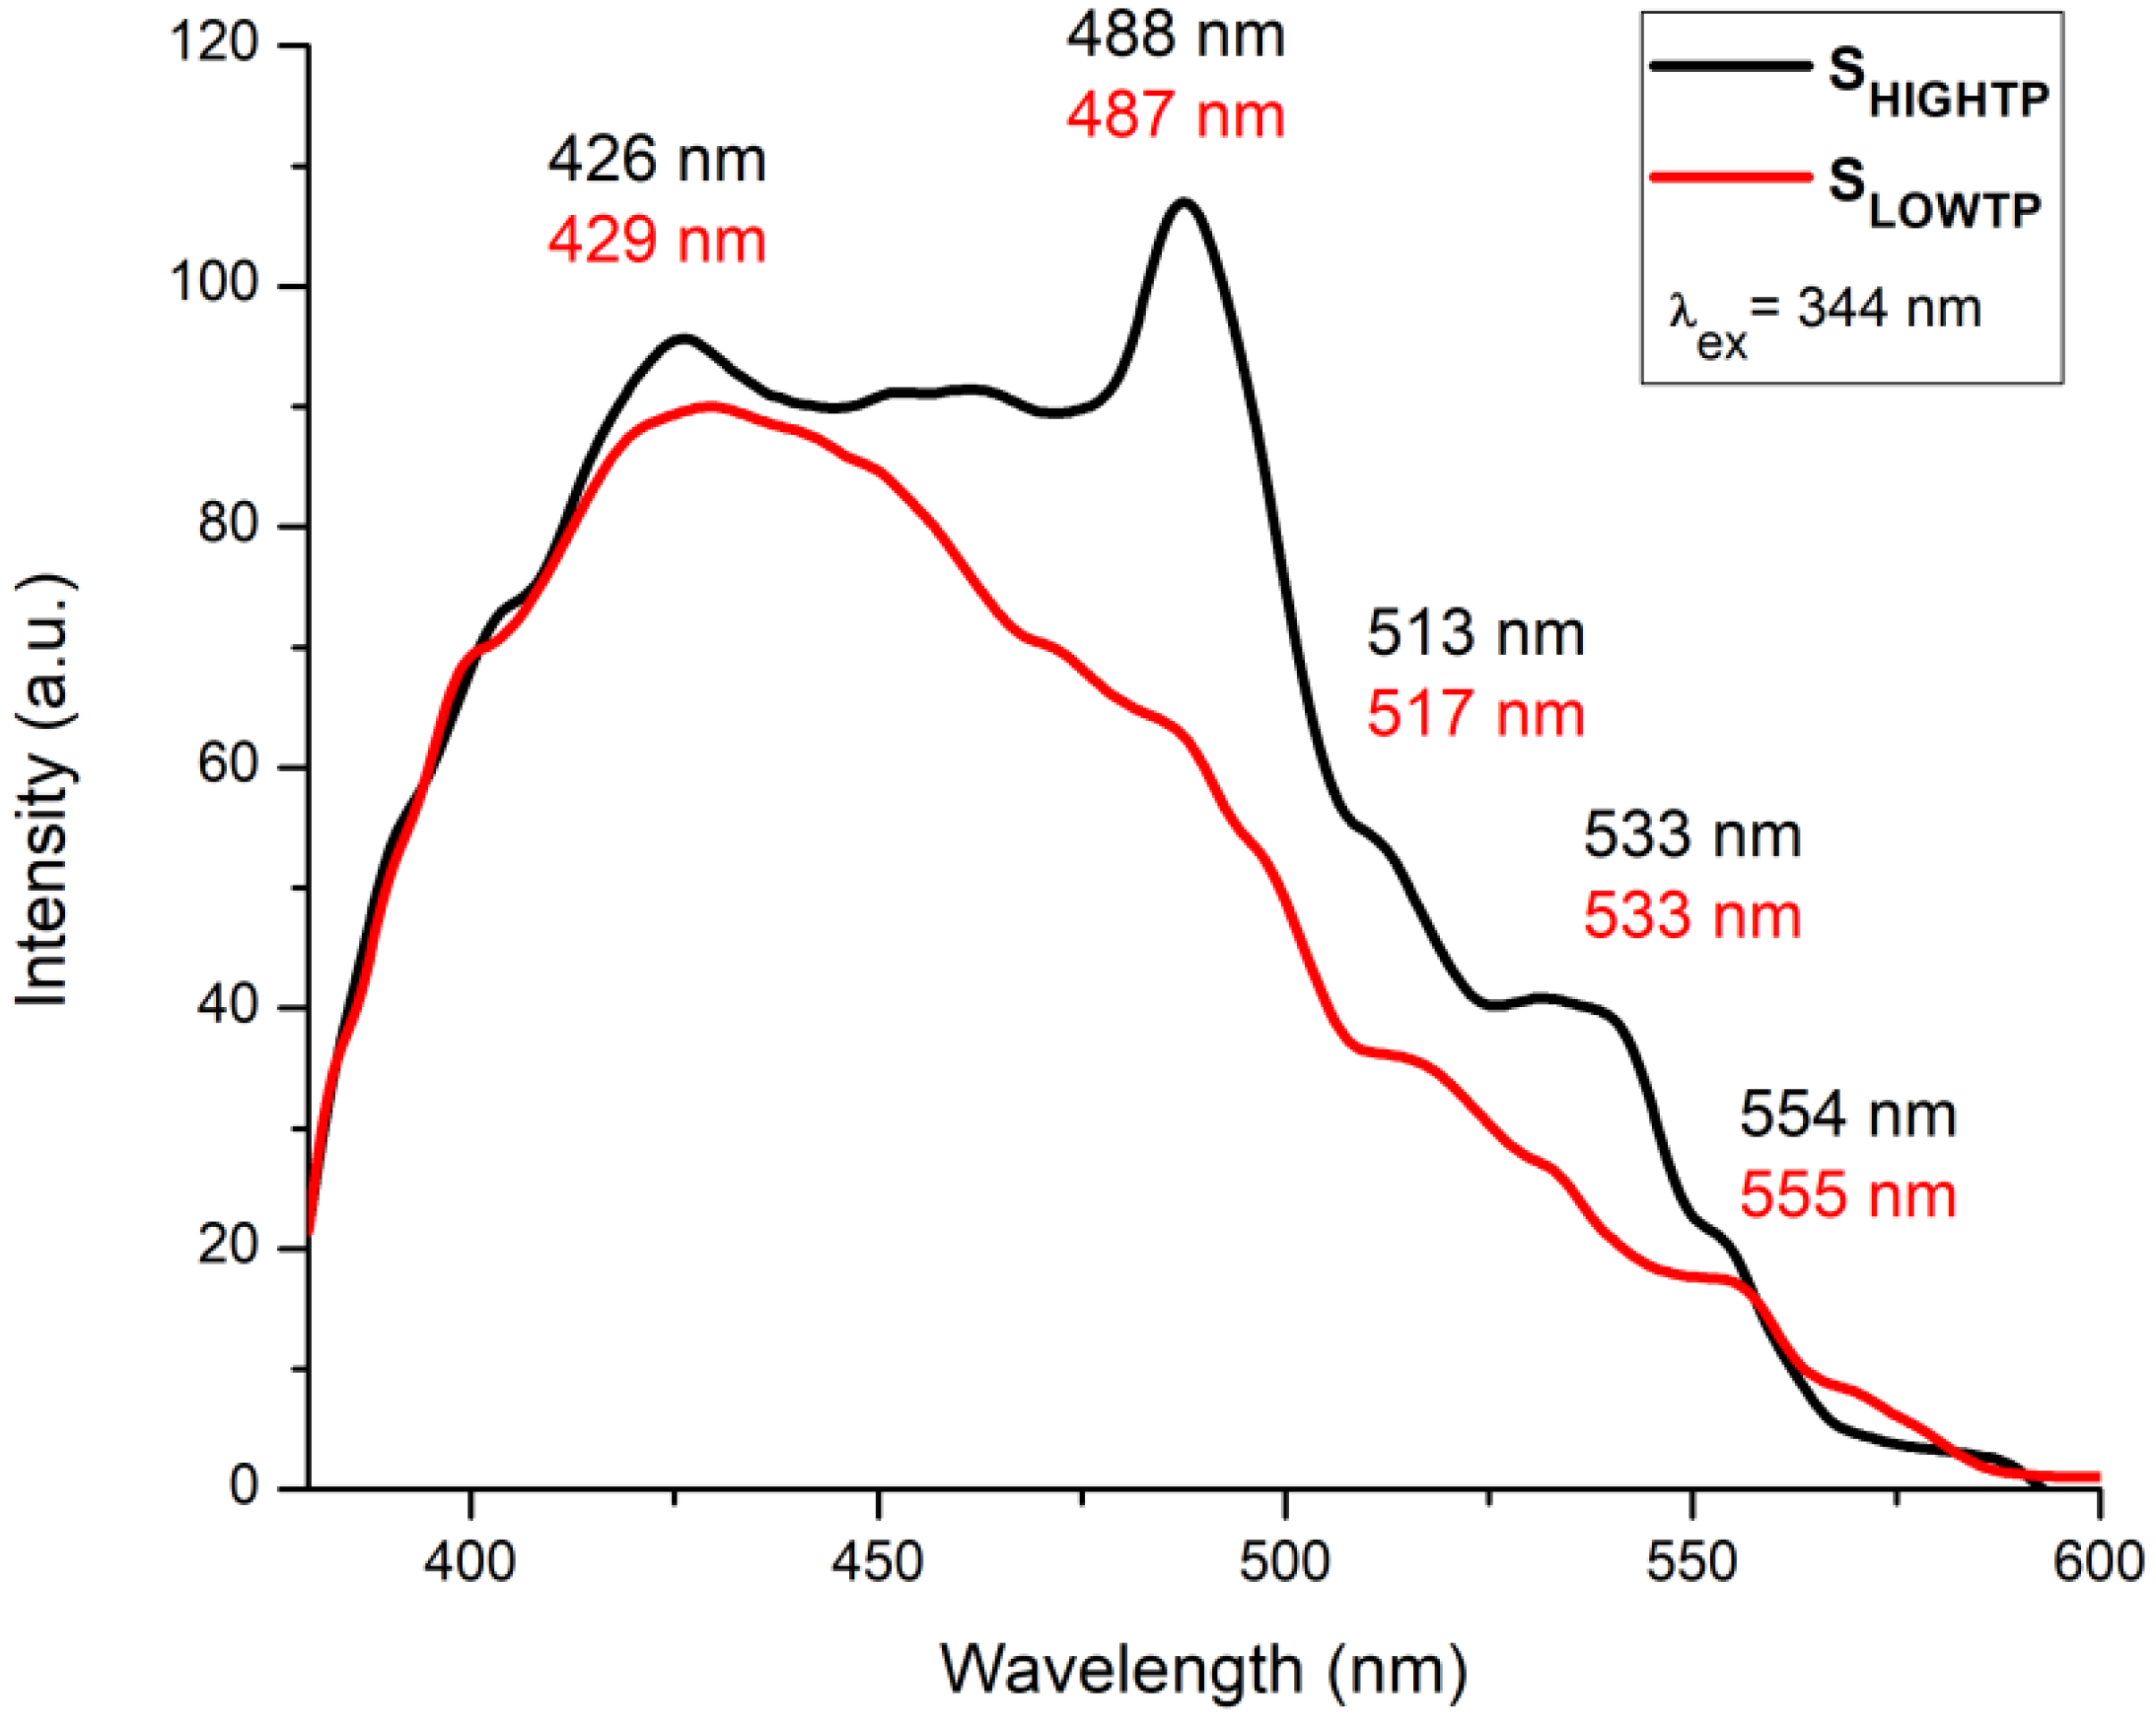
The fluorescence measurements (Figure 10) indicate some differences between the studied SLowTP and SHighTP materials. Several bands can be observed in the 405–600 nm spectral range, with maxima at 426, 488, 513, 533, and 554 nm for SHighTP and 429, 487, 517, 533, and 555 nm for SLowTP. The differences between both materials are not only registered by the shift of the bands but also by the intensity of their maxima. For certain materials, it has been previously reported in the literature that their morphology has an influence on the obtained fluorescence results, which is usually represented by the quenching of the spectra [61,62]. Quenching may appear when the reducing of the radiative recombination of the electron and hole takes place and/or due to a lower electron–hole recombination rate [62]. Some other factor could influence the fluorescence spectra, such as the surface roughness due to the excitation of electrons from occupied d bands into states above the Fermi level [62]. In this context, the materials with higher roughness may show increased fluorescence as a consequence of the electron excitation, which is confirmed by the present results, since both AFM roughness and fluorescence intensity values showed this to be the case for SHighTP. The fluorescence intensity also usually decreases with the decreasing sizes of the crystallites, but at the same time, the morphology may also play a major role, as it can cause an increase in a specific area as a result of surface defects, strain/stress effects, or other changes [53]. According to the literature, the expected bands for the Ni-O bond are in the blue emission region, more precisely centered between 424–433, 448–463, and 484–491 nm [63,64]. In the current study, as can be seen in Figure 10, the most intense bands are located in the aforementioned areas but much better outlined in the case of SHighTP. Another band that is usually specific for M-O bonds is centered at 518–524 nm in the green emission area and is due to the enhanced oxygen vacancies [64]. Phosphors show broad emission bands in the 300–350 nm wavelength range in the case of NaGd(PO3)4:Ce3+ materials [65], thus not possible to be put as evidence for the materials studied in this work.
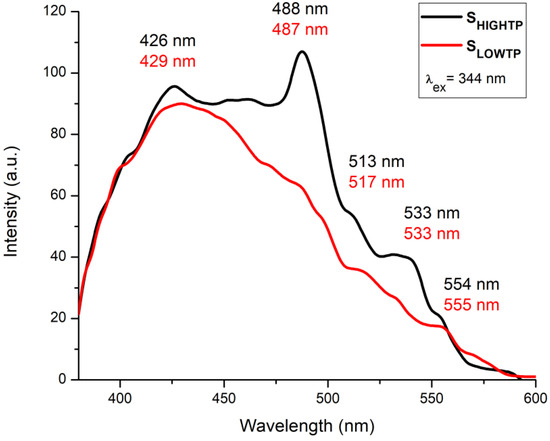
Figure 10.
Fluorescence emission spectra obtained at RT for SLowTP and SHighTP in the 380–600 nm range, excitation at 344 nm.
4. Conclusions
The OER activity of several graphite electrodes modified with Ni11(HPO3)8(OH)6, carbon black, and rGO was investigated electrochemically in an alkaline medium. The polarization curves recorded on the electrodes show that the sample modified with 1 mg nickel phosphite, 5 mg carbon black, and rGO exhibited the highest anodic current density values. This behavior can be explained in terms of the synergistic effect of the nickel phosphite and the carbon materials. The electrochemical study outlines the OER performance of the nickel phosphite-based electrodes, as well as their limitations. Different hydrothermal synthesis conditions influenced the morphology of the obtained nickel phosphite materials, the existence of rods and plates being observed through SEM and AFM analyses. Raman spectrometry demonstrated the presence of the specific peaks for the analyzed samples, acknowledging the importance of the employed synthesis method.
The experimental data resulted from the evaluation of the nickel phosphite’s OER activity, and the fluorescence properties complement the research literature, providing the scientific community with the opportunity to better understand this material and its applicative potential. Moreover, the study of the nickel phosphite’s fluorescence properties increases the understanding of this material and paves the way for future investigations with potentially applicative results, highlighting the link between the roughness of the materials and the free ions.
Supplementary Materials
The following supporting information can be downloaded at: https://www.mdpi.com/article/10.3390/cryst12121803/s1: Figure S1: Cyclic voltammograms recorded on the G9 electrode in 1 mol L–1 KNO3 + 4 mmol L–1 K3[Fe(CN)6] electrolyte solution, at various scan rate values (v = 0.05, 0.1, 0.15, 0.2, 0.25 and 0.3 V s-1); Table S1: The electrocatalytic properties for the OER of the composition containing Ni11(HPO3)8(OH)6, carbon black and rGO, applied on graphite substrate, and that of other electrocatalysts reported in the scientific literature, in 1 mol L–1 KOH electrolyte solution. References [66,67,68,69,70,71,72,73,74,75,76,77,78,79,80,81,82,83,84,85,86,87,88,89,90,91,92,93,94] are cited in the supplementary materials.
Author Contributions
Conceptualization, M.P.; sample preparation, M.P. and P.V. (Paulina Vlazan); measurements, M.P., B.-O.T., P.S. (Paula Svera), C.I. and P.S. (Paula Sfirloaga); investigation, M.P., P.V. (Philippe Veber), P.S. (Paula Svera), B.-O.T. and G.B., writing—original draft, B.-O.T., P.S. (Paula Svera) and M.P.; funding acquisition, M.P., P.S. (Paula Sfirloaga) and G.B.; and writing—review and editing, M.P., G.B., P.V. (Philippe Veber), P.S. (Paula Sfirloaga) and B.-O.T. All authors have read and agreed to the published version of the manuscript.
Funding
G.B. acknowledges the financial support for this work provided by the West University of Timisoara from overhead funding (grant PN, no.75/2020). P.S., M.P., and P.V. acknowledge the financial support for this work provided by the joint French–Romanian project ANR-UEFISCDI, no. 8 RO-Fr/01.01.2013, code PN-II-ID-JRP-2011-2-0056/ANR-12-IS08-0003, COFeIn, and the Experimental Demonstrative Project 683PED/21/06/2022.
Institutional Review Board Statement
Not applicable.
Informed Consent Statement
Not applicable.
Data Availability Statement
The data that support the findings of this study are available from the authors, upon reasonable request.
Conflicts of Interest
The authors declare no conflict of interest.
References
- Qazi, A.; Hussain, F.; Rahim, N.; Hardaker, G.; Alghazzawi, D.; Shaban, K.; Haruna, K. Towards sustainable energy: A systematic review of renewable energy sources, technologies, and public opinions. IEEE Access 2019, 7, 63837–63851. [Google Scholar] [CrossRef]
- Roger, I.; Shipman, M.A.; Symes, M.D. Earth-abundant catalysts for electrochemical and photoelectrochemical water splitting. Nat. Rev. Chem. 2017, 1, 0003. [Google Scholar] [CrossRef]
- Chu, S.; Majumdar, A. Opportunities and challenges for a sustainable energy future. Nature 2012, 488, 294–303. [Google Scholar] [CrossRef] [PubMed]
- Colmati, F.; Alonso, C.G.; Martins, T.D.; De Lima, R.B.; Ribeiro, A.C.C.; Carvalho, L.d.L.; Sampaio, A.M.B.S.; Magalhaes, M.M.; Coutinho, J.W.D.; De Souza, G.A.; et al. Chapter 4: Production of hydrogen and their use in proton exchange membrane fuel cells. In Advances in Hydrogen Generation Technologies; Eyvaz, M., Ed.; IntechOpen: London, UK, 2018; pp. 63–78. ISBN 978-1-78923-535-7. [Google Scholar]
- Mani, V.; Anantharaj, S.; Mishra, S.; Kalaiselvi, N.; Kundu, S. Iron hydroxyphosphate and Sn-incorporated iron hydroxyphosphate: Efficient and stable electrocatalysts for oxygen evolution reaction. Catal. Sci. Technol. 2017, 7, 5092–5104. [Google Scholar] [CrossRef]
- Jiao, Y.; Zheng, Y.; Jaroniec, M.; Qiao, S.Z. Design of electrocatalysts for oxygen- and hydrogen-involving energy conversion reactions. Chem. Soc. Rev. 2015, 44, 2060–2086. [Google Scholar] [CrossRef]
- Tang, Q.; Jiang, D. Mechanism of hydrogen evolution reaction on 1T-MoS2 from first principles. ACS Catal. 2016, 6, 4953–4961. [Google Scholar] [CrossRef]
- Jamesh, M.I. Recent progress on earth abundant hydrogen evolution reaction and oxygen evolution reaction bifunctional electrocatalyst for overall water splitting in alkaline media. J. Power Sources 2016, 333, 213–236. [Google Scholar] [CrossRef]
- Gong, M.; Dai, H. A mini review of NiFe-based materials as highly active oxygen evolution reaction electrocatalysts. Nano Res. 2015, 8, 23–39. [Google Scholar] [CrossRef]
- Hunter, B.M.; Gray, H.B.; Muller, A.M. Earth-abundant heterogeneous water oxidation catalysts. Chem. Rev. 2016, 116, 14120–14136. [Google Scholar] [CrossRef]
- Indra, A.; Menezes, P.W.; Driess, M. Uncovering structure–activity relationships in manganese-oxide-based heterogeneous catalysts for efficient water oxidation. ChemSusChem 2015, 8, 776–785. [Google Scholar] [CrossRef]
- Menezes, P.W.; Indra, A.; Das, C.; Walter, C.; Gobel, C.; Gutkin, V.; Schmeiber, D.; Driess, M. Uncovering the nature of active species of nickel phosphide catalysts in high-performance electrochemical overall water splitting. ACS Catal. 2017, 7, 103–109. [Google Scholar] [CrossRef]
- Poienar, M.; Taranu, B.O.; Svera, P.; Sfirloaga, P.; Vlazan, P. Disclosing the thermal behaviour, electrochemical and optical properties of synthetic Fe3(PO4)2(OH)2 materials. J. Therm. Anal. Calorim. 2022, 147, 11435. [Google Scholar] [CrossRef]
- Fratilescu, I.; Lascu, A.; Taranu, B.O.; Epuran, C.; Birdeanu, M.; Macsim, A.-M.; Tanasa, E.; Vasile, E.; Fagadar-Cosma, E. One A3B porphyrin structure—Three successful applications. Nanomaterials 2022, 12, 1930. [Google Scholar] [CrossRef] [PubMed]
- Taranu, B.O.; Fagadar-Cosma, E. Catalytic properties of free-base porphyrin modified graphite electrodes for electrochemical water splitting in alkaline medium. Processes 2022, 10, 611. [Google Scholar] [CrossRef]
- Ma, Z.; Zhang, Y.; Liu, S.; Xu, W.; Wu, L.; Hsieh, Y.-C.; Liu, P.; Zhu, Y.; Sasaki, K.; Renner, J.N.; et al. Reaction mechanism for oxygen evolution on RuO2, IrO2, and RuO2@IrO2 core-shell nanocatalysts. J. Electroanal. Chem. 2018, 819, 296–305. [Google Scholar] [CrossRef]
- Li, X.; Hao, X.; Abudula, A.; Guan, G. Nanostructured catalysts for electrochemical water splitting: Current state and prospects. J. Mater. Chem. A 2016, 4, 11973–12000. [Google Scholar] [CrossRef]
- Subbaraman, R.; Tripkovic, D.; Chang, K.-C.; Strmcnik, D.; Paulikas, A.P.; Hirunsit, P.; Chan, M.; Greeley, J.; Stamenkovic, V.; Markovic, N.M. Trends in activity for the water electrolyser reactions on 3d M(Ni,Co,Fe,Mn) hydr(oxy)oxide catalysts. Nat. Mater. 2012, 11, 550–557. [Google Scholar] [CrossRef]
- Han, L.; Dong, S.; Wang, E. Transition-metal (Co, Ni, and Fe)-based electrocatalysts for the water oxidation reaction. Adv. Mater. 2016, 28, 9266–9291. [Google Scholar] [CrossRef]
- Osgood, H.; Devaguptapu, S.V.; Xu, H.; Cho, J.; Wu, G. Transition metal (Fe, Co, Ni, and Mn) oxides for oxygen reduction and evolution bifunctional catalysts in alkaline media. Nano Today 2016, 11, 601–625. [Google Scholar] [CrossRef]
- Vij, V.; Sultan, S.; Harzandi, A.M.; Meena, A.; Tiwari, J.N.; Lee, W.G.; Yoon, T.; Kim, K.S. Nickel–based electrocatalysts for energy related applications: Oxygen reduction, oxygen evolution, and hydrogen evolution reactions. ACS Catal. 2017, 7, 7196–7225. [Google Scholar] [CrossRef]
- Peugeot, A.; Creissen, C.E.; Karapinar, D.; Tran, H.N.; Schreiber, M.; Fontecave, M. Benchmarking of oxygen evolution catalysts on porous nickel supports. Joule 2021, 5, 1281–1300. [Google Scholar] [CrossRef]
- Menezes, P.W.; Panda, C.; Loos, S.; Bunschei-Bruns, F.; Walter, C.; Schwarze, M.; Deng, X.; Dau, H.; Driess, M. A structurally versatile nickel phosphite acting as a robust bifunctional electrocatalyst for overall water splitting. Energy Environ. Sci. 2018, 11, 1287–1298. [Google Scholar] [CrossRef]
- Taranu, B.O.; Ivanovici, M.G.; Svera, P.; Vlazan, P.; Sfirloaga, P.; Poienar, M. Ni11(HPO3)8(OH)6 multifunctional materials: Electrodes for oxygen evolution reaction and potential visible-light active photocatalysts. J. Alloys Compd. 2020, 848, 156595. [Google Scholar] [CrossRef]
- Poienar, M.; Maignan, A.; Sfirloaga, P.; Malo, S.; Vlazan, P.; Guesdon, A.; Lainé, F.; Rouquette, J.; Martin, C. Polar space group and complex magnetism in Ni11(HPO3)8(OH)6: Towards a new multiferroic material? Solid State Sci. 2014, 39, 92–96. [Google Scholar] [CrossRef]
- Gu, Y.; Wang, Y.; An, W.; Men, Y.; Rui, Y.; Fan, X.; Li, B. A novel strategy to boost the oxygen evolution reaction activity of NiFe-LDHs with in situ synthesized 3D porous reduced graphene oxide matrix as both the substrate and electronic carrier. New J. Chem. 2019, 17, 6555–6562. [Google Scholar] [CrossRef]
- Li, Q.; Tang, S.; Tang, Z.; Zhang, Q.; Yang, W. Microwave-assisted synthesis of FeCoS2/XC-72 for oxygen evolution reaction. Solid State Sci. 2019, 96, 105968. [Google Scholar] [CrossRef]
- Sebarchievici, I.; Taranu, B.O.; Birdeanu, M.; Rus, S.F.; Fagadar-Cosma, E. Electrocatalytic behaviour and application of manganese porphyrin/gold nanoparticle- surface modified glassy carbon electrodes. Appl. Surf. Sci. 2016, 39, 131–140. [Google Scholar] [CrossRef]
- Zhao, Z.; Wu, H.; He, H.; Xu, X.; Jin, Y. Self-standing non-noble metal (Ni–Fe) oxide nanotube array anode catalysts with synergistic reactivity for high-performance water oxidation. J. Mater. Chem. A 2015, 3, 7179–7186. [Google Scholar] [CrossRef]
- Baciu, A.; Remes, A.; Ilinoiu, E.; Manea, F.; Picken, S.J.; Schoonman, J. Carbon nanotubes composite for environmentally friendly sensing. Environ. Eng. Manag. J. 2012, 11, 239–246. [Google Scholar]
- Wang, H.; Lee, H.-W.; Deng, Y.; Lu, Z.; Hsu, P.-C.; Liu, Y.; Lin, D.; Cui, Y. Bifunctional non-noble metal oxide nanoparticle electrocatalysts through lithium-induced conversion for overall water splitting. Nat. Commun. 2015, 6, 7261. [Google Scholar] [CrossRef]
- Liu, C.; Ma, H.; Yuan, M.; Yu, Z.; Li, J.; Shi, K.; Liang, Z.; Yang, Y.; Zhu, T.; Sun, G.; et al. (NiFe)S2 nanoparticles grown on graphene as an efficient electrocatalyst for oxygen evolution reaction. Electrochim. Acta 2018, 286, 195–204. [Google Scholar] [CrossRef]
- Torres-Rivero, K.; Torralba-Cadena, L.; Espriu-Gascon, A.; Casas, I.; Bastos-Arrieta, J.; Florido, A. Strategies for surface modification with Ag-shaped nanoparticles: Electrocatalytic enhancement of screen-printed electrodes for the detection of heavy metals. Sensors 2019, 19, 4249. [Google Scholar] [CrossRef] [PubMed]
- Bottari, D.; Pigani, L.; Zanardi, C.; Terzi, F.; Patturca, S.V.; Grigorescu, S.D.; Matei, C.; Lete, C.; Lupu, S. Electrochemical sensing of caffeic acid using gold nanoparticles embedded in poly(3,4-ethylenedioxythiophene) layer by sinusoidal voltage procedure. Chemosensors 2019, 7, 65. [Google Scholar] [CrossRef]
- Kellenberger, A.; Ambros, D.; Plesu, N. Scan rate dependent morphology of polyaniline films electrochemically deposited on nickel. Int. J. Electrochem. Sci. 2014, 9, 6821–6833. [Google Scholar]
- Gira, M.J.; Tkacz, K.P.; Hampton, J.R. Physical and electrochemical area determination of electrodeposited Ni, Co, and NiCo thin films. Nano Converg. 2016, 3, 1–8. [Google Scholar] [CrossRef]
- Sebarchievici, I.; Taranu, B.-O.; Rus, S.F.; Vlazan, P.; Poienar, M.; Sfirloaga, P. Electro-Oxidation of Ascorbic Acid on Perovskite-Modified Electrodes. In Proceedings of the 25th International Symposium on Analytical and Environmental Problems, Szeged, Hungary, 7–8 October 2019; pp. 273–275. [Google Scholar]
- Zhou, Z.; Zaman, W.Q.; Sun, W.; Cao, L.; Tariq, M.; Yang, J. Cultivating crystal lattice distortion in IrO2 via coupling with MnO2 to boost the oxygen evolution reaction with high intrinsic activity. Chem. Commun. 2018, 54, 4959–4962. [Google Scholar] [CrossRef]
- Chen, S.; Qiao, S.-Z. Hierarchically porous nitrogen-doped graphene-NiCo2O4 hybrid paper as an advanced electrocatalytic water splitting material. ACS Nano 2013, 7, 10190–10196. [Google Scholar] [CrossRef]
- Li, Y.H.; Liu, P.F.; Pan, L.F.; Wang, H.F.; Yang, Z.Z.; Zheng, L.R.; Hu, P.; Zhao, H.J.; Gu, L.; Yang, H.G. Local atomic structure modulations activate metal oxide as electrocatalyst for hydrogen evolution in acidic water. Nat. Commun. 2015, 6, 8064. [Google Scholar] [CrossRef]
- Zhao, Y.; Chen, S.; Sun, B.; Su, D.; Huang, X.; Liu, H.; Yan, Y.; Sun, K.; Wang, G. Graphene-Co3O4 nanocomposite as electrocatalyst with high performance for oxygen evolution reaction. Sci. Rep. 2015, 5, 7629. [Google Scholar] [CrossRef]
- Hona, R.K.; Karki, S.B.; Ramezanipour, F. Oxide electrocatalysts based on earth-abundant metals for both hydrogen- and oxygen-evolution reactions. ACS Sustain. Chem. Eng. 2020, 8, 11549–11557. [Google Scholar] [CrossRef]
- Zhu, Y.; Zhou, W.; Chen, Z.-G.; Chen, Y.; Su, C.; Tad, M.O.; Shao, Z. SrNb0.1Co0.7Fe0.2O3-δ perovskite as a next-generation electrocatalyst for oxygen evolution in alkaline solution. Angew. Chem. Int. Ed. 2015, 54, 3897–3901. [Google Scholar] [CrossRef] [PubMed]
- Das, D.; Das, A.; Reghunath, M.; Nanda, K.K. Phosphine-free avenue to Co2P nanoparticle encapsulated N,P co-doped CNTs: A novel non-enzymatic glucose sensor and an efficient electrocatalyst for oxygen evolution reaction. Green Chem. 2017, 19, 1327–1335. [Google Scholar] [CrossRef]
- Li, F.; Li, J.; Zhou, L.; Dai, S. Enhanced OER performance of composite Co–Fe–based MOF catalysts via a one-pot ultrasonicassisted synthetic approach. Sustain. Energy Fuels 2021, 5, 1095–1102. [Google Scholar] [CrossRef]
- Wang, C.-P.; Feng, Y.; Sun, H.; Wang, Y.; Yin, J.; Yao, Z.; Bu, X.-H.; Zhu, J. Self-optimized metal−organic framework electrocatalysts with structural stability and high current tolerance for water oxidation. ACS Catal. 2021, 11, 7132–7143. [Google Scholar] [CrossRef]
- Taranu, B.-O.; Vlazan, P.; Racu, A. Water splitting studies in alkaline medium using graphite electrodes modified with transition metal oxides and compositions containing them. Stud. UBB Chem. 2022, 67, 79–95. [Google Scholar] [CrossRef]
- Trasatti, S. Electrocatalysis in the anodic evolution of oxygen and chlorine. Electrochim. Acta 1984, 29, 1503–1512. [Google Scholar] [CrossRef]
- Cherevko, S.; Geiger, S.; Kasian, O.; Kulyk, N.; Grote, J.-P.; Savan, A.; Shrestha, B.R.; Merzlikin, S.; Breitbach, B.; Ludwig, A.; et al. Oxygen and hydrogen evolution reactions on Ru, RuO2, Ir, and IrO2 thin film electrodes in acidic and alkaline electrolytes: A comparative study on activity and stability. Catal. Today 2016, 262, 170–180. [Google Scholar] [CrossRef]
- Zhang, D.; Zhang, Y.; Luo, Y.; Zhang, Y.; Li, X.; Yu, X.; Ding, H.; Chu, P.; Sun, L. High-performance asymmetrical supercapacitor composed of rGO-enveloped nickel phosphite hollow spheres and N/S co-doped rGO aerogel. Nano Res. 2018, 11, 1651–1663. [Google Scholar] [CrossRef]
- Li, B.; Shi, Y.; Huang, K.; Zhao, M.; Qiu, J.; Xue, H.; Pang, H. Cobalt-doped nickel phosphite for high performance of electrochemical energy storage. Small 2018, 14, 1703811. [Google Scholar] [CrossRef]
- Tu, J.; Lei, H.; Wang, M.; Yu, Z.; Jiao, S. Facile synthesis of Ni11(HPO3)8(OH)6/rGO nanorods with enhanced electrochemical performance for aluminum-ion batteries. Nanoscale 2018, 10, 21284–21291. [Google Scholar] [CrossRef]
- Wang, X.; Xu, J.; Yu, J.; Bu, Y.; Marques-Hueso, J.; Yan, X. Morphology control, spectrum modification and extended optical applications of rare earth ion doped phosphors. Phys. Chem. Chem. Phys. 2020, 22, 15120–15162. [Google Scholar] [CrossRef] [PubMed]
- Liao, K.; Ni, Y. Synthesis of hierarchical Ni11(HPO3)8(OH)6 superstructures based on nanorods through a soft hydrothermal route. Mater. Res. Bull. 2010, 45, 205–209. [Google Scholar] [CrossRef]
- Marcos, M.D.; Amoros, P.; Beltran-Porter, A.; Martinez-Manez, R.; Attfield, J.P. Novel crystalline microporous transition-metal phosphites M11(HPO3)8(OH)6 (M = Zn, Co, Ni). X-ray powder diffraction structure determination of the cobalt and nickel derivatives. Chem. Mater. 1993, 5, 121–128. [Google Scholar] [CrossRef]
- Bhushan, B. Modern Tribology Handbook, Chapter 2: Surface Roughness Analysis and Measurement Techniques, 1st ed.; CRC Press: Boca Raton, FL, USA, 2001; pp. 49–120. [Google Scholar] [CrossRef]
- Owen, J.F.; Chang, R.K.; Barber, P.W. Morphology–dependent resonances in Raman scattering, fluorescence emission, and elastic scattering from microparticles. Aerosol Sci. Technol. 1982, 1, 293–302. [Google Scholar] [CrossRef]
- Lan, Y.; Zondode, M.; Deng, H.; Yan, J.A.; Ndaw, M.; Lisfi, A.; Wang, C.; Pan, Y.-L. Basic concepts and recent advances of crystallographic orientation determination of graphene by Raman spectroscopy. Crystals 2018, 8, 375. [Google Scholar] [CrossRef]
- Nguyen, T.H.; Nguyen, T.M.H.; Kang, B.; Cho, B.; Han, M.; Choi, H.J.; Kong, M.; Lee, Y.; Yang, I. Raman spectroscopic evidence of impurity-induced structural distortion in SmB6. J. Raman Spectrosc. 2019, 50, 1661–1671. [Google Scholar] [CrossRef]
- Oliver, S.M.; Beams, R.; Krylyuk, S.; Kalish, I.; Singh, A.K.; Bruma, A.; Tavazza, F.; Joshi, J.; Stone, I.R.; Stranick, S.J.; et al. The structural phases and vibrational properties of Mo1−xWxTe2 alloys. 2D Mater. 2017, 4, 045008. [Google Scholar] [CrossRef]
- Van Stam, J.; Lindqvist, C.; Hansson, R.; Ericsson, L.; Moons, E. Fluorescence and UV/VIS absorption spectroscopy studies on polymer blend films for photovoltaics. Proc. SPIE Int. Soc. Opt. Eng. 2015, 9549, 95490L1-9. [Google Scholar] [CrossRef]
- Hamzah, M.; Khenfouch, M.; Srinivasu, V.V. The quenching of silver nanoparticles photoluminescence by graphene oxide: Spectroscopic and morphological investigations. J. Mater. Sci. Mater. Electron. 2017, 28, 1804–1811. [Google Scholar] [CrossRef]
- Gangwar, J.; Dey, K.K.; Tripathi, S.K.; Wan, M.; Yadav, R.R.; Singh, R.K.; Srivastava, A.K. NiO-based nanostructures with efficient optical and electrochemical properties for high-performance nanofluids. Nanotechnology 2013, 24, 415705. [Google Scholar] [CrossRef]
- Vijayaprasath, G.; Sakthivel, P.; Murugan, R.; Mahalingam, T.; Ravi, G. Deposition and characterization of ZnO/NiO thin films. AIP Conf. Proc. 2016, 1731, 080033. [Google Scholar] [CrossRef]
- Zhong, J.; Liang, H.; Su, Q.; Dorenbos, P.; Danang Birowosuto, M. Luminescence of NaGd(PO3)4:Ce3+ and its potential application as a scintillator material. Chem. Phys. Lett. 2007, 445, 32–36. [Google Scholar] [CrossRef]
- Bard, A.J.; Faulkner, L.R. Electrochemical Methods: Fundamentals and Applications, 2nd ed.; John Wiley & Sons: New York, NY, USA, 2001; pp. 186–191. [Google Scholar]
- Yang, M.; Yang, Y.; Liu, Y.; Shen, G.; Yu, R. Platinum nanoparticles-doped sol–gel/carbon nanotubes composite electrochemical sensors and biosensors. Biosens. Bioelectron. 2006, 21, 1125–1131. [Google Scholar] [CrossRef] [PubMed]
- Hrapovic, S.; Liu, Y.; Male, K.B.; Luong, J.H.T. Electrochemical biosensing platforms using platinum nanoparticles and carbon nanotubes. Anal. Chem. 2004, 76, 1083–1088. [Google Scholar] [CrossRef]
- Xu, H.; Zhang, W.; Zhang, J.; Wu, Z.; Sheng, T.; Gao, F. An Fe-doped Co11(HPO3)8(OH)6 nanosheets array for high-performance water electrolysis. Electrochim. Acta 2020, 334, 135616. [Google Scholar] [CrossRef]
- Lu, W.-X.; Wang, B.; Chen, W.-J.; Xie, J.-L.; Huang, Z.-Q.; Jin, W.; Song, J.-L. Nanosheet-like Co3(OH)2(HPO4)2 as a highly efficient and stable electrocatalyst for oxygen evolution reaction. ACS Sustain. Chem. Eng. 2019, 7, 3083–3091. [Google Scholar] [CrossRef]
- Sial, M.; Lin, H.; Wang, X. Microporous 2D NiCoFe phosphate nanosheets supported on Ni foam for efficient overall water splitting in alkaline media. Nanoscale 2018, 10, 12975–12980. [Google Scholar] [CrossRef]
- Zhang, Q.; Li, T.; Liang, J.; Wang, N.; Kong, X.; Wang, J.; Qian, H.; Zhou, Y.; Liu, F.; Wei, C.; et al. Highly wettable and metallic NiFe-phosphate/phosphide catalyst synthesized by plasma for highly efficient oxygen evolution reaction. J. Mater. Chem. A 2018, 6, 7509–7516. [Google Scholar] [CrossRef]
- Lei, Z.; Bai, J.; Li, Y.; Wang, Z.; Zhao, C. Fabrication of nanoporous nickel-iron hydroxylphosphate composite as bifunctional and reversible catalyst for highly efficient intermittent water splitting. ACS Appl. Mater. Interfaces 2017, 9, 35837–35846. [Google Scholar] [CrossRef]
- Zhou, J.; Dou, Y.B.; Zhou, A.; Guo, R.M.; Zhao, M.J.; Li, J.R. MOF template-directed fabrication of hierarchically structured electrocatalysts for efficient oxygen evolution reaction. Adv. Energy Mater. 2017, 7, 1602643. [Google Scholar] [CrossRef]
- Zhou, H.Q.; Yu, F.; Sun, J.Y.; He, R.; Chen, S.; Chu, C.W.; Ren, Z.F. Highly active catalyst derived from a 3D foam of Fe(PO3)2/Ni2P for extremely efficient water oxidation. Proc. Natl. Acad. Sci. USA 2017, 114, 5607–5611. [Google Scholar] [CrossRef] [PubMed]
- Chang, J.; Lv, Q.; Li, G.; Ge, J.; Liu, C.; Xing, W. Core-shell structured Ni12P5/Ni3(PO4)2 hollow spheres as difunctional and efficient electrocatalysts for overall water electrolysis. Appl. Catal. B Environ. 2017, 204, 486–496. [Google Scholar] [CrossRef]
- Jin, Y.S.; Wang, H.T.; Li, J.J.; Yue, X.; Han, Y.J.; Shen, P.K.; Cui, Y. Porous MoO2 nanosheets as non-noble bifunctional electrocatalysts for overall water splitting. Adv. Mater. 2016, 28, 3785–3790. [Google Scholar] [CrossRef] [PubMed]
- Masud, J.; Umapathi, S.; Ashokaan, N.; Nath, M. Iron phosphide nanoparticles as an efficient electrocatalyst for OER in alkaline solution. J. Mater. Chem. A. 2016, 4, 9750–9754. [Google Scholar] [CrossRef]
- Rao, Y.; Wang, Y.; Ning, H.; Li, P.; Wu, M.B. Hydrotalcite-like Ni(OH)2 nanosheets in situ grown on nickel foam for overall water splitting. ACS Appl. Mater. Interfaces 2016, 8, 33601–33607. [Google Scholar] [CrossRef]
- You, B.; Jiang, N.; Sheng, M.L.; Bhushan, M.W.; Sun, Y.J. Hierarchically porous urchin-like Ni2P superstructures supported on nickel foam as efficient bifunctional electrocatalysts for overall water splitting. ACS Catal. 2016, 6, 714–721. [Google Scholar] [CrossRef]
- Yu, X.Y.; Feng, Y.; Guan, B.Y.; Lou, X.W.; Paik, U. Carbon coated porous nickel phosphides nanoplates for highly efficient oxygen evolution reaction. Energy Environ. Sci. 2016, 9, 1246–1250. [Google Scholar] [CrossRef]
- Zhao, S.L.; Wang, Y.; Dong, J.C.; He, C.T.; Yin, H.J.; An, P.F.; Zhao, K.; Zhang, X.F.; Gao, C.; Zhang, L.J.; et al. Ultrathin metal–organic framework nanosheets for electrocatalytic oxygen evolution. Nat. Energy 2016, 1, 1–10. [Google Scholar] [CrossRef]
- Li, J.; Yan, M.; Zhou, X.; Huang, Z.-Q.; Xia, Z.; Chang, C.-R.; Ma, Y.; Qu, Y. Mechanistic insights on ternary Ni2−xCoxP for hydrogen evolution and their hybrids with graphene as highly efficient and robust catalysts for overall water splitting. Adv. Funct. Mater. 2016, 26, 6785–6796. [Google Scholar] [CrossRef]
- Liang, H.; Gandi, A.N.; Anjum, D.H.; Wang, X.; Schwingenschlogl, U.; Alshareef, H.N. Plasma-assisted synthesis of NiCoP for efficient overall water splitting. Nano Lett. 2016, 16, 7718–7725. [Google Scholar] [CrossRef]
- Yuan, C.-Z.; Jiang, Y.-F.; Wang, Z.; Xie, X.; Yang, Z.-K.; Yousaf, A.B.; Xu, A.-W. Cobalt phosphate nanoparticles decorated with nitrogen-doped carbon layers as highly active and stable electrocatalysts for the oxygen evolution reaction. J. Mater. Chem. A 2016, 4, 8155–8160. [Google Scholar] [CrossRef]
- Feng, L.L.; Yu, G.T.; Wu, Y.Y.; Li, G.D.; Li, H.; Sun, Y.H.; Asefa, T.; Chen, W.; Zou, X.X. High-index faceted Ni3S2 nanosheet arrays as highly active and ultrastable electrocatalysts for water splitting. J. Am. Chem. Soc. 2015, 137, 14023–14026. [Google Scholar] [CrossRef] [PubMed]
- Han, A.; Chen, H.L.; Sun, Z.J.; Xu, J.; Du, P.W. High catalytic activity for water oxidation based on nanostructured nickel phosphide precursors. Chem. Commun. 2015, 51, 11626–11629. [Google Scholar] [CrossRef] [PubMed]
- Hu, H.; Guan, B.Y.; Xia, B.Y.; Lou, X.W. Designed formation of Co3O4/NiCo2O4 double-shelled nanocages with enhanced pseudocapacitive and electrocatalytic properties. J. Am. Chem. Soc. 2015, 137, 5590–5595. [Google Scholar] [CrossRef]
- Jiang, N.; You, B.; Sheng, M.L.; Sun, Y.J. Electrodeposited cobalt-phosphorous-derived films as competent bifunctional catalysts for overall water splitting. Angew. Chem. Int. Ed. 2015, 54, 6251–6254. [Google Scholar] [CrossRef]
- Jin, H.Y.; Wang, J.; Su, D.F.; Wei, Z.Z.; Pang, Z.F.; Wang, Y. In-situ cobalt-cobalt oxide/N-doped carbon hybrids as superior bifunctional electrocatalysts for hydrogen and oxygen evolution. J. Am. Chem. Soc. 2015, 137, 2688–2694. [Google Scholar] [CrossRef]
- Liang, H.F.; Meng, F.; Caban-Acevedo, M.; Li, L.S.; Forticaux, A.; Xiu, L.C.; Wang, Z.C.; Jin, S. Hydrothermal continuous flow synthesis and exfoliation of NiCo layered double hydroxide nanosheets for enhanced oxygen evolution catalysis. Nano Lett. 2015, 15, 1421–1427. [Google Scholar] [CrossRef] [PubMed]
- Ledendecker, M.; Calderon, S.K.; Papp, C.; Steinruck, H.P.; Antonietti, M.; Shalom, M. The synthesis of nanostructured Ni5P4 films and their use as a non-noble bifunctional electrocatalyst for full water splitting. Angew. Chem. Int. Ed. 2015, 54, 12361–12365. [Google Scholar] [CrossRef] [PubMed]
- Etesami, M.; Khezri, R.; Abbasi, A.; Nguyen, M.T.; Yonezawa, T.; Kheawhom, S.; Somwangthanaroj, A. Ball mill-assisted synthesis of NiFeCo-NC as bifunctional oxygen electrocatalysts for rechargeable zinc-air batteries. J. Alloys Compd. 2022, 922, 166287. [Google Scholar] [CrossRef]
- Etesami, M.; Mohamad, A.A.; Nguyen, M.T.; Yonezawa, T.; Pornprasertsuk, R.; Somwangthanaroj, A.; Kheawhom, S. Benchmarking superfast electrodeposited bimetallic (Ni, Fe, Co, and Cu) hydroxides for oxygen evolution reaction. J. Alloys Compd. 2012, 889, 161738. [Google Scholar] [CrossRef]
Publisher’s Note: MDPI stays neutral with regard to jurisdictional claims in published maps and institutional affiliations. |
© 2022 by the authors. Licensee MDPI, Basel, Switzerland. This article is an open access article distributed under the terms and conditions of the Creative Commons Attribution (CC BY) license (https://creativecommons.org/licenses/by/4.0/).

