Article

The Role of Macrophage Polarization-Associated Gene Expression in the Oncological Prognosis of Hepatocellular Carcinoma

1
Department of Surgery and Transplantation, University Hospital RWTH Aachen, 52074 Aachen, Germany
2
Department of Critical Care Medicine, Qilu Hospital (Qingdao), Cheeloo College of Medicine, Shandong University, 758 Hefei Road, Qingdao 266035, China
3
Institute of Pathology, University Hospital RWTH Aachen, 52074 Aachen, Germany
4
Department of Gastroenterology, Hepatology and Infectious Diseases, Heinrich Heine University Duesseldorf, 40225 Duesseldorf, Germany
5
Department of Surgery, Maastricht University Medical Centre (MUMC), 6229 HX Maastricht, The Netherlands
6
Department of Surgery and Transplantation, University Hospital Essen, 45147 Essen, Germany
*
Author to whom correspondence should be addressed.
These authors contributed equally to this work.
Gastroenterol. Insights 2024, 15(3), 764-785; https://doi.org/10.3390/gastroent15030055
Submission received: 10 April 2024 / Revised: 19 August 2024 / Accepted: 21 August 2024 / Published: 6 September 2024
(This article belongs to the Section Liver)

Abstract

:
Background: The induced repolarization of tumor growth-promoting M2 macrophages into tumor growth-inhibiting M1 macrophages is a matter of intensive research and is expected to lead towards a novel targetable approach in HCC therapy. Methods: Differentially expressed M2 macrophage-related genes between normal and tumor samples with high and low M2 macrophage infiltration in the Gene Expression Omnibus (GEO) and TCGA datasets were identified. A risk score was constructed based on univariate Cox analysis and LASSO-penalized Cox regression analysis. The relationship between the different risk score groups and clinical pathological characteristics as well as immune infiltration characteristics was studied. Subsequently, a nomogram was constructed to predict patients’ prognosis. Western blot and RT-qPCR were carried out to validate the results in human HCC samples. Results: Increased M2 macrophage infiltration was associated with a shorter overall survival (OS). Four important M2 macrophage-related genes (SLC22A1, CPS1, SLC10A1, CYP2C9) were discovered to be strongly correlated with OS and M2 macrophage infiltration. A nomogram incorporating the signature and tumor stage was developed for final clinical translation. Conclusions: SLC22A1, CPS1, SLC10A1 and CYP2C9 genes are associated with tumor-promoting M2 macrophage infiltration and might be potential targets for macrophage-related immunotherapy in HCC patients. Further, this four-gene signature is a potential tool for predicting prognosis in these patients.

1. Introduction

Hepatocellular carcinoma (HCC) is a major health burden and the most common primary liver cancer [1]. From a global perspective, HCC ranks sixth in its incidence among cancers and is the third-most-common cause of cancer-related mortality [2]. Because of the late diagnosis and high post-therapeutic recurrence rates, HCC still has a poor overall prognosis [3]. Effective biomarkers and therapeutic strategies might therefore notably improve outcomes in these patients. As a result, research on useful biomarkers and the development of innovative predictive models and novel therapeutic strategies for HCC has been in the focus of the scientific community for more than a decade.
It has been proven that the tumor microenvironment (TME) significantly affects the body’s immune response and thus is essential in cancer progression and tumorigenesis—for example, by promoting tumor cell survival, proliferation and metastasis [4]. As HCC is frequently accompanied by chronic inflammation, immune cells (e.g., macrophages, T lymphocytes, etc.) interact with cancer cells in both pro- and anti-tumor activity by releasing cytokines or directly killing target cells [5]. As a result, HCC immunotherapy has been investigated previously [6]. Immune checkpoint inhibitors (ICIs), including durvalumab, atezolizumab, pembrolizumab, nivolumab, etc., have been recently studied; however, most trials investigating single-agent ICIs have shown disappointing results. In contrast, immune-based combinations have been more encouraging but warrant further research in terms of the mechanistical basis of the success of combination therapies [7]. Tumor-associated macrophages (TAMs), macrophages linked to a specific clinical environment, are one of the most significant immune cells in the tumor microenvironment [8]. It has been demonstrated that macrophages can differentiate into type M1 after stimulation with lipopolysaccharide (LPS) and interferon-gamma (IFN-γ; classical activation pathway), or type M2 after stimulation with IL-4 (selective activation pathway) [9]. M2 TAMs promote metastasis and tumor growth by various cytokines (e.g., TGF-β, IL-10, IL-8, and others). Subsequently, M2 TAMs stimulate angiogenesis, suppress anticancer immunity and induce epithelial-mesenchymal transition (EMT) [10,11,12].
M2 macrophages have become a novel target for anti-tumor therapy due to their crucial role in tumor growth and metastasis [13]. Repolarizing M2 into M1 TAMs with anticancer activity—by removing variables that facilitate M2 TAM activation or reversing its active phenotype through exogenous stimuli—is currently being investigated, with the intention to restore macrophage cytotoxic function, reduce (lymph) angiogenesis, and prevent tumor growth and invasion as well as metastasis. However, TAM polarization and the associated regulatory processes have not been fully unraveled yet.
Therefore, we analyzed multigene expression datasets of HCC patients to identify clinically useful M2 macrophage-related gene biomarkers that might be used to predict prognosis and might also be targets for the repolarization of M2 TAMs into M1 TAMs. In addition, we aimed to create a biomarker-based prognostic signature to predict oncological outcomes in HCC patients.

2. Materials and Methods

2.1. Data Collection and Human Samples

We collected the mRNA sequencing data and clinical data of HCC patients from three datasets, including the TCGA training cohort (https://immport.niaid.nih.gov, accessed on 15 August 2022), the International Cancer Genome Consortium (ICGC) validation cohort (https://dcc.icgc.org, accessed on 15 August 2022), and the GSE76427 validation cohort (https://www.ncbi.nlm.nih.gov/geo/, accessed on 15 August 2022). A further six RNA-Seq datasets without clinical data, e.g., GSE145520, GSE25097, GSE39791, GSE57957, GSE54236 and GSE36376, were included in the dataset. The sequencing data of these databases were all based on the “Illumina” platform (San Diego, CA, USA). Basic information regarding the databases is shown in Table S1. All human HCC tissue samples used in this study were obtained from patients undergoing surgical resection at Qilu Hospital (Qingdao), Cheeloo College of Medicine, Shandong University. The study was approved by the medical ethics committee of Qilu Hospital (Qingdao), Cheeloo College of Medicine, Shandong University (ID: KYLL-KS-2022130), and was conducted in accordance with the Declaration of Helsinki. Informed consent was acquired from each patient. The samples were immediately snap-frozen after resection and stored at −80 °C.

2.2. Identification and Enrichment of DEGs

We used the “Limma” function [14] in R (R Core Team, Vienna, Austria) to identify differentially expressed genes (DEGs) between HCC and normal tissues, between high- and low-M2 macrophage groups, and between high- and low-risk-score groups. DEGs were defined as those showing |log2(fold change) | > 1 and p < 0.05. After converting DEG identifiers using the “org.Hs.eg.db” program (version 3.19) within R, we analyzed DEGs for functional enrichment based on GO (Gene Ontology) [15] and the KEGG (Kyoto Encyclopedia of Genes and Genomes) [16] using the “clusterProfiler” package.

2.3. Construction and Verification of Prognostic Signature

We integrated univariate Cox regression and Kaplan–Meier analysis (patients were subclassified into high and low expression groups considering the optimal cutoff gene expression level) to identify M2 macrophage-related genes associated with prognosis. The least absolute shrinkage and selection operator (LASSO) [17] method based on the “glmnet” R package minimized the scope of prognostic M2 macrophage-related genes in order to construct a prognostic model. We subsampled the dataset 1000 times and chose the predictive genes over 900 times while undertaking the LASSO-penalized Cox analysis. A penalty proportionate to their size was used to decrease the regression coefficient, resulting in the detection of a subset of important genes. Genes with a regression coefficient of 0 were excluded. Following this, risk scores were calculated by multiplying gene expression by a linear mixture of regression coefficients, derived using multivariate Cox regression, as follows:
Risk score = i × Xi
Patients were assigned to high-risk and low-risk groups according to the median risk score. The “survival” package was used to perform a Kaplan–Meier analysis to assess overall survival between high- and low-risk groups. The R software package “timeROC” was used to create the receiver operating characteristic (ROC) curve to analyze the prognostic efficacy of the risk score for 1, 2, and 3 years of follow-up. Furthermore, we used the same model and same coefficients as those in the TCGA dataset in the ICGC cohort and GSE72647 cohort to determine the robustness of the signature.

2.4. Risk Score, Clinical Characteristics, and Immune Infiltration

We investigated the relationships between risk score and clinicopathological factors (gender, age, body mass index (BMI), prior malignancy, family cancer history, histological grade, AJCC stage and vascular invasion). To investigate independent variables of prognosis in the full dataset, univariate and multivariate Cox regression analyses were performed to identify independent prognostic variables. In addition, we conducted an internal validation of the prognostic model based on different clinical features of HCC patients. The immune score between the high- and low-risk groups was explored by using the ESTIMATE algorithm [18]. To assess the proportion of tumor-infiltrating lymphocytes (TILs) in the TME, CIBERSORT [19] and ssGSEA [20] were performed to quantify and qualify the levels of multiple immune cell types in the two groups. We also used heatmaps to show the differential expression levels of immunostimulatory and immunoinhibitory genes between the two groups.

2.5. Establishment of a Survival Prediction Nomogram

The “rms” R package was used to create a nomogram in the TCGA cohort, and the calibration curve and ROC analysis were used to test the nomogram’s prognostic performance. In addition, decision curve analysis was used to assess the nomogram’s net clinical benefit. The ICGC cohort was later used to validate the nomogram’s prognostic value.

2.6. Weighted Gene Co-Expression Network Analysis

Weighted gene co-expression network analysis (WGCNA) was performed on DEGs identified between high- and low-risk group [21]. We chose six as the soft threshold (power) to ensure that the constructed co-expression network approached scale-free distribution. We calculated the modules’ correlation with the group, ESTIMATE score, immune score, stromal score and tumor purity. Subsequently, we obtained the hub genes according to the calculation of module membership (MM) and gene significance (GS). We then built a protein–protein interaction (PPI) network using the STRING database and analyzed the Spearman’s gene–gene and gene–ESTIMATE correlations [22].

2.7. The Human Protein Atlas

Data on the protein expression of the target genes identified in this study, collected by the immunohistochemical analysis of pathological samples, were downloaded from the Human Protein Atlas (https://www.proteinatlas.org/, accessed on 15 August 2024). Staining intensity and patients’ information can be obtained online.

2.8. Western Blotting and Antibodies

Total proteins were extracted from the HCCs and normal tissues, and after protein concentration was determined, a Western blot assay was performed. The primary antibodies used were as follows: Carbamoyl-phosphate synthase 1 (CPS1) antibody (AFFINITY; Cincinnati, OH, USA) (diluted at 1:1000), Solute carrier family 22 member 1 (SLC22A1) antibody (AFFINITY; Cincinnati, OH, USA) (diluted at 1:1000), Cytochrome P450 family 2 subfamily C member 9 (CYP2C9) antibody (AFFINITY; Cincinnati, OH, USA) (diluted at 1:1000), Solute carrier family 10 member 1 (SLC10A1) antibody (AFFINITY; Cincinnati, OH, USA) (diluted at 1:1000) and Glyceraldehyde-3-phosphate dehydrogenase (GAPDH) recombinant antibody (proteintech, AFFINITY; Cincinnati, OH, USA) (diluted at 1:1000) at room temperature for 1 h. After washing three times with TBST for 5 min/wash, the membrane was incubated with HRP-labeled mouse antirabbit IgG (AFFINITY; Cincinnati, OH, USA) (diluted at 1:5000) as the secondary antibody for 1 h at room temperature. Finally, the signal was detected by chemiluminescence.

2.9. Reverse Transcription Quantitative-Polymerase Chain Reaction

The same tissue samples were used to evaluate gene expression. Total RNA was extracted from liver tissue and reverse-transcribed into complementary DNA. Next, the relative mRNA expression of genes was normalized to beta-tubulin, and the fold-change was evaluated using the 2−ΔΔCT method. The primer sequences used for quantitative real-time quantitative PCR (RT-qPCR) were obtained from the literature and were as follows: CPS1 [23] forward 5′-CCCCGTCAATTAGACTATGACA-3′, reverse 5′-CATTGTTGTCTGTGTCGATCTG-3′; CYP2C9 [24] forward 5′-CTGGTTACCACTGCCACCTT-3′, reverse 5′-CTGGCCCAGCTTAGACGTAG-3′; SLC10A1 [25] forward 5′-GACACCACTCTTGATTGCCACCTC-3′, reverse 5′-GCGTCTGCACCGTCCATTGAG-3′; SL22A1 [26] forward 5′-GTG TGT AGA CCC CCT GGC TA-3′, reverse 5′-GTG TAG CCA GCC ATC CAG TT-3′; and ACTB [27] forward 5′-CAGAGACGACAAGCACAACCCT-3′, reverse 5′-ATGTGGCTCCTGTCTTGCATGC-3′.

2.10. Statistical Analysis

Statistical analysis was conducted using R software (version 4.1.1). The Wilcox test was employed to contrast the successive variates between the two groups of independent samples. The Chi-square test was performed to compare the differences in clinical features. Kaplan–Meier analysis with a log-rank test was used to compare the OS between different subgroups, to identify independent risk factors for overall survival. Univariate and multivariate Cox regression analyses were performed to adjust covariates. A p-value < 0.05 was considered statistically significant.

3. Results

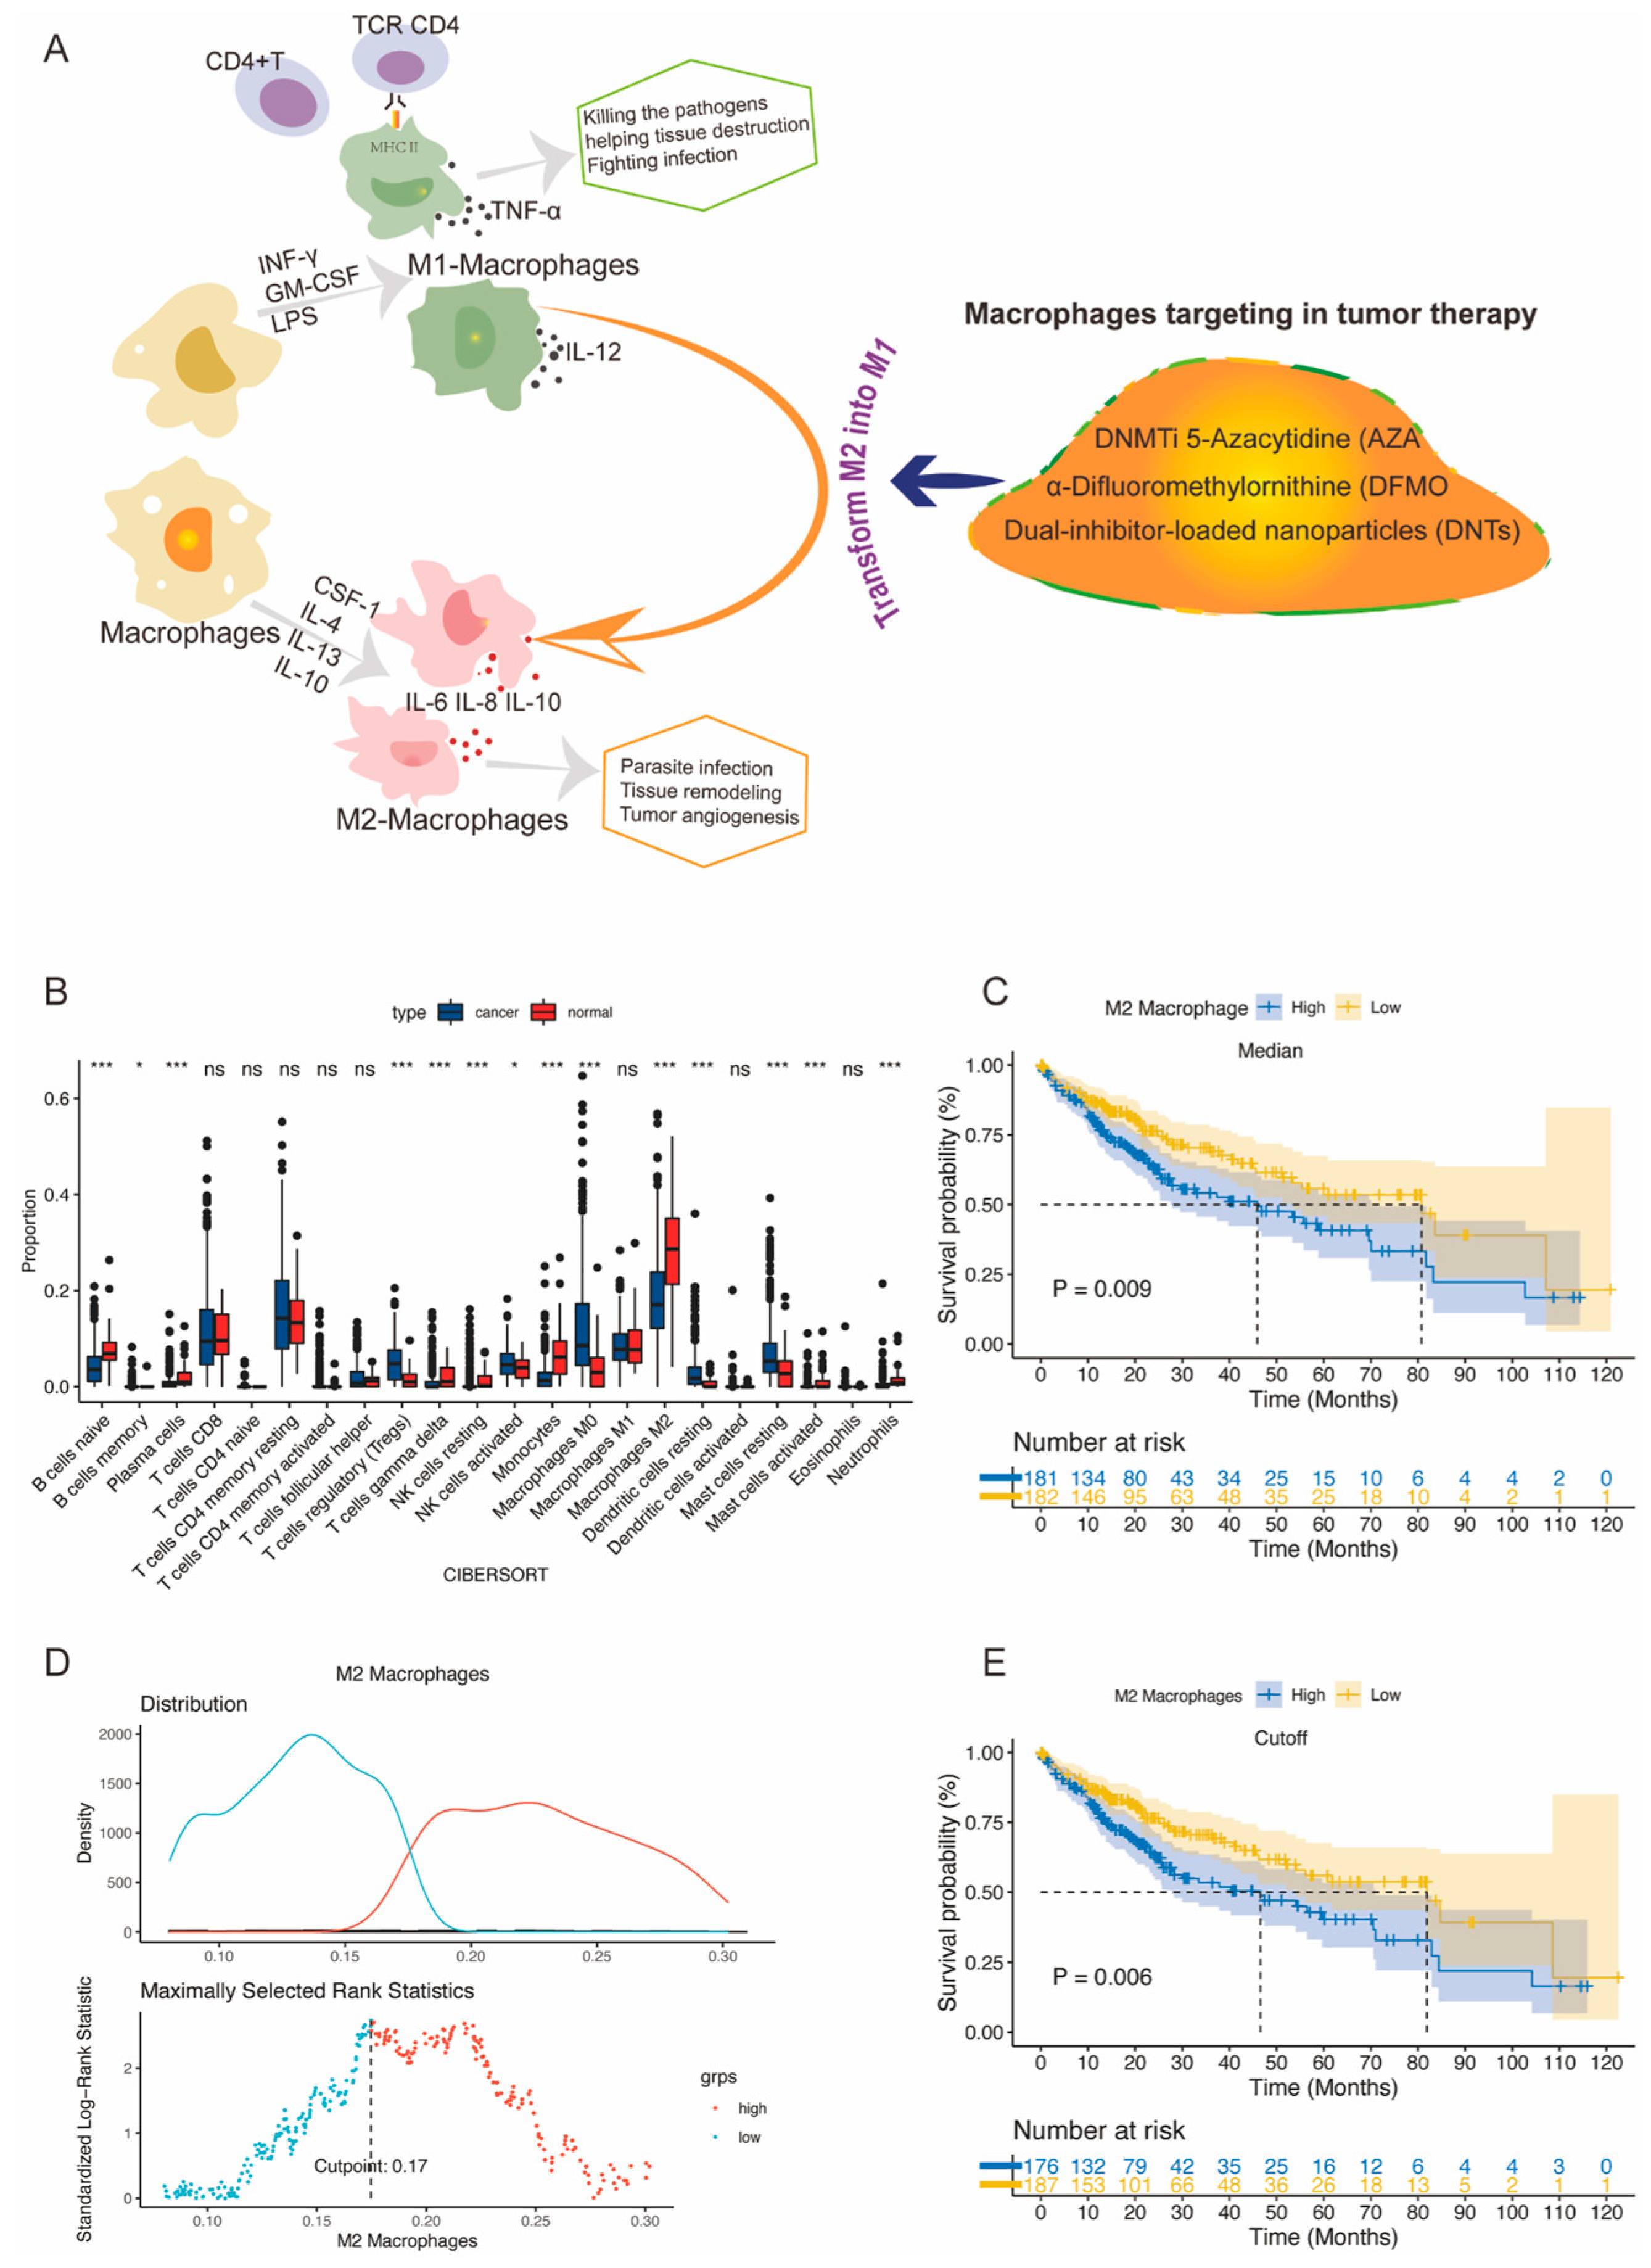
3.1. Analyses of the Immune Cell Infiltration and Prognostic Significance of M2 Macrophages

The clinical characteristics of patients with HCC in the training and validation sets are provided in Table 1. We reviewed and summarized the generation and function of M1/M2 macrophages and their role in immunotherapy (Figure 1A). In the TCGA cohort, the infiltration of immune cells such as B cell-naive, monocytes, M2 macrophages, and neutrophils was significantly higher in normal tissues compared to cancer tissues, whereas the infiltration of M0 macrophages, activated NK cells, and Tregs was significantly higher in the cancer group compared to the normal group (Figure 1B). Of note, M2 macrophages were also the most-abundant immune cell type in the normal tissue, which can be explained as M2 macrophages play a key role in all chronic liver diseases, such as non-alcoholic fatty liver disease, alcoholic liver disease, liver fibrosis, and cirrhosis [28,29]. As HCC is clinically accompanied by chronic liver disease in almost every case, this observation can be explained. We further used median filtration and optimal cutoff (calculated by “survminer” package in R) to divide HCC patients into high- and low-infiltration groups and discovered that HCC patients with a high infiltration of M2 macrophages displayed worse prognoses than those with low infiltration (p = 0.009, 0.006, respectively) (Figure 1C,D). We chose the optimal cutoff grouping method for the following research.

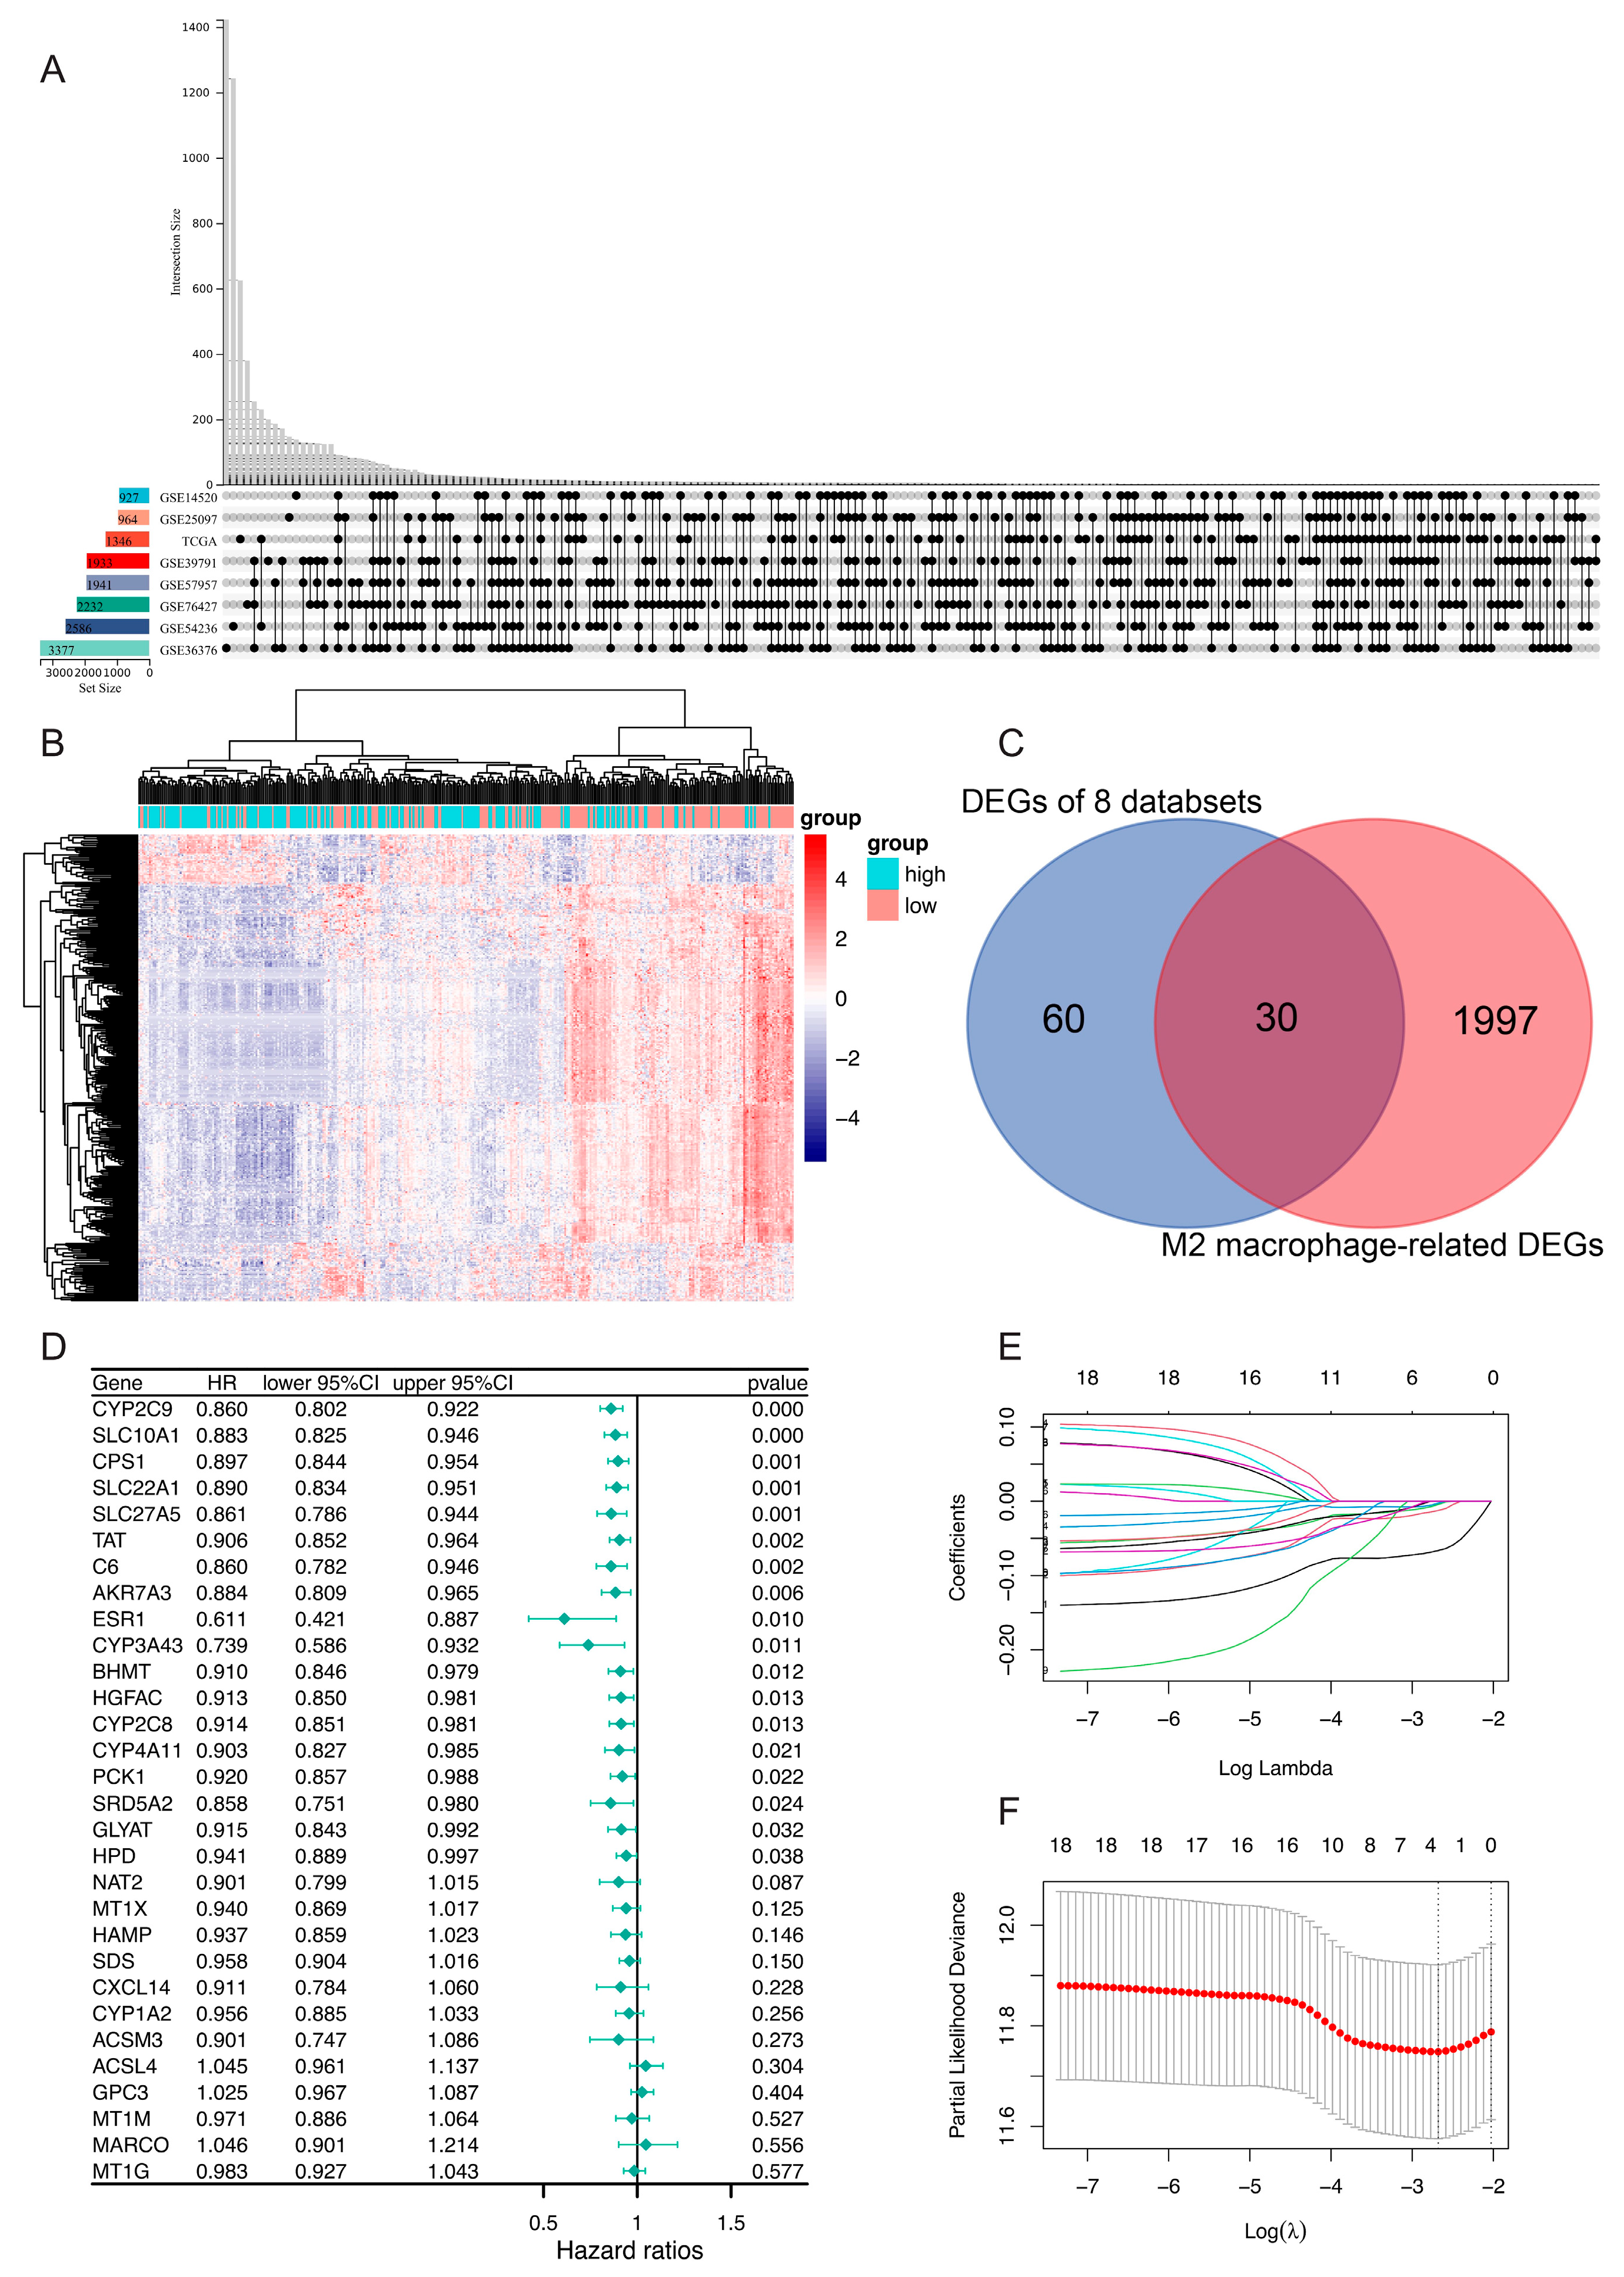
3.2. Identification of DEGs and Establishment of a Prognostic Risk Model

To determine DEGs between HCC and normal tissues, we integrated eight datasets, including TCGA, GSE76427, GSE145520, GSE25097, GSE39791, GSE57957, GSE54236 and GSE36376. More details of the datasets are presented in Table S1. Based on the predefined screening criteria, 60 genes were found to be significantly differentially expressed (Figure 2A). We also explored DEGs between high- and low-M2 macrophage group and obtained 1997 M2 macrophage-related genes in total, for which heatmaps were plotted (Figure 2B). Finally, we acquired 30 interaction M2 macrophage-related DEGs by using a Venn plot (Figure 2C). Eighteen M2 macrophage-related DEGs were significantly correlated with overall survival based on Cox univariate analysis in the TCGA training set (p < 0.05, Figure 2D, Table S2). We then conducted a LASSO Cox analysis to further reduce prognostic M2 macrophage-related DEGs, and we filtered out four genes (SLC22A1, CPS1, SLC10A1 and CYP2C9; Table S3) to create the following risk score (Figure 2E,F): Risk score = SLC22A1 × −0.002596 + CPS1 × −0.004410 + SLC10A1 × −0.012437 + CYP2C9 × −0.066339.

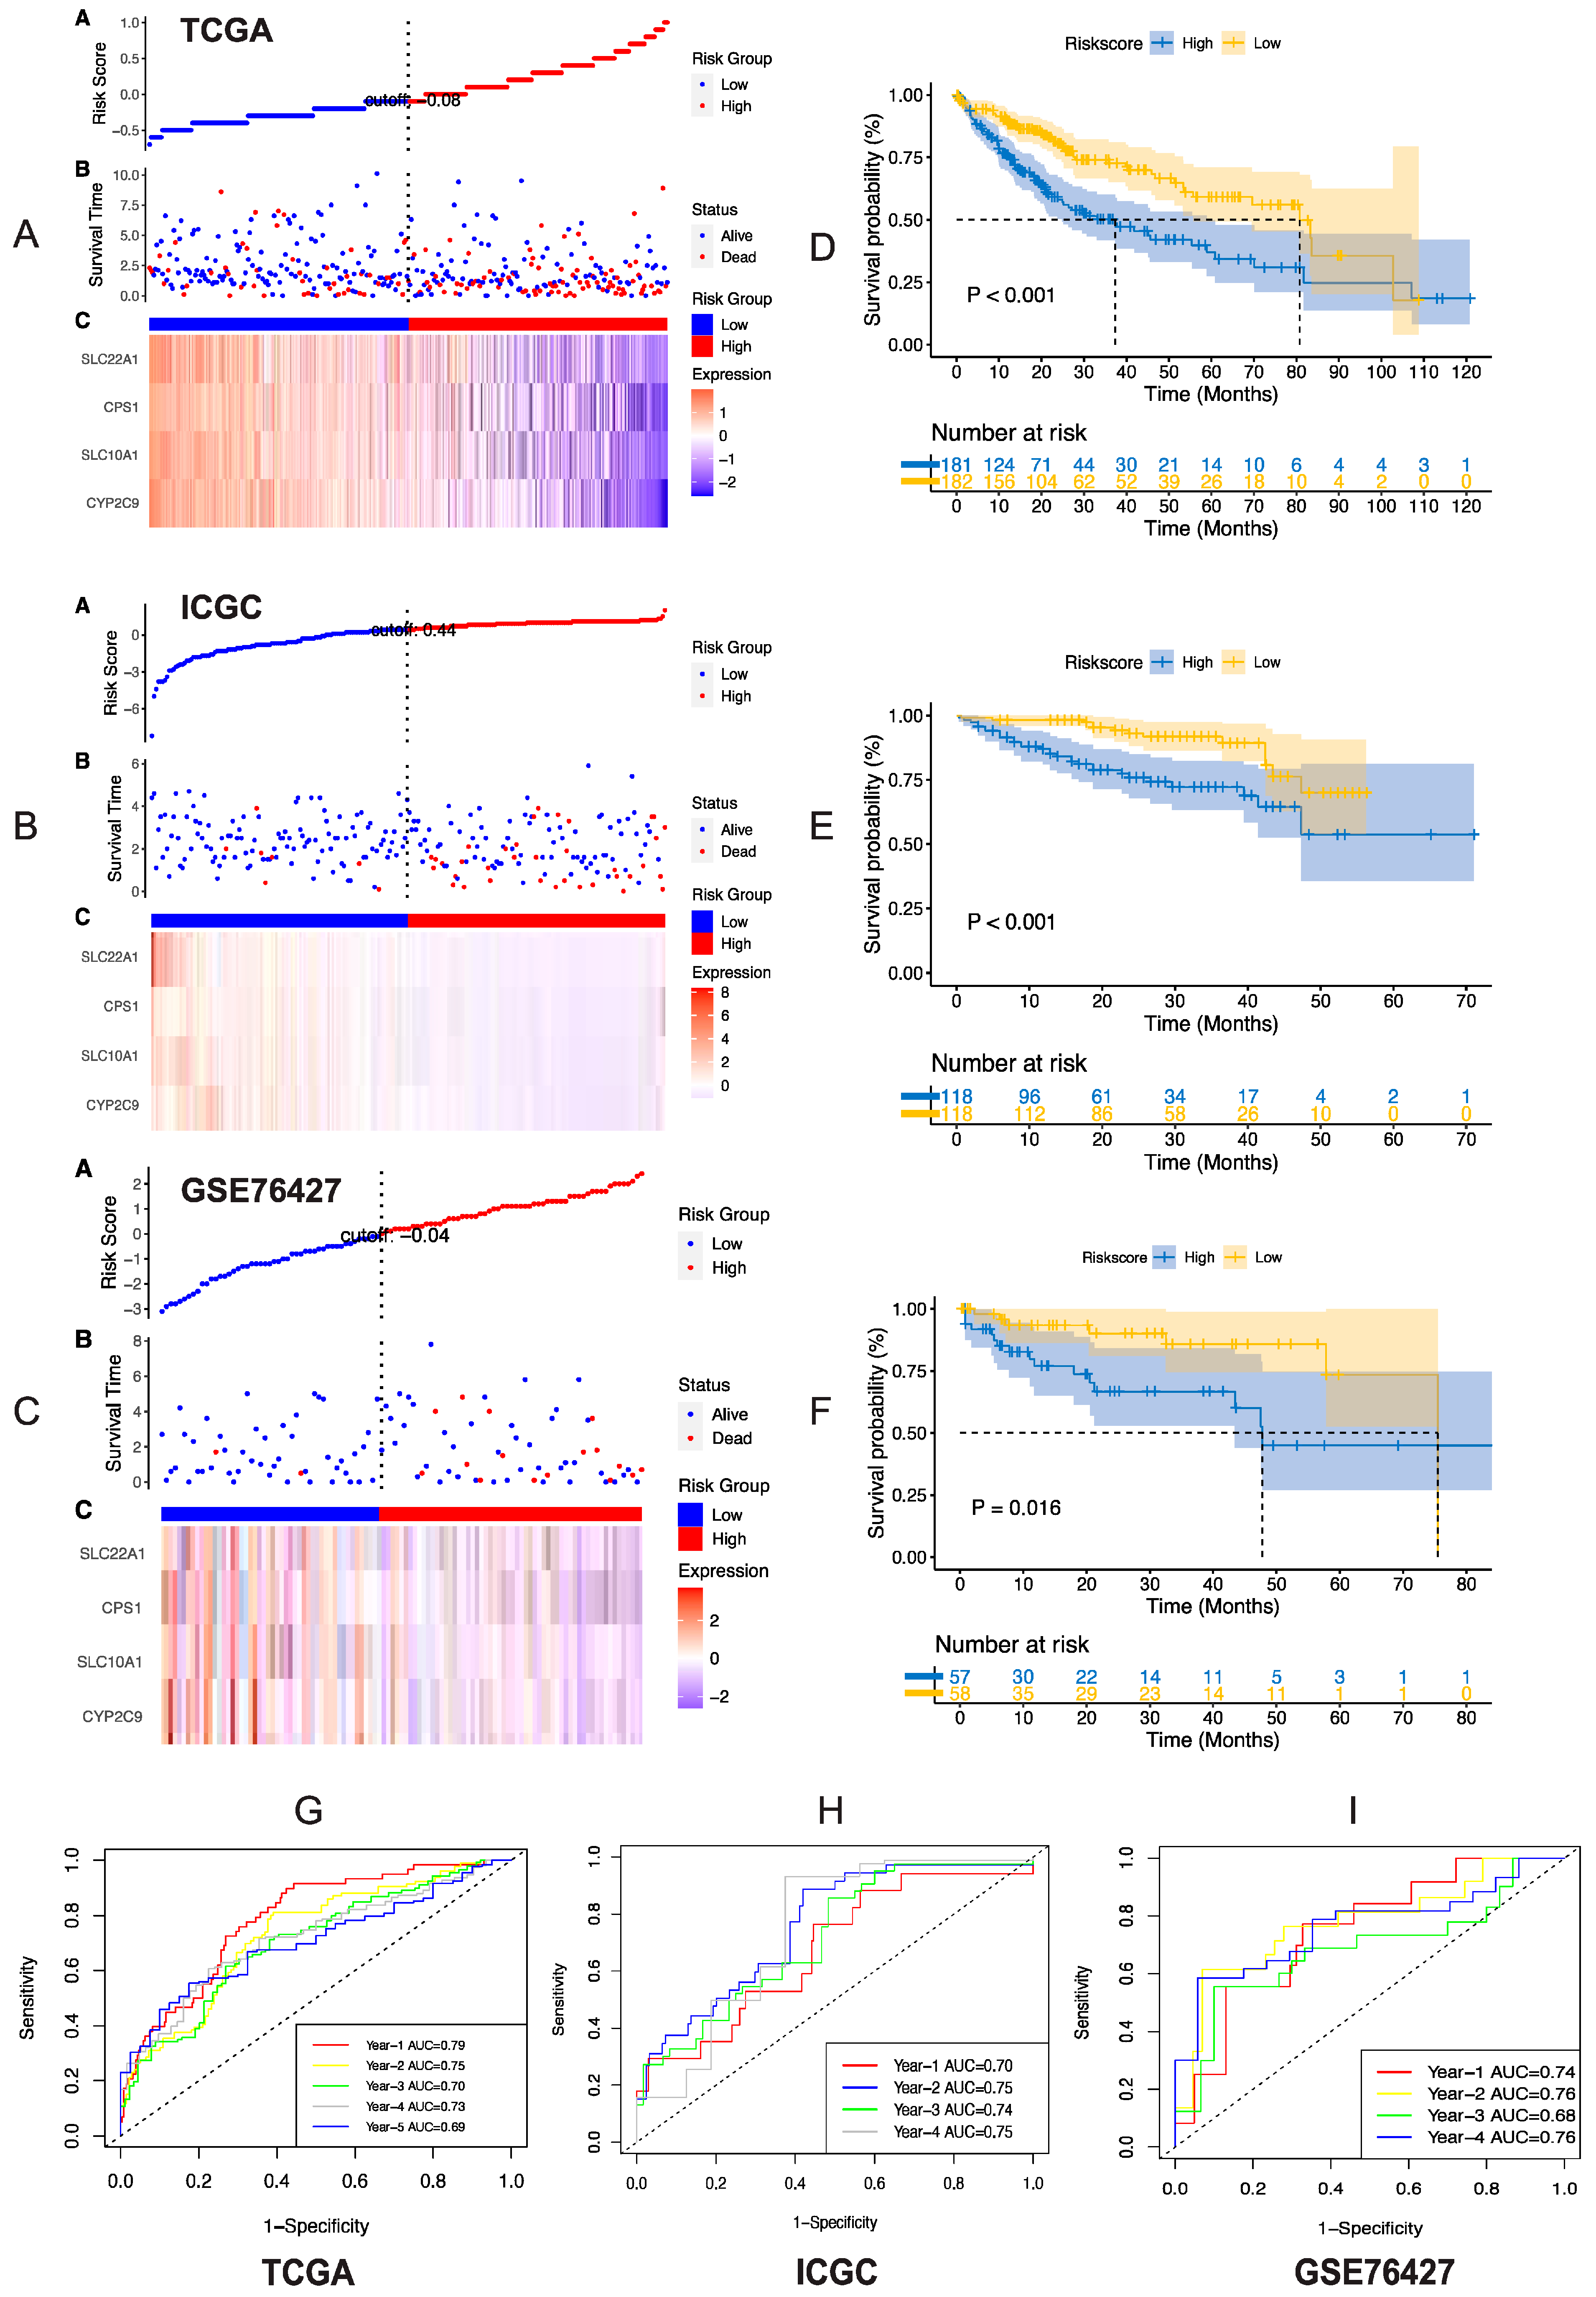
3.3. Validation of Risk Model

The risk scores were computed for each patient in the TCGA, ICGC and GSE76427 datasets (Table 1). Based on the risk score, patients were divided into low- and high-risk groups based on the median cutoff (Figure 3A–C). Accordingly, patients with high risk scores displayed shorter OS than those with low risk scores (PTCGA < 0.001, PICGC < 0.001, PGSE76427 = 0.016; Figure 3D–F). The AUC of the TCGA cohort registered 0.79, 0.75, 0.70, 0.73 and 0.69 at 1, 2, 3, 4, and 5 years, respectively (Figure 3G), while the AUC of the ICGC cohort was 0.70, 0.75, 0.74, and 0.75 at 1, 2, 3, and 4 years, respectively (Figure 3H). Similarly, the GSE76427 cohort’s AUC values were 0.74, 0.76, 0.68, and 0.76 at 1, 2, 3, and 4 years, respectively (Figure 3I).
In addition, we divided subsets of patients of the TCGA dataset into low- and high-risk groups according to clinical characteristics, e.g., grouping by gender or age, and examined the variations in OS of the different subsets (Figure S1A). The OS of low-risk individuals was considerably greater than that of high-risk patients in the subgroups with male gender, age > 60, age ≤ 60, no prior malignance, vascular invasion, no vascular invasion, BMI > 24, BMI ≤ 24, T1/2 stage, T3/4 stage, tumor grade 1/2 and AJCC stage (Figure S1). Furthermore, although there was no significant statistical difference, we discovered a tendency for decreased OS in the high-risk group in patients with female gender, prior malignancy, or 3/4 grade tumors (Figure S1). We used the Chi-square test to explore the relationship between risk score and clinical features. In the TCGA cohort, a high risk score was associated with advanced tumors (p = 0.025), vascular invasion (p = 0.016) and poor tumor differentiation (p = 0.001) (Table 2). Moreover, univariable and multivariable Cox regressive analyses of the gene signature and other clinicopathological variables in the TCGA, ICGC and GSE76427 databases demonstrated that the risk score is independently prognostic in each database (Figure 4A–C).

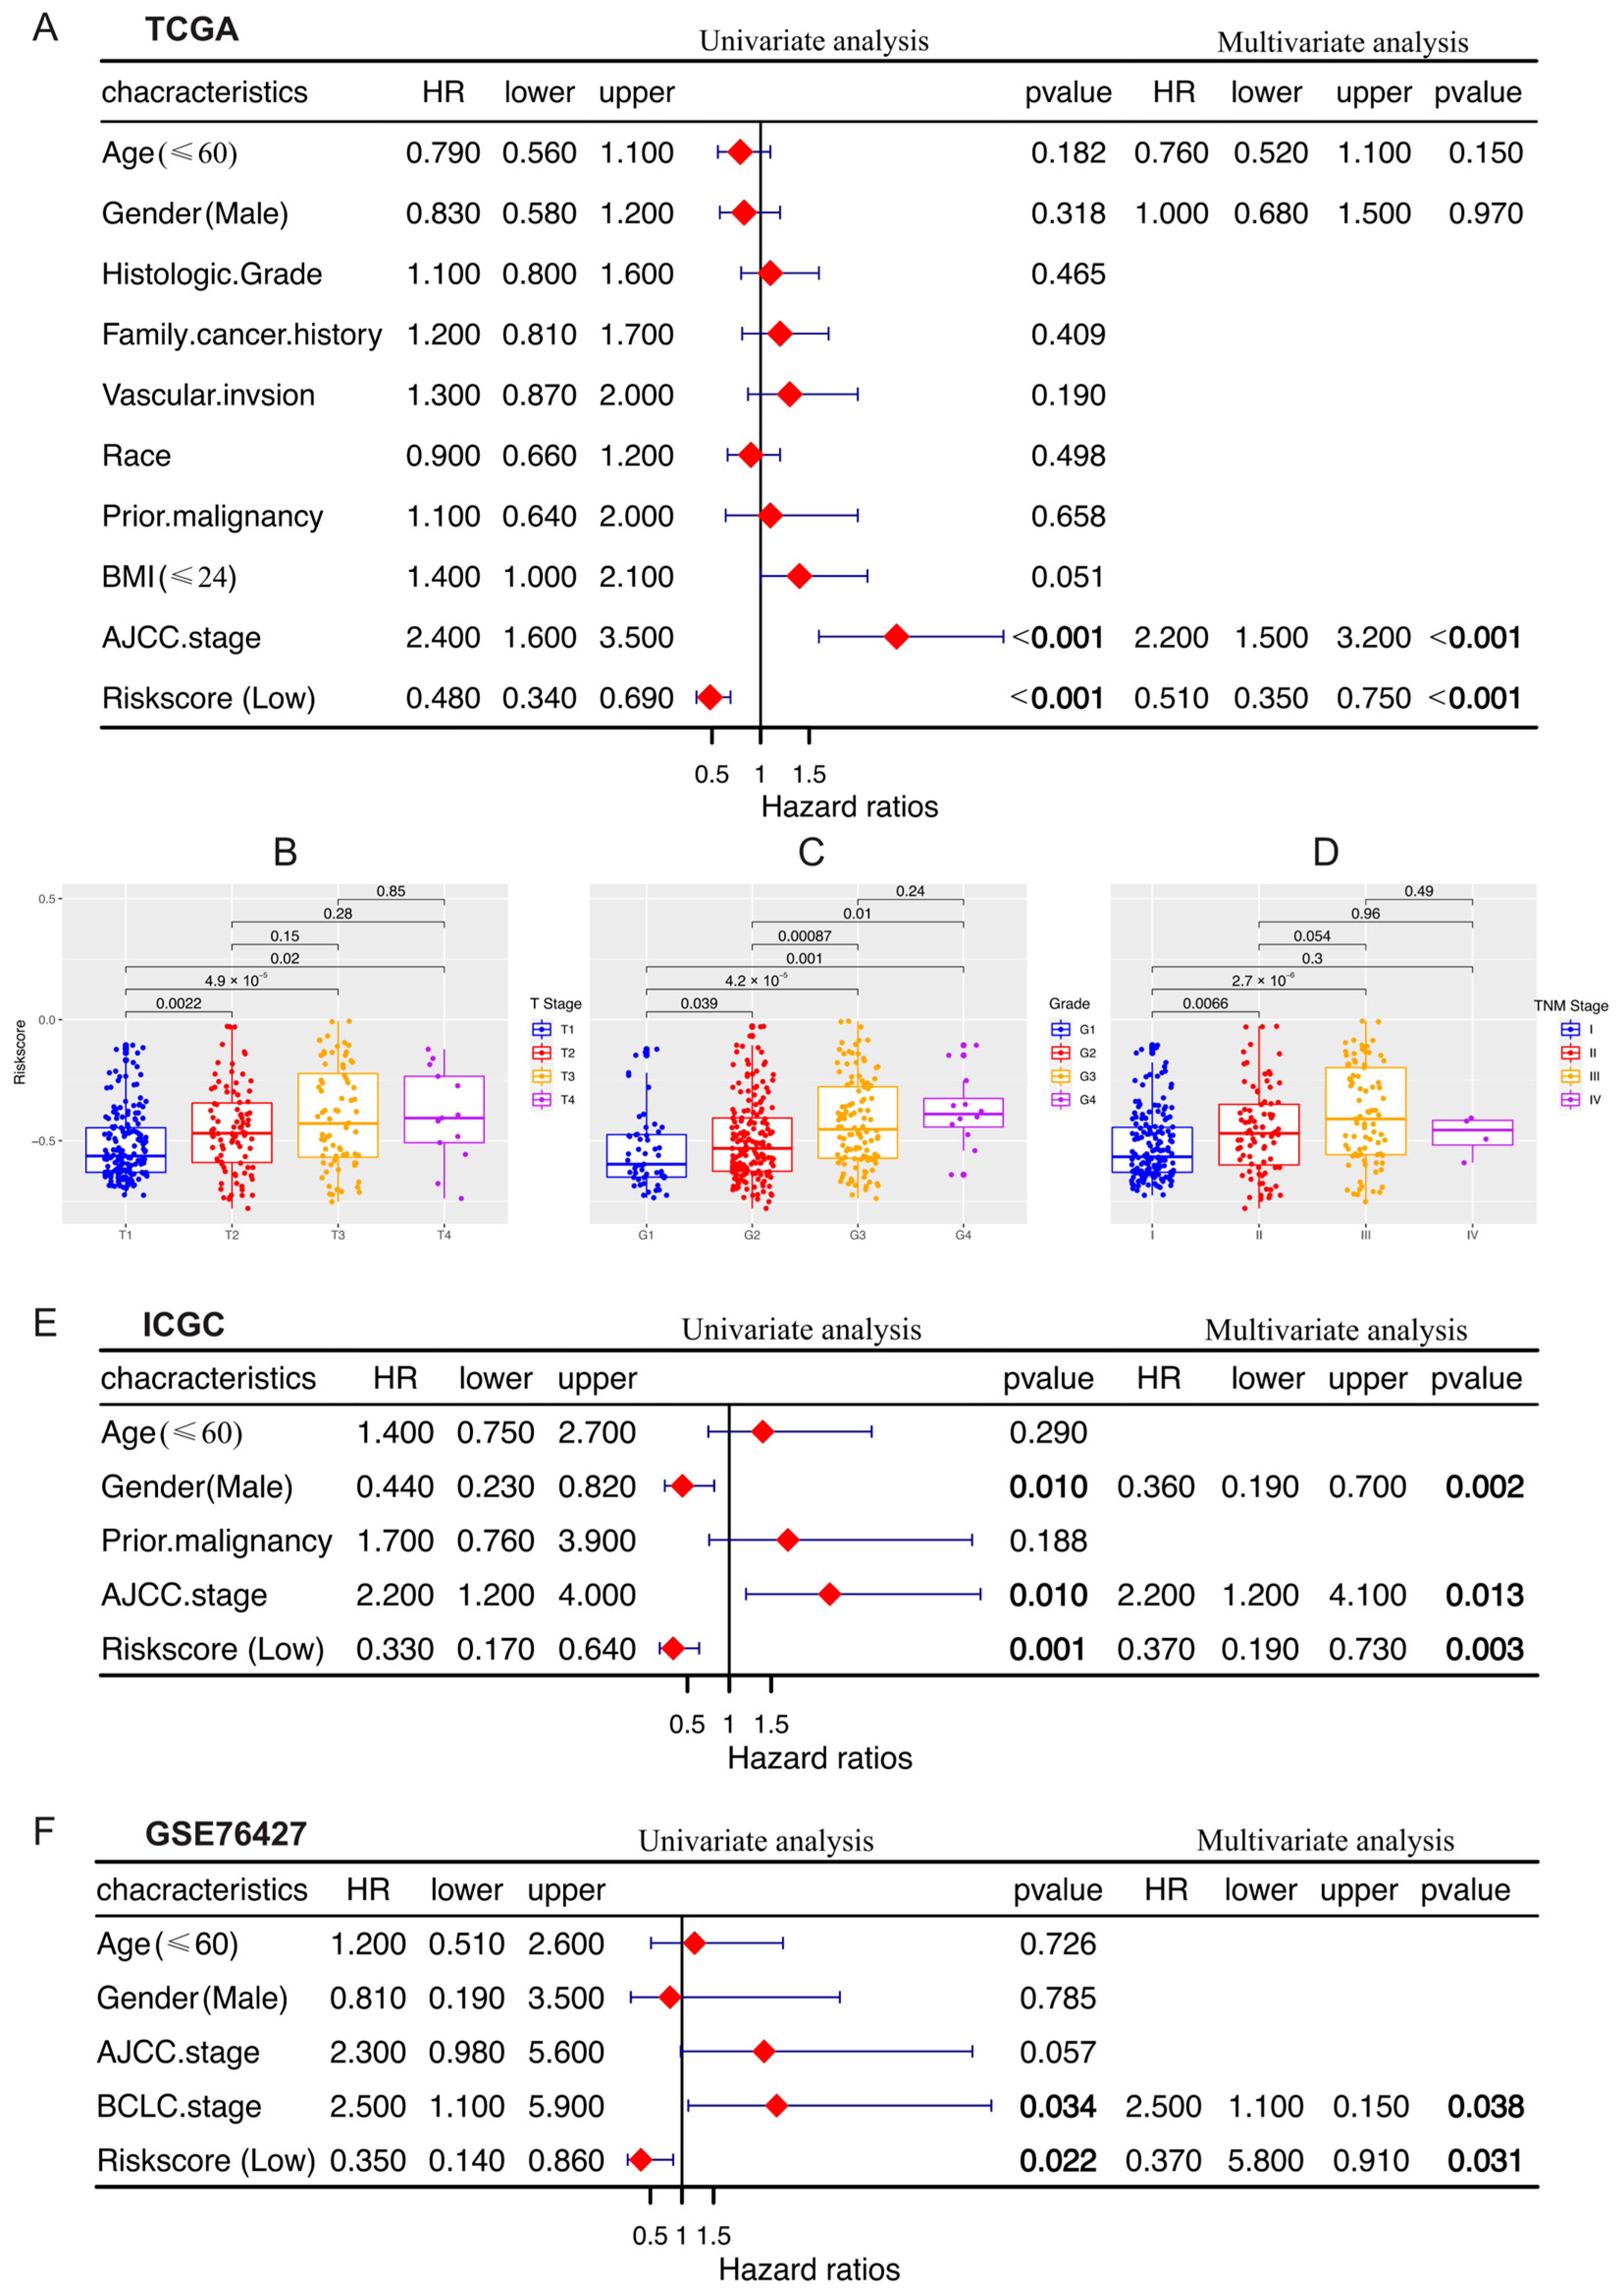
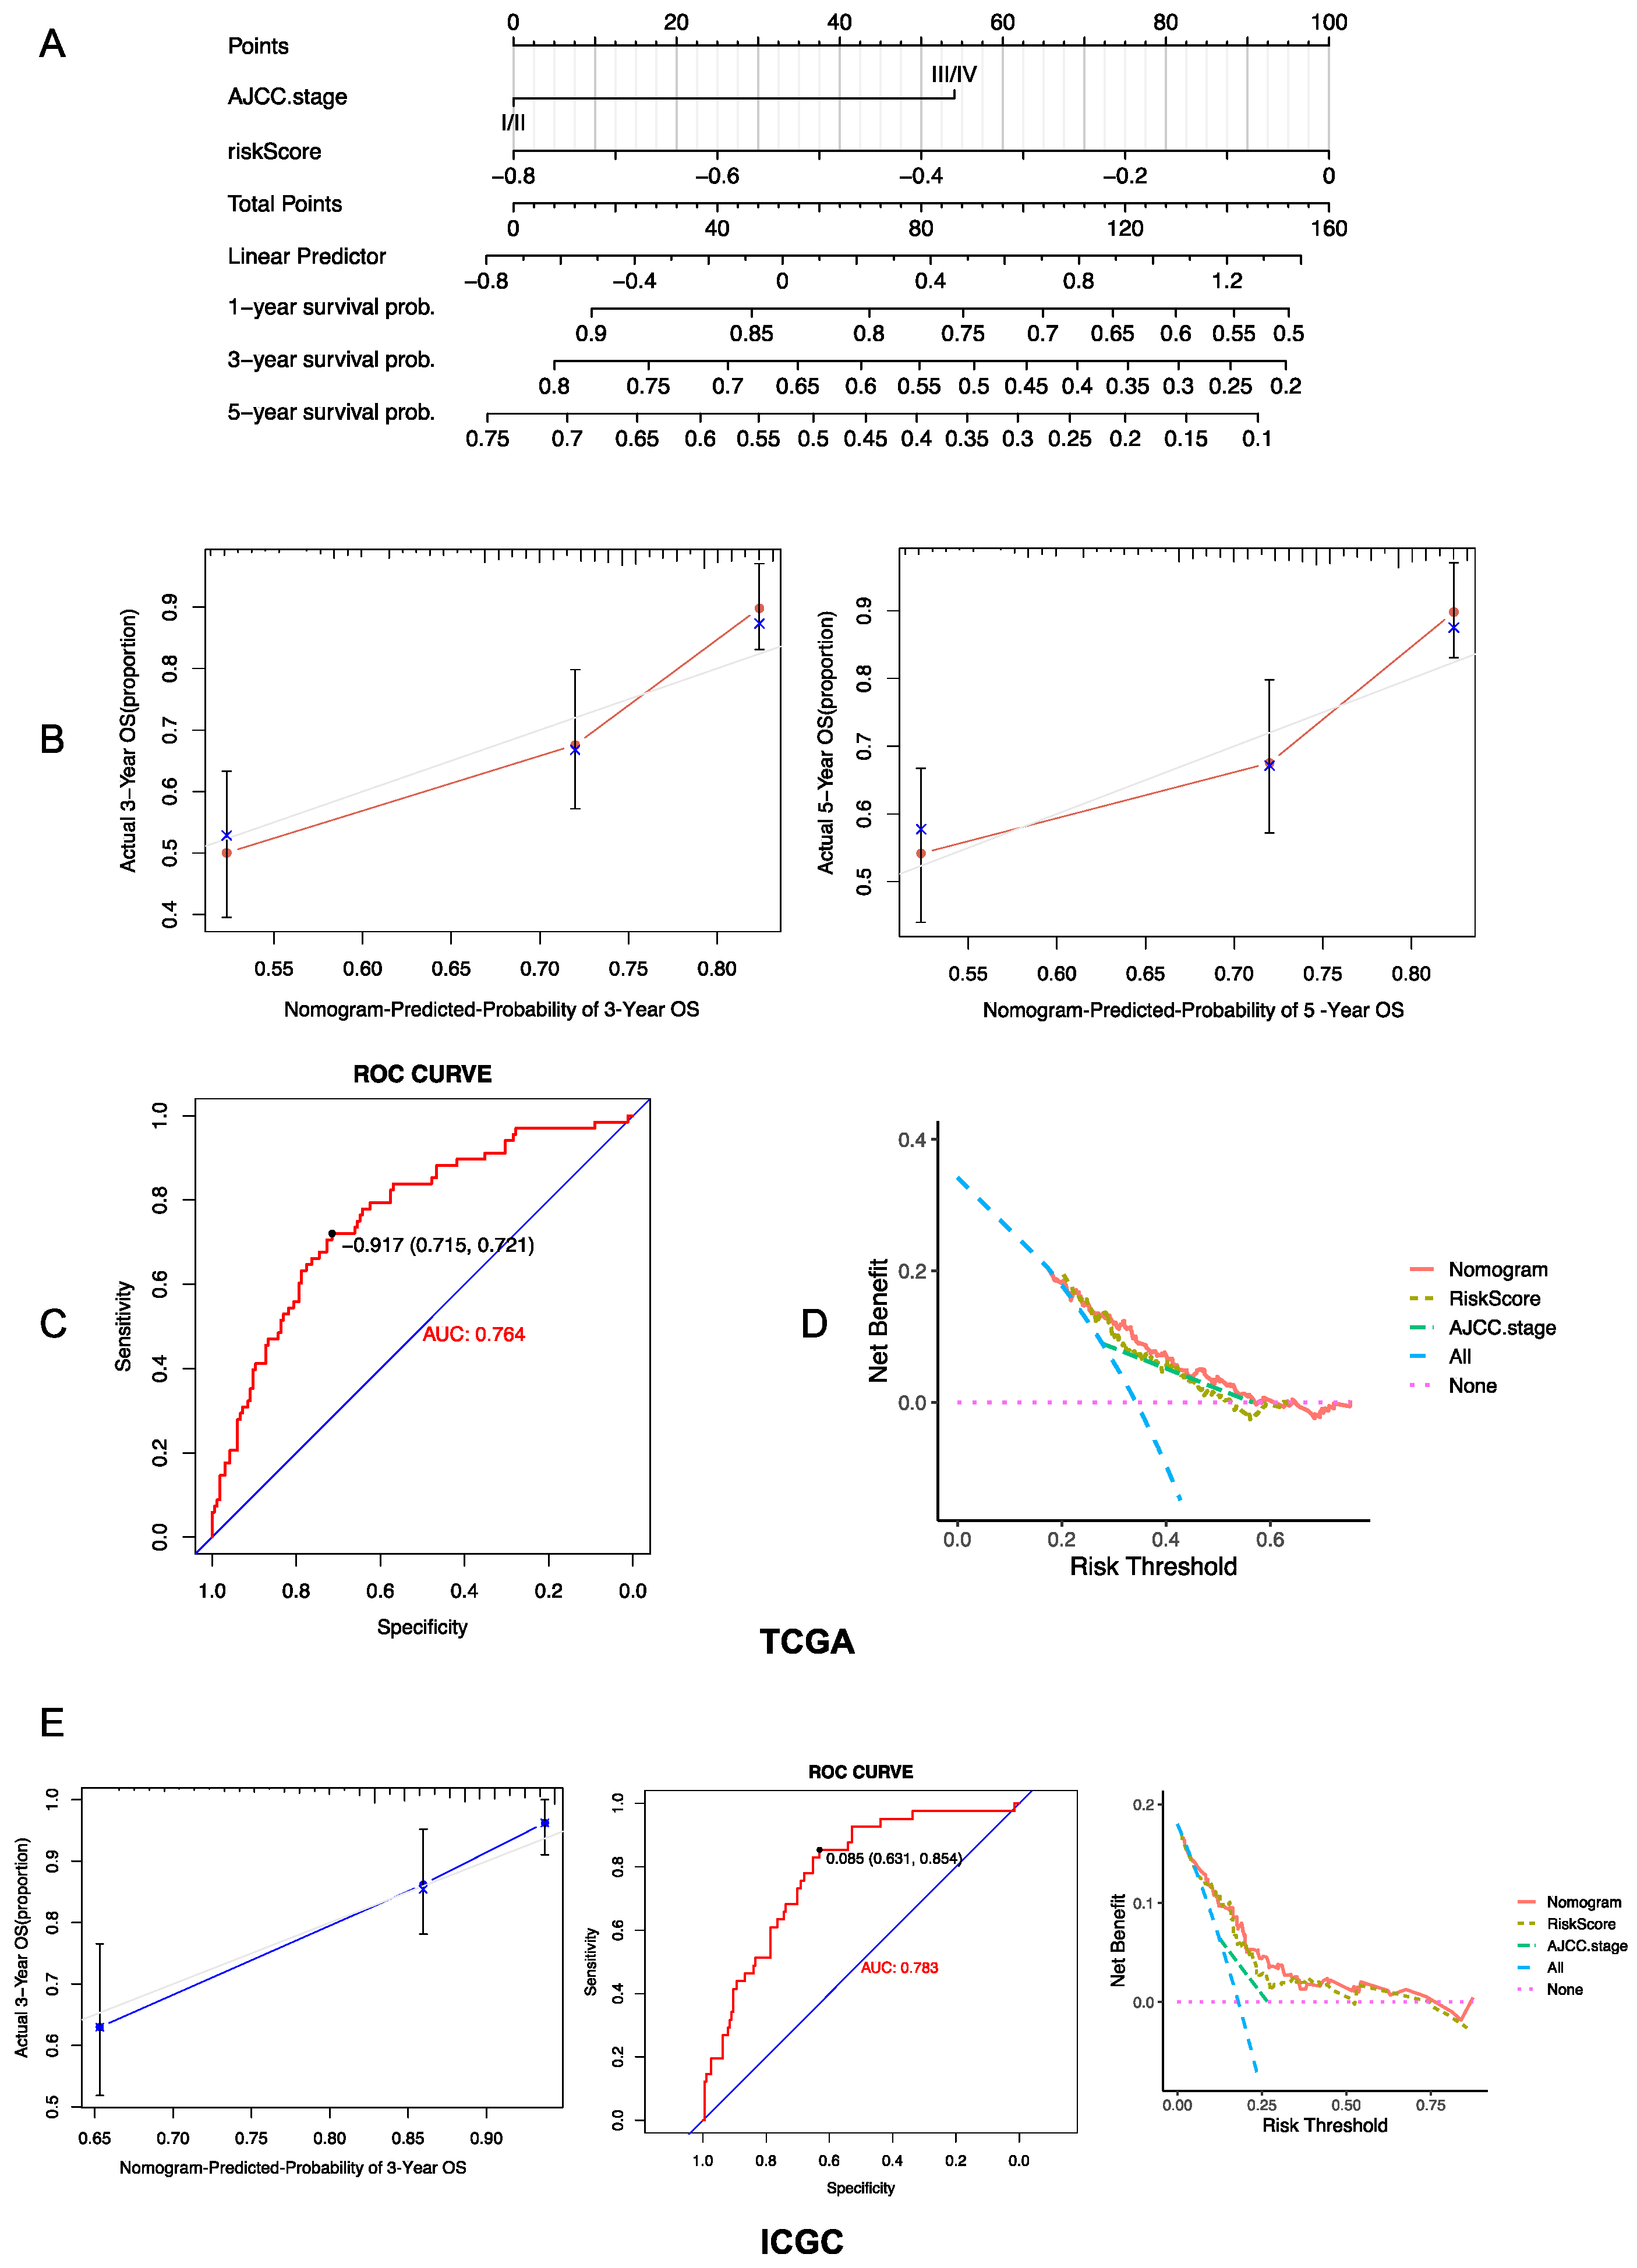
3.4. Establishment and Evaluation of a Prognostic Risk Score-Based Nomogram

Based on the TCGA cohort, we developed a risk score-based nomogram to further assess the feasibility of our risk model in forecasting patient outcomes. The nomogram particularly includes the risk model and AJCC stage as these variables were independently associated with OS. Then, we applied it to forecast the 1-, 2-, and 3-year OS (Figure 5A). The 3- and 5-year OS predictions under the nomogram and the actual probability matched reasonably well, as seen by the calibration curve (Figure 5B). ROC curve analysis told us that the nomogram could effectively predict OS (Figure 5C). We further conducted a decision curve analysis to see if the net clinical advantage of the risk score or AJCC stage alone could be increased when they were integrated into the nomogram. The results showed that the nomogram demonstrated stronger prognostic value compared to clinical features alone (Figure 5D). Moreover, the nomogram’s outstanding prediction accuracy was likewise confirmed by the ICGC cohort (Figure 5E).

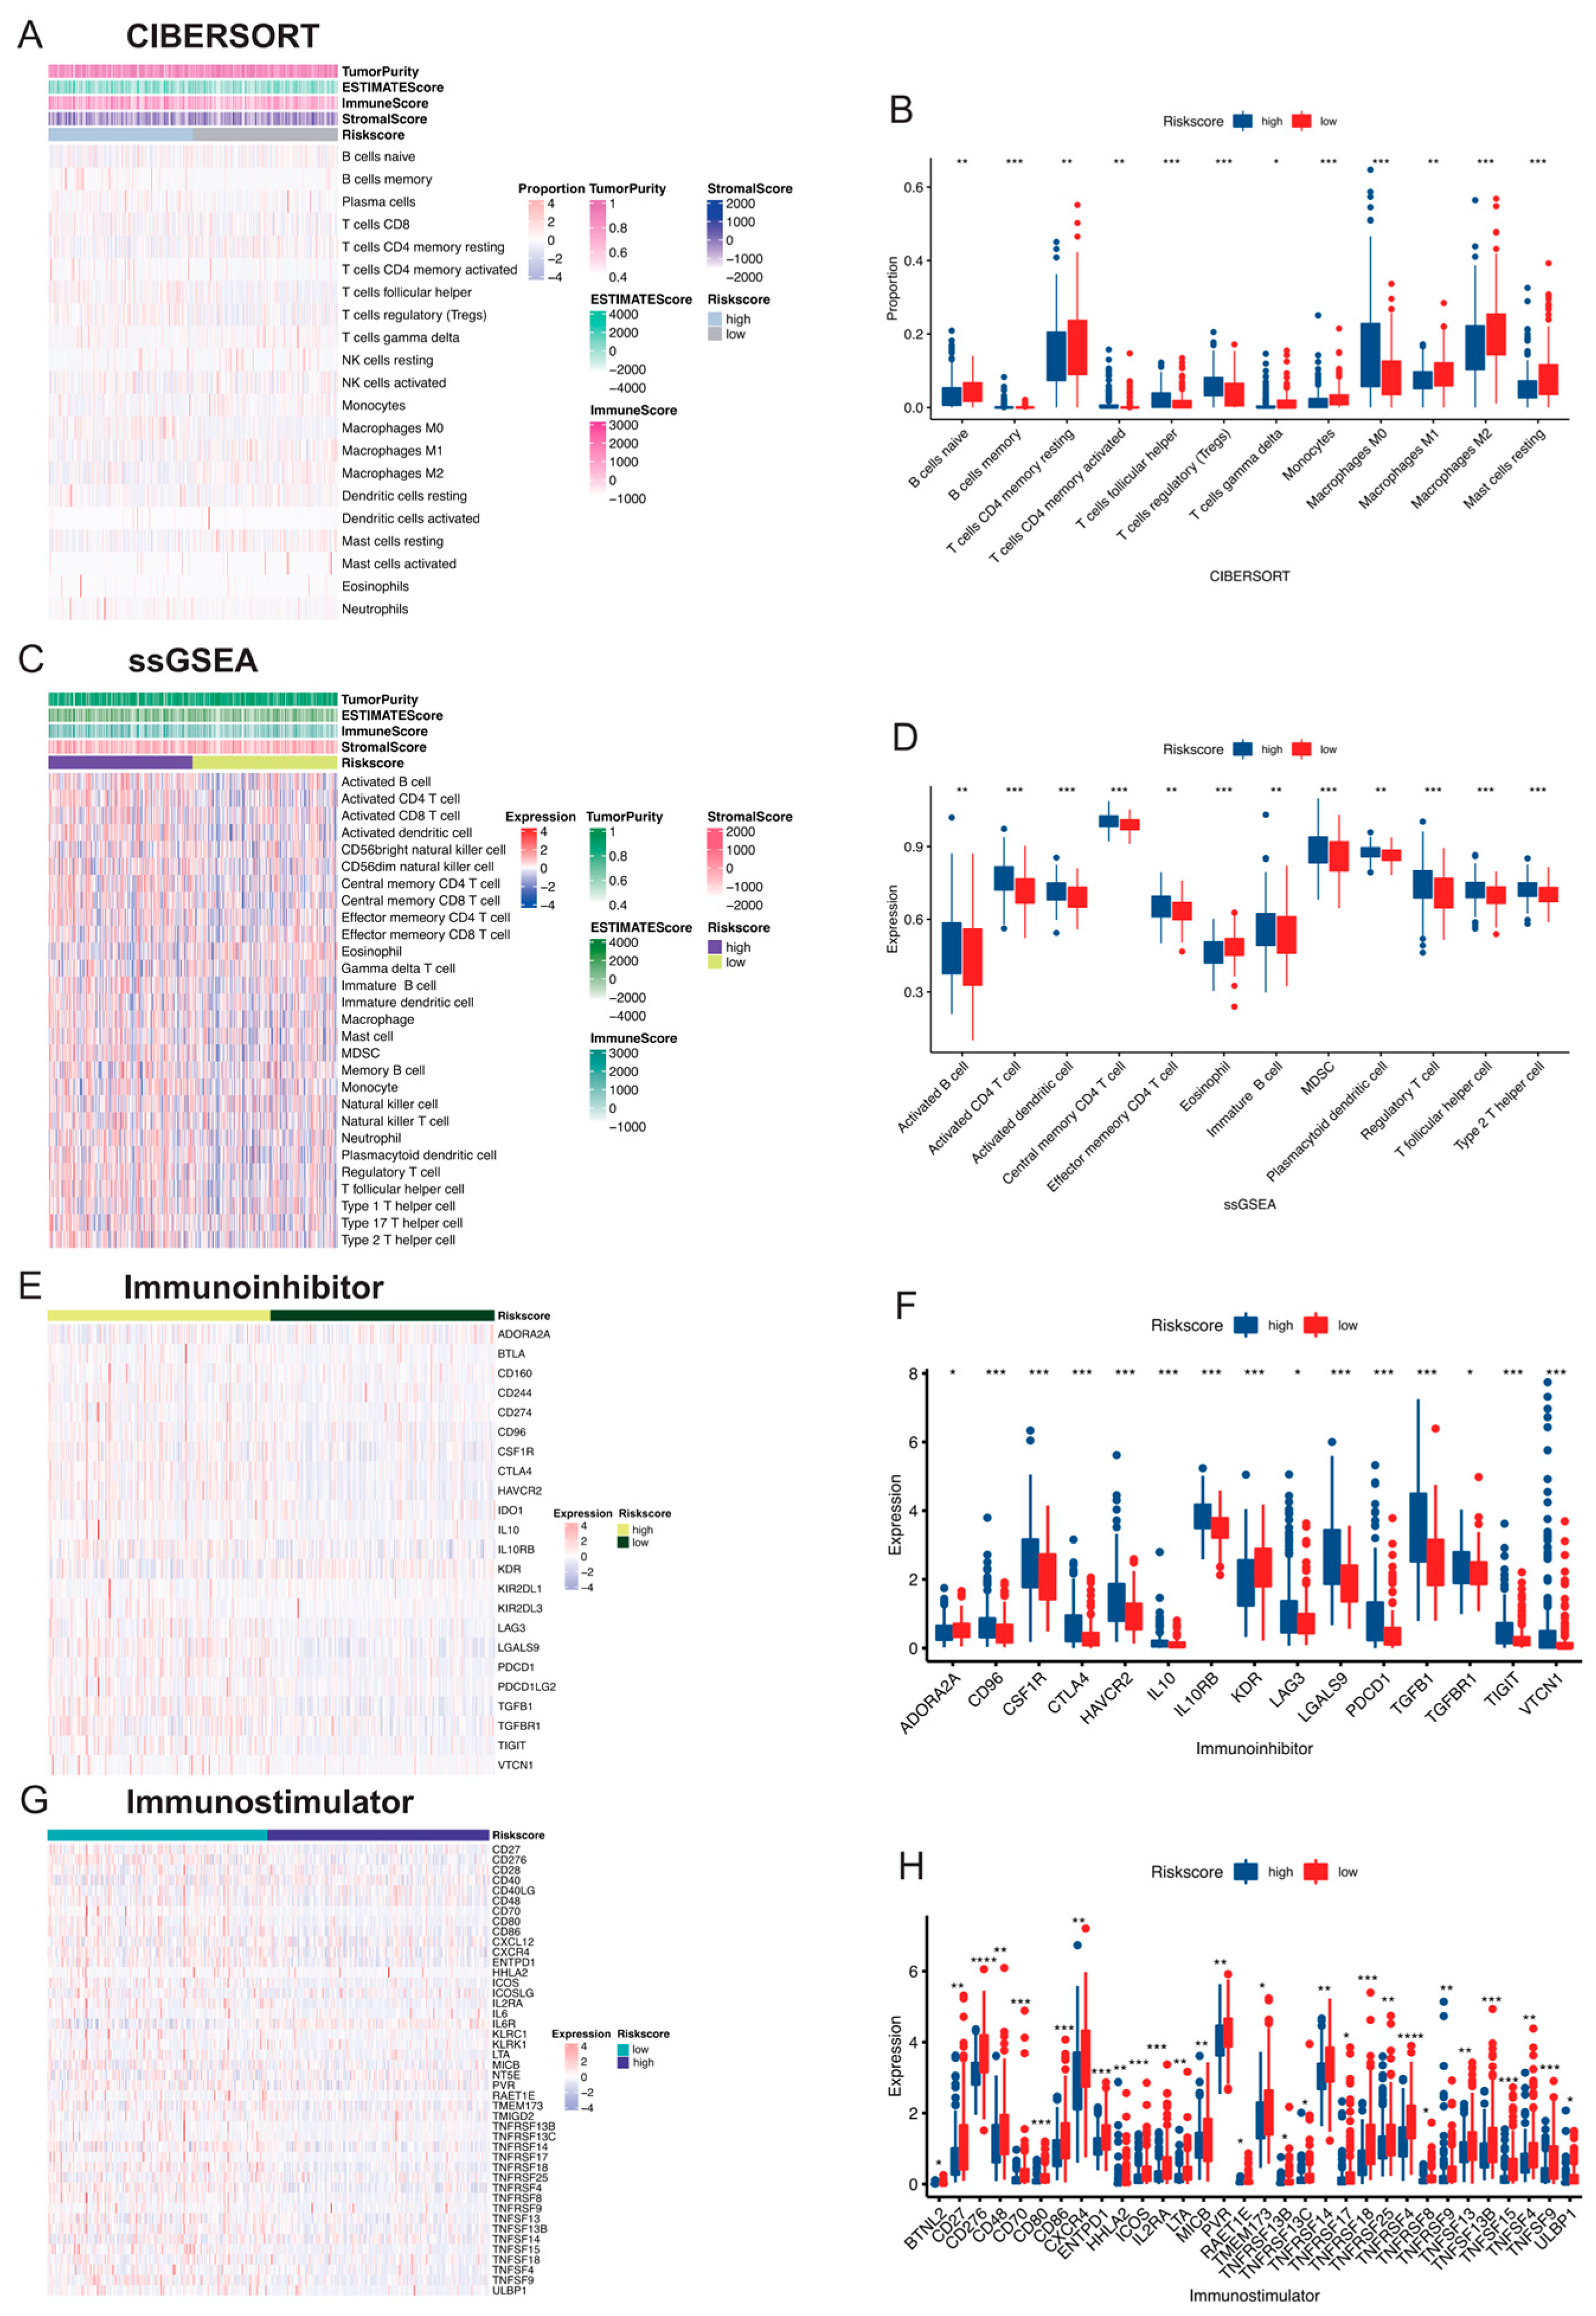
3.5. Comparison of Immune Activity between Risk Score Subgroups

ESTIMATE, CIBERSORT, and ssGSEA were used to investigate the differences in immunological function. In the HCC samples of the TCGA dataset, immune cell infiltration was investigated by CIBERSORT (Figure 6A) and ssGESA analysis (Figure 6C) between high- and low-risk-score groups according to the risk score. We discovered that patients in high- and low-risk-score subgroups showed significant differences, with a higher abundance of tumor-infiltrating lymphocytes (TILs) and M1 and M2 macrophages and lower infiltrations of M0 macrophages (naive or non-polarized macrophages) and regulatory T (Treg) cells observed in low-risk-score groups (Figure 6B–D). Notably, many well-known immunoinhibitory-related genes, such as IL10, PDCD1, CTLA4, LAG3, TIGIT, etc., were highly expressed in the high-risk group (Figure 6E,F), while immunostimulatory-related genes, like CD27, CD276, CD80, CD86, IL2RA, etc., mostly showed low expression in the high-risk group (Figure 6G,H). The above results suggested a probable relationship between our established signature and the immune microenvironment.

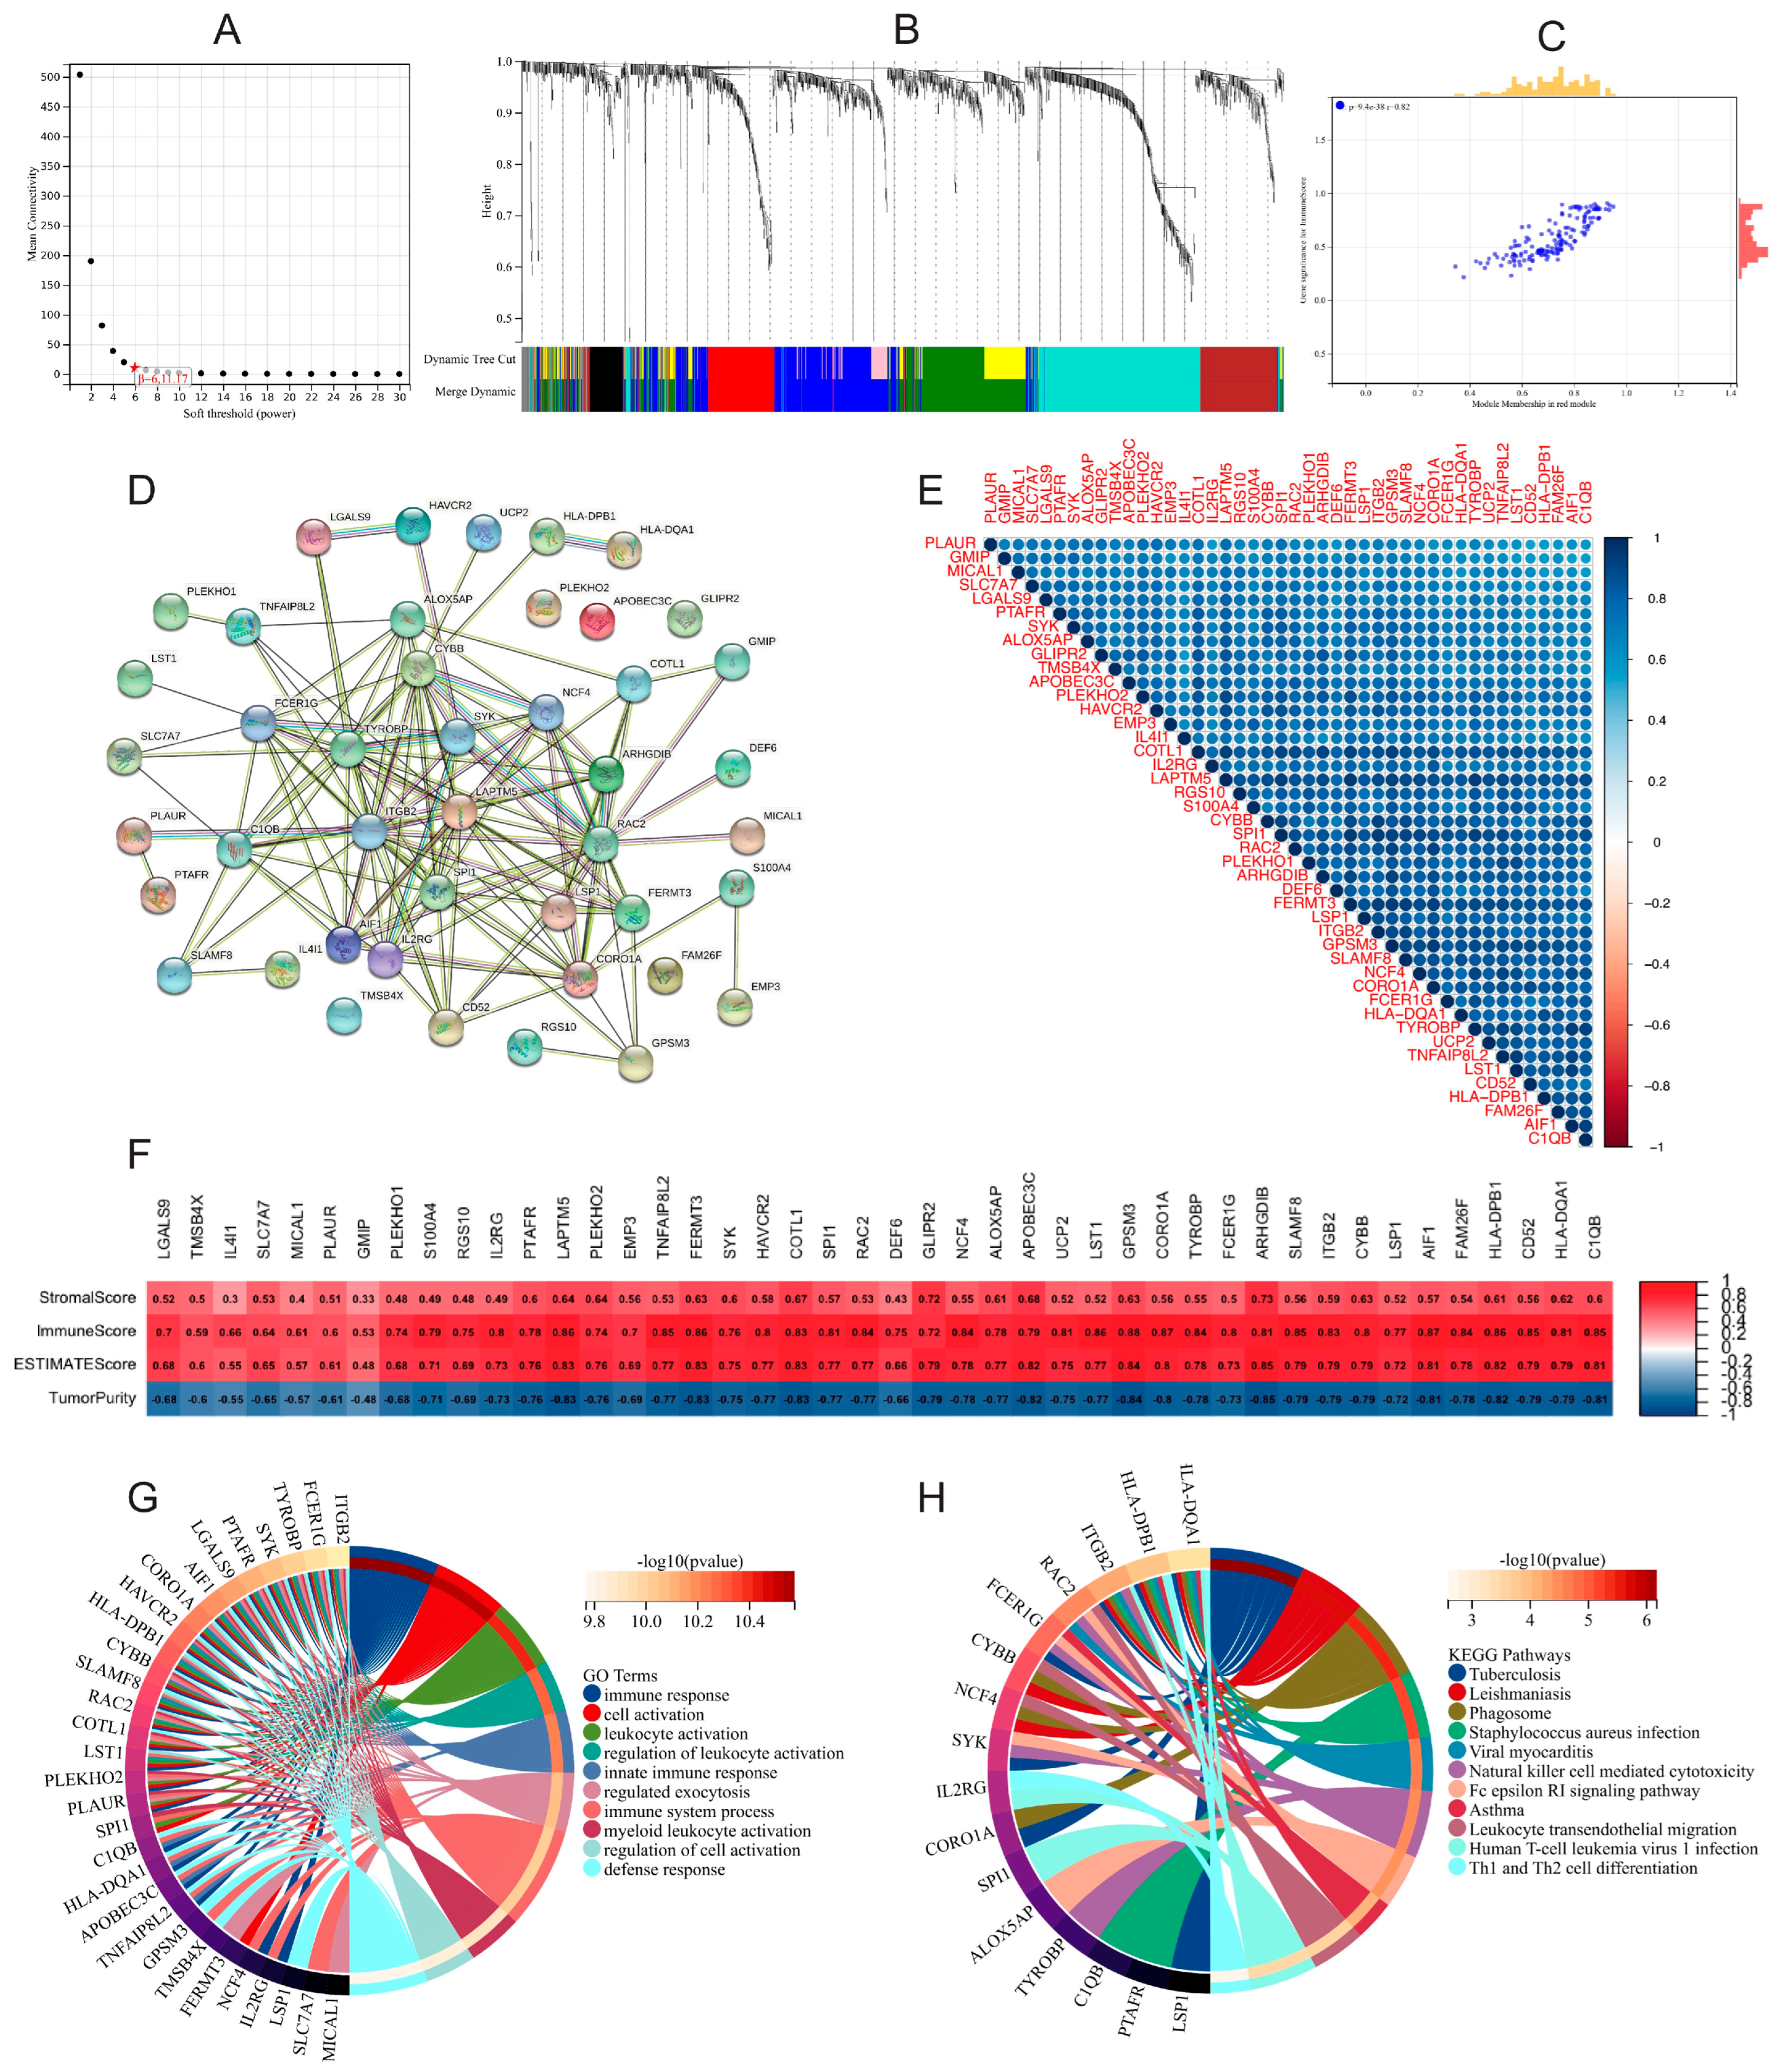
3.6. Functional Enrichment and WGCNA of DEGs in High- and Low-Risk-Score Groups

Gene expression analysis was carried out and identified 1664 DEGs by comparing the high- and low-risk subgroups in the TCGA dataset (Figure S2A). GO analysis demonstrated that these DEGs were mostly enriched in cellular metabolic process, cell proliferation and catalytic activity (Figure S2B,D). KEGG analysis indicated that these DEGs were closely related to metabolism pathways, such as the PPAR pathway, cell cycle, metabolic pathway, and drug metabolism (Figure S2C,E). In addition, KEGG enrichment analysis revealed that the DEGs were also associated with enzymes and cytokines, suggesting that the subgroups had a relationship with the immune microenvironments.
WGCNA was used to construct a network based on the expression matrix of 1664 DEGs (Figure 7A,B). The red module was selected owing to its correlation with the immune score (r = 0.82, p < 0.001, Figure 7C). Thereafter, 44 hub genes were obtained from the red module based on MM > 0.8 and GS > 0.25. We then conducted PPI analysis and checked for correlations across the hub genes (Figure 7D,E). Spearman’s correlation analysis between genes and ESTIMATE (stromal score, immune score, ESTIMATE score and tumor purity) demonstrated that all of the hub genes were significantly correlated with immunity (Figure 7F). In order determine the biochemical functions of the 44 genes, we conducted GO and KEGG enrichment analysis. The most significant GO and KEGG term was the negative regulation of the immune system (Figure 7G,H).

3.7. Expression and Prognostic Role of 4 M2 Macrophage-Related Genes

The prognostic role of the four gene signature was further investigated in the TCGA cohort. We obtained the four genes’ expression data for 33 types of cancers and found that differences in the expression of genes between normal and tumor samples of each cancer type were almost significant (Figure S3A–D). It was found that the levels of SLC22A1 (Figure S3A), CYP2C9 (Figure S3B), SLC10A1 (Figure S3C) and CPS1 (Figure S3D) were higher in normal samples than in HCC tissues.
It is worth noting that, according to the Spearman correlation analysis, the expression levels of four M2 macrophage-related genes were inversely proportional to M2 macrophage abundance (Figure S3E). Additionally, a high expression of the four genes in combination with a low abundance of M2 macrophages showed favorable survival, while low gene expression along with high M2 macrophage infiltration exhibited the worst prognosis (Figures S3F). Moreover, the correlation matrix showed that these four genes were strongly positively correlated with each other (Figure S4A), indicating that a synergistic relationship among SLC22A1, CYP2C9, SLC10A1 and CPS1 may affect macrophage infiltration and prognosis.
To further assess the prognostic value of SLC22A1, CYP2C9, SLC10A1 and CPS1 in HCC, we divided patients into high- and low-gene-expression subgroups according to the median cutoff to perform KM survival analysis. The results indicated that patients with higher SLC22A1, CYP2C9, SLC10A1 and CPS1 expression achieved better OS in both the TCGA (Figure S4B(a–d)) and ICGC (Figure S4C(a–d)) cohorts. Finally, we performed multivariate analysis to investigate whether SLC22A1 (Figure S4D), CYP2C9 (Figure S4E), SLC10A1 (Figure S4F) and CPS1 (Figure S4G) could all be considered as independent prognostic factors for HCC.

3.8. The mRNA and Protein Expression Patterns of the Four M2 Macrophage-Related Genes in HCC

To assess the protein expression of the four genes that were used for the construction of the risk score signature, we acquired the immunohistochemistry data of pathological specimens from the website of The Human Protein Atlas. As shown in Figure S5, the protein expression of the four M2 macrophage-related genes is significantly downregulated in HCC tissues compared to normal tissues (Figure S5A). We also performed Western blot and RT-qPCR on six paired HCC samples and corresponding non-tumorous tissues for basic experimental validation, to analyze gene expression and different regulation in the samples. Here, the mRNA of the four genes was notably less detected in HCC samples compared to their respective normal liver tissue, with protein expression showing the same tendency (Figure S5B,C).

4. Discussion

In hepatocarcinogenesis, macrophages act as a double-edged sword, regulating chronic liver inflammation by balancing two types of Kupffer cells: anti-inflammatory M1 macrophages and pro-inflammatory M2 macrophages [30]. M1 macrophages appear to decrease early HCC tumorigeneses by eliminating cancer cells as adaptive immunity soldiers. During the growth of HCC tumors, macrophages undergo a phenotypic transition from M1 to M2 [31,32]. By inhibiting the adaptive immune system, M2 macrophages increase cancer cell growth and invasion. Tumor-associated macrophages (TAMs) are the most common form of leukocyte in HCC and play an important role in the disease’s development. TAMs are orientated toward the M2 phenotype and are seen in the stroma of HCC tissue [33]. However, the complete role of TAMs in the genesis and progression of HCC has only been partially understood until now.
M1 macrophages are predominantly triggered by lipopolysaccharide (LPS) and interferon-γ (IFN-γ) and are considered pro-inflammatory due to their ability to produce a plethora of pro-inflammatory cytokines, such as interleukin (IL)-1β, IL-6, nitric oxide synthase 2 (NOS2), and tumor necrosis factor-α (TNF-α) [34]. During acute infection, M1 macrophages are irreplaceable and protect the individual, fighting intracellular bacteria or viruses by producing nitric oxide and reactive oxygen species (ROS) [35]. The main role of M1 TAMs in tumor immunity is to destroy pathogens and drive type 1 T helper cell (Th1) responses [36]. In our study, there was no difference in the expression of M1 macrophages between tumor and normal tissues, and whether this can be used as a potential tumor marker requires further research.
This study presents the first systematic bioinformatic analysis to unravel a gene-based risk model focusing on M2 macrophages in large-scale cohorts of multicenter HCC patients. The gene-based risk model is able to stratify HCC patients according to overall prognosis and immunostimulatory/immunoinhibitory TME characteristics. The suggested gene signature might therefore be useful in the scenario of modern immunotherapy in HCC. In this study, we found that HCC patients with a high infiltration of M2 macrophages displayed a worse prognosis than those with low infiltration. We subsequently integrated eight datasets to determine DEGs between HCC and normal tissues, focusing on M2 macrophages, and filtered out four prognostic genes (SLC22A1, CPS1, SLC10A1 and CYP2C9) to create a risk model. Accordingly, patients with high risk scores displayed shorter OS than those with low risk scores. A high risk score was associated with advanced tumors, poor tumor differentiation and vascular invasion. Moreover, univariable and multivariable Cox regression analyses of the gene signature and other clinicopathological variables demonstrated that the risk score is independently prognostic in each database. We developed a risk score-based nomogram that could effectively predict OS in the dataset. We further discovered that patients in high- and low-risk-score subgroups showed significant differences, with a higher abundance of tumor-infiltrating lymphocytes (TILs) and M1/M2 macrophages and lower infiltrations of regulatory T (Treg) cells and M0 macrophages (naive or non-polarized macrophages) in the low-risk-score group. In our study, we found that HCC patients with a high infiltration of M2 macrophages displayed worse prognosis, and patients with low risk scores displayed better OS. Notably, many well-known immunoinhibitory-related genes were highly expressed in the high-risk group, while immunostimulatory-related genes mostly showed low expression in the high-risk group.
HCC tissue enriches M2 macrophages, and the TME in HCC is frequently controlled by immune regulatory cells, according to results from immunogenomic studies utilizing The Cancer Genome Atlas (TCGA) [34,35]. Functionally repolarizing TAMs has recently been a research focus, as a potential immunotherapeutic strategy. New research progress has been made for baicalin [35], 8-Bromo-7-methoxychrysin (BrMC) [37], and colony-stimulating factor-1 receptor CSF-1R blockers [38] in promoting the conversion of M2 TAMs to M1 TAMs. Tan et al. evaluated the presence of M1-/M2-like macrophages in the liver of baicalin-treated animals to investigate if baicalin might re-program them towards an M1-like phenotype [36]. In mice liver tissue, baicalin administration boosted the number of iNOS+ M1-like macrophages while significantly reducing the number of MR+ M2-like macrophages. The same group also demonstrated that baicalin suppressed tumor cell expansion by incurring a direct reprogramming effect on polarized macrophages. BrMC was identified to significantly suppress the expression of the M2 macrophage marker CD163 [37]. Also, BrMC alters the profile of cytokines secreted by TAMs. Mechanistically, BrMC inhibits NF-κB activation and reverses the M2 polarization of TAMs. Colony-stimulating factor-1 (CSF-1) and its receptor, CSF-1R, control the differentiation of macrophages and are crucial for macrophage infiltration in HCC. Ao et al. discovered that inhibiting CSF-1R with the competitive inhibitor PLX3397, which has a high level of specificity for CSF-1R tyrosine kinase, significantly slows tumor growth in a mouse model. TAMs from the PLX3397-treated tumors also exhibited polarization toward an M1-like phenotype. However, these findings have yet to be validated in independent clinical trials, and the specific mechanism of macrophage action on tumors remains unclear.
The discovery of genes linked to TAMs and immunological functions might facilitate the development of novel biomarkers for HCC and further the introduction of effective treatments focusing on TAMs. Therefore, we analyzed public genomic data to enlighten the role of TAMs and their interaction with the host’s immune system on a genetic basis. We used the CIBERSORT algorithms to conduct a complete and detailed assessment of immune cell infiltration in HCC and observed a significant difference in the expression of immune-related genes between groups with high and low M2 macrophage infiltration. With focus on the function of the upregulated or downregulated genes that were in the two groups, our results give rise to the hypothesis that M2 TAMs may influence the immunophenotype of HCC, leading to various clinical observations. Our work identified 30 M2 macrophage-related DEGs, with 18 of them being significantly related with overall prognosis and the combination of four (SLC22A1, CYP2C9, SLC10A1 and CPS1) being highly prognostic in HCC patients. It is therefore assumable that these genes drive patient prognosis by influencing M2 macrophage infiltration levels.
The TME of HCC is associated with treatment resistance, immunosuppression, angiogenesis, cell proliferation, and apoptosis [39]. ICIs are now the most popular immunotherapy medications for HCC in clinical routine and studies [40]. Although immunotherapy improved overall outcomes, the prognosis of HCC remains poor. It is increasingly necessary to find more suitable biomarkers for developing precise treatment plans. Studies have shown that tumor-infiltrating lymphocytes (TILs) are an essential component of the adaptive immune system and the basis of current immunotherapy [41]. Usually, high levels of TILs are mostly significantly associated with increased OS [42]. This is consistent with our study, where the low-risk group was negatively correlated with the number of B cells, gamma delta T cells, CD4 memory resting T cells, resting mast cells and monocytes. Additionally, the low-risk-score group had much lower amount of regulatory T cells. To our knowledge, there is a strong correlation between high tumor expression levels of immune checkpoint inhibitor genes and a large number of regulatory T cells [43], which may explain the higher number of immunoinhibitory-related genes in the high-risk-score group. Similarly, the low expression of immunostimulatory-related genes in the low-risk group may also explain its good prognosis. Immune cell and marker levels, such as CD68+ macrophages, CD8+ TILs, PD-L1, CD47, and NK cells, are elevated in response to immunotherapy [44], which can be used as the basis for immunotherapy. Additionally, in our study, we performed WGCNA analysis to obtained 44 hub genes that synergistically interacted with each other, and all were positively correlated to the immune score, which could be a guideline for future immune-focused research.
While the initial clinical studies investigating ICIs in HCC were disappointing, the IMbrave150 trial investigating the combination of the antiangiogenic agent bevacizumab in combination with atezolizumab (PD-L1 inhibitor) versus sorafenib has defined the new gold-standard for HCC patients with progressed disease [45]. In this trial, atezolizumab-bevacizumab has been shown to have statistically significant and clinically meaningful benefits for several oncological outcomes. Further, the recent update reassured clinical efficacy, with a median OS of more than 19 months in HCC patients receiving the immune-based combination versus 13 months in the control arm [46]. Despite ICIs seeming to have finally found their role in HCC as part of combinatorial strategies, many questions remain unanswered. As only a proportion of HCC patients benefit from immunotherapy, a more profound understanding of the role of potential biomarkers, including PD-L1 expression and genetic characteristics, e.g., microsatellite instability (MSI) status and tumor mutational burden (TMB), is essential. Also, clinical trials on HCC immunotherapy differ with respect to designs, patient characteristics, investigated drugs and defined clinical outcomes [47,48]. As such, we believe that bioinformatic approaches identifying key genes that focus on M2 macrophages as the main players on a cellular level are helpful for identifying and furthering the transfer of genetic-based risk scores into the clinical reality of HCC treatment.
SLC22A1 (solute carrier family 22 member 1) transcripts for the identically named protein, also known as organic cation transporter 1 (OCT1), which transports many structurally diverse endogenous and exogenous substrates [49]. Interestingly, Herraez et al. already showed evidence that the downregulation of SLC22A1 mRNA expression is linked with progressed tumor stages and unfavorable patient survival, by analyzing the expression patterns of the SLC22A1 in a large series of HCC [50]. In addition, the downregulation of SLC22A1 has a negative effect on the responsiveness to sorafenib [51]. However, no association to macrophages has been reported in the literature yet. CYP2C9 (Cytochrome P450 family 2 subfamily C member 9) encodes a member of the cytochrome P450 superfamily of enzymes. The protein CYP2C9, which is mainly expressed in the liver and intestine, metabolizes a variety of drugs and endogenous compounds as serotonin and polyunsaturated fatty acids due to its epoxygenase activity concerning a wide range of biological active products [52]. CYP2C9 is one of the most important and abundant xenobiotic metabolizing enzymes, and a high-activity CYP2C9 genotype is linked to an increased risk of colorectal cancer [53], whereas a low-activity CYP2C9 genotype is linked to an increased risk of colorectal adenoma [54] and lung cancer [55]. Additionally, some studies found reduced CYP2C9 expression in HCC tissue, indicating a role of CYP2C9 in the pathogenesis of HCC [56,57]. Of note, in a study about the role of CYP450 epoxygenases in monocytes/macrophages, Bystrom et al. observed an induction of CYP2C9 mRNA in M2 macrophages [58]. SLC10A1 (Solute carrier family 10 member 1) encodes for the identically named protein, also known as hepatic sodium/bile acid cotransporter, which transports conjugated bile salts from plasma into the hepatocyte, facilitating the enterohepatic circulation of bile salts, which is the basis for the absorption of dietary fat and fat-soluble vitamins [59]. SLC10A1 was discovered to be an HBV receptor, and a variation of it has been independently linked to a lower incidence of cirrhosis and HCC as well as resistance to chronic hepatitis B infection [60]. Furthermore, there was a tendency in SLC10A1 for a decreased expression of HCC [61]. However, no association to macrophages has been reported in the literature yet. CPS1 (Carbamoyl-phosphate synthase 1) encodes for the identically named ligase enzyme located in hepatic mitochondria. CPS1 is involved in the urea cycle, where it serves as the rate-determining step by catalyzing the synthesis of carbamoyl-phosphate from bicarbonate, ammonia and phosphate. Thus, CPS1 plays a major role in removing excess ammonia from the cells and protein metabolism [62]. Ridder et al. analyzed the expression of CPS1 by immunohistochemistry in a large cohort of 871 HCCs in 561 patients undergoing liver resection and found that CPS1 was downregulated in HCC and reduced in distant metastases as well as recurrent tumors. Further, low CPS1 was linked to shorter OS [63]. Interestingly, Park et al. showed that CPS1, which is normally released into bile, can be released into serum in case of liver injury, where it induces the M2 polarization of monocytes/macrophages and homing to the liver [64]. This illustrates that our results are in line with experimental data of previous studies and provides a basis to validate our gene-signature obtained by bioinformatic methods. However, the relationship between these four genes and M2 macrophages and their roles in the tumor immune microenvironment of HCC still require further clinical and preclinical research.
While we aggregated analyses across several omics datasets and ethnic groups to show the robustness of our findings, there are still several limitations to this study. First, we used two cohorts to reduce the negative impact of incomplete HCC patient clinical data in public databases on statistical reliability and validity; however, a large-scale, prospective, multi-central validation cohort would be extremely desirable in the future. This would also help to overcome the limitation regarding the sample size of our analysis. Second, more research is needed to determine whether our signature has relevance in identifying molecular subgroups and directing immune treatments in HCC in clinical reality. This also includes a larger experimental validation, also on a tissue level, in patients with different clinical characteristics and with respect to the proposed four-gene signature. Third, despite OS being the strongest oncological marker, other measures, e.g., progression-free survival, would be very interesting in our context. However, detailed data about clinical treatment as well as time to progression are not available in the genomic databases used. This underlines the importance of validation in a clinical dataset. Also, our analysis and bioinformatic framework was based on the differences in M2 macrophage infiltration; thus, we are not able to elaborate on the role of M0 and M1 macrophages in our scenario. As other polarization subtypes are also important in HCC, further research is required to fully explore the role of macrophages in the prognosis of HCC patients.

5. Conclusions

We identified SLC22A1, CPS1, SLC10A1 and CYP2C9 genes to be associated with tumor-promoting M2 macrophage infiltration in HCC patients. This four-gene signature is further associated with overall prognosis in these patients and the immunological characteristics of the TME. These results support the therapeutic relevance of M2 macrophage-related genes and our prognostic model and provide new research directions for highly targeted immunotherapy strategies.

Supplementary Materials

The following supporting information can be downloaded at: https://www.mdpi.com/article/10.3390/gastroent15030055/s1, Table S1: HCC database information; Table S2: The genes related to tumor-associated macrophage polarization and prognosis of HCC; Table S3: Description of four M2 macrophages-related genes identified by LASSO regression analysis; Figure S1: Internal validation of the prognostic model based on different clinical features of HCC patients in TCGA cohort (Kaplan–Meier survival analysis); Figure S2: Identification of DEGs between high and low risk score groups. Figure S3: Association between the four genes and M2 macrophages; Figure S4: The prognostic role of the four genes for HCC; Figure S5: Expression profile of genes at mRNA and protein levels. References [65,66] are included in the supplementary materials.

Author Contributions

Conceptualization; D.L. and J.B.; Methodology; D.L., Y.L. and J.B.; Formal analysis, D.L., Y.L., G.W., E.D., T.L., U.P.N. and J.B.; Investigation; D.L., Y.L., G.W., E.D., T.L., U.P.N. and J.B.; Writing—Original Draft, D.L. and J.B.; Writing—Review and Editing, Y.L., G.W., E.D., T.L. and U.P.N. All have agreed to be personally accountable for the author’s own contributions and to ensure that questions related to the accuracy or integrity of any part of the work, even ones in which the author was not personally involved, are appropriately investigated, resolved, and the resolution documented in the literature. All authors have read and agreed to the published version of the manuscript.

Funding

This research was funded by China Scholarship Council, grant numbers 202208080011 and 202108430018.

Institutional Review Board Statement

The study was conducted in accordance with the Declaration of Helsinki and approved by the medical ethics committee of the Qilu Hospital (Qingdao), Cheeloo College of Medicine, Shandong University (ID: KYLL-KS-2022130).

Informed Consent Statement

Informed consent was obtained from all subjects involved in the study.

Data Availability Statement

This study was carried out using publicly available data from Gene Expression Omnibus (GEO) at https://www.ncbi.nlm.nih.gov/geo/, accessed on 15 August 2022, with GSE76427, GSE145520, GSE25097, GSE39791, GSE57957, GSE54236, GSE36376; The Cancer Genome Atlas Program (TCGA) at https://www.cancer.gov/ccg/research/genome-sequencing/tcga, accessed on 15 August 2022, with TCGA-LICH and International Cancer Genome Consortium (ICGC) at https://dcc.icgc.org, accessed on 15 August 2022, with ICGC-LIRI-JR.

Conflicts of Interest

The authors declare no conflicts of interest.

Abbreviations

AJCCThe American Joint Committee on Cancer
BMIBody mass index
BrMC8-Bromo-7-methoxychrysin
CPS1Carbamoyl-Phosphate Synthase 1
CYP2C9Cytochrome P450 Family 2 Subfamily C Member 9
CSF-1Colony-stimulating factor-1
DEGsDifferentially expressed genes
HCCHepatocellular carcinoma
ICGCInternational Cancer Genome Consortium
IFN-γInterferon-gamma
GEOGene Expression Omnibus
GOGene Ontology
GSGene significance
KEGGKyoto Encyclopedia of Genes and Genomes
LASSOLeast absolute shrinkage and selection operator
LPSLipopolysaccharide
MMModule membership
OSOverall survival
PPIProtein–protein interaction
ROCReceiver operating characteristic
RTRoom temperature
RT-qPCRQuantitative reverse transcription polymerase chain reaction
SLC10A1Solute Carrier Family 11 Member 1
SLC22A1Solute Carrier Family 22 Member 1
TAMsTumor-associated macrophages
TCGAThe Cancer Genome Atlas
TILsTumor-infiltrating lymphocytes
TregRegulatory T cells
WGCNAWeighted gene co-expression network analysis

References

  1. Duran, S.R.; Jaquiss, R.D.B. Hepatocellular Carcinoma. N. Engl. J. Med. 2019, 381, e2. [Google Scholar] [CrossRef] [PubMed]
  2. Bray, F.; Ferlay, J.; Soerjomataram, I.; Siegel, R.L.; Torre, L.A.; Jemal, A. Global cancer statistics 2018: GLOBOCAN estimates of incidence and mortality worldwide for 36 cancers in 185 countries. CA Cancer J. Clin. 2018, 68, 394–424. [Google Scholar] [CrossRef] [PubMed]
  3. Anwanwan, D.; Singh, S.K.; Singh, S.; Saikam, V.; Singh, R. Challenges in liver cancer and possible treatment approaches. Biochim. Biophys. Acta Rev. Cancer 2020, 1873, 188314. [Google Scholar] [CrossRef] [PubMed]
  4. Zhang, Q.; He, Y.; Luo, N.; Patel, S.J.; Han, Y.; Gao, R.; Modak, M.; Carotta, S.; Haslinger, C.; Kind, D.; et al. Landscape and Dynamics of Single Immune Cells in Hepatocellular Carcinoma. Cell 2019, 179, 829–845.e820. [Google Scholar] [CrossRef]
  5. Ringelhan, M.; Pfister, D.; O’Connor, T.; Pikarsky, E.; Heikenwalder, M. The immunology of hepatocellular carcinoma. Nat. Immunol. 2018, 19, 222–232. [Google Scholar] [CrossRef]
  6. Sprinzl, M.F.; Galle, P.R. Current progress in immunotherapy of hepatocellular carcinoma. J. Hepatol. 2017, 66, 482–484. [Google Scholar] [CrossRef]
  7. Llovet, J.M.; Castet, F.; Heikenwalder, M.; Maini, M.K.; Mazzaferro, V.; Pinato, D.J.; Pikarsky, E.; Zhu, A.X.; Finn, R.S. Immunotherapies for hepatocellular carcinoma. Nature reviews. Clin. Oncol. 2022, 19, 151–172. [Google Scholar] [CrossRef]
  8. Gordon, S.; Taylor, P.R. Monocyte and macrophage heterogeneity. Nat. Rev. Immunol. 2005, 5, 953–964. [Google Scholar] [CrossRef]
  9. Italiani, P.; Boraschi, D. From Monocytes to M1/M2 Macrophages: Phenotypical vs. Functional Differentiation. Front. Immunol. 2014, 5, 514. [Google Scholar] [CrossRef]
  10. Degroote, H.; Van Dierendonck, A.; Geerts, A.; Van Vlierberghe, H.; Devisscher, L. Preclinical and Clinical Therapeutic Strategies Affecting Tumor-Associated Macrophages in Hepatocellular Carcinoma. J. Immunol. Res. 2018, 2018, 7819520. [Google Scholar] [CrossRef]
  11. Fu, X.T.; Dai, Z.; Song, K.; Zhang, Z.J.; Zhou, Z.J.; Zhou, S.L.; Zhao, Y.M.; Xiao, Y.S.; Sun, Q.M.; Ding, Z.B.; et al. Macrophage-secreted IL-8 induces epithelial-mesenchymal transition in hepatocellular carcinoma cells by activating the JAK2/STAT3/Snail pathway. Int. J. Oncol. 2015, 46, 587–596. [Google Scholar] [CrossRef] [PubMed]
  12. Chávez-Galán, L.; Olleros, M.L.; Vesin, D.; Garcia, I. Much More than M1 and M2 Macrophages, There are also CD169(+) and TCR(+) Macrophages. Front. Immunol. 2015, 6, 263. [Google Scholar] [CrossRef]
  13. Heusinkveld, M.; van der Burg, S.H. Identification and manipulation of tumor associated macrophages in human cancers. J. Transl. Med. 2011, 9, 216. [Google Scholar] [CrossRef]
  14. Ritchie, M.E.; Phipson, B.; Wu, D.; Hu, Y.; Law, C.W.; Shi, W.; Smyth, G.K. limma powers differential expression analyses for RNA-sequencing and microarray studies. Nucleic Acids Res. 2015, 43, e47. [Google Scholar] [CrossRef]
  15. Pomaznoy, M.; Ha, B.; Peters, B. GOnet: A tool for interactive Gene Ontology analysis. BMC Bioinform. 2018, 19, 470. [Google Scholar] [CrossRef] [PubMed]
  16. Mao, X.; Cai, T.; Olyarchuk, J.G.; Wei, L. Automated genome annotation and pathway identification using the KEGG Orthology (KO) as a controlled vocabulary. Bioinformatics 2005, 21, 3787–3793. [Google Scholar] [CrossRef] [PubMed]
  17. Tibshirani, R. The lasso method for variable selection in the Cox model. Stat. Med. 1997, 16, 385–395. [Google Scholar] [CrossRef]
  18. Yoshihara, K.; Shahmoradgoli, M.; Martínez, E.; Vegesna, R.; Kim, H.; Torres-Garcia, W.; Treviño, V.; Shen, H.; Laird, P.W.; Levine, D.A.; et al. Inferring tumour purity and stromal and immune cell admixture from expression data. Nat. Commun. 2013, 4, 2612. [Google Scholar] [CrossRef]
  19. Chen, B.; Khodadoust, M.S.; Liu, C.L.; Newman, A.M.; Alizadeh, A.A. Profiling Tumor Infiltrating Immune Cells with CIBERSORT. Methods Mol. Biol. 2018, 1711, 243–259. [Google Scholar] [CrossRef]
  20. Hänzelmann, S.; Castelo, R.; Guinney, J. GSVA: Gene set variation analysis for microarray and RNA-Seq data. BMC Bioinform. 2013, 14, 7. [Google Scholar] [CrossRef]
  21. Langfelder, P.; Horvath, S. WGCNA: An R package for weighted correlation network analysis. BMC Bioinform. 2008, 9, 559. [Google Scholar] [CrossRef] [PubMed]
  22. Szklarczyk, D.; Gable, A.L.; Lyon, D.; Junge, A.; Wyder, S.; Huerta-Cepas, J.; Simonovic, M.; Doncheva, N.T.; Morris, J.H.; Bork, P.; et al. STRING v11: Protein-protein association networks with increased coverage, supporting functional discovery in genome-wide experimental datasets. Nucleic Acids Res. 2019, 47, D607–D613. [Google Scholar] [CrossRef]
  23. Xiao, L.; Li, Q.; Huang, Y.; Fan, Z.; Qin, W.; Liu, B.; Yuan, X. Integrative Analysis Constructs an Extracellular Matrix-Associated Gene Signature for the Prediction of Survival and Tumor Immunity in Lung Adenocarcinoma. Front. Cell Dev. Biol. 2022, 10, 835043. [Google Scholar] [CrossRef] [PubMed]
  24. Yang, T.; Chen, Y.; Xu, J.; Li, J.; Liu, H.; Liu, N. Bioinformatics screening the novel and promising targets of curcumin in hepatocellular carcinoma chemotherapy and prognosis. BMC Complement. Med. Ther. 2022, 22, 21. [Google Scholar] [CrossRef] [PubMed]
  25. Lu, C.; Fang, S.; Weng, Q.; Lv, X.; Meng, M.; Zhu, J.; Zheng, L.; Hu, Y.; Gao, Y.; Wu, X.; et al. Integrated analysis reveals critical glycolytic regulators in hepatocellular carcinoma. Cell Commun. Signal 2020, 18, 97. [Google Scholar] [CrossRef]
  26. Lautem, A.; Heise, M.; Grasel, A.; Hoppe-Lotichius, M.; Weiler, N.; Foltys, D.; Knapstein, J.; Schattenberg, J.M.; Schad, A.; Zimmermann, A.; et al. Downregulation of organic cation transporter 1 (SLC22A1) is associated with tumor progression and reduced patient survival in human cholangiocellular carcinoma. Int. J. Oncol. 2013, 42, 1297–1304. [Google Scholar] [CrossRef]
  27. Chapman, J.R.; Waldenstrom, J. With Reference to Reference Genes: A Systematic Review of Endogenous Controls in Gene Expression Studies. PLoS ONE 2015, 10, e0141853. [Google Scholar] [CrossRef]
  28. Wang, C.; Ma, C.; Gong, L.; Guo, Y.; Fu, K.; Zhang, Y.; Zhou, H.; Li, Y. Macrophage Polarization and Its Role in Liver Disease. Front. Immunol. 2021, 12, 803037. [Google Scholar] [CrossRef]
  29. Binatti, E.; Gerussi, A.; Barisani, D.; Invernizzi, P. The Role of Macrophages in Liver Fibrosis: New Therapeutic Opportunities. Int. J. Mol. Sci. 2022, 23, 6649. [Google Scholar] [CrossRef]
  30. Yu, L.X.; Ling, Y.; Wang, H.Y. Role of nonresolving inflammation in hepatocellular carcinoma development and progression. NPJ Precis. Oncol. 2018, 2, 6. [Google Scholar] [CrossRef]
  31. Prieto, J.; Melero, I.; Sangro, B. Immunological landscape and immunotherapy of hepatocellular carcinoma. Nat. Rev. Gastroenterol. Hepatol. 2015, 12, 681–700. [Google Scholar] [CrossRef] [PubMed]
  32. Schreiber, R.D.; Old, L.J.; Smyth, M.J. Cancer immunoediting: Integrating immunity’s roles in cancer suppression and promotion. Science 2011, 331, 1565–1570. [Google Scholar] [CrossRef]
  33. Sprinzl, M.F.; Reisinger, F.; Puschnik, A.; Ringelhan, M.; Ackermann, K.; Hartmann, D.; Schiemann, M.; Weinmann, A.; Galle, P.R.; Schuchmann, M.; et al. Sorafenib perpetuates cellular anticancer effector functions by modulating the crosstalk between macrophages and natural killer cells. Hepatology 2013, 57, 2358–2368. [Google Scholar] [CrossRef] [PubMed]
  34. Sica, A.; Mantovani, A. Macrophage plasticity and polarization: In vivo veritas. J. Clin. Investig. 2012, 122, 787–795. [Google Scholar] [CrossRef] [PubMed]
  35. Sica, A.; Larghi, P.; Mancino, A.; Rubino, L.; Porta, C.; Totaro, M.G.; Rimoldi, M.; Biswas, S.K.; Allavena, P.; Mantovani, A. Macrophage polarization in tumour progression. Semin. Cancer Biol. 2008, 18, 349–355. [Google Scholar] [CrossRef]
  36. Mills, C.D. M1 and M2 macrophages: Oracles of health and disease. Crit. Rev. Immunol. 2012, 32, 463–488. [Google Scholar] [CrossRef]
  37. Thorsson, V.; Gibbs, D.L.; Brown, S.D.; Wolf, D.; Bortone, D.S.; Ou Yang, T.H.; Porta-Pardo, E.; Gao, G.F.; Plaisier, C.L.; Eddy, J.A.; et al. The Immune Landscape of Cancer. Immunity 2018, 48, 812–830.e814. [Google Scholar] [CrossRef]
  38. Chew, V.; Lai, L.; Pan, L.; Lim, C.J.; Li, J.; Ong, R.; Chua, C.; Leong, J.Y.; Lim, K.H.; Toh, H.C.; et al. Delineation of an immunosuppressive gradient in hepatocellular carcinoma using high-dimensional proteomic and transcriptomic analyses. Proc. Natl. Acad. Sci. USA 2017, 114, E5900–E5909. [Google Scholar] [CrossRef]
  39. Tan, H.Y.; Wang, N.; Man, K.; Tsao, S.W.; Che, C.M.; Feng, Y. Autophagy-induced RelB/p52 activation mediates tumour-associated macrophage repolarisation and suppression of hepatocellular carcinoma by natural compound baicalin. Cell Death Dis. 2015, 6, e1942. [Google Scholar] [CrossRef]
  40. Sun, S.; Cui, Y.; Ren, K.; Quan, M.; Song, Z.; Zou, H.; Li, D.; Zheng, Y.; Cao, J. 8-bromo-7-methoxychrysin Reversed M2 Polarization of Tumor-associated Macrophages Induced by Liver Cancer Stem-like Cells. Anticancer. Agents Med. Chem. 2017, 17, 286–293. [Google Scholar] [CrossRef]
  41. Ao, J.Y.; Zhu, X.D.; Chai, Z.T.; Cai, H.; Zhang, Y.Y.; Zhang, K.Z.; Kong, L.Q.; Zhang, N.; Ye, B.G.; Ma, D.N.; et al. Colony-Stimulating Factor 1 Receptor Blockade Inhibits Tumor Growth by Altering the Polarization of Tumor-Associated Macrophages in Hepatocellular Carcinoma. Mol. Cancer Ther. 2017, 16, 1544–1554. [Google Scholar] [CrossRef]
  42. Gao, X.; Huang, H.; Wang, Y.; Pan, C.; Yin, S.; Zhou, L.; Zheng, S. Tumor Immune Microenvironment Characterization in Hepatocellular Carcinoma Identifies Four Prognostic and Immunotherapeutically Relevant Subclasses. Front. Oncol. 2020, 10, 610513. [Google Scholar] [CrossRef] [PubMed]
  43. Onuma, A.E.; Zhang, H.; Huang, H.; Williams, T.M.; Noonan, A.; Tsung, A. Immune Checkpoint Inhibitors in Hepatocellular Cancer: Current Understanding on Mechanisms of Resistance and Biomarkers of Response to Treatment. Gene Expr. 2020, 20, 53–65. [Google Scholar] [CrossRef] [PubMed]
  44. Liu, D.; Heij, L.R.; Czigany, Z.; Dahl, E.; Lang, S.A.; Ulmer, T.F.; Luedde, T.; Neumann, U.P.; Bednarsch, J. The role of tumor-infiltrating lymphocytes in cholangiocarcinoma. J. Exp. Clin. Cancer Res. 2022, 41, 127. [Google Scholar] [CrossRef]
  45. Barnes, T.A.; Amir, E. HYPE or HOPE: The prognostic value of infiltrating immune cells in cancer. Br. J. Cancer 2017, 117, 451–460. [Google Scholar] [CrossRef]
  46. Malla, R.R.; Vasudevaraju, P.; Vempati, R.K.; Rakshmitha, M.; Merchant, N.; Nagaraju, G.P. Regulatory T cells: Their role in triple-negative breast cancer progression and metastasis. Cancer 2022, 128, 1171–1183. [Google Scholar] [CrossRef]
  47. Bai, R.; Lv, Z.; Xu, D.; Cui, J. Predictive biomarkers for cancer immunotherapy with immune checkpoint inhibitors. Biomark. Res. 2020, 8, 34. [Google Scholar] [CrossRef] [PubMed]
  48. Finn, R.S.; Qin, S.; Ikeda, M.; Galle, P.R.; Ducreux, M.; Kim, T.Y.; Kudo, M.; Breder, V.; Merle, P.; Kaseb, A.O.; et al. Atezolizumab plus Bevacizumab in Unresectable Hepatocellular Carcinoma. N. Engl. J. Med. 2020, 382, 1894–1905. [Google Scholar] [CrossRef] [PubMed]
  49. Cheng, A.L.; Qin, S.; Ikeda, M.; Galle, P.R.; Ducreux, M.; Kim, T.Y.; Lim, H.Y.; Kudo, M.; Breder, V.; Merle, P.; et al. Updated efficacy and safety data from IMbrave150: Atezolizumab plus bevacizumab vs. sorafenib for unresectable hepatocellular carcinoma. J. Hepatol. 2022, 76, 862–873. [Google Scholar] [CrossRef]
  50. Rizzo, A.; Cusmai, A.; Gadaleta-Caldarola, G.; Palmiotti, G. Which role for predictors of response to immune checkpoint inhibitors in hepatocellular carcinoma? Expert Rev. Gastroenterol. Hepatol. 2022, 16, 333–339. [Google Scholar] [CrossRef]
  51. Rizzo, A.; Ricci, A.D.; Di Federico, A.; Frega, G.; Palloni, A.; Tavolari, S.; Brandi, G. Predictive Biomarkers for Checkpoint Inhibitor-Based Immunotherapy in Hepatocellular Carcinoma: Where Do We Stand? Front. Oncol. 2021, 11, 803133. [Google Scholar] [CrossRef] [PubMed]
  52. Jensen, O.; Gebauer, L.; Brockmoller, J.; Ducker, C. Relationships between Inhibition, Transport and Enhanced Transport via the Organic Cation Transporter 1. Int. J. Mol. Sci. 2022, 23, 2007. [Google Scholar] [CrossRef] [PubMed]
  53. Heise, M.; Lautem, A.; Knapstein, J.; Schattenberg, J.M.; Hoppe-Lotichius, M.; Foltys, D.; Weiler, N.; Zimmermann, A.; Schad, A.; Gründemann, D.; et al. Downregulation of organic cation transporters OCT1 (SLC22A1) and OCT3 (SLC22A3) in human hepatocellular carcinoma and their prognostic significance. BMC Cancer 2012, 12, 109. [Google Scholar] [CrossRef] [PubMed]
  54. Herraez, E.; Lozano, E.; Macias, R.I.; Vaquero, J.; Bujanda, L.; Banales, J.M.; Marin, J.J.; Briz, O. Expression of SLC22A1 variants may affect the response of hepatocellular carcinoma and cholangiocarcinoma to sorafenib. Hepatology 2013, 58, 1065–1073. [Google Scholar] [CrossRef]
  55. Spector, A.A.; Kim, H.Y. Cytochrome P450 epoxygenase pathway of polyunsaturated fatty acid metabolism. Biochim. Biophys. Acta 2015, 1851, 356–365. [Google Scholar] [CrossRef]
  56. Yasar, U.; Eliasson, E.; Dahl, M.L. Association of CYP2C9 genotypes leading to high enzyme activity and colorectal cancer risk. Carcinogenesis 2002, 23, 665; author reply 667–668. [Google Scholar] [CrossRef]
  57. Chan, A.T.; Tranah, G.J.; Giovannucci, E.L.; Hunter, D.J.; Fuchs, C.S. A prospective study of genetic polymorphisms in the cytochrome P-450 2C9 enzyme and the risk for distal colorectal adenoma. Clin. Gastroenterol. Hepatol. 2004, 2, 704–712. [Google Scholar] [CrossRef]
  58. London, S.J.; Sullivan-Klose, T.; Daly, A.K.; Idle, J.R. Lung cancer risk in relation to the CYP2C9 genetic polymorphism among Caucasians in Los Angeles County. Pharmacogenetics 1997, 7, 401–404. [Google Scholar] [CrossRef]
  59. Chen, X.; Cheung, S.T.; So, S.; Fan, S.T.; Barry, C.; Higgins, J.; Lai, K.M.; Ji, J.; Dudoit, S.; Ng, I.O.; et al. Gene expression patterns in human liver cancers. Mol. Biol. Cell 2002, 13, 1929–1939. [Google Scholar] [CrossRef]
  60. Vaz, F.M.; Paulusma, C.C.; Huidekoper, H.; de Ru, M.; Lim, C.; Koster, J.; Ho-Mok, K.; Bootsma, A.H.; Groen, A.K.; Schaap, F.G.; et al. Sodium taurocholate cotransporting polypeptide (SLC10A1) deficiency: Conjugated hypercholanemia without a clear clinical phenotype. Hepatology 2015, 61, 260–267. [Google Scholar] [CrossRef]
  61. Hu, H.H.; Liu, J.; Lin, Y.L.; Luo, W.S.; Chu, Y.J.; Chang, C.L.; Jen, C.L.; Lee, M.H.; Lu, S.N.; Wang, L.Y.; et al. The rs2296651 (S267F) variant on NTCP (SLC10A1) is inversely associated with chronic hepatitis B and progression to cirrhosis and hepatocellular carcinoma in patients with chronic hepatitis B. Gut 2016, 65, 1514–1521. [Google Scholar] [CrossRef] [PubMed]
  62. Zollner, G.; Wagner, M.; Fickert, P.; Silbert, D.; Fuchsbichler, A.; Zatloukal, K.; Denk, H.; Trauner, M. Hepatobiliary transporter expression in human hepatocellular carcinoma. Liver Int. 2005, 25, 367–379. [Google Scholar] [CrossRef] [PubMed]
  63. Nitzahn, M.; Lipshutz, G.S. CPS1: Looking at an ancient enzyme in a modern light. Mol. Genet. Metab. 2020, 131, 289–298. [Google Scholar] [CrossRef] [PubMed]
  64. Ridder, D.A.; Schindeldecker, M.; Weinmann, A.; Berndt, K.; Urbansky, L.; Witzel, H.R.; Heinrich, S.; Roth, W.; Straub, B.K. Key Enzymes in Pyrimidine Synthesis, CAD and CPS1, Predict Prognosis in Hepatocellular Carcinoma. Cancers 2021, 13, 744. [Google Scholar] [CrossRef]
  65. Hernandez-Alias, X.; Benisty, H.; Schaefer, M.H.; Serrano, L. Translational efficiency across healthy and tumor tissues is proliferation-related. Mol. Syst. Biol. 2020, 16, e9275. [Google Scholar] [CrossRef]
  66. Gingold, H.; Pilpel, Y. Determinants of translation efficiency and accuracy. Mol. Syst. Biol. 2011, 7, 481. [Google Scholar] [CrossRef]
Figure 1. The immune infiltration landscape in HCC samples and survival analysis of M2 macrophages in TCGA cohort. (A) The generation, function and mechanisms of M1/M2 macrophages (B) The box plot of 22 types of immune cell infiltration abundances in cancer and normal groups. (C) The Kaplan–Meier survival analysis of the median value of M2 macrophages infiltration for HCC. (D) The optimal cutoff determined by the “survminer” package in R. (E) The Kaplan–Meier survival analysis of the optimal cut-off value of M2 macrophages infiltration for HCC. *** p < 0.001, * p < 0.05, ns not significant.
Gastroent 15 00055 g001
Figure 2. Identification of DEGs and establishment of prognostic risk model. (A) Sixty differential expressed genes between HCC and normal tissues from eight public databases (B) The heatmap of differential expressed genes between high- and low-M2 macrophage infiltration groups in TCGA dataset. (C) The Venn plot of DEGs form (A,B). (D) The forest plot of prognostic M2 macrophage-related DEGs identified by univariate Cox analysis. (E) LASSO coefficient profiles of the 18 genes in the TCGA dataset. (F) Selection of the optimal parameter (lambda) in the LASSO model.
Gastroent 15 00055 g002
Figure 3. Validation of the four-gene signature in the TCGA, ICGC, and GSE76427 datasets. (AC) Risk-score distribution plots for the three datasets. In each plot, from top to bottom: distribution of riskscores (A), distribution of survival status (B), expression patterns of the four genes (C). (DF) K–M survival curves showing OS of patients in the high- and low-risk-score subgroups across three datasets. (GI) Time dependent ROC curves of the signature.
Gastroent 15 00055 g003
Figure 4. Independent validation of the risk score for predicting overall survival of HCC. (A) Univariate and multivariate Cox analysis in TCGA cohort. (BD) Riskscore distribution among T stage (B), tumor grading (C) and TNM stage (D). (E) Univariate and multivariate Cox analysis in ICGC cohort. (F) Univariate and multivariate Cox analysis in GSE76427 cohort. Bold p values indicate statistical significance.
Gastroent 15 00055 g004
Figure 5. Development and validation of a nomogram predicting OS for HCC in TCGA cohort. (A) Development a nomogram for predicting the probability of 1-, 3-, and 5-year OS for HCC patients. (B) Calibration plot of the nomogram for predicting the probability of OS at 3 and 5 years. (C) ROC curve analyses of the nomogram. (D) Decision curve analysis of the net clinical benefit of the nomogram (red line), the signature (brown line), and AJCC stage (green line) for predicting OS of patients in TCGA. (E) Validation of the nomogram by calibration plot, ROC and decision curve analysis in ICGC cohort.
Gastroent 15 00055 g005
Figure 6. The immune cell infiltration and immune-related factors landscape in HCC patients with high and low risk. (A) Heatmap of the correlation between risk score and several immune cells based on algorithm. (B) Boxplot of immune cell infiltration abundance based on CIBERSORT with significant expression differences between high- and low-risk groups. (C) Heatmap of the correlation between risk score and several immune cells based on ssGSEA algorithm. (D) Boxplot of immune cell infiltration abundance based on ssGSEA with significant expression differences between high- and low-risk groups. (E) Heatmap of the relationship between risk score and immunoinhibitory genes. (F) Boxplot of immunoinhibitory-related genes with significant expression differences between high and low risk groups. (G) Heatmap of the relationship between risk score and immunostimulatory genes. (H) Boxplot of immunostimulatory-related genes with significant expression differences between high- and low-risk groups. **** p < 0:0001, *** p < 0:001, ** p < 0:01, * p < 0:05.
Gastroent 15 00055 g006
Figure 7. WGCNA analysis on DEGs and identification of module genes associated with immune score. (A) Analysis of network topology for soft powers. (B) Gene dendrogram and module colors. (C) Relationship between red module genes and immune score. (D) PPI network of hub genes. (E) Correlation between hub genes. (F) Correlation between hub genes and results of ESTIMATE. (G) GO enrichment of hub genes. (H) KEGG enrichment of hub genes.
Gastroent 15 00055 g007
Table 1. Clinicopathological characteristics of HCC patients.
CharacteristicsTraining SetValidation Set
TCGA-LICHICGC-LIRI-JRGSE76427
Sample size *363240115
Median OS (year)1.63 (0.08–10.7)2.14 (0.08–5.92)1.16 (0.08–7.76)
Number of deaths130 (35.8%)42 (18.5%)23 (20.0%)
Age (year)
≤65227 (62.5%)88 (38.8%)65 (56.5%)
>65136 (37.5%)139 (61.2%)50 (43.5%)
Gender
Male245 (67.5%)170 (70.8%)93 (80.9%)
Female118 (32.5%)70 (29.2%)22 (19.1%)
AJCC stage
Stage I–II263 (77.6%)138 (60.8%)90 (78.9%)
Stage III–IV76 (22.4%)89 (39.2%)24 (21.1%)
Histologic grade
G1–2230 (64.2%)--
G3–4128 (35.8%)--
Vascular invasion
Positive205 (66.3%)--
Negative104 (33.7%)--
Prior malignancy
Yes34 (9.4%)43 (17.9%)-
No329 (90.6%)197 (82.1%)-
Family cancer history
Yes110 (35.1%)-
No204 (64.9%)-
BCLC stage
0–A--78 (67.8%)
B–C--37 (32.2%)
* Sum of the frequency of some variables may not be equal to the total sample size due to the missing values.
Table 2. Correlation of risk score with clinicopathological characteristics of HCC patients in TCGA Cohort.
CharacteristicsTCGA Cohort *p Value **
High Risk Score
(n = 181)
Low Risk Score
(n = 182)
Age (year) 0.432
≤6091 (50.2%)82 (54.9%)
>6090 (49.8%)100 (45.1%)
Gender <0.001
Female75 (41.4%)43 (23.6%)
Male106 (58.6%)139 (76.4%)
AJCC stage 0.025
Stage I–II122 (72.2%)141 (82.9%)
Stage III–Iv47 (27.8%)29 (17.1%)
Histologic grade 0.001
G1-297 (54.5%)129 (71.7%)
G3-481 (45.5%)51 (28.2%)
T Stage 0.009
T1/T2125 (56.7%)146 (72.8%)
T3/T456 (43.3%)33 (27.2%)
Vascular invasion 0.016
Positive60 (40.8%)44 (27.2%)
Negative87 (59.2%)118 (72.8%)
BMI (kg/m2) 0.011
≤2490 (54.2%)66 (36.2%)
>2476 (45.8%)100 (63.8%)
Family cancer history 0.731
Yes52 (33.8%)58 (26.3%)
No102 (66.2%)102 (63.7%)
Prior malignancy 0.377
Yes14 (2.3%)20 (11.0%)
No167 (97.7%)162 (89.0%)
* Sum of the frequency of some variables may not be equal to the total sample size due to the missing values; ** The constituent ratio of variables between high- and low-risk groups was compared using the Pearson chi-square test. Bold p values indicate statistical significance.
Disclaimer/Publisher’s Note: The statements, opinions and data contained in all publications are solely those of the individual author(s) and contributor(s) and not of MDPI and/or the editor(s). MDPI and/or the editor(s) disclaim responsibility for any injury to people or property resulting from any ideas, methods, instructions or products referred to in the content.

