Investigating Performance of cVEMP and oVEMP in the Identification of Superior Canal Dehiscence in Relation to Dehiscence Location and Size


Abstract: Objective
1. Introduction
2. Methodology
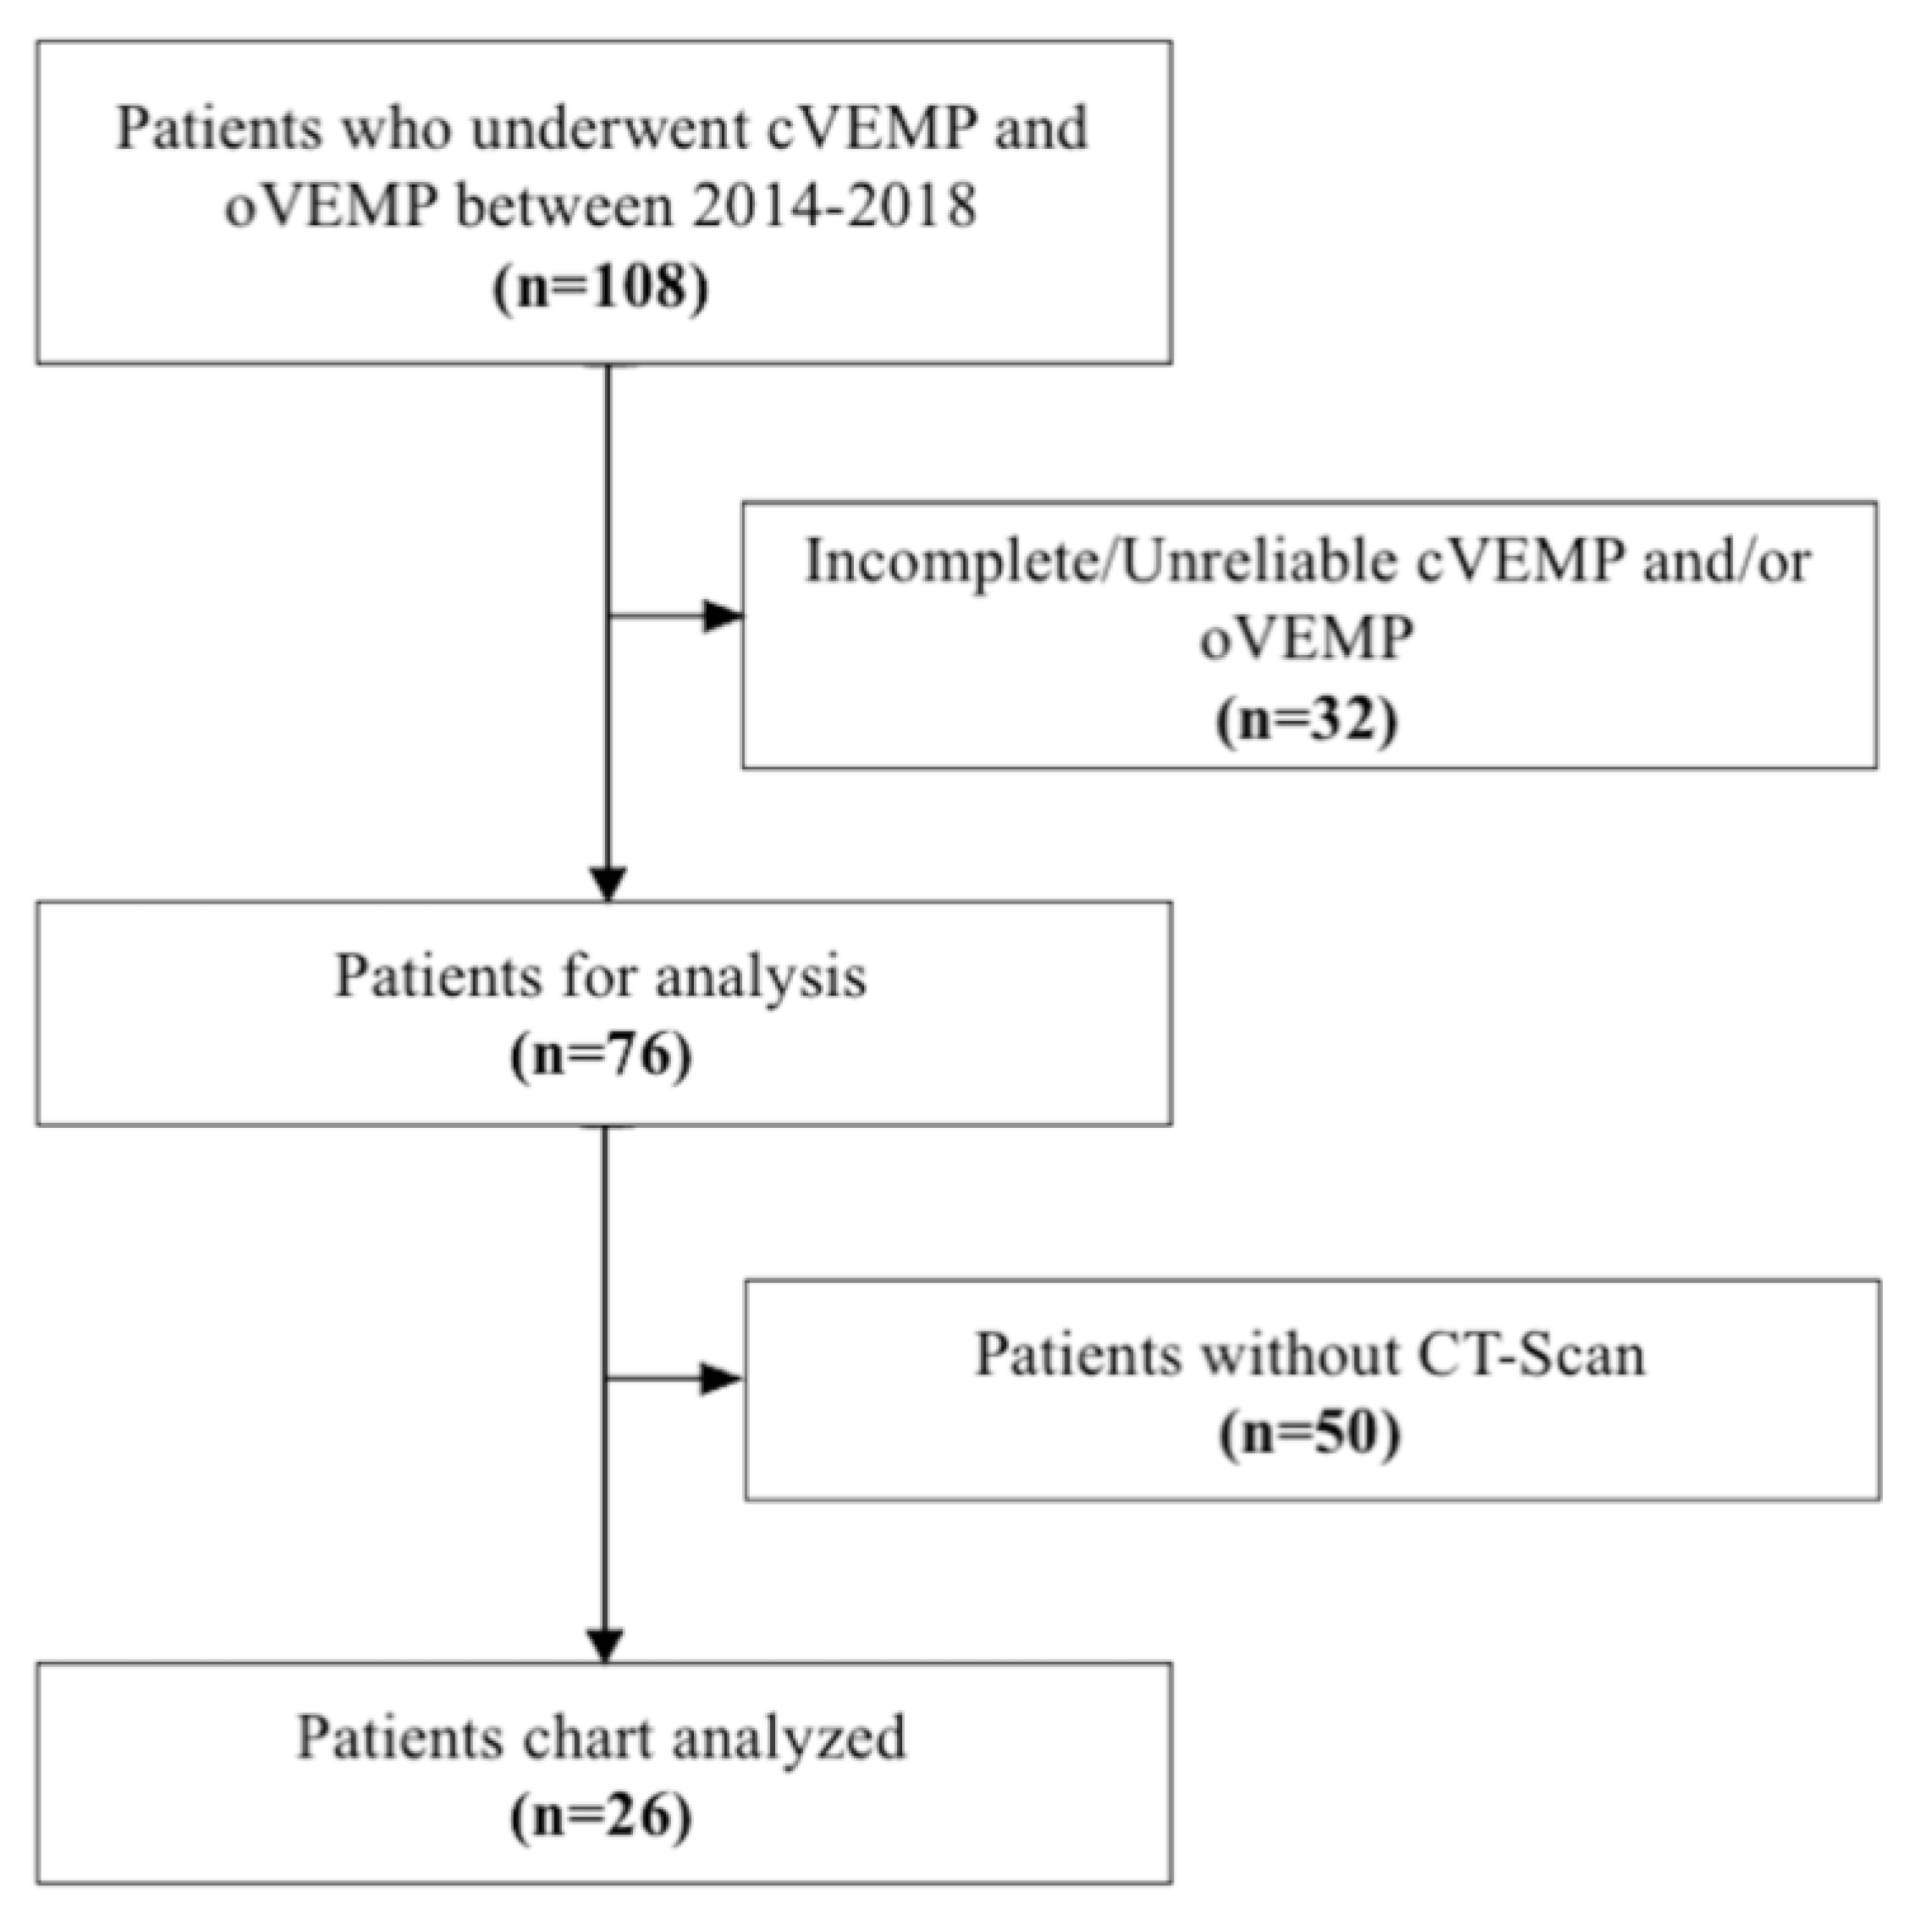
2.1. Participants
2.2. Protocol
2.3. Vestibular Evoked Myogenic Potentials (cVEMP and oVEMP)
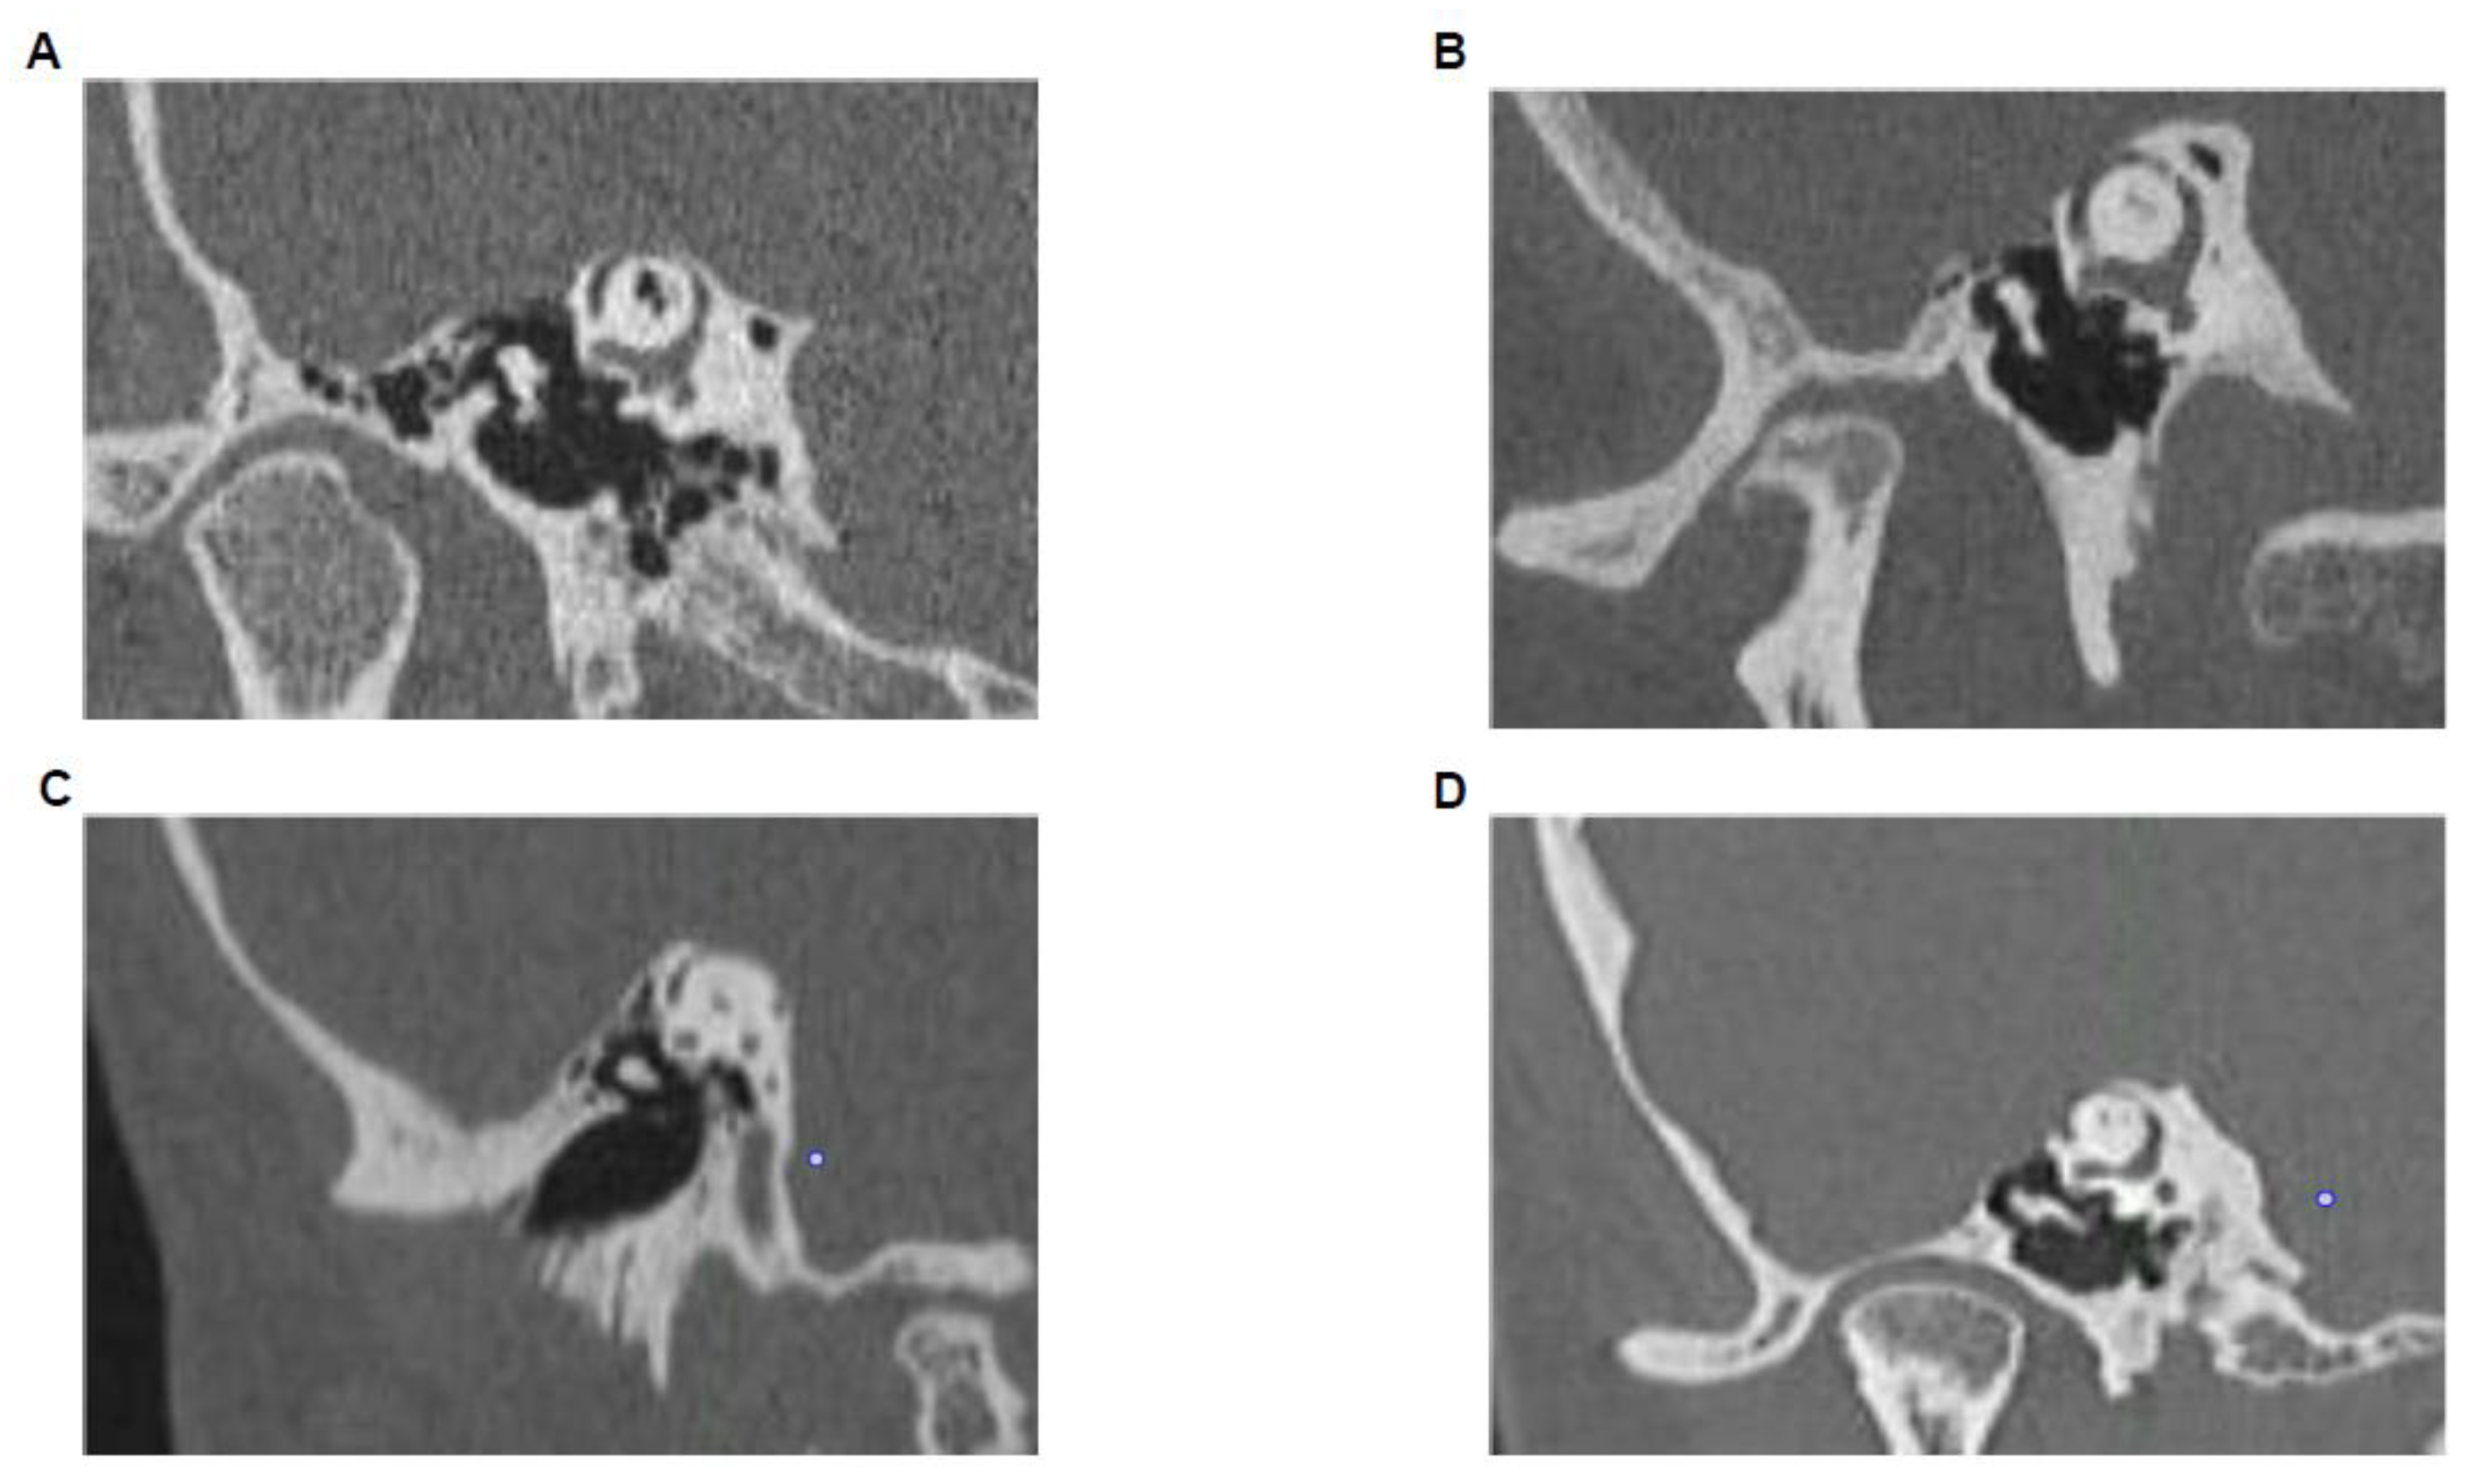
2.4. High-Resolution CT-Scan
2.5. Analysis
3. Results
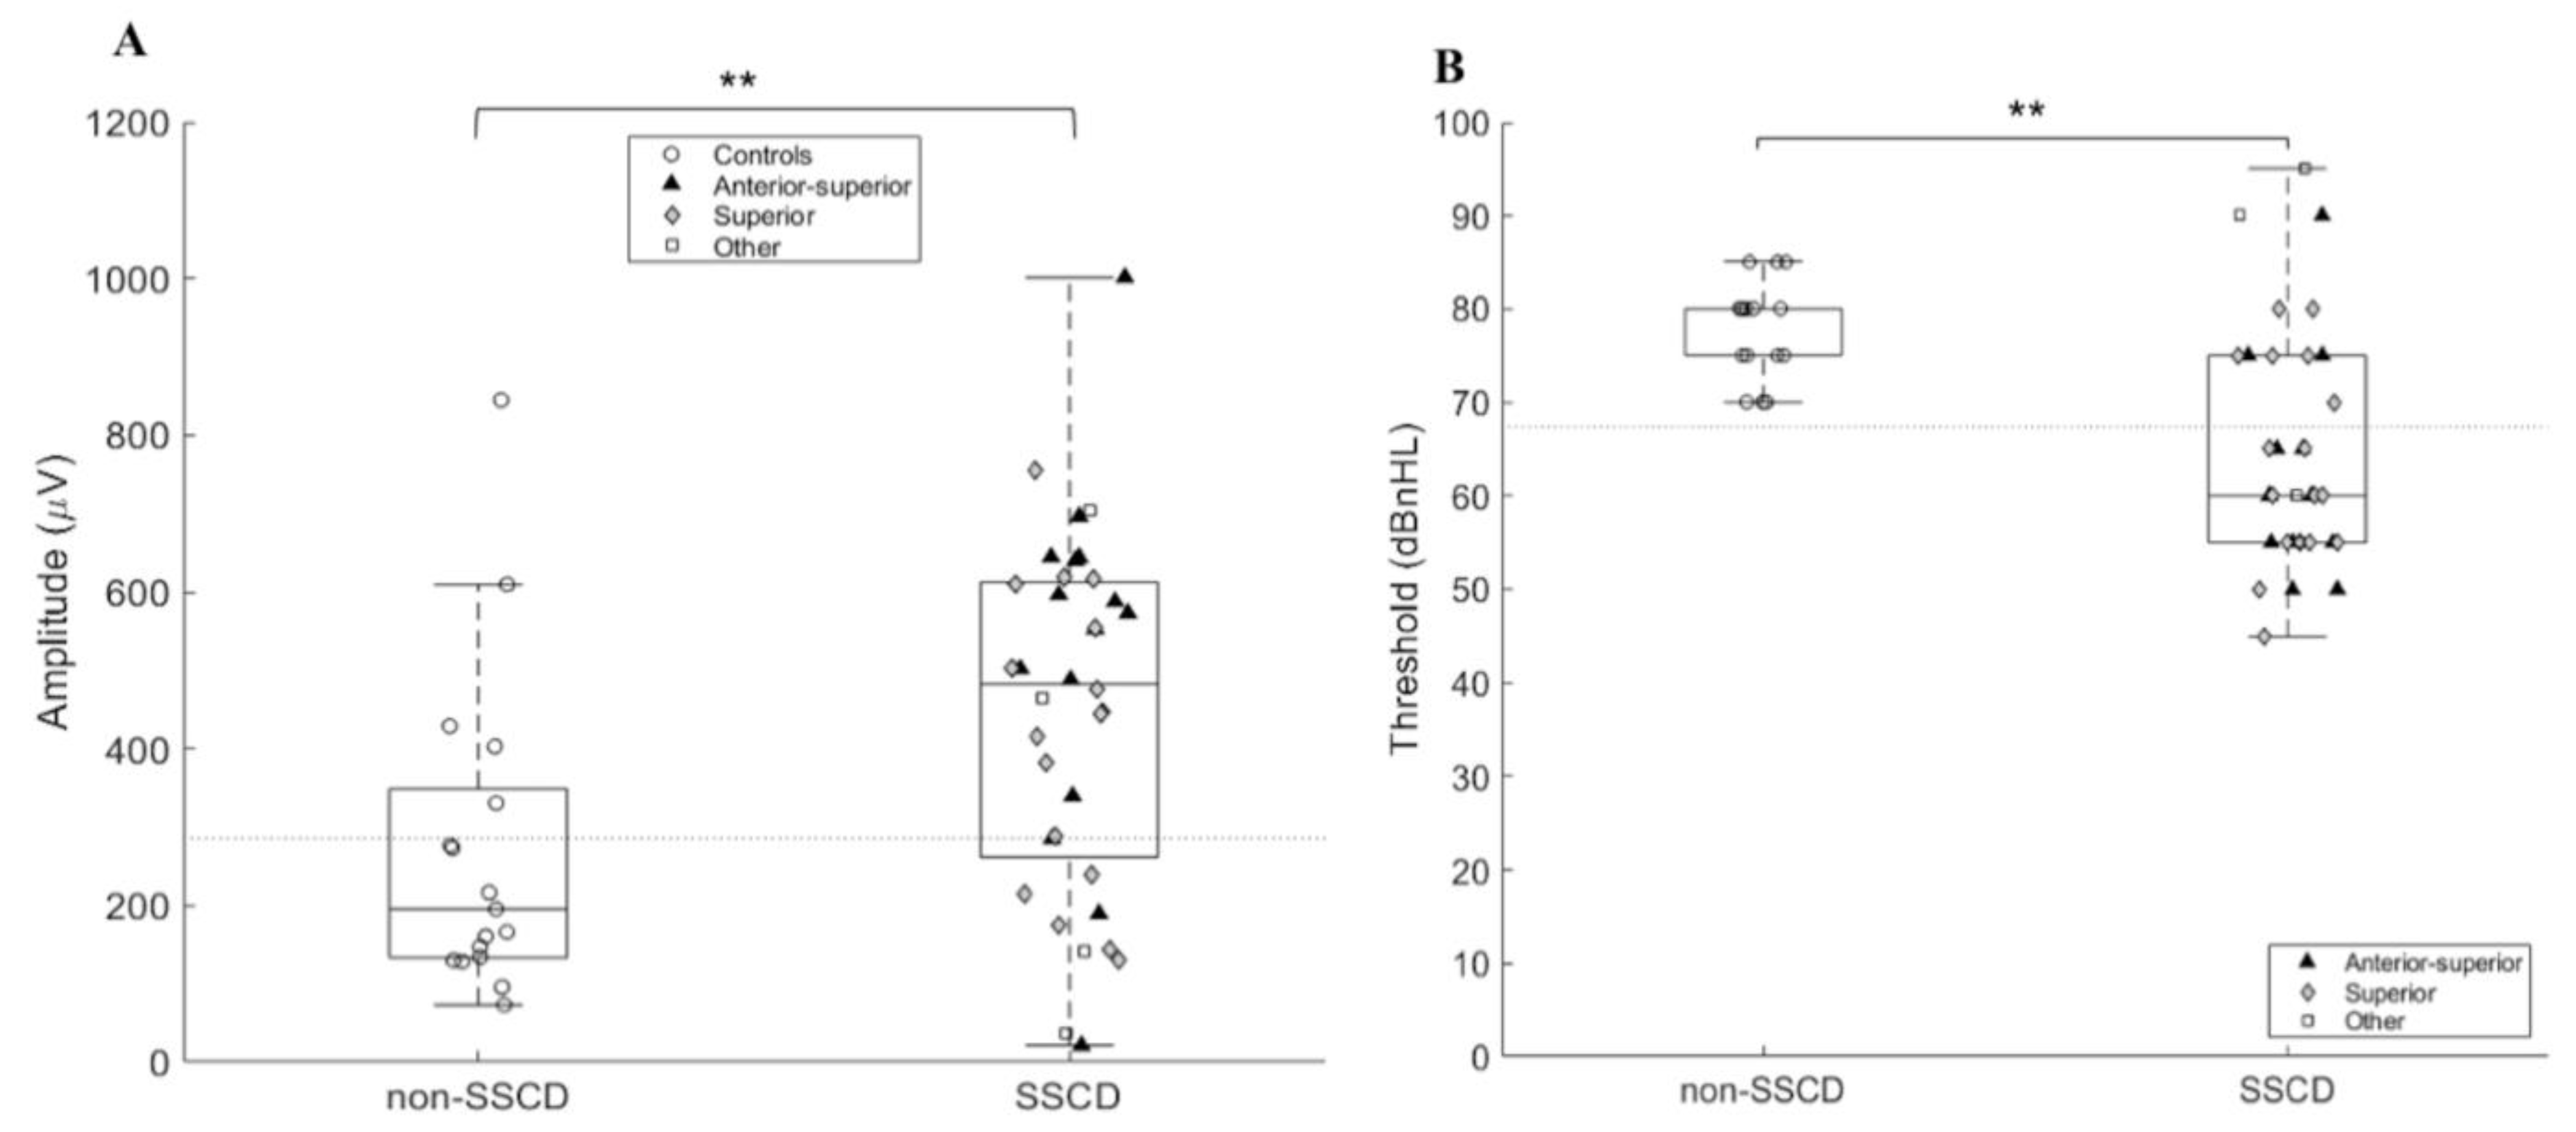
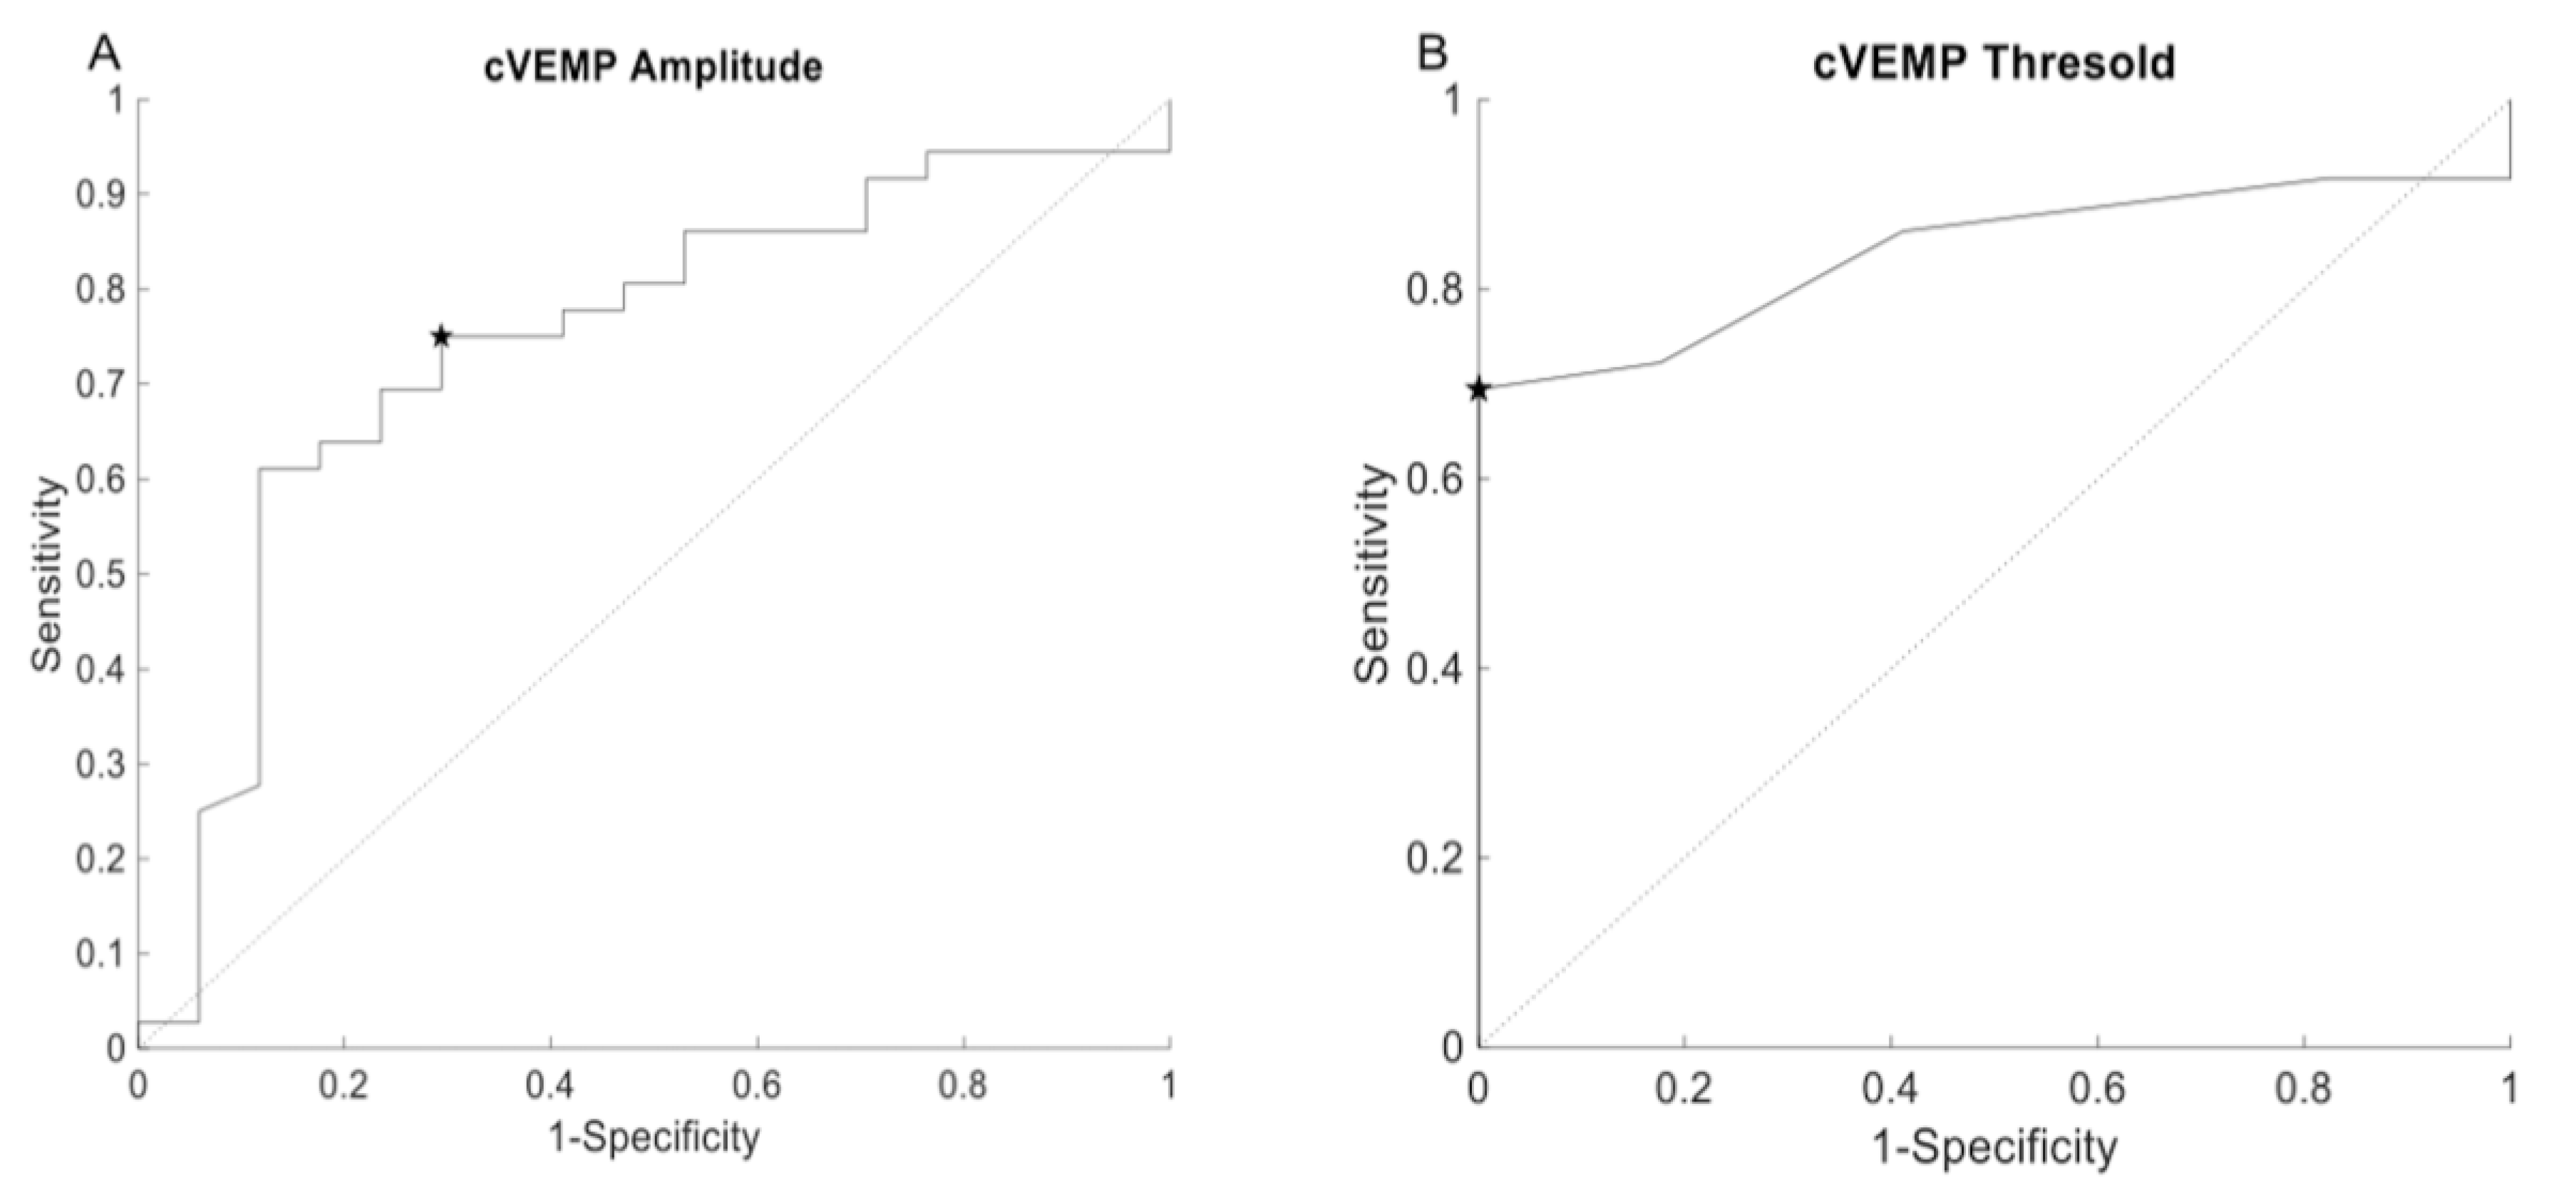
3.1. cVEMP
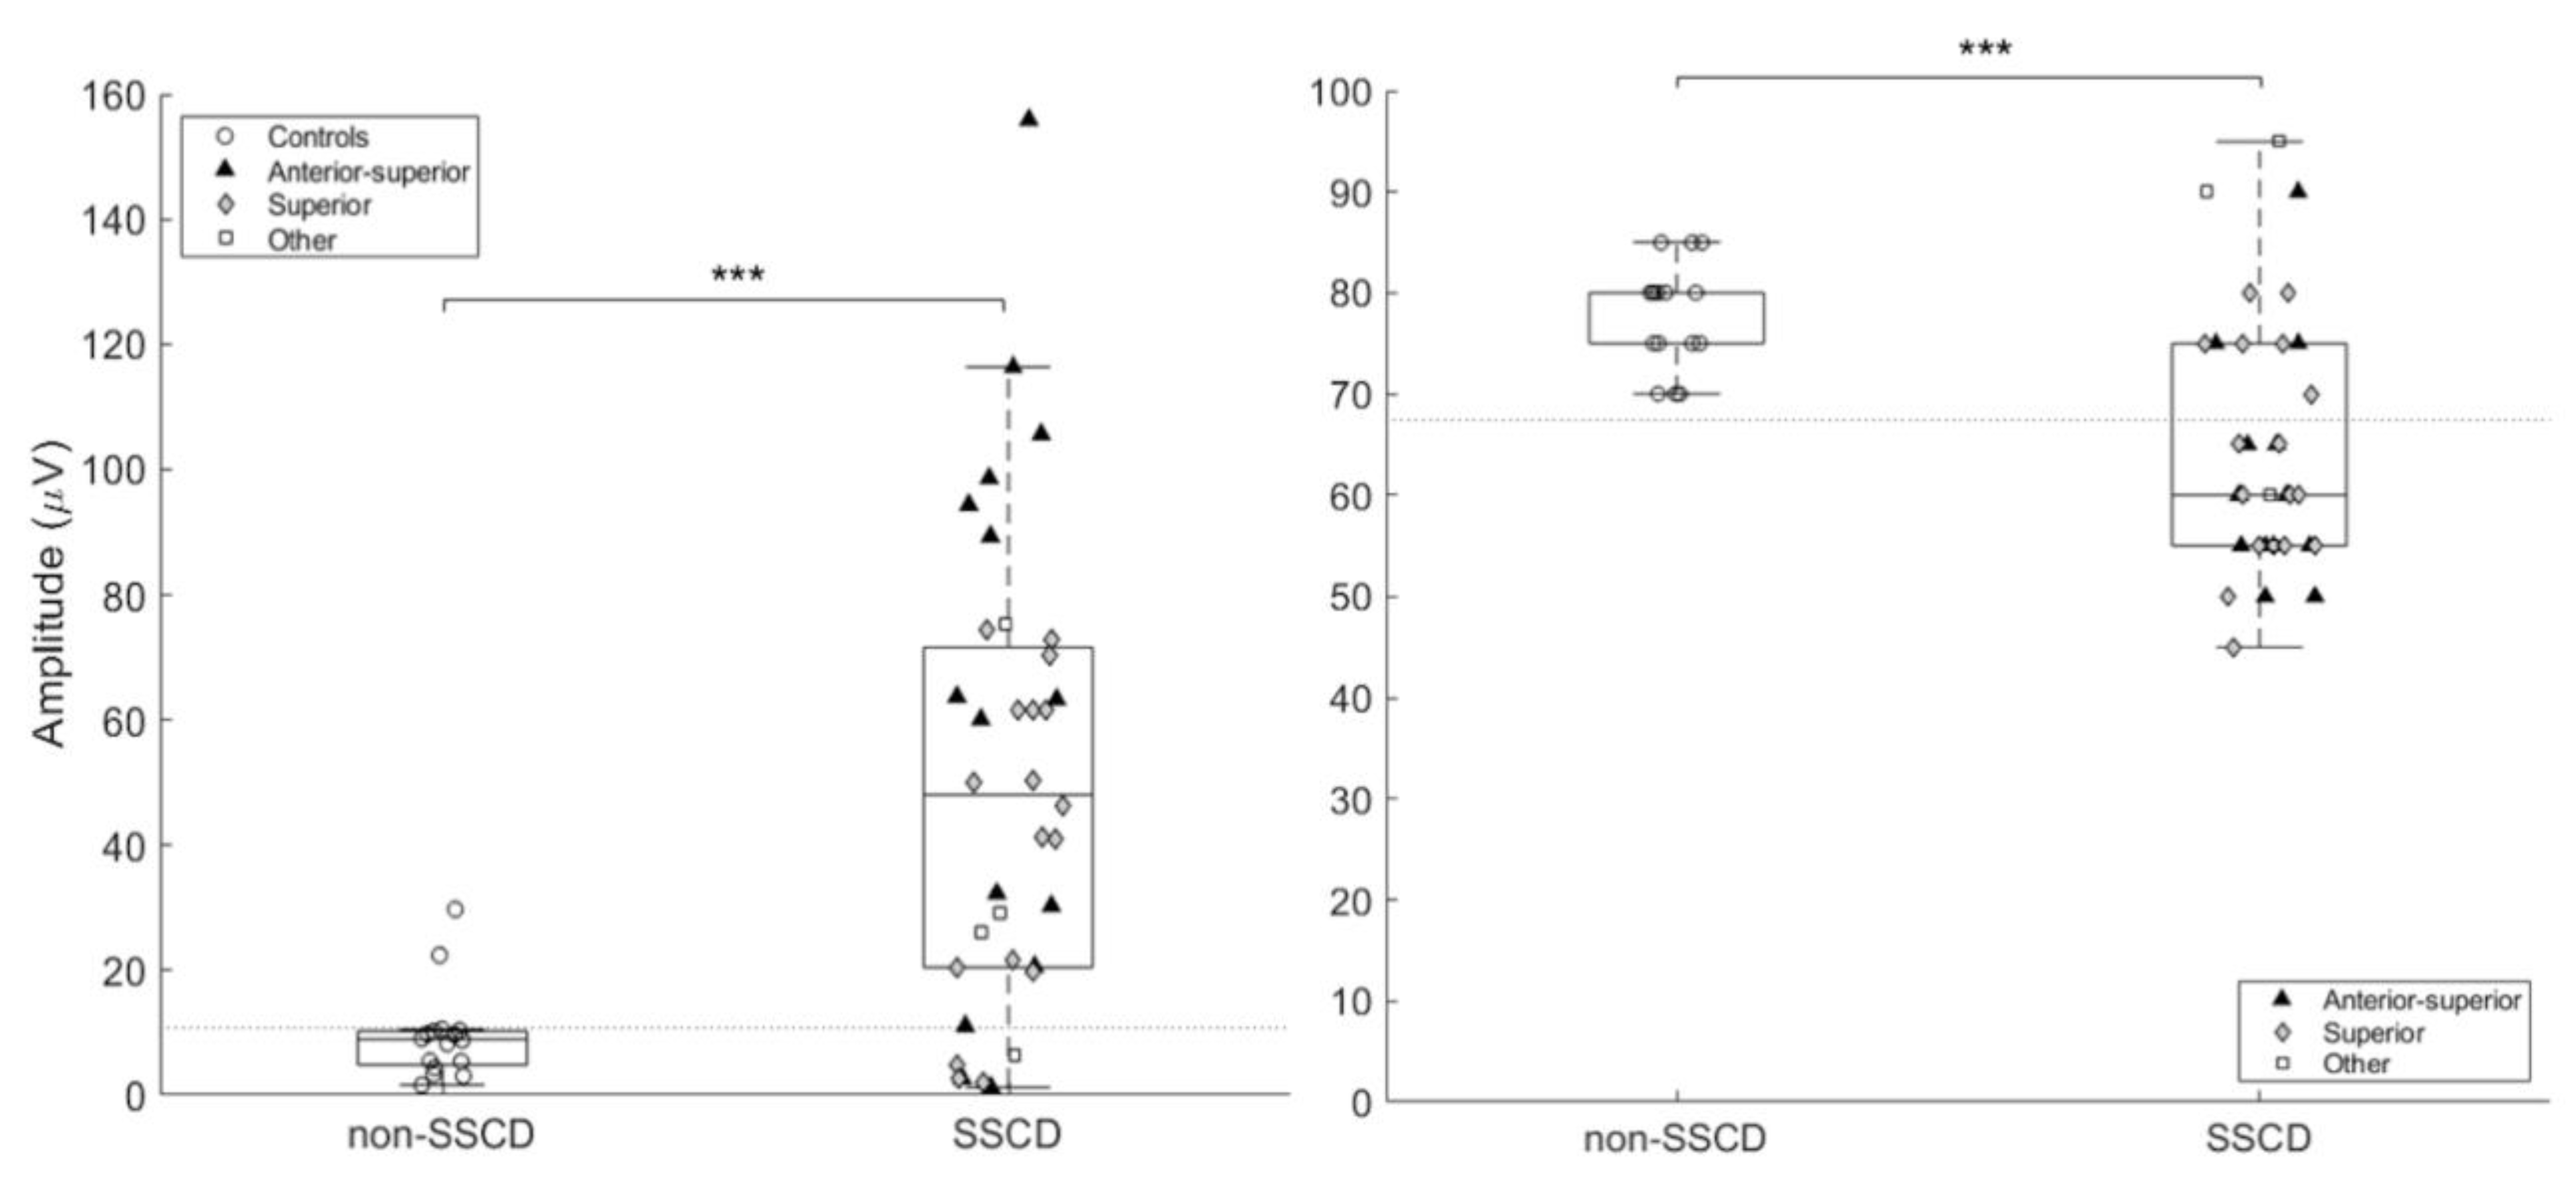
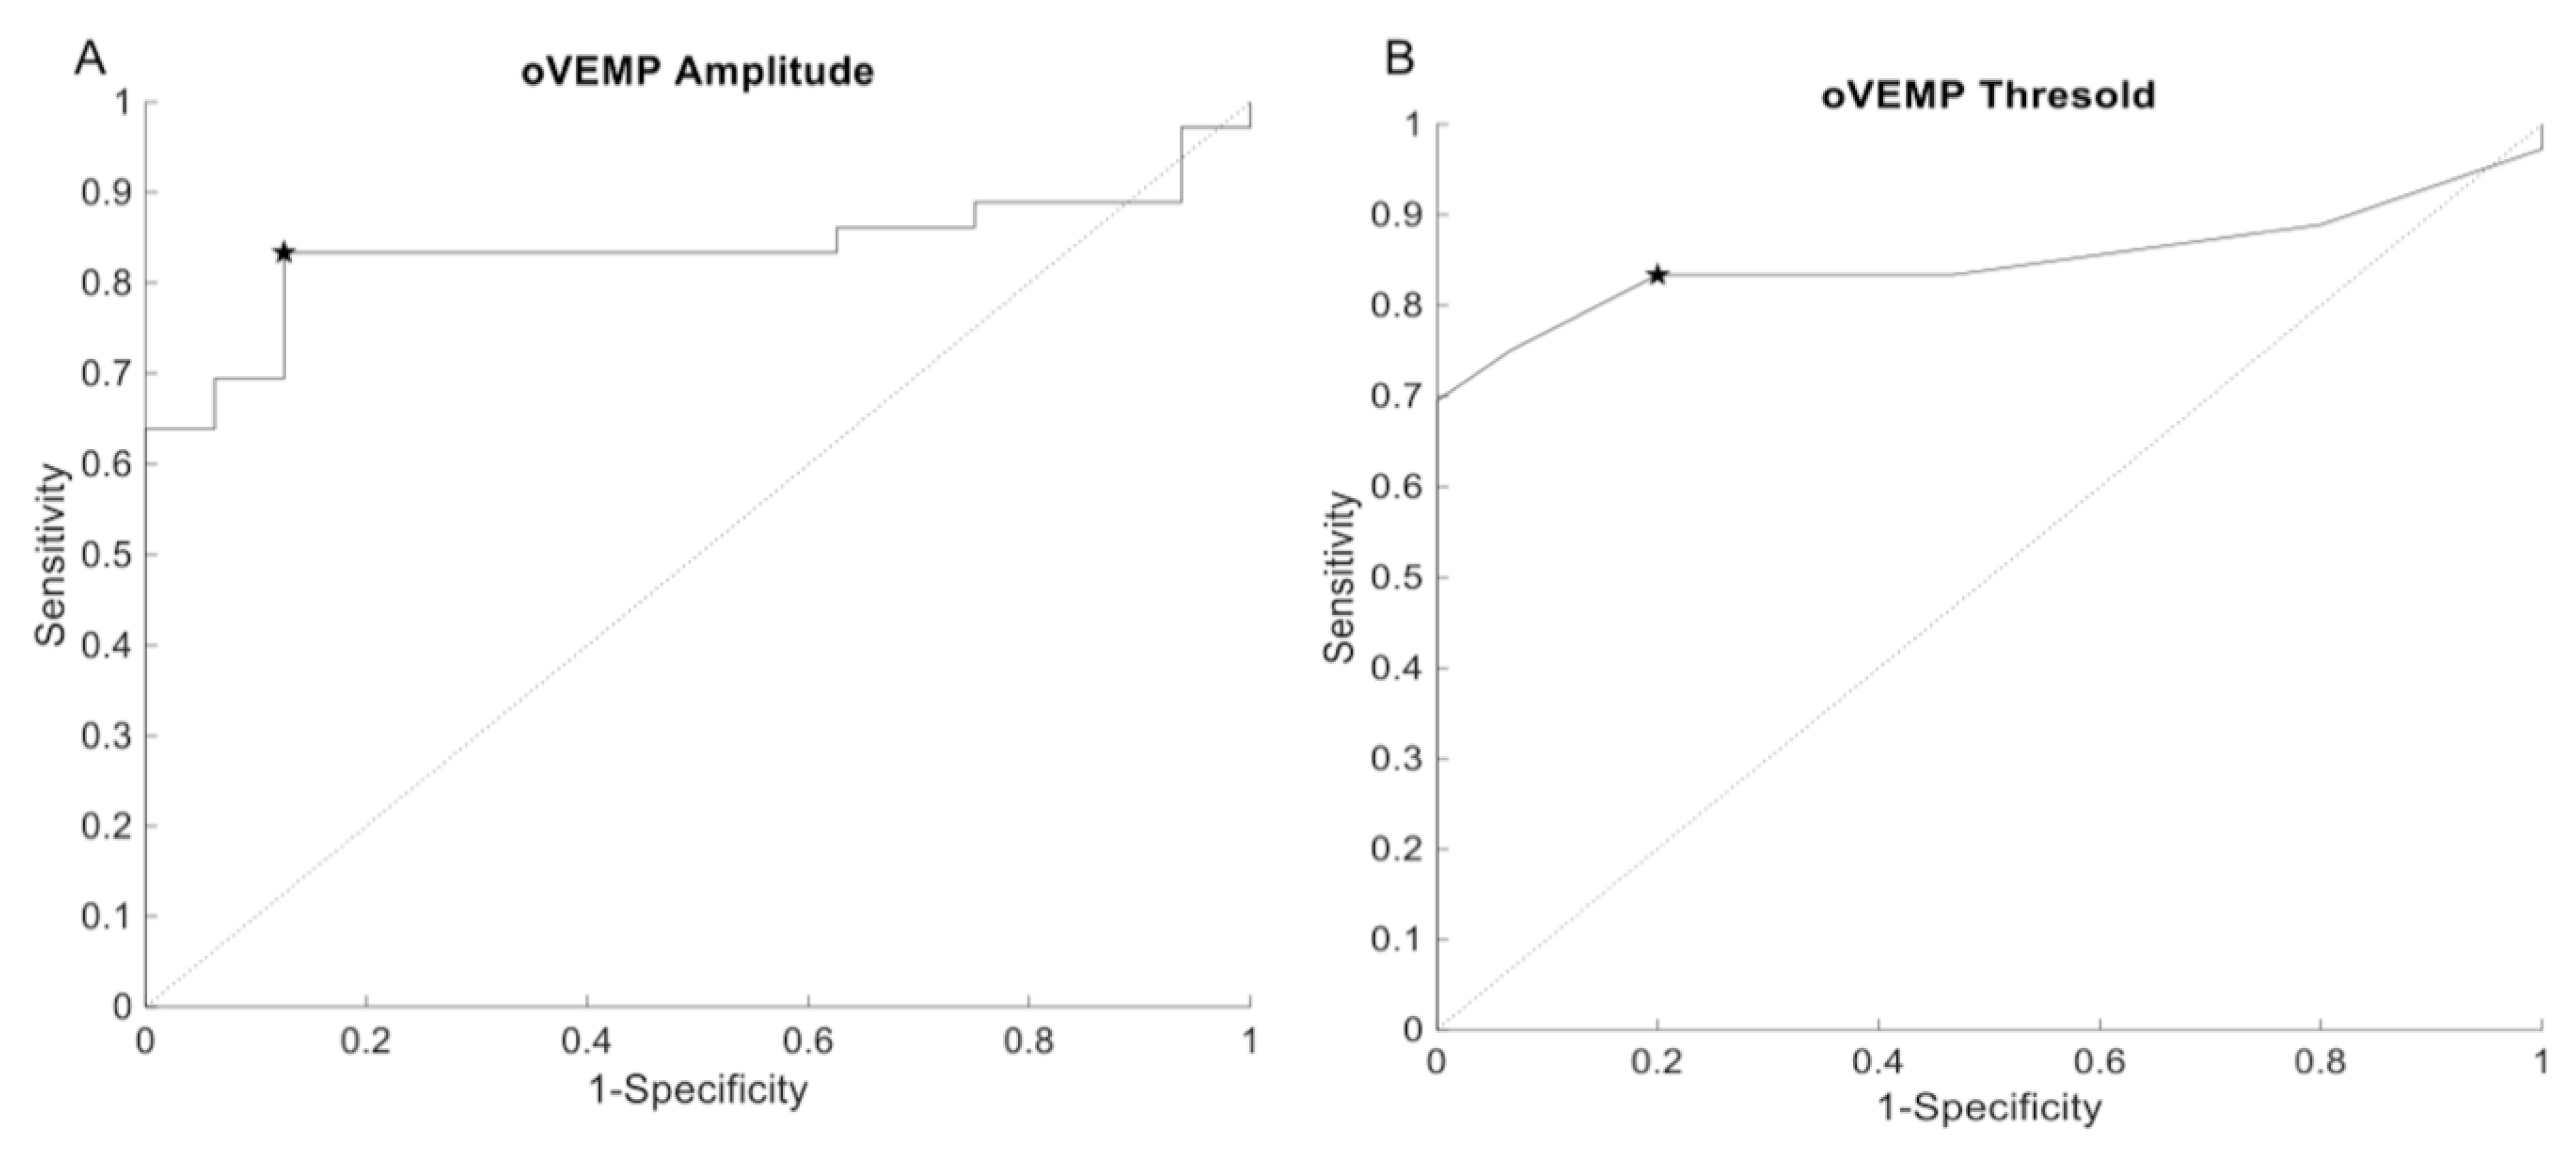
3.2. oVEMP (500 Hz)
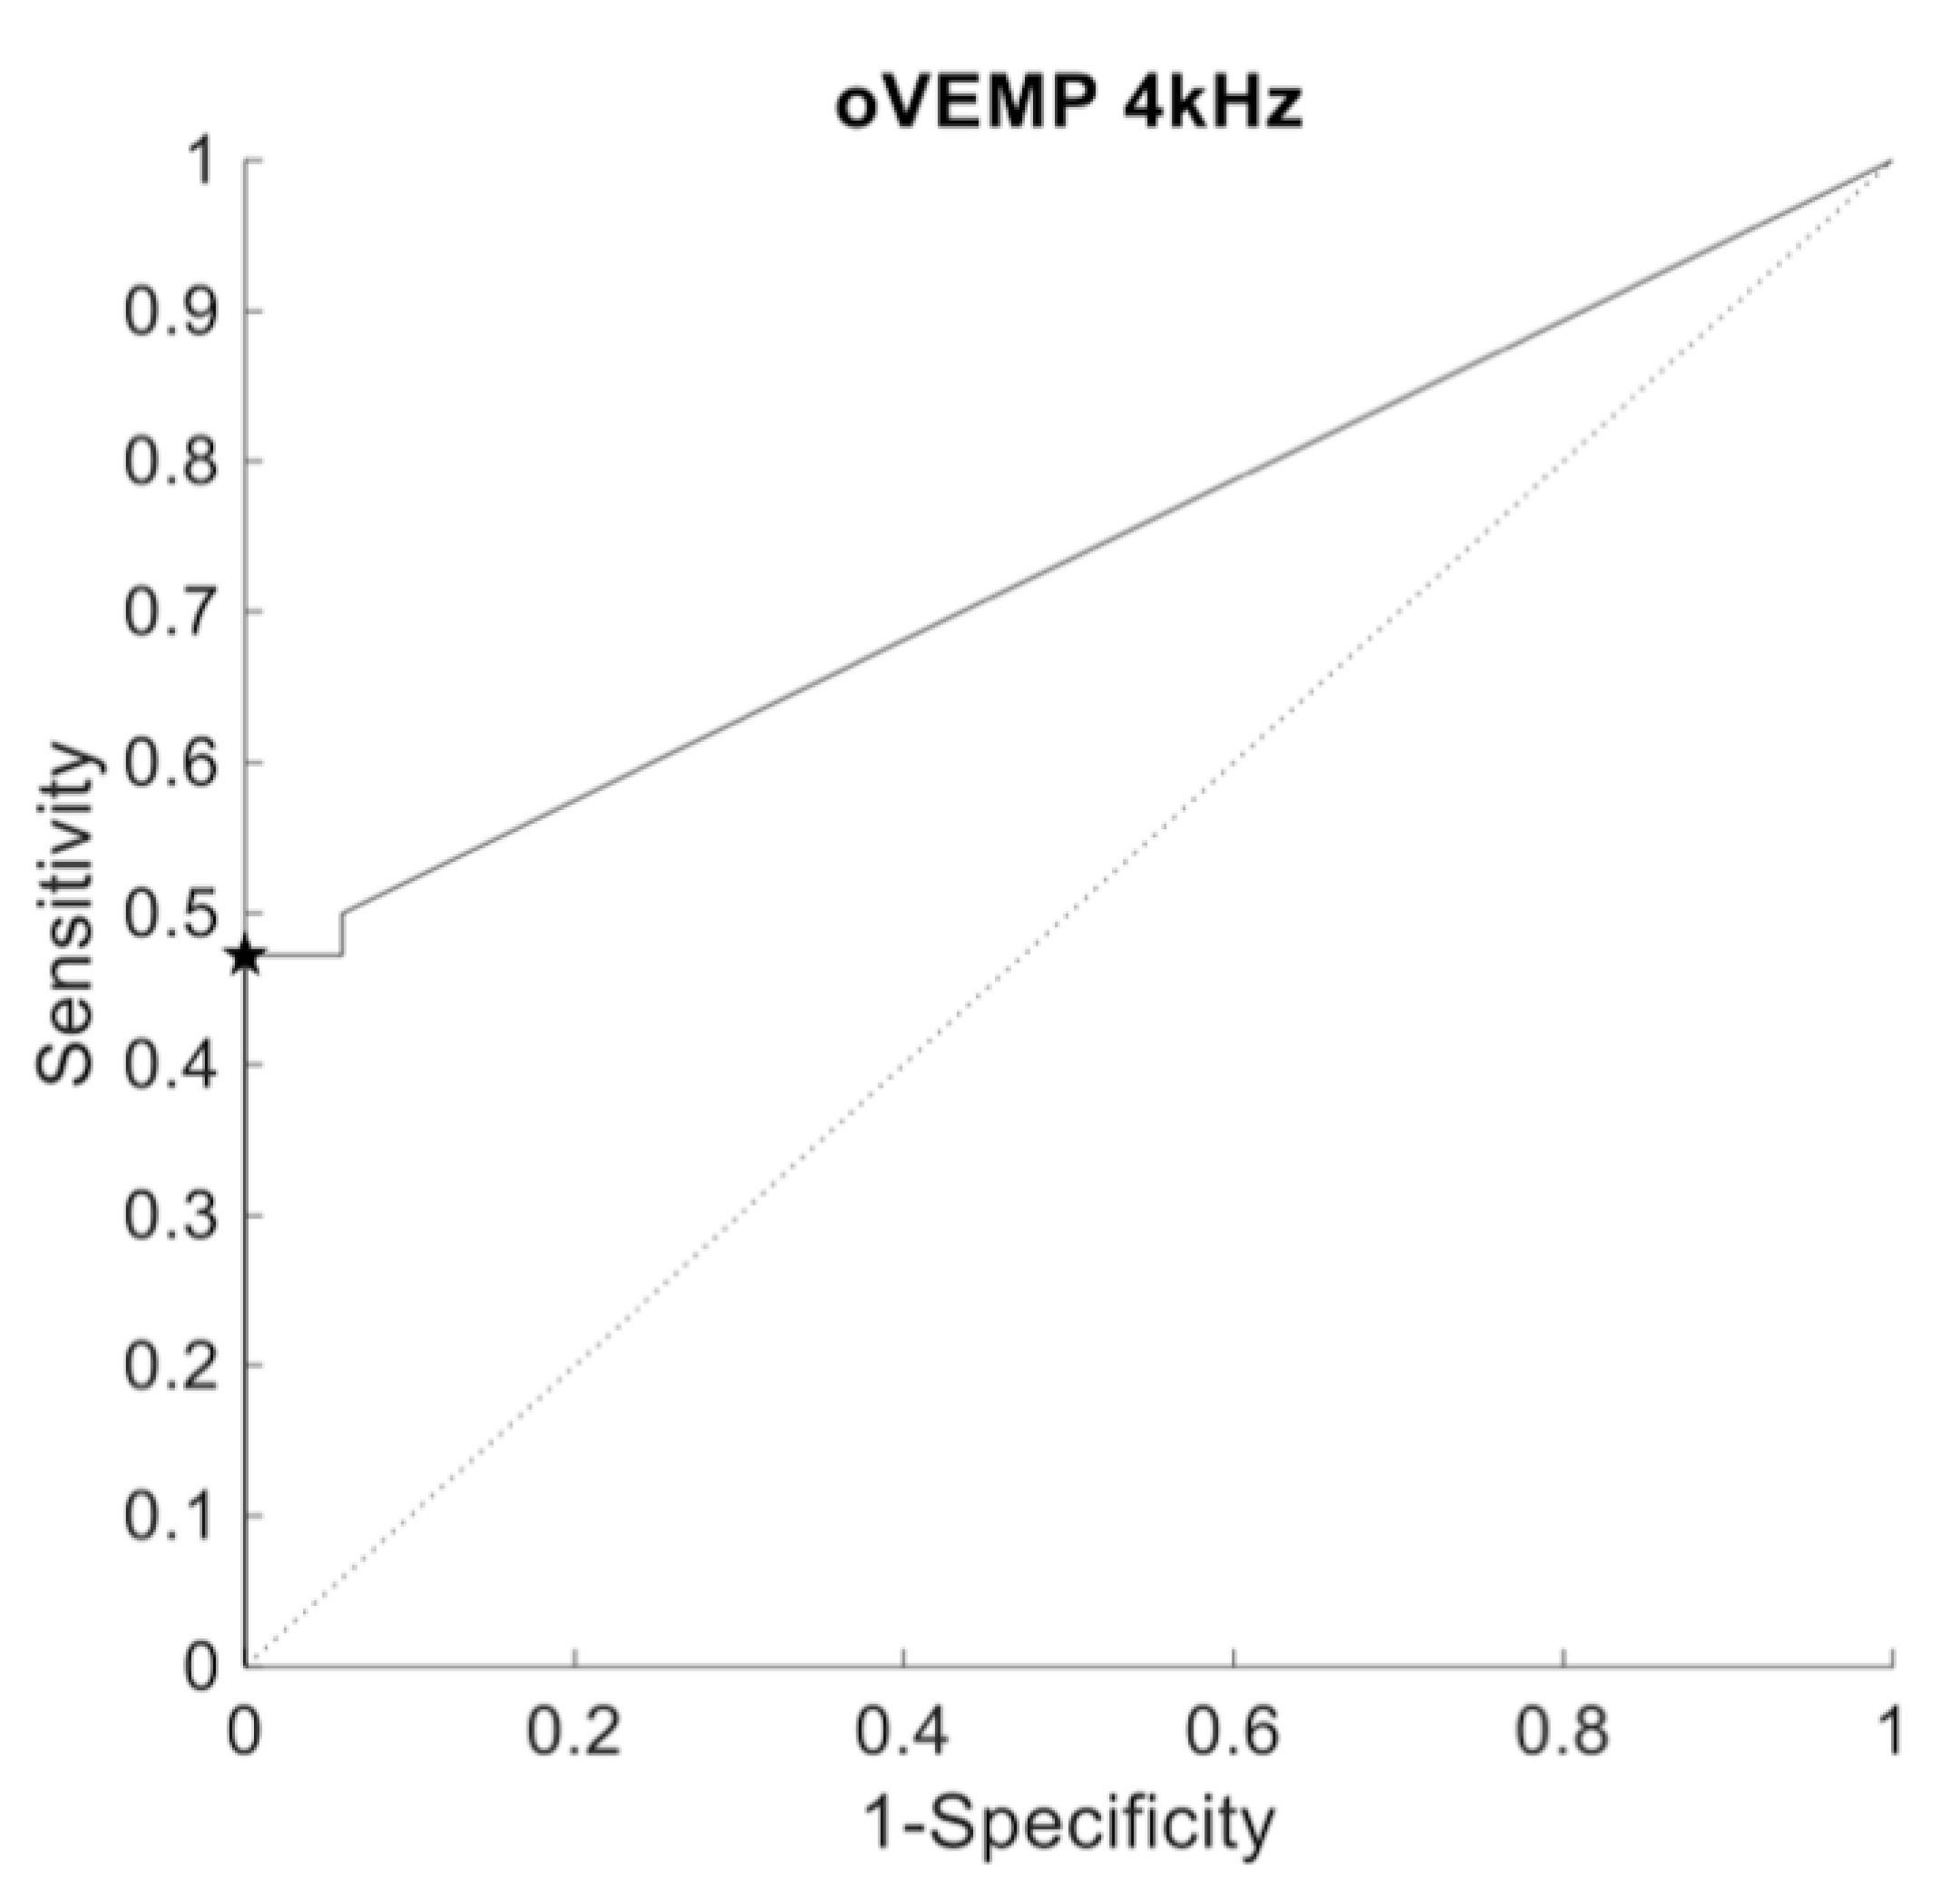
3.3. oVEMP (4 kHz)
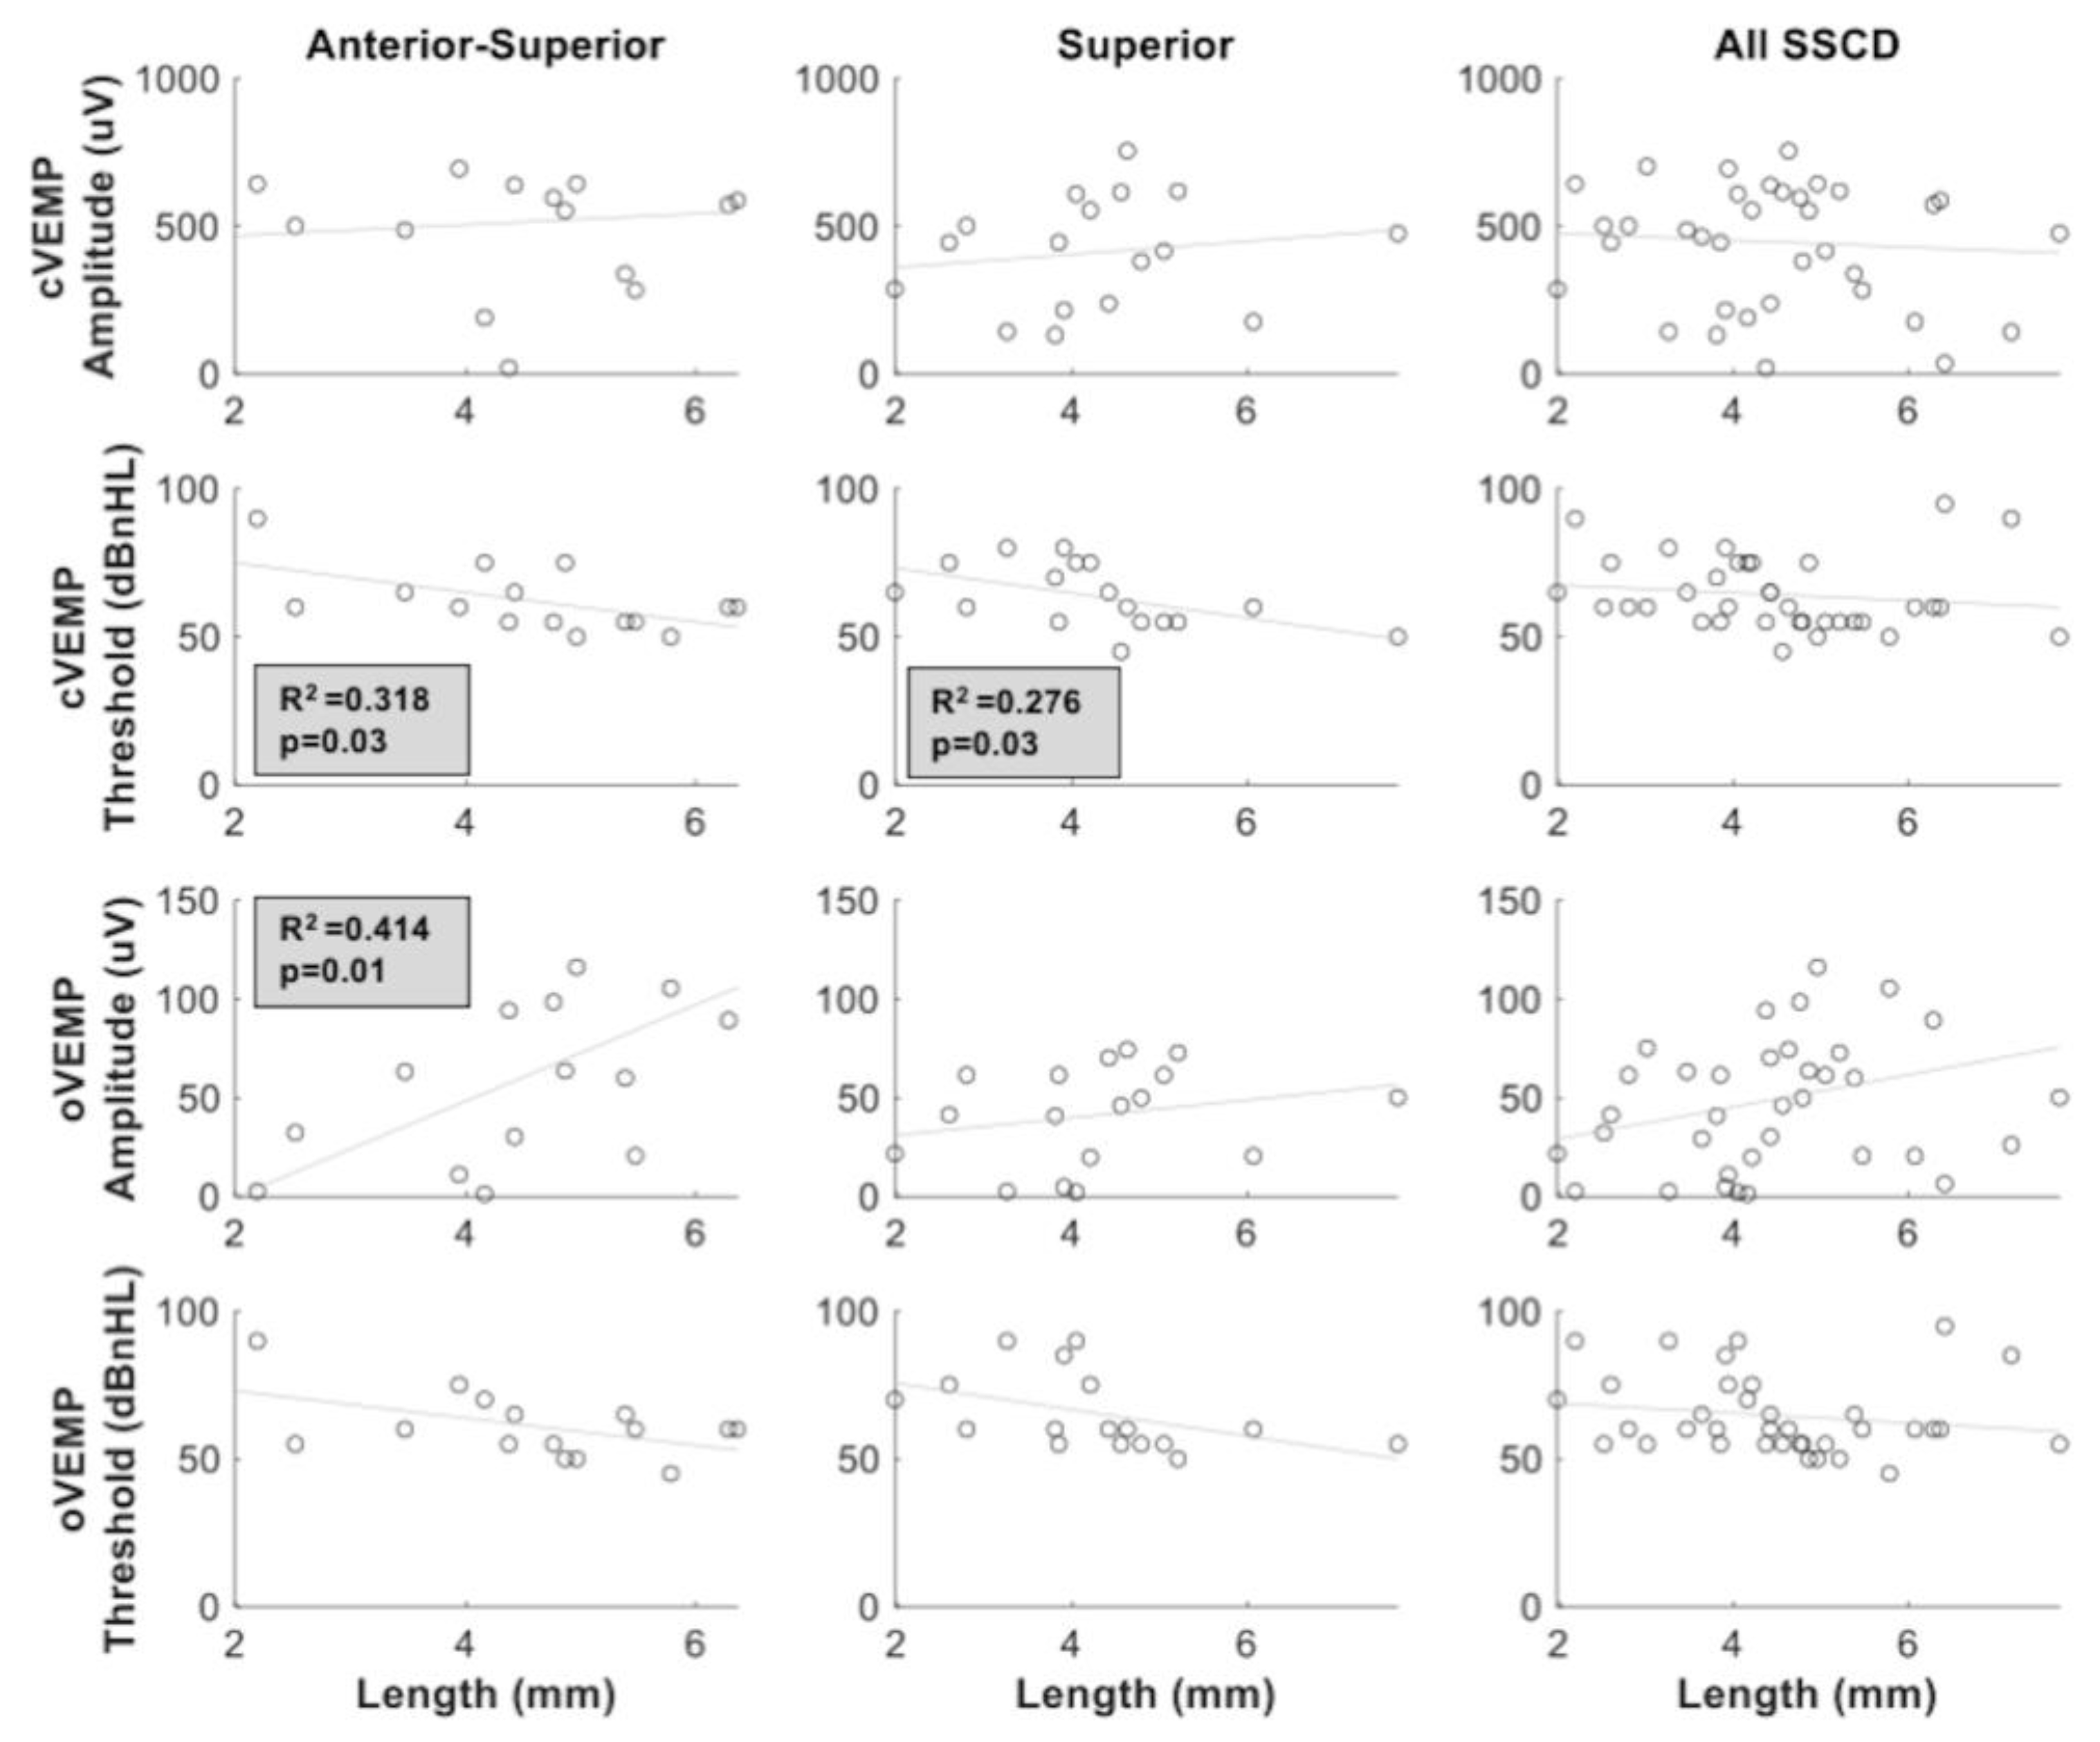
3.4. SSCD Size and VEMP Results
4. Discussion
5. Conclusions
Author Contributions
Funding
Institutional Review Board Statement
Informed Consent Statement
Data Availability Statement
Conflicts of Interest
References
- Cullen, K.E.; Taube, J.S. Our sense of direction: Progress, controversies and challenges. Nat. Neurosci. 2017, 20, 1465–1473. [Google Scholar] [CrossRef]
- Curthoys, I.S. The new vestibular stimuli: Sound and vibration-anatomical, physiological and clinical evidence. Exp. Brain Res. 2017, 235, 957–972. [Google Scholar] [CrossRef]
- Colebatch, J.G.; Rothwell, J.C. Motor unit excitability changes mediating vestibulocollic reflexes in the sternocleidomastoid muscle. Clin. Neurophysiol. 2004, 115, 2567–2573. [Google Scholar] [CrossRef]
- Weber, K.P.; Rosengren, S.M.; Michels, R.; Sturm, V.; Straumann, D.; Landau, K. Single motor unit activity in human extraocular muscles during the vestibulo-ocular reflex. J. Physiol. 2012, 590, 3091–3101. [Google Scholar] [CrossRef] [PubMed]
- Rosengren, S.M.; Colebatch, J.G.; Young, A.S.; Govender, S.; Welgampola, M.S. Vestibular evoked myogenic potentials in practice: Methods, pitfalls and clinical applications. Clin. Neurophysiol. Pract. 2019, 4, 47–68. [Google Scholar] [CrossRef] [PubMed]
- Ward, B.K.; Carey, J.P.; Minor, L.B. Superior Canal Dehiscence Syndrome: Lessons from the First 20 Years. Front Neurol. 2017, 8, 177. [Google Scholar] [CrossRef] [Green Version]
- Saliba, I.; Maniakas, A.; Benamira, L.Z.; Nehme, J.; Benoit, M.; Montreuil-Jacques, V. Superior canal dehiscence syndrome: Clinical manifestations and radiologic correlations. Eur. Arch. Otorhinolaryngol. 2014, 271, 2905–2914. [Google Scholar] [CrossRef] [PubMed]
- Zhou, G.; Gopen, Q.; Poe, D.S. Clinical and diagnostic characterization of canal dehiscence syndrome: A great otologic mimicker. Otol. Neurotol. 2007, 28, 920–926. [Google Scholar] [CrossRef]
- Crane, B.T.; Minor, L.B.; Carey, J.P. Three-dimensional computed tomography of superior canal dehiscence syndrome. Otol. Neurotol. 2008, 29, 699–705. [Google Scholar] [CrossRef] [PubMed]
- Zuniga, M.G.; Janky, K.L.; Nguyen, K.D.; Welgampola, M.S.; Carey, J.P. Ocular versus cervical VEMPs in the diagnosis of superior semicircular canal dehiscence syndrome. Otol. Neurotol. 2013, 34, 121–126. [Google Scholar] [CrossRef] [Green Version]
- Hunter, J.B.; Patel, N.S.; O’Connell, B.P. Cervical and Ocular VEMP Testing in Diagnosing Superior Semicircular Canal Dehiscence. Otolaryngol. Head Neck Surg. 2017, 156, 917–923. [Google Scholar] [CrossRef] [PubMed]
- Janky, K.L.; Nguyen, K.D.; Welgampola, M.; Zuniga, M.G.; Carey, J.P. Air-conducted oVEMPs provide the best separation between intact and superior canal dehiscent labyrinths. Otol. Neurotol. 2013, 34, 127–134. [Google Scholar] [CrossRef] [PubMed] [Green Version]
- Lin, K.; Lahey, R.; Beckley, R. Validating the Utility of High Frequency Ocular Vestibular Evoked Myogenic Potential Testing in the Diagnosis of Superior Semicircular Canal Dehiscence. Otol. Neurotol. 2019, 40, 1353–1358. [Google Scholar] [CrossRef]
- Manzari, L.; Burgess, A.M.; McGarvie, L.A.; Curthoys, I.S. An indicator of probable semicircular canal dehiscence: Ocular vestibular evoked myogenic potentials to high frequencies. Otolaryngol. Head Neck Surg. 2013, 149, 142–145. [Google Scholar] [CrossRef] [PubMed]
- Noij, K.S.; Rauch, S.D. Vestibular Evoked Myogenic Potential (VEMP) Testing for Diagnosis of Superior Semicircular Canal Dehiscence. Front. Neurol. 2020, 11, 695. [Google Scholar] [CrossRef] [PubMed]
- Benamira, L.Z.; Alzahrani, M.; Saliba, I. Superior canal dehiscence: Can we predict the diagnosis? OtolNeurotol. 2014, 35, 338–343. [Google Scholar] [CrossRef] [PubMed]
- McCaslin, D.L.; Jacobson, G.P.; Hatton, K.; Fowler, A.P.; DeLong, A.P. The effects of amplitude normalization and EMG targets on cVEMP interaural amplitude asymmetry. Ear. Hear. 2013, 34, 482–490. [Google Scholar] [CrossRef]
- Govender, S.; Rosengren, S.M.; Colebatch, J.G. The effect of gaze direction on the ocular vestibular evoked myogenic potential produced by air-conducted sound. Clin. Neurophysiol. 2009, 120, 1386–1391. [Google Scholar] [CrossRef]
- Branstetter, B.F., IV; Harrigal, C.; Escott, E.J.; Hirsch, B.E. Superior semicircular canal dehiscence: Oblique reformatted CT images for diagnosis. Radiology 2006, 238, 938–942. [Google Scholar] [CrossRef]
- Ward, B.K.; Wenzel, A.; Ritzl, E.K. Near-dehiscence: Clinical findings in patients with thin bone over the superior semicircular canal. Otol. Neurotol. 2013, 34, 1421–1428. [Google Scholar] [CrossRef] [Green Version]
- Dupont, N.M.; Escude, B.; Marx, M.; Fraysse, B.; Deguine, O. Étude Radioclinique de la Déhiscence des Canaux Semi-Circulaires Supérieurs: Existe-t-il Une Relation Entre la Taille de la Déhiscence et les Symptômes? Annales Françaises d’Oto-rhino-laryngologie et de Pathologie Cervico-faciale; Elsevier: Paris, France, 2012; Volume 129, pp. A90–A91. [Google Scholar]
- Piton, J.; Négrevergne, M.; Portmann, D. Déhiscence du canal semi-circulaire supérieur: Approche et classification scannographiques. Rev. Laryngol. Otol. Rhinol. 2008, 129, 17–26. [Google Scholar]
- Verrecchia, L.; Brantberg, K.; Tawfique, Z.; Maoli, D. Diagnostic Accuracy of Ocular Vestibular Evoked Myogenic Potentials for Superior Canal Dehiscence Syndrome in a Large Cohort of Dizzy Patients. Ear Hear. 2019, 40, 287–294. [Google Scholar] [CrossRef] [Green Version]
- Li, M.W.; Houlden, D.; Tomlinson, R.D. Click evoked EMG responses in sternocleidomastoid muscles: Characteristics in normal subjects. J. Vestib. Res. 1999, 9, 327–334. [Google Scholar] [PubMed]
- Govender, S.; Fernando, T.; Dennis, D.L.; Welgampola, M.S.; Colebatch, J.G. Properties of 500Hz air- and bone-conducted vestibular evoked myogenic potentials (VEMPs) in superior canal dehiscence. Clin. Neurophysiol. 2016, 127, 2522–2531. [Google Scholar] [CrossRef] [PubMed]
- Niesten, M.E.; Hamberg, L.M.; Silverman, J.B. Superior canal dehiscence length and location influences clinical presentation and audiometric and cervical vestibular-evoked myogenic potential testing. Audiol. Neurootol. 2014, 19, 97–105. [Google Scholar] [CrossRef] [PubMed] [Green Version]
- Iversen, M.M.; Zhu, H.; Zhou, W.; Della Santina, C.C.; Carey, J.P.; Rabbitt, R.D. Sound abnormally stimulates the vestibular system in canal dehiscence syndrome by generating pathological fluid-mechanical waves. Sci. Rep. 2018, 8, 10257. [Google Scholar] [CrossRef] [PubMed] [Green Version]
- Yuen, H.W.; Boeddinghaus, R.; Eikelboom, R.H.; Atlas, M.D. The relationship between the air-bone gap and the size of superior semicircular canal dehiscence. Otolaryngol. Head Neck Surg. 2009, 141, 689–694. [Google Scholar] [CrossRef] [PubMed]
- Demir, E.; Afacan, N.N.; Celiker, M.; Celiker, F.B.; İnecikli, M.F.; Terzi, S.; Dursun, E. Can Wideband Tympanometry Be Used as a Screening Test for Superior Semicircular Canal Dehiscence? Clin. Exp. Otorhinolaryngol. 2019, 12, 249–254. [Google Scholar] [CrossRef]
- Tikka, T.; Slim, M.A.M.; Gaggini, M.; Kontorinis, G. Video Head Impulse Test (vHIT) Findings in Patients With Superior Semicircular Canal Dehiscence: A Case-Control Study. J. Int. Adv. Otol. 2021, 17, 103–108. [Google Scholar] [CrossRef] [PubMed]
- Mukherjee, P.; Chiarovano, E.; Cheng, K.; Manzari, L.; McGarvie, L.A.; MacDougall, H.G. Video-head impulse test in superior canal dehiscence. Acta Otolaryngol. 2021, 141, 471–475. [Google Scholar] [CrossRef]
- Castellucci, A.; Piras, G.; Del Vecchio, V. The effect of superior canal dehiscence size and location on audiometric measurements, vestibular-evoked myogenic potentials and video-head impulse testing. Eur. Arch. Otorhinolaryngol. 2021, 278, 997–1015. [Google Scholar] [CrossRef] [PubMed]

| cVEMP | oVEMP | |||||
|---|---|---|---|---|---|---|
| Localization | n | Age (Years) Mean (±sd) | Peak Amplitude (μV) Mean (±sd) | Threshold (dBnHL) Mean (±sd) | Peak Amplitude (μV) Mean (±sd) | Threshold (dBnHL) Mean (±sd) |
| Anterior | 2 | 64.5 (±3.53) | 584.31 (±168.76) | 57.5 (±3.53) | 52.24 (±32.55) | 60 (±7.07) |
| Superior | 17 | 58.18 (±10.7) | 396.42 (±181.42) | 63.53 (±10.71) | 40.55 (±24.17) | 66.17 (±12.44) |
| Anterior-Superior | 15 | 50.81 (±168.76) | 522.14 (±229.36) | 62.81 (±10.94) | 60.19 (±47.26) | 60.94 (±11.72) |
| Posterior-Superior | 1 | 30 | 36.01 | 95 | 6.41 | 95 |
Publisher’s Note: MDPI stays neutral with regard to jurisdictional claims in published maps and institutional affiliations. |
© 2021 by the authors. Licensee MDPI, Basel, Switzerland. This article is an open access article distributed under the terms and conditions of the Creative Commons Attribution (CC BY) license (https://creativecommons.org/licenses/by/4.0/).
Share and Cite
Maheu, M.; Elblidi, A.; Saliba, I. Investigating Performance of cVEMP and oVEMP in the Identification of Superior Canal Dehiscence in Relation to Dehiscence Location and Size. Audiol. Res. 2021, 11, 452-462. https://doi.org/10.3390/audiolres11030042
Maheu M, Elblidi A, Saliba I. Investigating Performance of cVEMP and oVEMP in the Identification of Superior Canal Dehiscence in Relation to Dehiscence Location and Size. Audiology Research. 2021; 11(3):452-462. https://doi.org/10.3390/audiolres11030042
Chicago/Turabian StyleMaheu, Maxime, Ahlem Elblidi, and Issam Saliba. 2021. "Investigating Performance of cVEMP and oVEMP in the Identification of Superior Canal Dehiscence in Relation to Dehiscence Location and Size" Audiology Research 11, no. 3: 452-462. https://doi.org/10.3390/audiolres11030042