
Spatial Release from Masking for Tones and Noises in a Soundfield under Conditions Where Targets and Maskers Are Stationary or Moving


Abstract
:1. Introduction
1.1. Speech Identification
1.2. Sound Detection
2. Materials and Methods
2.1. Subjects
2.2. Listening Room
2.3. Procedure
2.4. Data Analysis
3. Experiment 1
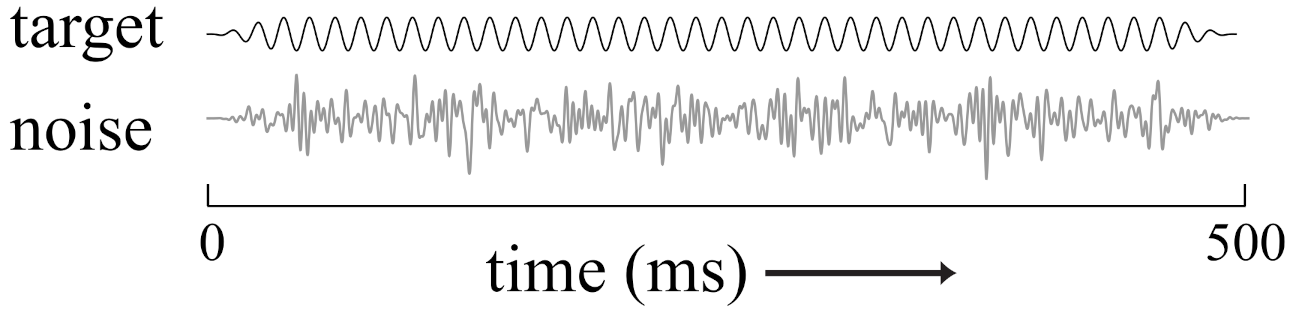
3.1. Stimuli
3.2. Conditions
- CO, Co-located condition: The masking pink noise was co-located with the tone at the loudspeaker located directly in front of the listener at 0.
- TC, Target Centered: Two independent pink noise maskers were presented, one from the loudspeaker at +45 and the other from the loudspeaker at . The tone was presented from the loudspeaker at 0. The CO and TC conditions together served to calculate the standard baseline value of spatial release from masking for comparisons with target panning conditions.
- TPM, Target Panned Moving: Independent pink noise maskers were presented as in the TC condition, from loudspeakers at +45 and . The tone was amplitude panned, from the beginning of the stimulus to the end, so that a phantom sound source moved from +20 to or vice versa. Loudspeakers at were used to present the panned noises. If motion of a sound source improved detection, then this condition should elicit a greater release from masking than did the TC condition above.
- TPS, Target Panned Static: Independent pink noise maskers were presented as in the TC condition, from loudspeakers at . The tone was panned between loudspeakers at so that its phantom image would be perceived at either or . This condition acted as a control to determine what, if any, effect the off-center, panned presentation of the target had in the TPM condition as compared with the TC condition.
- MPM, Masker Panned Moving: The target was presented from the 0 front loudspeaker and the two pink noise maskers were panned, in the same direction, from left to right between speakers at , or vice-versa. The perceived masker locations were expected to migrate from and . This condition sought to determine if masker motion might make detection of a stationary target more or less difficult.
- TSD, Diffuse Static: The target was statically presented from any one of the loudspeakers at , , , , at random. All 7 loudspeakers from to simultaneously presented pink noise maskers, with each loudspeaker presenting an independent noise. This condition is analogous to the TC condition above.
- TPMD, Diffuse Moving: The same as above, but the target tone was panned between loudspeakers at from left to right or right to left at random, in the same way as it was in the TPM condition above. This condition is analogous to the TPM condition above.
3.3. Results
4. Experiment 2
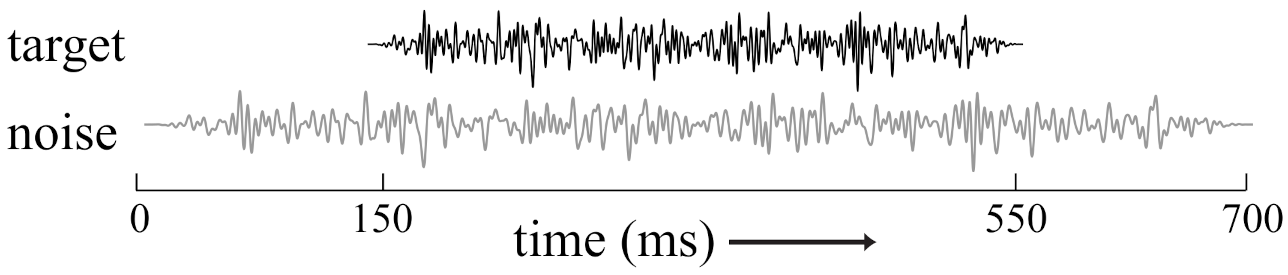
4.1. Stimuli
4.2. Conditions
- CO, Co-located condition: Target stimulus was co-located with the masker at 0.
- TPS, Target Panned Static: Using loudspeakers at at , the target stimulus was statically panned so that a stationary phantom image would be perceived at either or (roughly).
- TPM, Target Panned Moving: Using loudspeakers at at , the target stimulus was dynamically panned so that a moving phantom image would be appear to move from approximately to or vice versa.
4.3. Results
5. Discussion and Conclusions
5.1. Summary
- 1.
- The mean spatial release from masking (SRM) across 11 listeners for a 500-Hz tonal target varied from ≈1.75 to 3 dB, depending on how the target location was separated from those of the maskers.
- 2.
- There was no appreciable (nor statistically significant) difference in SRM between conditions where the target was stationary vs. dynamically panned to simulate target motion.
- 3.
- Using a diffuse noise field as opposed to individual maskers revealed a small difference in detection for moving vs. stationary targets, but the direction of this difference was opposite for target stimuli at 500 Hz vs. 4000 Hz.
- 1.
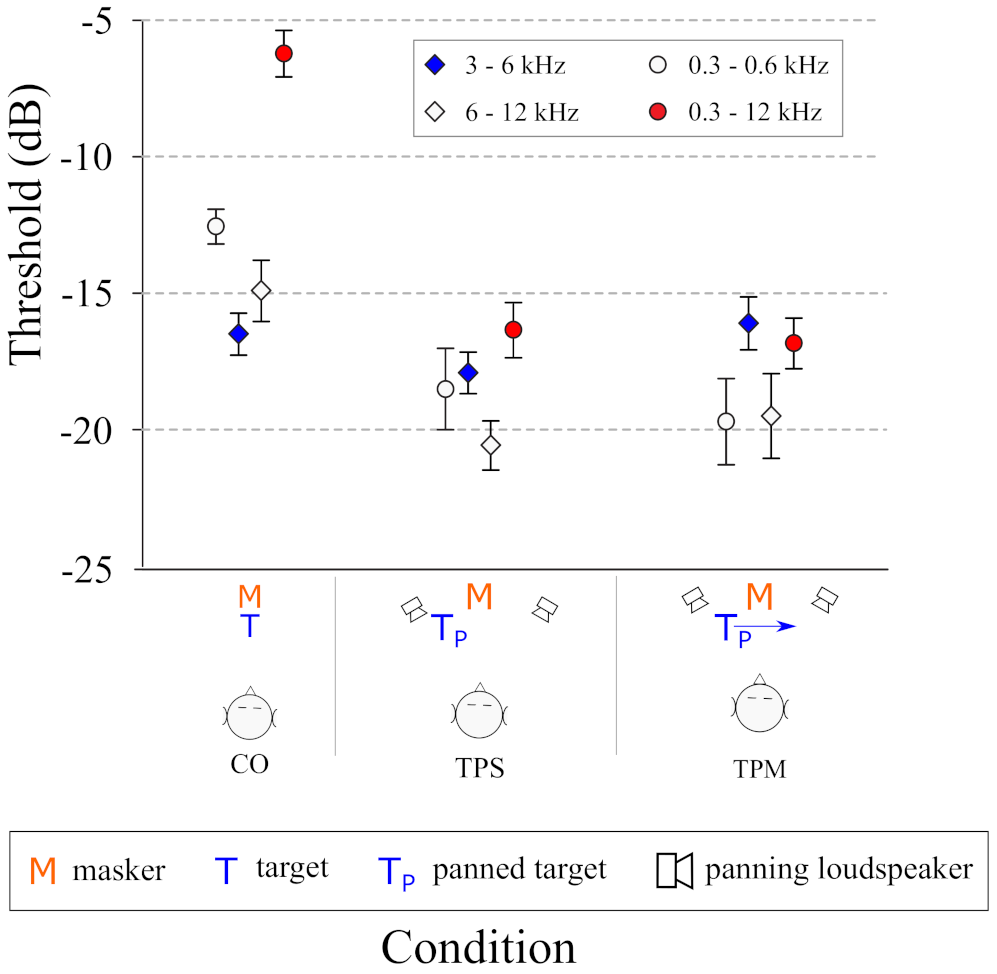
- Overall, there was greater SRM for the noise targets than the tonal targets.
- 2.
- There was SRM of approximately 5 dB for octave band noise targets (300–600 Hz and 6–12 kHz) and approximately 10 dB for the broadband (0.3–12 kHz) noise targets.
- 3.
- Interestingly, there was essentially no SRM for the 3–6 kHz octave-band target noise. We do not currently have an explanation for this, but this lack of SRM was the same regardless of whether the target moved or was stationary.
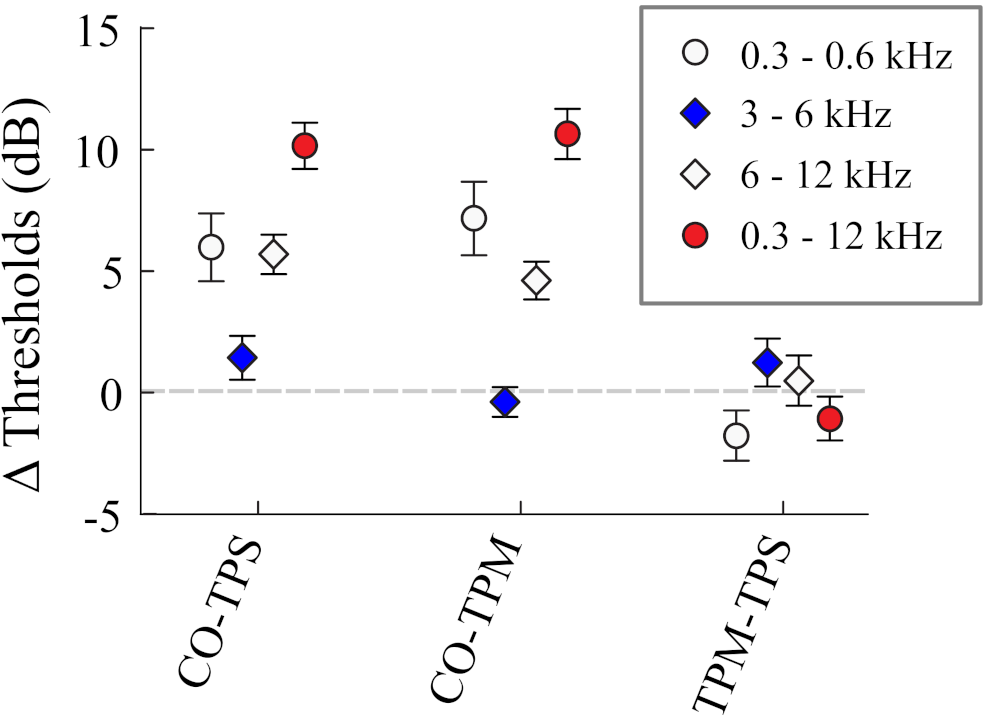
- 4.
- The difference in SRM between stationary and moving targets was not significant, though the mean difference for the 300–600 Hz target noise was approximately 2 dB less masking for the moving target than the stationary target.
5.2. Soundfield Spatial Release from Masking in the Literature
5.3. The Apparent Lack of an Effect on Sound Source Detection from Sound Source Movement
5.4. Limitations and Future Experiments
Author Contributions
Funding
Institutional Review Board Statement
Informed Consent Statement
Data Availability Statement
Conflicts of Interest
References
- Pastore, M.T.; Yost, W.A. Spatial Release from Masking with a Moving Target. Front. Psychol. 2017, 8, 2238. [Google Scholar] [CrossRef] [PubMed] [Green Version]
- Munoz, R.V.; Aspock, L.; Fels, J. Spatial release from masking under different reverberant conditions in young and elderly subjects: Effect of moving or stationary maskers at circular and radial conditions. J. Speech Lang. Hear. Res. 2019, 62, 3582–3596. [Google Scholar] [CrossRef] [PubMed]
- Hartmann, W.M.; Wittenberg, A. On the externalization of sound images. J. Acoust. Soc. Am. 1996, 99, 3678–3688. [Google Scholar] [CrossRef] [PubMed]
- Brimijoin, W.O.; Boyd, A.W.; Akeroyd, M.A. The contribution of head movement to the externalization and internalization of sounds. PLoS ONE 2013, 8, e083068. [Google Scholar] [CrossRef] [Green Version]
- Hassager, H.G.; Gran, F.; Dau, T. The role of spectral detail in the binaural transfer function on perceived externalization in a reverberant environment. J. Acoust. Soc. Am. 2016, 139, 2992–3000. [Google Scholar] [CrossRef]
- Kolarik, A.J.; Moore, B.C.J.; Zahorik, P.; Cirstea, S.; Pardhan, S. Auditory distance perception in humans: A review of cues, development, neuronal bases, and effects of sensory loss. Atten. Percept. Psychophys. 2016, 78, 373–395. [Google Scholar] [CrossRef] [Green Version]
- Chandler, D.W.; Grantham, D.W. Minimum audible movement angle in the horizontal plane as a function of stimulus frequency and bandwidth, source azimuth, and velocity. J. Acoust. Soc. Am. 1992, 91, 1624–1636. [Google Scholar] [CrossRef]
- Brimijoin, W.O.; Akeroyd, M.A. The moving minimum audible angle is smaller during self motion than during source motion. Front. Neurosci. 2014, 8, 273. [Google Scholar] [CrossRef] [Green Version]
- Warnecke, M.; Litovsky, R.Y. Signal envelope and speech intelligibility differentially impact auditory motion perception. Sci. Rep. 2021, 11, 15117. [Google Scholar] [CrossRef]
- Perrott, D.R.; Strybel, T.Z. Some Observations Regarding Motion Without Direction. In Binaural and Spatial Hearing in Real and Virtual Environments; Gilkey, R.H., Anderson, T.R., Eds.; Lawrence Erlebaum Associates: Mahwah, NJ, USA, 1997; Chapter 14; pp. 275–294. [Google Scholar]
- Grantham, D.W. Auditory Motion Perception. In Binaural and Spatial Hearing in Real and Virtual Environments, 1st ed.; Gilkey, R.H., Anderson, T.R., Eds.; Lawrence Erlebaum Associates: Mahwah, NJ, USA, 1997; Chapter 15; pp. 295–313. [Google Scholar]
- Carlile, S.; Leung, J. The Perception of Auditory Motion. Trends Hear. 2016, 20, 2331216516644254. [Google Scholar] [CrossRef]
- Wilcott, R.C.; Gales, R.S. Comparison of the Masked Thresholds of a Simulated Moving and Stationary Auditory Signal. J. Exp. Psychol. 1954, 47, 451–456. [Google Scholar] [CrossRef] [PubMed]
- Grantham, D.W.; Luethke, L.E. Detectability of tonal signals with changing interaural phase differences in noise. J. Acoust. Soc. Am. 1988, 83, 1117–1123. [Google Scholar] [CrossRef] [PubMed]
- Gaik, W. Combined evaluation of interaural time and intensity differences: Psychoacoustic results and computer modeling. J. Acoust. Soc. Am. 1993, 94, 98–110. [Google Scholar] [CrossRef] [PubMed]
- Wenzel, E.M.; Arruda, M.; Kistler, D.J.; Wightman, F.L. Localization using nonindividualized head-related transfer functions. J. Acoust. Soc. Am. 1993, 94, 111–123. [Google Scholar] [CrossRef]
- Middlebrooks, J.C. Virtual localization improved by scaling nonindividualized external-ear transfer functions in frequency. J. Acoust. Soc. Am. 1999, 106, 1493–1510. [Google Scholar] [CrossRef] [PubMed]
- Xiao, X. The effect of a free-field auditory target’s motion on its detectability in the horizontal plane. J. Acoust. Soc. Am. 1997, 102, 1907–1910. [Google Scholar] [CrossRef]
- Yost, W.A. Spatial release from masking based on binaural processing for up to six maskers. J. Acoust. Soc. Am. 2017, 141, 2093–2106. [Google Scholar] [CrossRef] [Green Version]
- Yost, W.A. Prior stimulation and the masking-level difference. J. Acoust. Soc. Am. 1985, 78, 901–907. [Google Scholar] [CrossRef] [PubMed]
- Bauer, B.B. Phasor Analysis of Some Stereophonic Phenomena. J. Acoust. Soc. Am. 1961, 33, 1536–1539. [Google Scholar] [CrossRef]
- Grantham, D.W. Detection and discrimination of simulated motion of auditory targets in the horizontal plane. J. Acoust. Soc. Am. 1986, 79, 1939–1949. [Google Scholar] [CrossRef]
- Blauert, J. Spatial Hearing, revised ed.; The MIT Press: Cambridge, MA, USA, 1997. [Google Scholar]
- Macpherson, E.A.; Middlebrooks, J.C. Listener weighting of cues for lateral angle: The duplex theory of sound localization revisited. J. Acoust. Soc. Am. 2002, 111, 2219–2236. [Google Scholar] [CrossRef] [PubMed] [Green Version]
- Bronkhorst, A.W. The Cocktail Party Phenomenon: A Review of Research on Speech Intelligibility in Multiple-Talker Conditions. Acta Acust. United Acust. 2000, 86, 117–128. [Google Scholar] [CrossRef]
- Bronkhorst, A.W. The cocktail-party problem revisited: Early processing and selection of multi-talker speech. Atten. Percept. Psychophys. 2015, 77, 1465–1487. [Google Scholar] [CrossRef] [PubMed] [Green Version]
- Braasch, J.; Hartung, K. Localization in the Presence of a Distracter and Reverberation in the Frontal Horizontal Plane I Psychoacoustical Data. Acta Acust. United Acust. 2002, 88, 942–955. [Google Scholar]
- Braasch, J. Localization in the Presence of a Distracter and Reverberation in the Frontal Horizontal Plane: II Model Algorithms. Acta Acust. United Acust. 2002, 88, 956–969. [Google Scholar]
- Yost, W.A.; Zhong, X. Sound source localization identification accuracy: Bandwidth dependencies. J. Acoust. Soc. Am. 2014, 136, 2737–2746. [Google Scholar] [CrossRef]
- Stern, R.M.; Zeiberg, A.S.; Trahiotis, C. Lateralization of complex binaural stimuli: A weighted-image model. J. Acoust. Soc. Am. 1988, 84, 156–165. [Google Scholar] [CrossRef]
- Licklider, J.C.R. The influence of interaural phase relations upon the masking of speech by white noise. J. Acoust. Soc. Am. 1948, 20, 150–159. [Google Scholar] [CrossRef]
- Hirsh, I.J. The influence of interaural phase on interaural summation and inhibition. J. Acoust. Soc. Am. 1948, 20, 536–544. [Google Scholar] [CrossRef]
- Green, D.M.; Yost, W.A. Binaural analysis. In Handbook of Sensory Physiology—Auditory System; Springer: Berlin/Heidelberg, Germany; New York, NY, USA, 1975; pp. 461–480. [Google Scholar]
- McFadden, D. Masking and the Binaural System. In The Nervous System; Raven Press: New York, NY, USA, 1975; Volume 3, pp. 137–146. [Google Scholar]
- Durlach, N.I.; Colburn, H.S. Binaural Phenomena. In Handbook of Perception, Vol IV, 1st ed.; Carterette, E.C., Friedman, M.P., Eds.; Academic Press: New York, NY, USA, 1978; Chapter 10; pp. 365–463. [Google Scholar]
- Saberi, K.; Dostal, L.; Sadralodabai, T.; Bull, V.; Perrott, D.R. Free-field release from masking. J. Acoust. Soc. Am. 1991, 90, 1355–1370. [Google Scholar] [CrossRef] [Green Version]
- Yost, W.A. The Cocktail Party Problem: 40 Years Later. In Binaural and Spatial Hearing in Real and Virtual Environments; Gilkey, R.H., Anderson, T.R., Eds.; Lawrence Erlebaum Associates: Mahwah, NJ, USA, 1997; Chapter 17; pp. 365–463. [Google Scholar]
- Santon, F. Detection d’un son pur dans un bruit masquant suivant l’angle d’incidence du bruit. Relation avec le seuil de reception de la parole. Acta Acust. United Acust. 1987, 63, 222–228. [Google Scholar]
- Ebata, M.; Sone, T.; Nimura, T. Improvement of Hearing Ability by Directional Information. J. Acoust. Soc. Am. 1968, 43, 289–297. [Google Scholar] [CrossRef] [PubMed]
- Jeffress, L.A.; Blodgett, H.C.; Sandel, T.T.; Wood, C.L. Masking of Tonal Signals. J. Acoust. Soc. Am. 1956, 28, 416–426. [Google Scholar] [CrossRef]
- Grantham, D.W.; Wightman, F.L. Detectability of varying interaural temporal differences. J. Acoust. Soc. Am. 1978, 63, 511–523. [Google Scholar] [CrossRef]
- Grantham, D.W. Detectability of time-varying interaural correlation in narrow-band noise stimuli. J. Acoust. Soc. Am. 1982, 72, 1178–1184. [Google Scholar] [CrossRef] [PubMed]
- Saberi, K.; Hafter, E.R. Experiments on Auditory Motion Discrimination. In Binaural and Spatial Hearing in Real and Virtual Environments, 1st ed.; Gilkey, R.H., Anderson, T.R., Eds.; Lawrence Erlebaum Associates: Mahwah, NJ, USA, 1997; Chapter 16; pp. 315–327. [Google Scholar]
- Carlile, S.; Best, V. Discrimination of sound source velocity in human listeners. J. Acoust. Soc. Am. 2002, 111, 1026. [Google Scholar] [CrossRef]


Publisher’s Note: MDPI stays neutral with regard to jurisdictional claims in published maps and institutional affiliations. |
© 2022 by the authors. Licensee MDPI, Basel, Switzerland. This article is an open access article distributed under the terms and conditions of the Creative Commons Attribution (CC BY) license (https://creativecommons.org/licenses/by/4.0/).
Share and Cite
Pastore, M.T.; Yost, W.A. Spatial Release from Masking for Tones and Noises in a Soundfield under Conditions Where Targets and Maskers Are Stationary or Moving. Audiol. Res. 2022, 12, 99-112. https://doi.org/10.3390/audiolres12020013
Pastore MT, Yost WA. Spatial Release from Masking for Tones and Noises in a Soundfield under Conditions Where Targets and Maskers Are Stationary or Moving. Audiology Research. 2022; 12(2):99-112. https://doi.org/10.3390/audiolres12020013
Chicago/Turabian StylePastore, M. Torben, and William A. Yost. 2022. "Spatial Release from Masking for Tones and Noises in a Soundfield under Conditions Where Targets and Maskers Are Stationary or Moving" Audiology Research 12, no. 2: 99-112. https://doi.org/10.3390/audiolres12020013