
Can Mismatch Negativity Be Used as an Indicator to Predict Central Auditory Deficits in Individuals with Normal Hearing?

 ,
,
Abstract
1. Introduction
2. Materials and Methods
2.1. Subjects
2.2. Stimulation and Recording
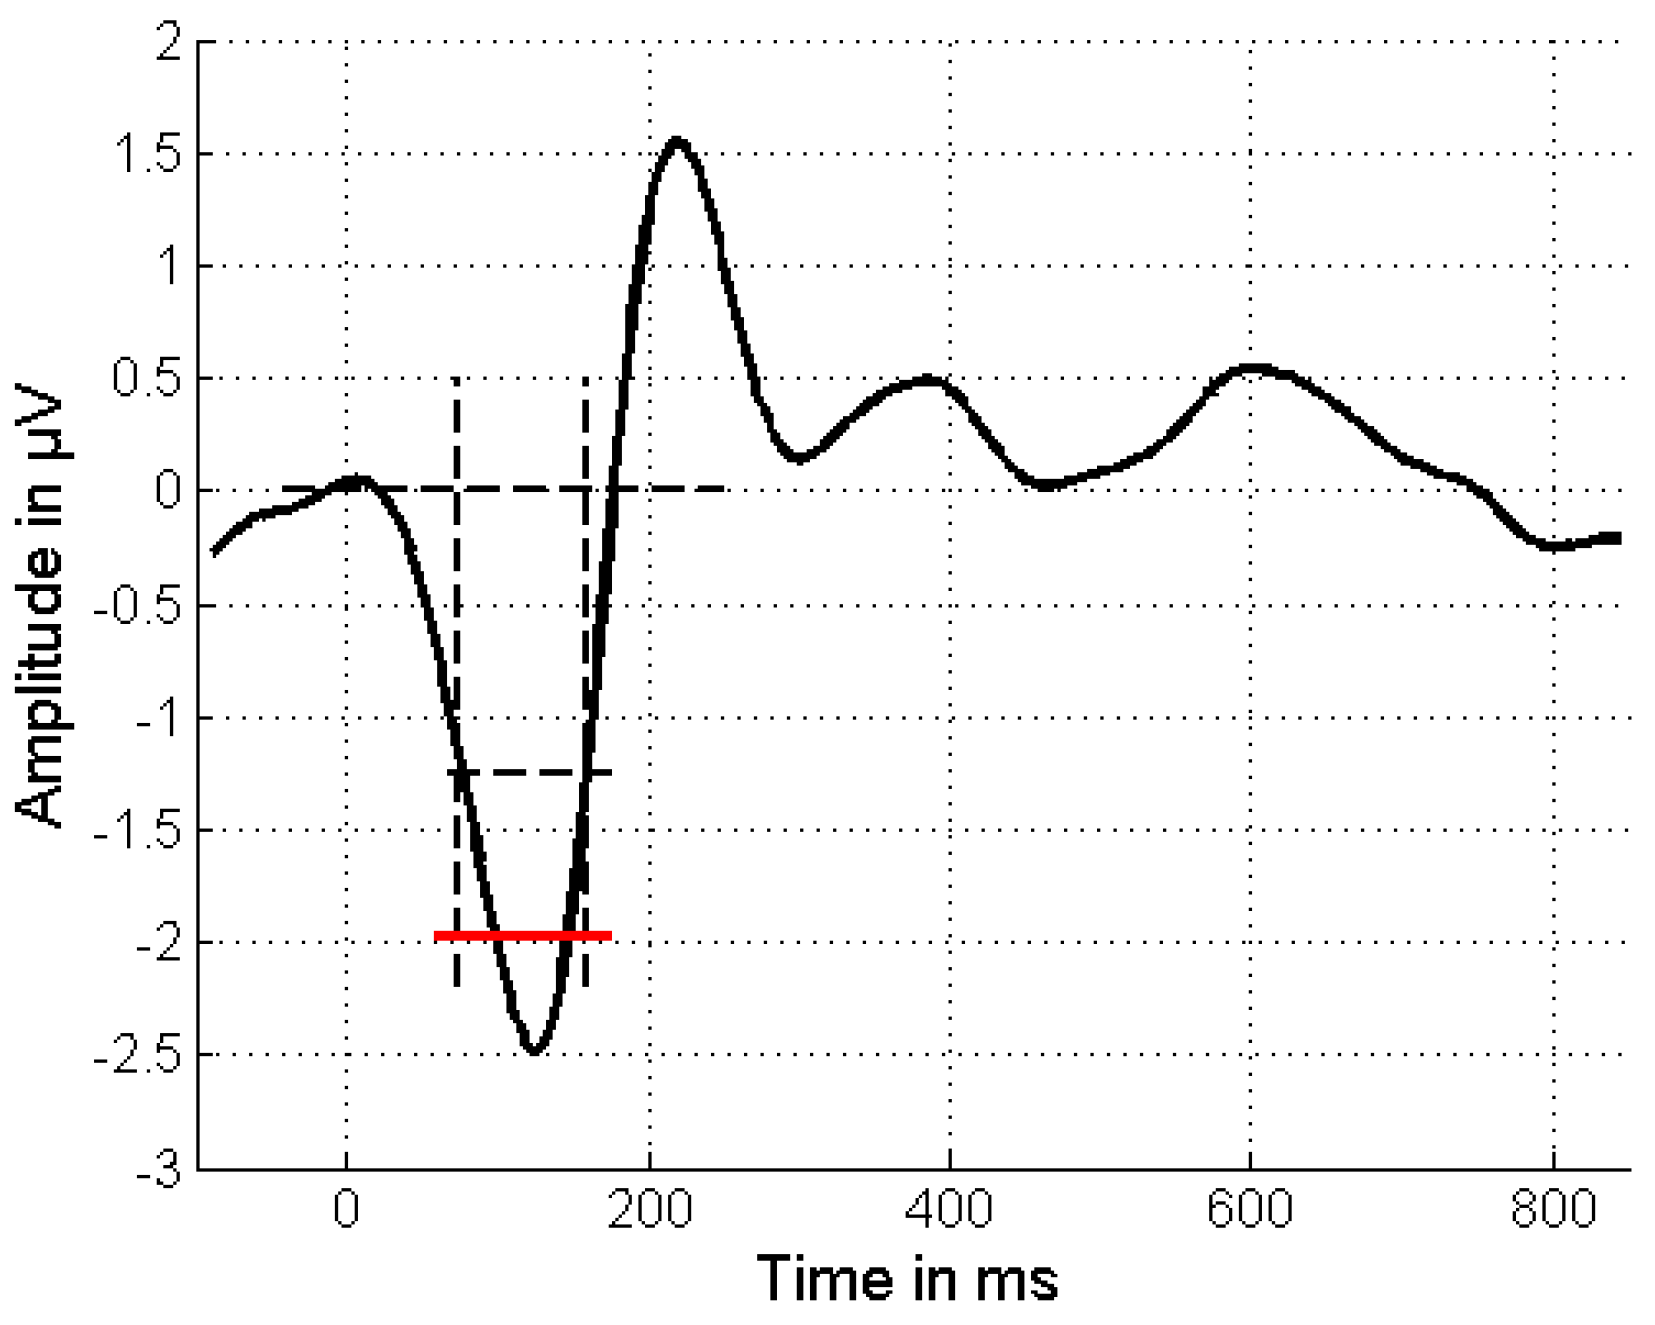
2.3. Data Processing and Analysis
3. Results
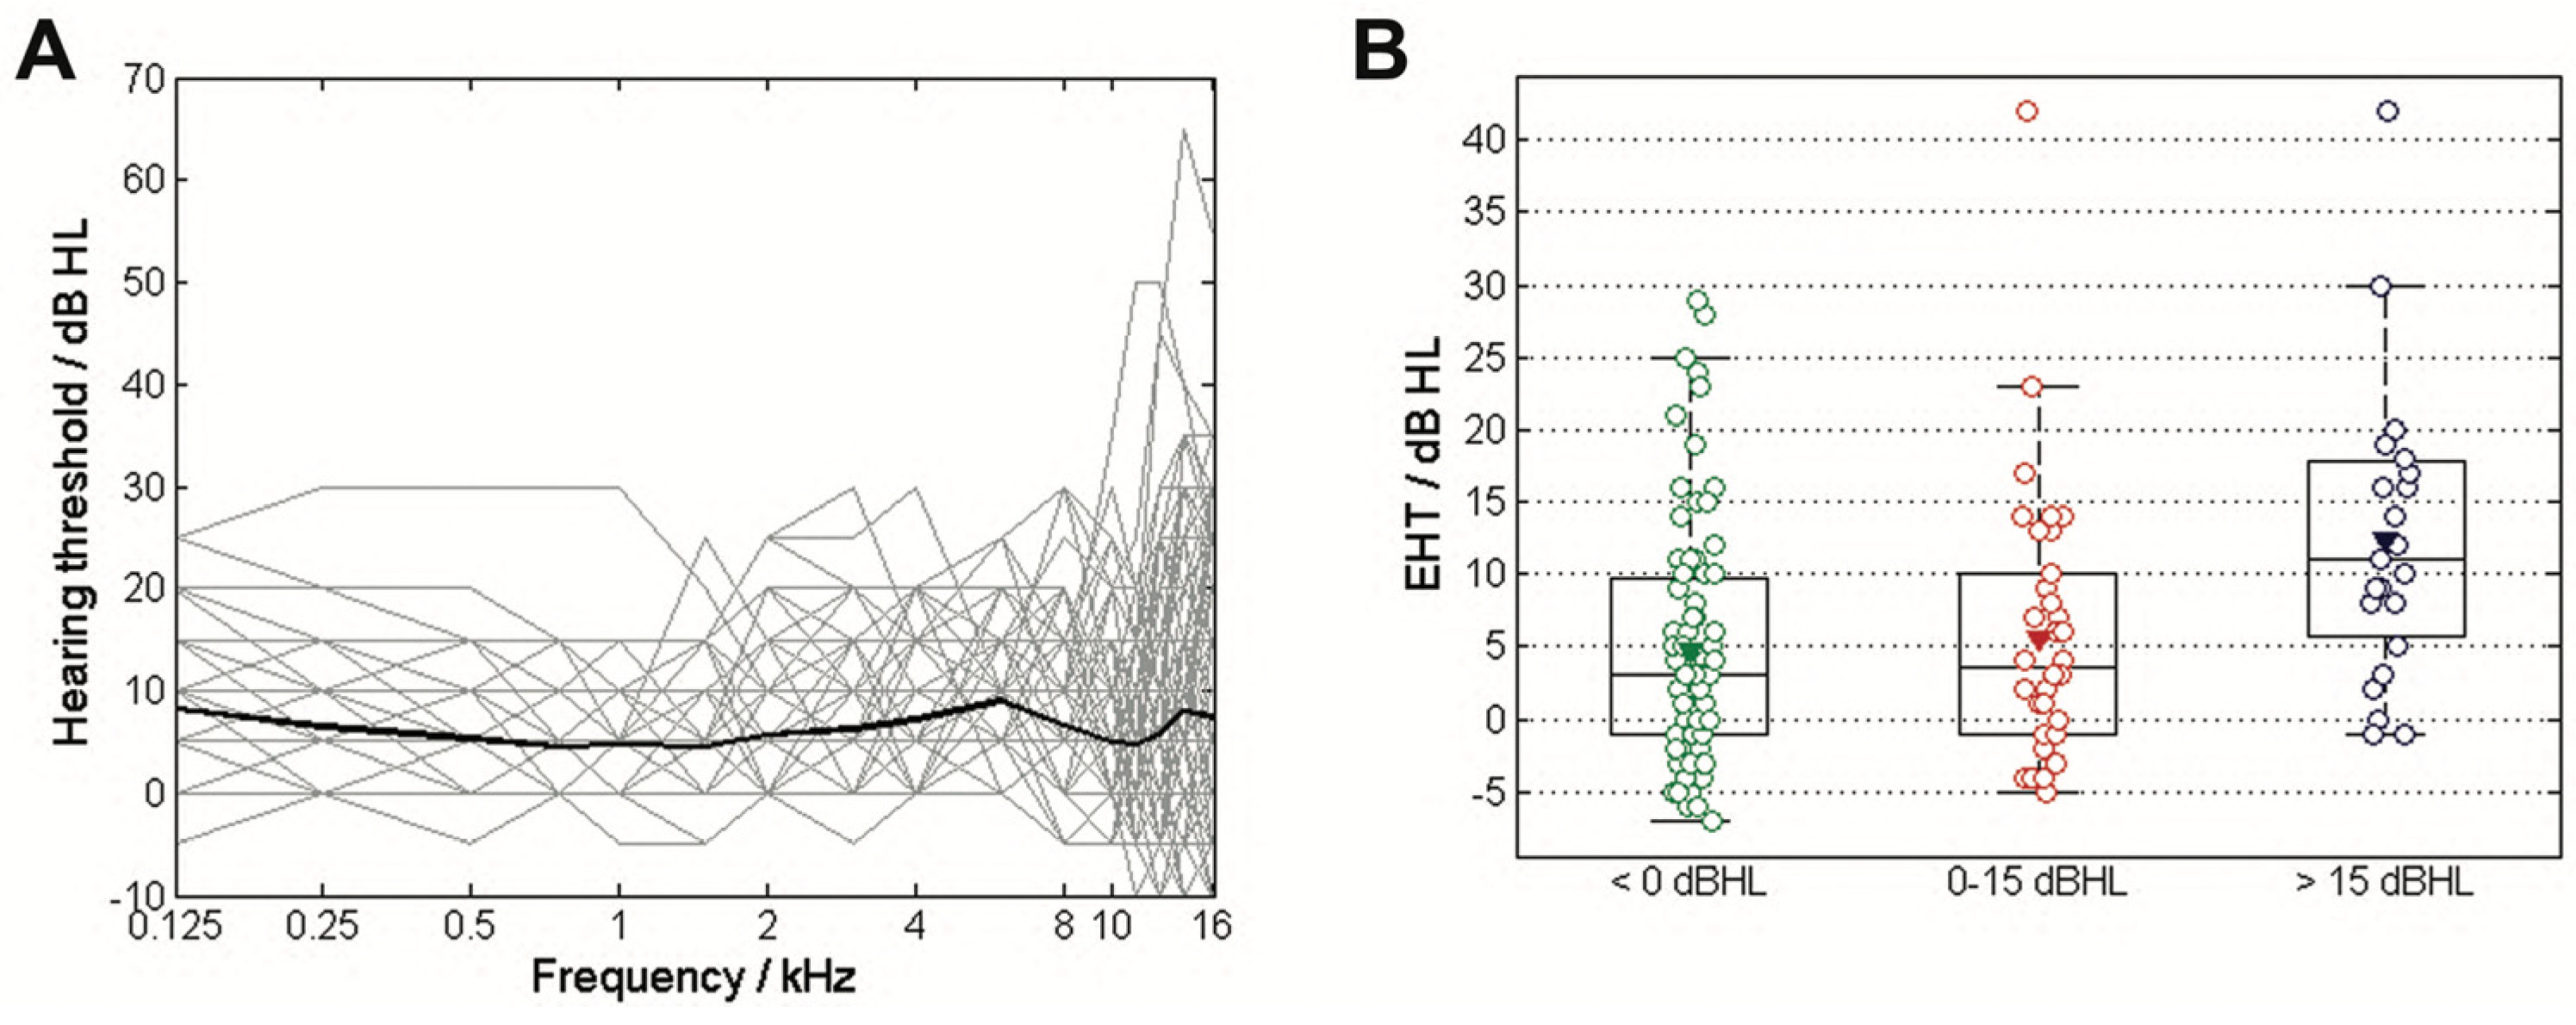
3.1. Age and EHT
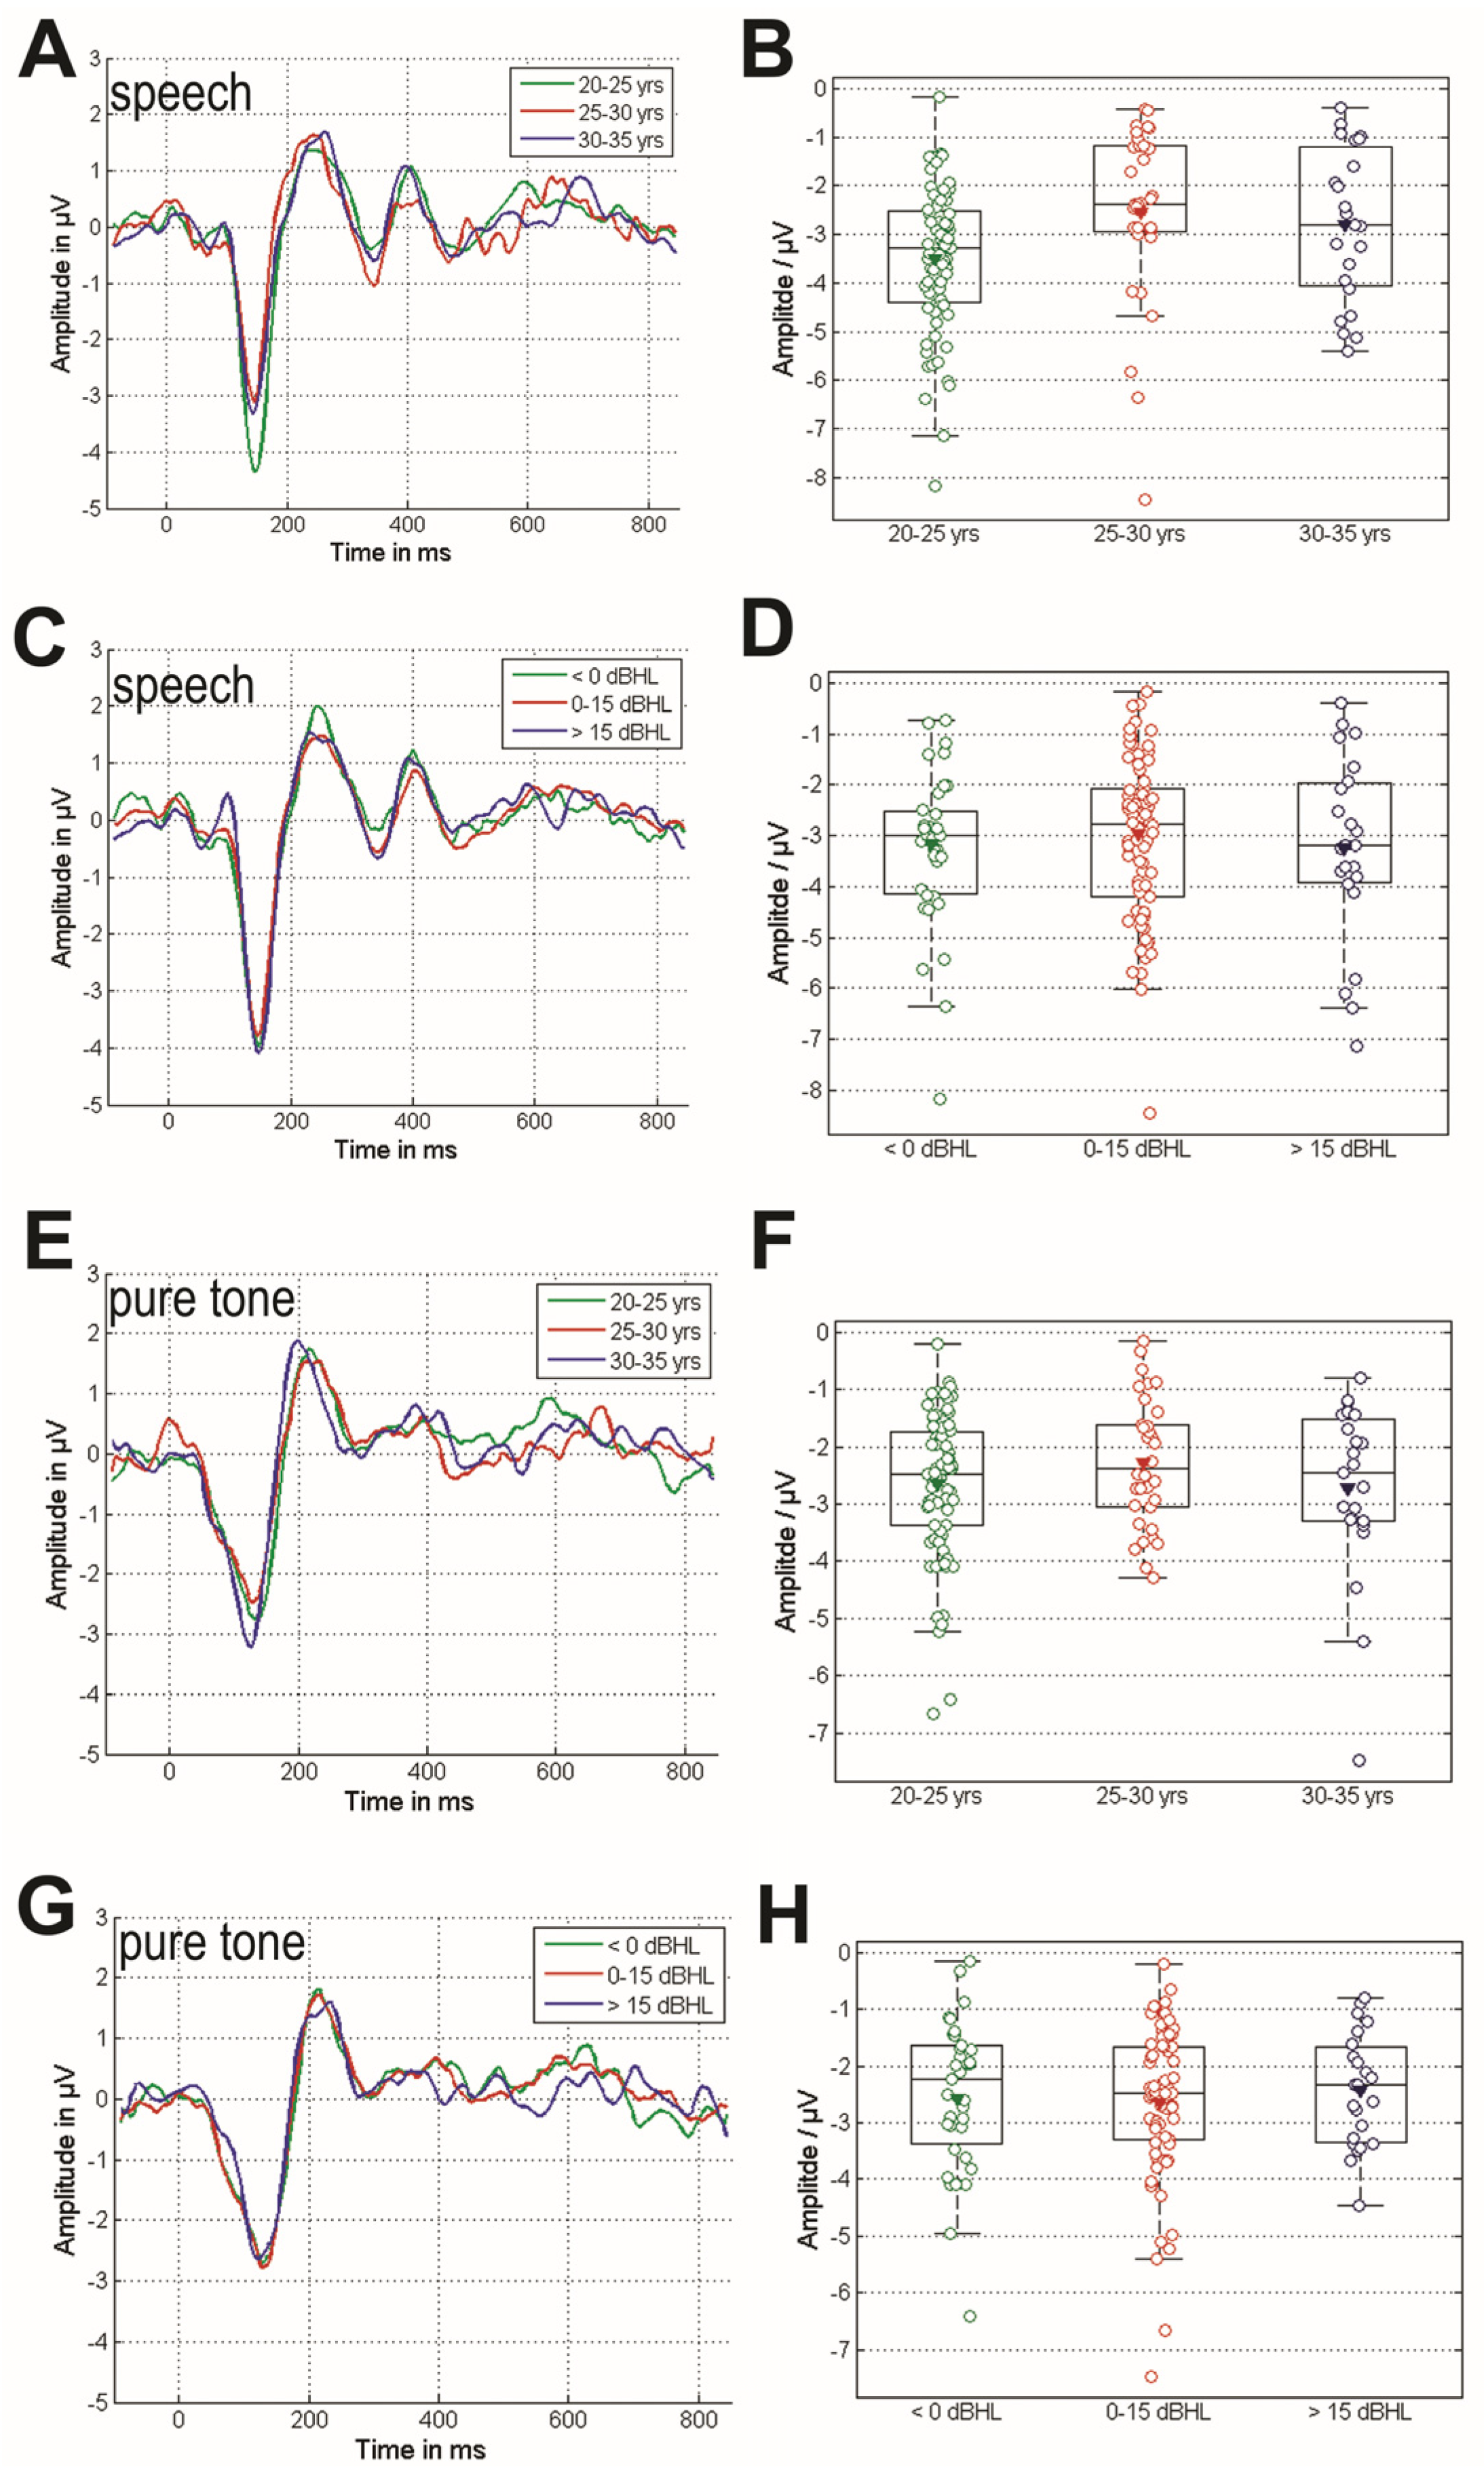
3.2. Cortical Response of the MMN Paradigms
3.3. Comparison of the MMN Responses Grouped by Age and EHT
4. Discussion
4.1. Summary of Findings of EHT and Cortical Potentials in Response to Tone and Speech Stimuli
4.2. The Relation of MMN and EHT
4.3. The Relation Between MMN and Aging
5. Limitations
6. Conclusions
Author Contributions
Funding
Institutional Review Board Statement
Informed Consent Statement
Data Availability Statement
Acknowledgments
Conflicts of Interest
Abbreviations
| ARHL | age-related hearing loss |
| EFR | envelop-following response |
| EHT | extended high-frequency threshold |
| MEMR | acoustic middle ear muscle reflex |
| MMN | mismatch negativity |
| OHC | outer hair cell |
References
- Agrawal, Y.; Platz, E.A.; Niparko, J.K. Prevalence of hearing loss and differences by demographic characteristics among US adultsdata from the national health and nutrition examination survey, 1999–2004. Arch. Intern. Med. 2008, 168, 1522–1530. [Google Scholar] [CrossRef] [PubMed]
- Yamasoba, T.; Lin, F.R.; Someya, S.; Kashio, A.; Sakamoto, T.; Kondo, K. Current concepts in age-related hearing loss: Epidemiology and mechanistic pathways. Hear. Res. 2013, 303, 30–38. [Google Scholar] [CrossRef] [PubMed]
- Addressing the Rising Prevalence of Hearing Loss; World Health Organization: Geneva, Switzerland, 2018.
- Wang, J.; Puel, J.-L. Presbycusis: An update on cochlear mechanisms and therapies. J. Clin. Med. 2020, 9, 218. [Google Scholar] [CrossRef] [PubMed]
- Basner, M.; Babisch, W.; Davis, A.; Brink, M.; Clark, C.; Janssen, S.; Stansfeld, S. Auditory and non-auditory effects of noise on health. Lancet 2014, 383, 1325–1332. [Google Scholar] [CrossRef]
- Liberman, M.C.; Kujawa, S.G. Cochlear synaptopathy in acquired sensorineural hearing loss: Manifestations and mechanisms. Hear. Res. 2017, 349, 138–147. [Google Scholar] [CrossRef]
- Long, P.; Wan, G.; Roberts, M.T.; Corfas, G. Myelin development, plasticity, and pathology in the auditory system. Dev. Neurobiol. 2018, 78, 80–92. [Google Scholar] [CrossRef]
- Mulders, W.H.; Chin, I.L.; Robertson, D. Persistent hair cell malfunction contributes to hidden hearing loss. Hear. Res. 2018, 361, 45–51. [Google Scholar] [CrossRef]
- Schaette, R.; McAlpine, D. Tinnitus with a normal audiogram: Physiological evidence for hidden hearing loss and computational model. J. Neurosci. Off. J. Soc. Nurosci. 2011, 31, 13452–13457. [Google Scholar] [CrossRef]
- Sergeyenko, Y.; Lall, K.; Liberman, M.C.; Kujawa, S.G. Age-related cochlear synaptopathy: An early-onset contributor to auditory functional decline. J. Neurosci. 2013, 33, 13686–13694. [Google Scholar] [CrossRef]
- Moser, T.; Predoehl, F.; Starr, A. Review of hair cell synapse defects in sensorineural hearing impairment. Otol. Neurotol. 2013, 34, 995–1004. [Google Scholar] [CrossRef]
- Kujawa, S.G.; Liberman, M.C. Adding insult to injury: Cochlear nerve degeneration after “temporary” noise-induced hearing loss. J. Neurosci. 2009, 29, 14077–14085. [Google Scholar] [CrossRef] [PubMed]
- Kujawa, S.G.; Liberman, M.C. Synaptopathy in the noise-exposed and aging cochlea: Primary neural degeneration in acquired sensorineural hearing loss. Hear. Res. 2015, 330 Pt B, 191–199. [Google Scholar] [CrossRef]
- Shaheen, L.A.; Valero, M.D.; Liberman, M.C. Towards a diagnosis of cochlear neuropathy with envelope following responses. J. Assoc. Res. Otolaryngol. 2015, 16, 727–745. [Google Scholar] [CrossRef] [PubMed]
- Bramhall, N.; Beach, E.F.; Epp, B.; Le Prell, C.G.; Lopez-Poveda, E.A.; Plack, C.J.; Schaette, R.; Verlust, S.; Canlon, B. The search for noise-induced cochlear synaptopathy in humans: Mission impossible? Hear. Res. 2019, 377, 88–103. [Google Scholar] [CrossRef] [PubMed]
- Liberman, M.C.; Epstein, M.J.; Cleveland, S.S.; Wang, H.; Maison, S.F. Toward a differential diagnosis of hidden hearing loss in humans. PLoS ONE 2016, 11, e0162726. [Google Scholar] [CrossRef]
- Bramhall, N.F. Use of the auditory brainstem response for assessment of cochlear synaptopathy in humans. J. Acoust. Soc. Am. 2021, 150, 4440. [Google Scholar] [CrossRef]
- Schmidt, F.H.; Dörmann, A.; Ehrt, K.; Grossmann, W.; Mlynski, R.; Zhang, L. The curvature quantification of wave I in auditory brainstem responses detects cochlear synaptopathy in human beings. Eur. Arch. Otorhnilaryngol. 2024, 281, 4735–4746. [Google Scholar] [CrossRef]
- James, J.A.; Park, J.H.; Smith, E.M.; Johnson, C.E.; Clifton, S.; Danhauer, J.L.; Barbee, C.M. Effectiveness of auditory measures for detecting hidden hearing loss and/or cochlear synaptopathy: A systematic review. Semin. Hear. 2018, 39, 172–209. [Google Scholar] [CrossRef]
- Pappa, A.K.; Hutson, K.A.; Scott, W.C.; Wilson, J.D.; Fox, K.E.; Masood, M.M.; Giardina, C.K.; Pulver, S.H.; Grana, G.D.; Askew, C.; et al. Hair cell and Neural contributions to the cochlear summating potential. J. Neurophysiol. 2019, 121, 2163–2180. [Google Scholar] [CrossRef]
- Yaşar, M.; Öner, F.; Atalay, F.; Anbar, S.S. Cochlear synaptopathy evaluation with Electrocochleography in patients with hearing difficulty in noise despite normal hearing levels. Clin. Otolaryngol. 2025, 50, 75–81. [Google Scholar] [CrossRef]
- Haggerty, R.A.; Hutson, K.A.; Riggs, W.J.; Brown, K.D.; Pillsbury, H.C.; Adunka, O.F.; Buchman, C.A.; Fitzpatrick, D.C. Assessment of cochlear synaptopathy by electrocochleography to low frequencies in a preclinical model and human subjects. Front. Neurol. 2023, 14, 1104574. [Google Scholar] [CrossRef] [PubMed]
- Maison, S.F.; Usubuchi, H.; Liberman, M.C. Efferent feedback minimizes cochlear neuropathy from moderate noise exposure. J. Neurosci. 2013, 33, 5542–5552. [Google Scholar] [CrossRef] [PubMed]
- Liberman, M.C.; Liberman, L.D.; Maison, S.F. Efferent feedback slows cochlear aging. J. Neurosci. 2014, 34, 4599–4607. [Google Scholar] [CrossRef] [PubMed]
- Chambers, A.R.; Resnik, J.; Yuan, Y.; Whitton, J.P.; Edge, A.S.; Liberman, M.C.; Polley, D.B. Central gain restores auditory processing following near-complete cochlear denervation. Neuron 2016, 89, 867–879. [Google Scholar] [CrossRef]
- Gu, J.W.; Halpin, C.F.; Nam, E.-C.; Levine, R.A.; Melcher, J.R. Tinnitus, diminished sound-level tolerance, and elevated auditory activity in humans with clinically normal hearing sensitivity. J. Neurophysiol. 2010, 104, 3361–3370. [Google Scholar] [CrossRef]
- Sun, W.; Deng, A.; Jayaram, A.; Gibson, B. Noise exposure enhances auditory cortex responses related to hyperacusis behavior. Brain Res. 2012, 1485, 108–116. [Google Scholar] [CrossRef]
- Chen, G.-D.; Radziwon, K.E.; Kashanian, N.; Manohar, S.; Salvi, R. Salicylate-induced auditory perceptual disorders and plastic changes in nonclassical auditory centers in rats. Neural. Plast. 2014, 2014, 658741. [Google Scholar] [CrossRef]
- Noreña, A.J. An integrative model of tinnitus based on a central gain controlling neural sensitivity. Neurosci. Biobehav. Rev. 2011, 35, 1089–1109. [Google Scholar] [CrossRef]
- Auerbach, B.D.; Rodrigues, P.V.; Salvi, R.J. Central gain control in tinnitus and hyperacusis. Front. Neurol. 2014, 5, 206. [Google Scholar] [CrossRef]
- Näätänen, R.; Gaillard, A.; Mäntysalo, S. Early selective-attention effect on evoked potential reinterpreted. Acta Psychol. 1978, 42, 313–329. [Google Scholar] [CrossRef]
- Näätänen, R. The mismatch negativity: A powerful tool for cognitive neuroscience. Ear Hear. 1995, 16, 6–18. [Google Scholar] [CrossRef] [PubMed]
- Näätänen, R.; Petersen, B.; Torppa, R.; Lonka, E.; Vuust, P. The MMN as a viable and objective marker of auditory development in CI users. Hear. Res. 2017, 353, 57–75. [Google Scholar] [CrossRef] [PubMed]
- Lonka, E.; Kujala, T.; Lehtokoski, A.; Johansson, R.; Rimmanen, S.; Alho, K.; Näätänen, R. Mismatch negativity brain response as an index of speech perception recovery in cochlear-implant recipients. Audiol. Neurotol. 2004, 9, 160–162. [Google Scholar] [CrossRef] [PubMed]
- British Society of Audiology. Recommended Procedure: Pure Tone Air and Bone Conduction Threshold Audiometry with and Without Masking and Determination of Uncomfortable Loudness Levels. 2004. Available online: https://www.thebsa.org.uk/ (accessed on 2 February 2025).
- Riedel, H.; Granzow, M.; Kollmeier. Single-sweep-based methods to improve the quality of auditory brain stem responses Part II: Averaging methods. Z. Audiol. 2001, 40, 62–85. [Google Scholar]
- Turgeon, C.; Lazzouni, L.; Lepore, F.; Ellemberg, D. An objective auditory measure to assess speech recognition in adult cochlear implant users. Clin. Neurophysiol. 2014, 125, 827–835. [Google Scholar] [CrossRef]
- Näätänen, R.; Picton, T. The N1 Wave of the human electric and magnetic response to sound: A review and an analysis of the component structure. Psychophysiology 1987, 24, 375–425. [Google Scholar] [CrossRef]
- Schmidt, F.H.; Mauermann, M.; Kollmeier, B. Neural representation of loudness: Cortical evoked potentials in an induced loudness reduction experiment. Trends Hear. 2020, 24, 2331216519900595. [Google Scholar] [CrossRef]
- Lanting, C.P.; Briley, P.M.; Sumner, C.J.; Krumbholz, K. Mechanisms of adaption in human auditory cortex. J. Neurophysiol. 2013, 110, 973–983. [Google Scholar] [CrossRef]
- Näätänen, R.; Paavilainen, P.; Rinne, T.; Alho, K. The mismatch negativity (MMN) in basic research of central audiotry processing: A review. Clin. Neurophyiol. 2007, 118, 2544–2590. [Google Scholar] [CrossRef]
- Tao, D.; Zhang, Y.; Liu, H.; Zhang, W.; Xu, M.; Galvin, J.J., 3rd; Zhang, D.; Liu, J. The P300 auditory event-related potential may predict segregation of competing speech by bimodal cochlear implant listeners. Front. Neurosci. 2022, 16, 8888596. [Google Scholar] [CrossRef]
- Polich, J. Updating P300: An integrative theory of P3a and P3b. Clin. Neurophysiol. 2007, 118, 2128–2148. [Google Scholar] [CrossRef] [PubMed]
- Tervaniemi, M.; Lehtokoski, A.; Sinkkonen, J.; Virtanen, J.; Ilmoniemi, R.; Näätänen, R. Test–retest reliability of mismatch negativity for duration, frequency and intensity changes. Clin. Neurophysiol. 1999, 110, 1388–1393. [Google Scholar] [CrossRef] [PubMed]
- Chen, J.; Chen, S.; Zheng, Y.; Ou, Y. The effect of aging and the high-frequency auditory threshold on speech-evoked mismatch negativity in a nosiy background. Audiol. Neurootol. 2016, 21, 1–11. [Google Scholar] [CrossRef] [PubMed]
- Chen, J.; Zhao, Y.; Zou, T.; Wen, X.; Zhou, X.; Yu, Y.; Liu, Z.; Li, M. Sensorineural hearing loss affects functional connectivity of auditory cortex, parahipocampal gyrus and inferior prefrontal gyrus in tinnitus patients. Front. Neurosci. 2022, 16, 816712. [Google Scholar] [CrossRef]
- Zeng, F.-G.; Richardson, M.; Turner, K. Tinnitus does not interfere with auditory and speech perception. J. Neurosci. 2020, 40, 6007–6017. [Google Scholar] [CrossRef]
- Berthommier, F.; Girin, L.; Boe, L.J. A simple hybrid acoustic/morphologically constrained technique for the synthesis of stop consonants in various vocalic contexts. In Proceedings of the Interspeech 2012—13th Annual Conference of the International Speech Communication Association, Portland, OR, USA, 9–13 September 2012; p. Thu.P10a.05. hal-00807519. [Google Scholar]
- Pekkonen, E.; Jousmäki, V.; Partanen, J.; Karhu, J. Mismatch negativity area and age-related auditory memory. Electroencephalogr. Clin. Neurophysiol. 1993, 87, 321–325. [Google Scholar] [CrossRef]
- Pekkonen, E.; Rinne, T.; Reinikainen, K.; Kujala, T.; Alho, K.; Naatanen, R. Aging effects on auditory processing: An event-related potential study. Exp. Aging Res. 1996, 22, 171–184. [Google Scholar] [CrossRef]
- Cooper, R.J.; Todd, J.; McGill, K.; Michie, P.T. Auditory sensory memory and the aging brain: A mismatch negativity study. Neurobiol. Aging 2006, 27, 752–762. [Google Scholar] [CrossRef]
- Kisley, M.A.; Davalos, D.B.; Engleman, L.L.; Guinther, P.M.; Davis, H.P. Age-related change in neural processing of time-dependent stimulus features. Cogn. Brain Res. 2005, 25, 913–925. [Google Scholar] [CrossRef]
- Ruzzoli, M.; Pirulli, C.; Brignani, D.; Maioli, C.; Miniussi, C. Sensory memory during physiological aging indexed by mismatch negativity (MMN). Neurobiol. Aging 2012, 33, 625.e21–625.e30. [Google Scholar] [CrossRef]
- Näätänen, R.; Kujala, T.; Escera, C.; Baldeweg, T.; Kreegipuu, K.; Carlson, S.; Ponton, C. The mismatch negativity (MMN)—A unique window to disturbed central auditory processing in aging and different clinical conditions. Clin. Neurophysiol. 2012, 123, 424–458. [Google Scholar] [CrossRef] [PubMed]
- Maddox, J. Cocktail party effect made tolerable. Nature 1994, 369, 517. [Google Scholar] [CrossRef] [PubMed]
- Starr, A.; Sininger, Y.; Pratt, H. The varieties of auditory neuropathy. J. Basic Clin. Physiol. Pharmacol. 2000, 11, 215–230. [Google Scholar] [CrossRef] [PubMed]


| Group | 20–25 Years | 25–30 Years | 30–35 Years | Total | |
|---|---|---|---|---|---|
| Number of subjects | 40 | 19 | 12 | 71 | |
| Number of ears | 75 | 34 | 23 | 132 | |
| Sex | M | 43 | 16 | 11 | 72 |
| F | 32 | 18 | 12 | 62 | |
| EHT in dB HL | 4.8 ± 8.4 | 5.6 ± 9.6 | 12.4 ± 10.1 | 6.5 ± 9.4 |
| Categorical Group | Metric | χ²Amplitude | PAmplitude | χ²Latency | PLatency |
|---|---|---|---|---|---|
| Age | MMNTone | 1.29 | 0.53 | 4.64 | 0.10 |
| MMNSpeech | 13.0 | 0.002 | 1.87 | 0.39 | |
| P300Speech | 4.24 | 0.12 | 0.19 | 0.91 | |
| EHT | MMNTone | 0.12 | 0.94 | 0.94 | 0.62 |
| MMNSpeech | 0.69 | 0.71 | 2.86 | 0.24 | |
| P300Speech | 0.21 | 0.90 | 0.96 | 0.62 |
Disclaimer/Publisher’s Note: The statements, opinions and data contained in all publications are solely those of the individual author(s) and contributor(s) and not of MDPI and/or the editor(s). MDPI and/or the editor(s) disclaim responsibility for any injury to people or property resulting from any ideas, methods, instructions or products referred to in the content. |
© 2025 by the authors. Licensee MDPI, Basel, Switzerland. This article is an open access article distributed under the terms and conditions of the Creative Commons Attribution (CC BY) license (https://creativecommons.org/licenses/by/4.0/).
Share and Cite
Zhang, L.; Mißler, D.; Ehrt, K.; Großmann, W.; Mlynski, R.; Schmidt, F.H. Can Mismatch Negativity Be Used as an Indicator to Predict Central Auditory Deficits in Individuals with Normal Hearing? Audiol. Res. 2025, 15, 43. https://doi.org/10.3390/audiolres15020043
Zhang L, Mißler D, Ehrt K, Großmann W, Mlynski R, Schmidt FH. Can Mismatch Negativity Be Used as an Indicator to Predict Central Auditory Deficits in Individuals with Normal Hearing? Audiology Research. 2025; 15(2):43. https://doi.org/10.3390/audiolres15020043
Chicago/Turabian StyleZhang, Lichun, David Mißler, Karsten Ehrt, Wilma Großmann, Robert Mlynski, and Florian Herrmann Schmidt. 2025. "Can Mismatch Negativity Be Used as an Indicator to Predict Central Auditory Deficits in Individuals with Normal Hearing?" Audiology Research 15, no. 2: 43. https://doi.org/10.3390/audiolres15020043
APA StyleZhang, L., Mißler, D., Ehrt, K., Großmann, W., Mlynski, R., & Schmidt, F. H. (2025). Can Mismatch Negativity Be Used as an Indicator to Predict Central Auditory Deficits in Individuals with Normal Hearing? Audiology Research, 15(2), 43. https://doi.org/10.3390/audiolres15020043