Prostate Magnetic Resonance Imaging Analyses, Clinical Parameters, and Preoperative Nomograms in the Prediction of Extraprostatic Extension


Abstract
:1. Introduction
2. Material and Methods
2.1. Imaging
2.2. Prostate Biopsy Technique
2.3. Surgical Technique
2.4. Histopathology
2.5. Statistical Analyses
3. Results
4. Discussion
5. Conclusions
Author Contributions
Funding
Institutional Review Board Statement
Informed Consent Statement
Data Availability Statement
Conflicts of Interest
References
- Tewari, A.; Divine, G.; Chang, P.; Shemtov, M.M.; Milowsky, M.; Nanus, D.; Menon, M. Long-Term Survival in Men with High Grade Prostate Cancer: A Comparison Between Conservative Treatment, Radiation Therapy and Radical Prostatectomy—A Propensity Scoring Approach. J. Urol. 2007, 177, 911–915. [Google Scholar] [CrossRef] [PubMed]
- Hamdy, F.C.; Donovan, J.L.; Lane, J.A.; Mason, M.; Metcalfe, C.; Holding, P.; Davis, M.; Peters, T.; Turner, E.; Martin, R.; et al. 10-Year Outcomes after Monitoring, Surgery, or Radiotherapy for Localized Prostate Cancer. N. Engl. J. Med. 2016, 375, 1415–1424. [Google Scholar] [CrossRef] [PubMed] [Green Version]
- Walsh, P.C.; Donker, P.J. Impotence Following Radical Prostatectomy: Insight into Etiology and Prevention. J. Urol. 2016, 197, S165–S170. [Google Scholar] [CrossRef]
- Nandipati, K.C.; Raina, R.; Agarwal, A.; Zippe, C.D. Nerve-Sparing Surgery Significantly Affects Long-Term Continence after Radical Prostatectomy. Urology 2007, 70, 1127–1130. [Google Scholar] [CrossRef]
- Martini, A.; Gupta, A.; Lewis, S.C.; Cumarasamy, S.; Haines, K.G.; Briganti, A.; Montorsi, F.; Tewari, A.K. Development and internal validation of a side-specific, multiparametric magnetic resonance imaging-based nomogram for the prediction of extracapsular extension of prostate cancer. BJU Int. 2018, 122, 1025–1033. [Google Scholar] [CrossRef] [PubMed]
- Suardi, N.; Ficarra, V.; Willemsen, P.; De Wil, P.; Gallina, A.; De Naeyer, G.; Schatteman, P.; Montorsi, F.; Carpentier, P.; Mottrie, A. Long-term Biochemical Recurrence Rates after Robot-assisted Radical Prostatectomy: Analysis of a Single-center Series of Patients with a Minimum Follow-up of 5 Years. Urology 2012, 79, 133–138. [Google Scholar] [CrossRef]
- Bianchi, L.; Schiavina, R.; Borghesi, M.; Casablanca, C.; Chessa, F.; Bianchi, F.M.; Pultrone, C.; Vagnoni, V.; Ercolino, A.; Dababneh, H.; et al. Patterns of positive surgical margins after open radical prostatectomy and their association with clinical recurrence. Minerva Urol. Nefrol. 2019, 72, 464–473. [Google Scholar] [CrossRef]
- Smith, J.A., Jr.; Scardino, P.T.; Resnick, M.I.; Hernandez, A.D.; Rose, S.C.; Egger, M.J. Transrectal ultrasound versus digital rectal exam-ination for the staging of carcinoma of the prostate: Results of a prospective, multi-institutional trial. J. Urol. 1997, 157, 902–906. [Google Scholar] [CrossRef]
- Feng, T.S.; Afshar, A.R.S.; Wu, J.; Li, Q.; Luthringer, D.; Saouaf, R.; Kim, H.L. Multiparametric MRI Improves Accuracy of Clinical Nomograms for Predicting Extracapsular Extension of Prostate Cancer. Urology 2015, 86, 332–337. [Google Scholar] [CrossRef]
- de Rooij, M.; Hamoen, E.H.; Witjes, J.A.; Barentsz, J.O.; Rovers, M. Accuracy of Magnetic Resonance Imaging for Local Staging of Prostate Cancer: A Diagnostic Meta-analysis. Eur. Urol. 2016, 70, 233–245. [Google Scholar] [CrossRef]
- Ohori, M.; Kattan, M.; Koh, H.; Maru, N.; Slawin, K.M.; Shariat, S.; Muramoto, M.; Reuter, V.E.; Wheeler, T.M.; Scardino, P.T. Predicting the Presence and Side of Extracapsular Extension: A Nomogram for Staging Prostate Cancer. J. Urol. 2004, 171, 1844–1849. [Google Scholar] [CrossRef] [PubMed]
- Eifler, J.B.; Feng, Z.; Lin, B.M.; Partin, M.T.; Humphreys, E.B.; Han, M.; Epstein, J.I.; Walsh, P.C.; Trock, B.J.; Partin, A.W. An updated prostate cancer staging nomogram (Partin tables) based on cases from 2006 to 2011. BJU Int. 2013, 111, 22–29. [Google Scholar] [CrossRef] [PubMed]
- Rayn, K.N.; Bloom, J.B.; Gold, S.A.; Hale, G.R.; Baiocco, J.A.; Mehralivand, S.; Czarniecki, M.; Sabarwal, V.K.; Valera, V.; Wood, B.J.; et al. Added Value of Multiparametric Magnetic Resonance Imaging to Clinical Nomograms for Predicting Adverse Pathology in Prostate Cancer. J. Urol. 2018, 200, 1041–1047. [Google Scholar] [CrossRef]
- Nyarangi-Dix, J.; Wiesenfarth, M.; Bonekamp, D.; Hitthaler, B.; Schütz, V.; Dieffenbacher, S.; Mueller-Wolf, M.; Roth, W.; Stenzinger, A.; Duensing, S.; et al. Combined Clinical Parameters and Multiparametric Magnetic Resonance Imaging for the Prediction of Extraprostatic Disease—A Risk Model for Patient-tailored Risk Stratification When Planning Radical Prostatectomy. Eur. Urol. Focus 2020, 6, 1205–1212. [Google Scholar] [CrossRef]
- Gandaglia, G.; Ploussard, G.; Valerio, M.; Mattei, A.; Fiori, C.; Roumiguié, M.; Fossati, N.; Stabile, A.; Beauval, J.-B.; Malavaud, B.; et al. The Key Combined Value of Multiparametric Magnetic Resonance Imaging, and Magnetic Resonance Imaging–targeted and Concomitant Systematic Biopsies for the Prediction of Adverse Pathological Features in Prostate Cancer Patients Undergoing Radical Prostatectomy. Eur. Urol. 2020, 77, 733–741. [Google Scholar] [CrossRef] [PubMed]
- Dell’Oglio, P.; Stabile, A.; Soligo, M.; Brembilla, G.; Esposito, A.; Gandaglia, G.; Fossati, N.; Bravi, C.A.; Dehò, F.; De Cobelli, F.; et al. There Is No Way to Avoid Systematic Prostate Biopsies in Addition to Multiparametric Magnetic Resonance Imaging Targeted Biopsies. Eur. Urol. Oncol. 2020, 3, 112–118. [Google Scholar] [CrossRef]
- Weinreb, J.C.; Barentsz, J.O.; Choyke, P.L.; Cornud, F.; Haider, M.A.; Macura, K.J.; A Margolis, D.J.; Schnall, M.D.; Shtern, F.; Tempany, C.M.; et al. PI-RADS Prostate Imaging—Reporting and Data System: 2015, Version 2. Eur. Urol. 2016, 69, 16–40. [Google Scholar] [CrossRef]
- Eichler, K.; Hempel, S.; Wilby, J.; Myers, L.; Bachmann, L.M.; Kleijnen, J. Diagnostic Value of Systematic Biopsy Methods in the Investigation of Prostate Cancer: A Systematic Review. J. Urol. 2006, 175, 1605–1612. [Google Scholar] [CrossRef]
- Shariat, S.F.; Roehrborn, C.G. Using biopsy to detect prostate cancer. Rev. Urol. 2008, 10, 262–280. [Google Scholar]
- Kenigsberg, A.P.; Renson, A.; Rosenkrantz, A.B.; Huang, R.; Wysock, J.S.; Taneja, S.; Bjurlin, M.A. Optimizing the Number of Cores Targeted During Prostate Magnetic Resonance Imaging Fusion Target Biopsy. Eur. Urol. Oncol. 2018, 1, 418–425. [Google Scholar] [CrossRef] [PubMed]
- Zhang, M.; Milot, L.; Khalvati, F.; Sugar, L.; Downes, M.; Baig, S.M.; Klotz, L.; Haider, M.A. Value of Increasing Biopsy Cores per Target with Cognitive MRI-targeted Transrectal US Prostate Biopsy. Radiology 2019, 291, 83–89. [Google Scholar] [CrossRef]
- Mottet, N.; van den Bergh, R.C.; Briers, E.; van den Broeck, T.; Cumberbatch, M.G.; De Santis, M.; Fanti, S.; Fossati, N.; Gandaglia, G.; Gillessen, S.; et al. EAU-EANM-ESTRO-ESUR-SIOG Guidelines on Prostate Cancer—2020 Update. Part 1: Screening, Diagnosis, and Local Treatment with Curative Intent. Eur. Urol. 2020, 79, 243–262. [Google Scholar] [CrossRef] [PubMed]
- Walz, J.; Burnett, A.L.; Costello, A.J.; Eastham, J.A.; Graefen, M.; Guillonneau, B.; Menon, M.; Montorsi, F.; Myers, R.P.; Rocco, B.M.C.; et al. A Critical Analysis of the Current Knowledge of Surgical Anatomy Related to Optimization of Cancer Control and Preservation of Continence and Erection in Candidates for Radical Prostatectomy. Eur. Urol. 2010, 57, 179–192. [Google Scholar] [CrossRef]
- Walz, J.; Epstein, J.I.; Ganzer, R.; Graefen, M.; Guazzoni, G.; Kaouk, J.; Menon, M.; Mottrie, A.; Myers, R.P.; Patel, V.; et al. A Critical Analysis of the Current Knowledge of Surgical Anatomy of the Prostate Related to Optimisation of Cancer Control and Preservation of Continence and Erection in Candidates for Radical Prostatectomy: An Update. Eur. Urol. 2016, 70, 301–311. [Google Scholar] [CrossRef] [PubMed]
- Gandaglia, G.; Fossati, N.; Zaffuto, E.; Bandini, M.; Dell’Oglio, P.; Bravi, C.A.; Fallara, G.; Pellegrino, F.; Nocera, L.; Karakiewicz, P.I.; et al. Development and Internal Validation of a Novel Model to Identify the Candidates for Extended Pelvic Lymph Node Dissection in Prostate Cancer. Eur. Urol. 2017, 72, 632–640. [Google Scholar] [CrossRef]
- Epstein, J.I.; Egevad, L.; Amin, M.B.; Delahunt, B.; Srigley, J.R.; Humphrey, P.A. The 2014 International Society of Urological Pathology (ISUP) Consensus Conference on Gleason Grading of Prostatic Carcinoma: Definition of Grading Patterns and Proposal for a New Grading System. Am. J. Surg. Pathol. 2016, 40, 244–252. [Google Scholar] [CrossRef]
- Cheng, L.; Darson, M.F.; Bergstralh, E.J. Correlation of margin status and extraprostatic extension with progression of pros-tate carcinoma. Cancer 1999, 86, 1775–1782. [Google Scholar] [CrossRef]
- Johnson, M.T.; Ramsey, M.L.; Ebel, J.J.; Abaza, R.; Zynger, D.L. Do robotic prostatectomy positive surgical margins occur in the same location as extraprostatic extension? World J. Urol. 2013, 32, 761–767. [Google Scholar] [CrossRef]
- Soeterik, T.F.W.; E Van Melick, H.H.; Dijksman, L.M.; Stomps, S.; Witjes, J.A.; Van Basten, J.P.A. Nerve Sparing during Robot-Assisted Radical Prostatectomy Increases the Risk of Ipsilateral Positive Surgical Margins. J. Urol. 2020, 204, 91–95. [Google Scholar] [CrossRef]
- Bukavina, L.; Mishra, K.; Mahran, A.; Fernstrum, A.; Ray, A.; Markt, S.; Schumacher, F.; Conroy, B.; Abouassaly, R.; MacLennan, G.; et al. “Robotic fatigue?”—The impact of case order on positive surgical margins in robotic-assisted laparoscopic prostatectomy. Urol. Oncol. Semin. Orig. Investig. 2021, 39, 365.e17–365.e23. [Google Scholar] [CrossRef]
- Martini, A.; Gandaglia, G.; Fossati, N.; Scuderi, S.; Bravi, C.A.; Mazzone, E.; Stabile, A.; Scarcella, S.; Robesti, D.; Barletta, F.; et al. Defining Clinically Meaningful Positive Surgical Margins in Patients Undergoing Radical Prostatectomy for Localised Prostate Cancer. Eur. Urol. Oncol. 2021, 4, 42–48. [Google Scholar] [CrossRef] [PubMed] [Green Version]
- Panebianco, V.; Salciccia, S.; Cattarino, S.; Minisola, F.; Gentilucci, A.; Alfarone, A.; Ricciuti, G.P.; Marcantonio, A.; Lisi, D.; Gentile, V.; et al. Use of Multiparametric MR with Neurovascular Bundle Evaluation to Optimize the Oncological and Functional Management of Patients Considered for Nerve-Sparing Radical Prostatectomy. J. Sex. Med. 2012, 9, 2157–2166. [Google Scholar] [CrossRef]
- Kozikowski, M.; Malewski, W.; Michalak, W.; Dobruch, J. Clinical utility of MRI in the decision-making process before radical prostatectomy: Systematic review and meta-analysis. PLoS ONE 2019, 14, e0210194. [Google Scholar] [CrossRef] [Green Version]
- Schiavina, R.; Bianchi, L.; Borghesi, M.; Dababneh, H.; Chessa, F.; Pultrone, C.V.; Angiolini, A.; Gaudiano, C.; Porreca, A.; Fiorentino, M.; et al. MRI Displays the Prostatic Cancer Anatomy and Improves the Bundles Management Before Robot-Assisted Radical Prostatectomy. J. Endourol. 2018, 32, 315–321. [Google Scholar] [CrossRef]
- Rud, E.; Baco, E.; Klotz, D.; Rennesund, K.; Svindland, A.; Berge, V.; Lundeby, E.; Wessel, N.; Hoff, J.-R.; Berg, R.E.; et al. Does Preoperative Magnetic Resonance Imaging Reduce the Rate of Positive Surgical Margins at Radical Prostatectomy in a Randomised Clinical Trial? Eur. Urol. 2015, 68, 487–496. [Google Scholar] [CrossRef] [Green Version]
- Lee, T.; Hoogenes, J.; Wright, I.; Matsumoto, E.D.; Shayegan, B. Utility of preoperative 3 Tesla pelvic phased-array multiparametric magnetic resonance imaging in prediction of extracapsular extension and seminal vesicle invasion of prostate cancer and its impact on surgical margin status: Experience at a Canadian academic tertiary care centre. Can. Urol. Assoc. J. 2017, 11, E174–E178. [Google Scholar] [CrossRef] [Green Version]
- Wibmer, A.; Kattan, M.; Alessandrino, F.; Baur, A.; Boesen, L.; Franco, F.; Bonekamp, D.; Campa, R.; Cash, H.; Catalá, V.; et al. International Multi-Site Initiative to Develop an MRI-Inclusive Nomogram for Side-Specific Prediction of Extraprostatic Extension of Prostate Cancer. Cancers 2021, 13, 2627. [Google Scholar] [CrossRef]
- Morlacco, A.; Sharma, V.; Viers, B.; Rangel, L.J.; Carlson, R.E.; Froemming, A.T.; Karnes, R.J. The Incremental Role of Magnetic Resonance Imaging for Prostate Cancer Staging before Radical Prostatectomy. Eur. Urol. 2017, 71, 701–704. [Google Scholar] [CrossRef] [PubMed]
- Soeterik, T.F.; Van Melick, H.H.; Dijksman, L.M.; Küsters-Vandevelde, H.V.; Biesma, D.H.; Witjes, J.; Van Basten, J.-P.A. External validation of the Martini nomogram for prediction of side-specific extraprostatic extension of prostate cancer in patients undergoing robot-assisted radical prostatectomy. Urol. Oncol. Semin. Orig. Investig. 2020, 38, 372–378. [Google Scholar] [CrossRef] [PubMed]


| Total n = 61 | Overall, n = 61 (% or IQR) |
|---|---|
| Age (years) | 66 (61.75–69.25) |
| PSA (ng/mL) | 6.99 (5.32–11.0) |
| PSAd (ng/mL/mL) | 0.20 (0.15–0.28) |
| Prostate volume (mL) | 34.0 (29.50–47.20) |
| DRE | |
| Abnormal | 39 (63.9) |
| Normal | 22 (36.1) |
| Bx ISUP Grade | |
| 1 | 35 (57.4) |
| ≥2 | 26 (42.6) |
| mpMRI EPE | |
| Absent | 46 (75.4) |
| Present | 15 (24.6) |
| PIRADS | |
| 5 | 16 (26.2) |
| ≤4 | 45 (73.8) |
| Localization in MRI | |
| PZ | 46 (75.4) |
| Non-PZ | 15 (24.6) |
| Max diameter of IL in MRI (mm) | 13 (9.0–17.0) |
| RP ISUP Grade | |
| 1 | 25 (41.0) |
| ≥2 | 36 (59.0) |
| EAU Risk Group | |
| Low | 19 (31.1) |
| Intermediate | 38 (62.3) |
| High | 4 (6.6) |
| pT stage | |
| 2a | 9 (14.7) |
| 2b | 1 (1.6) |
| 2c | 32 (52.5) |
| 3a | 14 (23.0) |
| 3b | 5 (8.2) |
| pN stage | |
| N0 | 59 (96.7) |
| N1 | 2 (3.3) |
| SM | |
| Positive | 18 (29.5) |
| Negative | 43 (70.5) |
| Positive in pT2 | 8 (47.4) |
| Positive in pT3 | 10 (52.6) |
| NVBs | |
| Yes | 21 (34.4) |
| No | 40 (65.6) |
| Total n = 122 (%, IQR) | pEPE (+) n = 27 (22.1) | p EPE (−) n= 95 (77.9) | p-Value |
|---|---|---|---|
| mpMRI EPE | <0.001 | ||
| Present | 9 (33.3) | 6 (6.3) | |
| Absent | 18 (66.7) | 89 (93.7) | |
| PIRADS | 0.02 | ||
| 1–2 | 3 (11.1) | 10 (10.5) | |
| 3 | 3 (11.1) | 16 (16.8) | |
| 4 | 3 (11.1) | 24 (25.3) | |
| 5 | 10 (37.1) | 9 (9.5) | |
| No lesion | 8 (29.6) | 36 (37.9) | |
| PIRADS | 0.001 | ||
| ≤4 | 17 (63.0) | 86 (90.5) | |
| 5 | 10 (37.0) | 9 (9.5) | |
| Max lesion diameter in mpMRI | 0.005 | ||
| <15 mm | 16 (59.3) | 80 (84.2) | |
| ≥15 mm | 11 (40.7) | 15 (15.8) | |
| Bx ISUP Grade | 0.002 | ||
| <1 | 13 (48.1) | 75 (78.9) | |
| ≥2 | 14 (51.9) | 20 (21.1) | |
| % of PCa in bx cores | 0.017 | ||
| <50 | 13 (48.1) | 69 (72.6) | |
| ≥50 | 14 (51.9) | 26 (27.4) | |
| PSA ng/mL | 0.03 | ||
| <20 | 24 (88.9) | 94 (98.9) | |
| ≥20 | 3 (11.1) | 1 (1.1) |
| UVA OR (95% CI) | p-Value | MVA OR (95% CI) | p-Value | |
|---|---|---|---|---|
| PSA | 11.75 (1.17–118.04) | 0.04 | 12.06 (1.1–132.15) | 0.04 |
| <20 ng/mL–ref. | ||||
| ≥20 ng/mL | ||||
| mpMRI EPE | 7.42 (2.35–23.43) | <0.001 | 7.49 (2.31–24.27) | <0.001 |
| Present | ||||
| Absent–ref. | ||||
| Diameter of lesion | 3.67 (1.42–9.43) | <0.001 | NS | |
| <15 mm–ref. | ||||
| ≥15 mm | ||||
| % of PCa in bx core | 2.86 (1.19–6.89) | 0.02 | NS | |
| <50–ref. | ||||
| ≥50 | ||||
| Bx ISUP Grade | 4.04 (1.64–9.95) | 0.002 | NS | |
| 1–ref. | ||||
| ≥2 | ||||
| AUC of | - | - | 0.67 (0.57–0.77) | 0.008 |
| multivariable | ||||
| model (95% CI) |
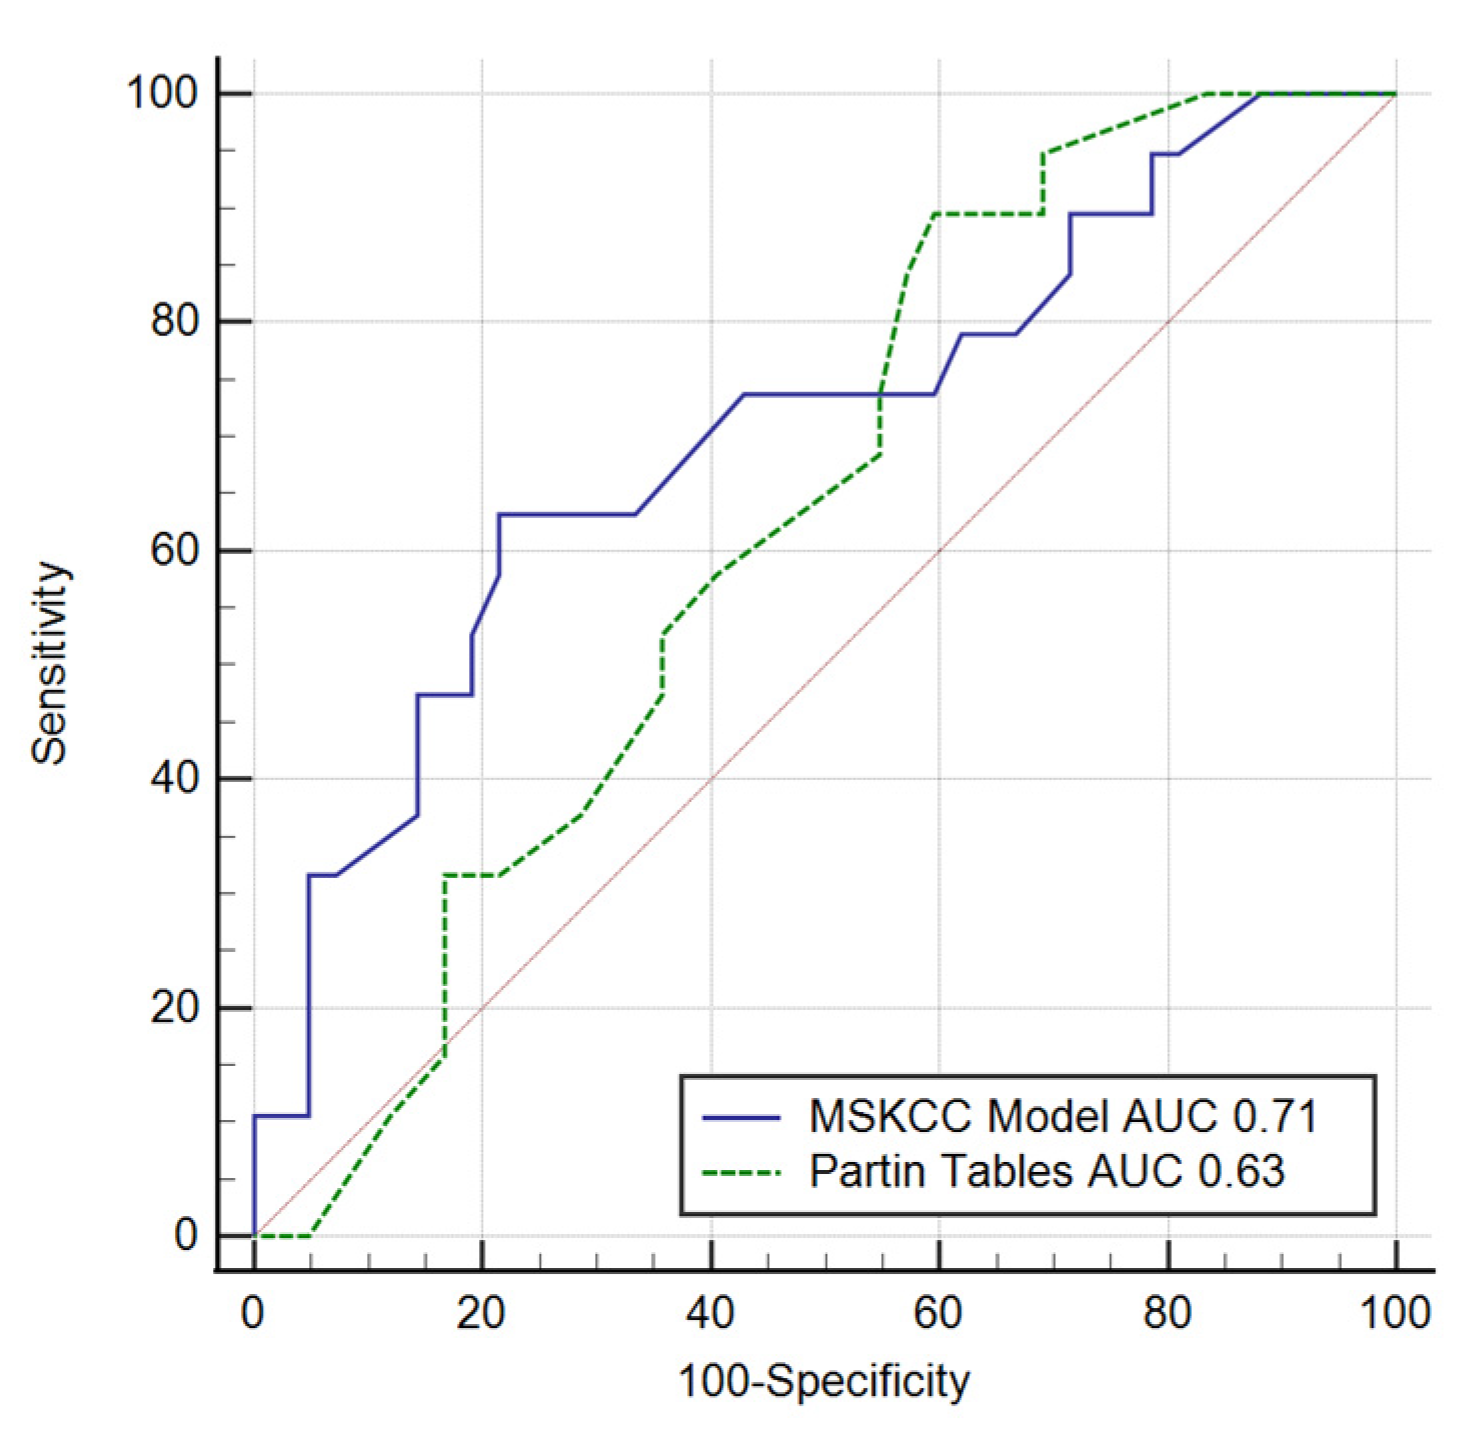
| EPE/pT3 | AUC (95% CI) | Sensitivity | Specificity | PPV | NPV | p-Value |
|---|---|---|---|---|---|---|
| MSKCC | 0.71 (0.57–0.81) | 63.2 | 78.6 | 57.1 | 82.5 | 0.007 |
| Partin Tables | 0.63 (0.49–0.75) | 89.5 | 40.5 | 40 | 89.5 | 0.074 |
| Martini et al. | 0.73 (0.64–0.80) | 66.7 | 77.9 | 44.2 | 89.2 | 0.001 |
| mpMRI | 0.63 (0.54 –0.72) | 33.3 | 93.7 | 60 | 83.2 | 0.005 |
Publisher’s Note: MDPI stays neutral with regard to jurisdictional claims in published maps and institutional affiliations. |
© 2021 by the authors. Licensee MDPI, Basel, Switzerland. This article is an open access article distributed under the terms and conditions of the Creative Commons Attribution (CC BY) license (https://creativecommons.org/licenses/by/4.0/).
Share and Cite
Majchrzak, N.; Cieśliński, P.; Głyda, M.; Karmelita-Katulska, K. Prostate Magnetic Resonance Imaging Analyses, Clinical Parameters, and Preoperative Nomograms in the Prediction of Extraprostatic Extension. Clin. Pract. 2021, 11, 763-774. https://doi.org/10.3390/clinpract11040091
Majchrzak N, Cieśliński P, Głyda M, Karmelita-Katulska K. Prostate Magnetic Resonance Imaging Analyses, Clinical Parameters, and Preoperative Nomograms in the Prediction of Extraprostatic Extension. Clinics and Practice. 2021; 11(4):763-774. https://doi.org/10.3390/clinpract11040091
Chicago/Turabian StyleMajchrzak, Natalia, Piotr Cieśliński, Maciej Głyda, and Katarzyna Karmelita-Katulska. 2021. "Prostate Magnetic Resonance Imaging Analyses, Clinical Parameters, and Preoperative Nomograms in the Prediction of Extraprostatic Extension" Clinics and Practice 11, no. 4: 763-774. https://doi.org/10.3390/clinpract11040091