Remote Sens. 2021, 13(2), 277; https://doi.org/10.3390/rs13020277 - 14 Jan 2021
Cited by 31 | Viewed by 4770
Abstract
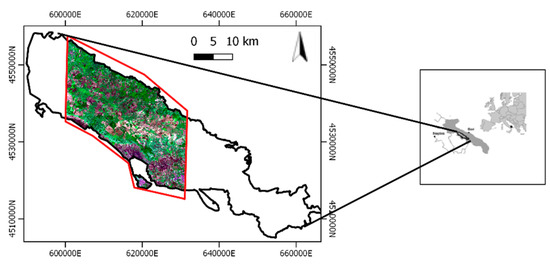
The present study aims to discriminate four semi-arid grassland habitats in a Mediterranean Natura 2000 site, Southern Italy, involving 6210/E1.263, 62A0/E1.55, 6220/E1.434 and X/E1.61-E1.C2-E1.C4 (according to Annex I of the European Habitat Directive/EUropean Nature Information System (EUNIS) taxonomies). For this purpose, an intra-annual
[...] Read more.
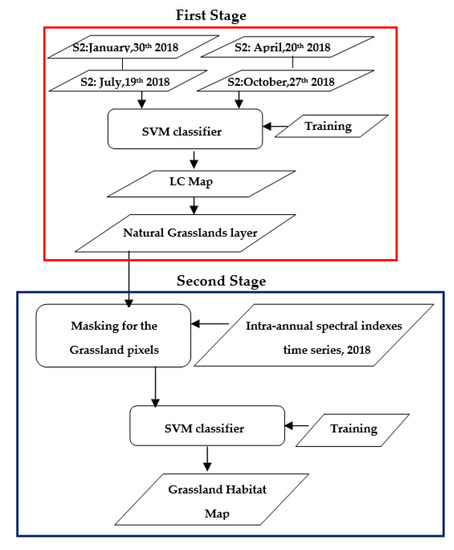
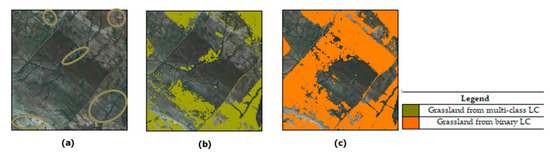
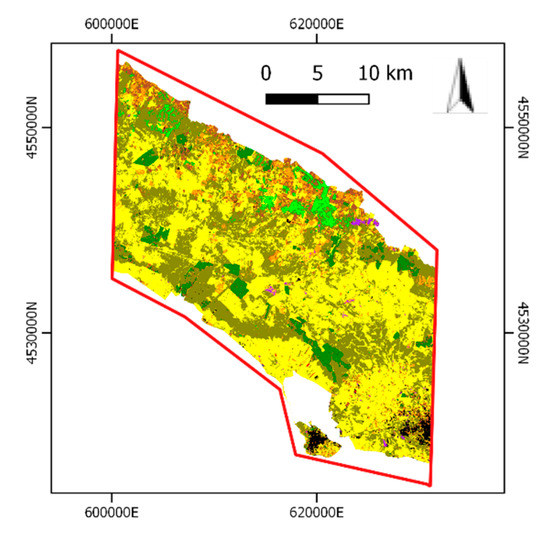
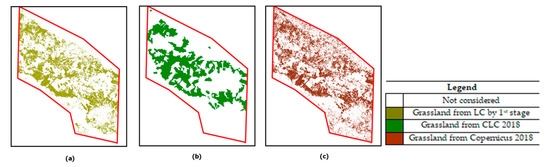
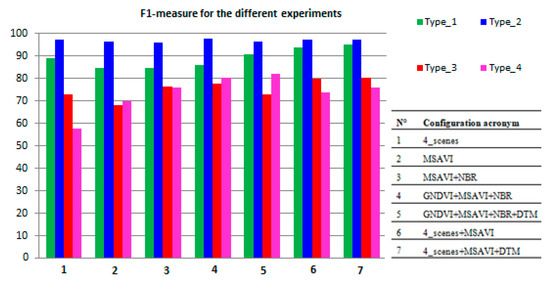
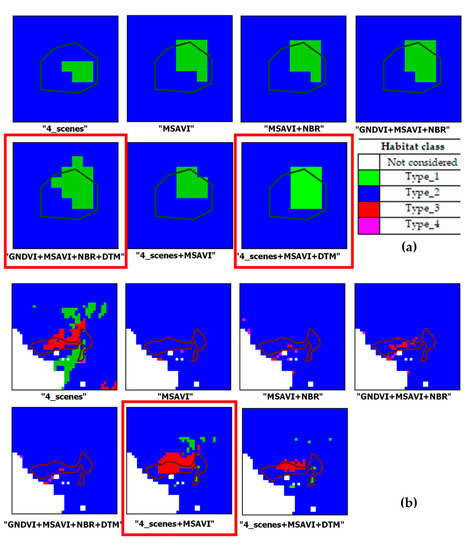
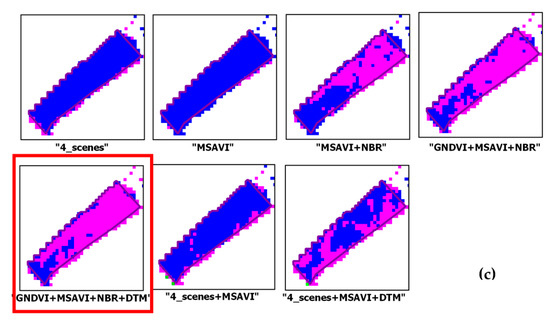
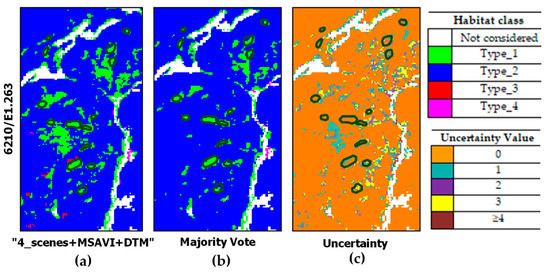
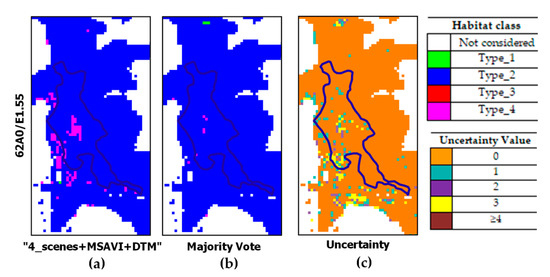
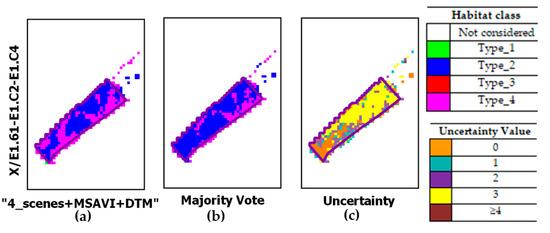
The present study aims to discriminate four semi-arid grassland habitats in a Mediterranean Natura 2000 site, Southern Italy, involving 6210/E1.263, 62A0/E1.55, 6220/E1.434 and X/E1.61-E1.C2-E1.C4 (according to Annex I of the European Habitat Directive/EUropean Nature Information System (EUNIS) taxonomies). For this purpose, an intra-annual time-series of 30 Sentinel-2 images, embedding phenology information, were investigated for 2018. The methodology adopted was based on a two-stage workflow employing a Support Vector Machine classifier. In the first stage only four Sentinel-2 multi-season images were analyzed, to provide an updated land cover map from where the grassland layer was extracted. The layer obtained was then used for masking the input features to the second stage. The latter stage discriminated the four grassland habitats by analyzing several input features configurations. These included multiple spectral indices selected from the time-series and the Digital Terrain Model. The results obtained from the different input configurations selected were compared to evaluate if the phenology information from time-series could improve grassland habitats discrimination. The highest F1 values (95.25% and 80.27%) were achieved for 6210/E1.263 and 6220/E1.434, respectively, whereas the results remained stable (97,33%) for 62A0/E1.55 and quite low (75,97%) for X/E1.61-E1.C2-E1.C4. However, since for all the four habitats analyzed no single configuration resulted effective, a Majority Vote algorithm was applied to achieve a reduction in classification uncertainty.
Full article
(This article belongs to the Special Issue Remote Sensing for Habitat Mapping)
►
Show Figures

Graphical abstract


