1. Introduction
Fumonisins (FUMs) are mycotoxins produced predominantly by
Fusarium verticillioides and
Fusarium proliferatum. The 28 FUM analogues that have been characterized since 1988 can be divided into four main groups identified as fumonisin A, B, C, and P series [
1]. Among the four groups (FA, FB, FC and FP), the toxicologically most important compounds are the B analogues. They are hydrocarbon long-chain aminopolyols with two tricarballylic acid side chains. Fumonisin B
1 (FB
1) is the most important representative of FBs [
2]. In most cases, in field samples, FB
1, fumonisin B
2 (FB
2) and fumonisin B
3 (FB
3) contributed to approximately 70%, 20% and 10% of FBs, respectively [
2]. FB
1 is generally found in the highest concentrations in maize and maize-based products [
3,
4].
A series of studies reported the occurrence of FB
1 and FB
2 in maize and products thereof in different European countries [
5,
6,
7,
8,
9]. Although occurrence is widespread, concentration levels ranged only between 0.2 and 2 mg/kg, with generally higher levels in unprocessed materials.
In vivo studies on the toxicity of FB
1 indicate that kidneys and liver are the main target organs. FB
1 is the causative factor of equine leucoencephalomalacia [
10], porcine pulmonary oedema syndrome [
11] and hepatocellular carcinoma in rats [
12]. FB
1 is possibly carcinogenic for humans; it has been classified as a possible carcinogen (group 2B) [
13]. All FUMs are highly polar and water soluble compounds. Structurally, the fumonisin backbone resembles the sphingoid bases sphinganine (Sa) and sphingosine (So) especially with the amino and hydroxy groups in positions C2 and C3. The key event is fumonisin-mediated inhibition of ceramide synthases (CerS). Inhibition of CerS results in the disruption of sphingolipid metabolism and, as a consequence, alterations in other lipid pathways. FUMs are regarded as structural analogues of free sphingoid bases and they competitively inhibit CerS, a group of key enzymes in the biosynthesis of ceramide and more complex sphingolipids [
14].
Toxic substances generally negatively affect the overall health status of an organism, sometimes inducing direct oxidative stress. Focusing specifically on FB
1, results gained so far on rodents suggest induction of oxidative stress directly or indirectly. In mice, in the spleen, exposure to the FB
1 led to increased caspase-3 activity, lipid peroxidation, and interleukin-10 (IL) and IL-4 mRNA levels, but decreased reduced glutathione (GSH) content and down-regulated expression of glutathione peroxidase (GSPHx) and superoxide dismutase, and of interferon-γ and tumor-necrosis factor α mRNA [
15]. In our earlier studies, high dose (50 ppm), but short exposure (5 days) in rats depleted hepatic GSH and induced lipid peroxidation (malondialdehyde, MDA), without activating the enzymatic defense [
16]. In rabbits, the hepatic lipid peroxidation was minimal, as assessed by GSH, GSHPx and MDA, after feeding 10 ppm FB
1 for 4 weeks [
17]. The nature of FB
1-induced oxidative stress is likewise acute. We were able to assess augmented lipid peroxidation in a short-term treatment [
16], which was not present after prolonged FB
1 exposure [
17]. A typical form of this adaptation has already been reported [
18] where, in vitro, primary hepatocytes provided increased membrane lipid levels of C18:1 n9 (oleic acid) and reduced polyunsaturated fatty acid (PUFA) niveau, as a means to provide selective resistance to FB
1-induced oxidative stress, and even apoptosis resistance. Besides in vitro results, recent studies reported that the generation of reactive oxygen species (ROS) and oxidative stress was closely related to FB
1s immunotoxic effect [
19]. The most comprehensive review on the oxidative stress-mediated toxicity of FB
1 has reported DNA damaging and genotoxic effects, as well as lipid peroxidation, all via a ROS-mediated manner [
20]; however, as a limitation, most studies merely ascertained the toxic effect, but dose-response analysis is rare.
In this study, male Wistar rats were treated intraperitoneally (i.p.) with varying doses of FB1 (0, 20, 50 and 100 ppm dietary dose equivalent) over periods of 5 and 10 days to ascertain the dose- and time-dependent effect of FB1 in mediating oxidative stress.
4. Conclusions
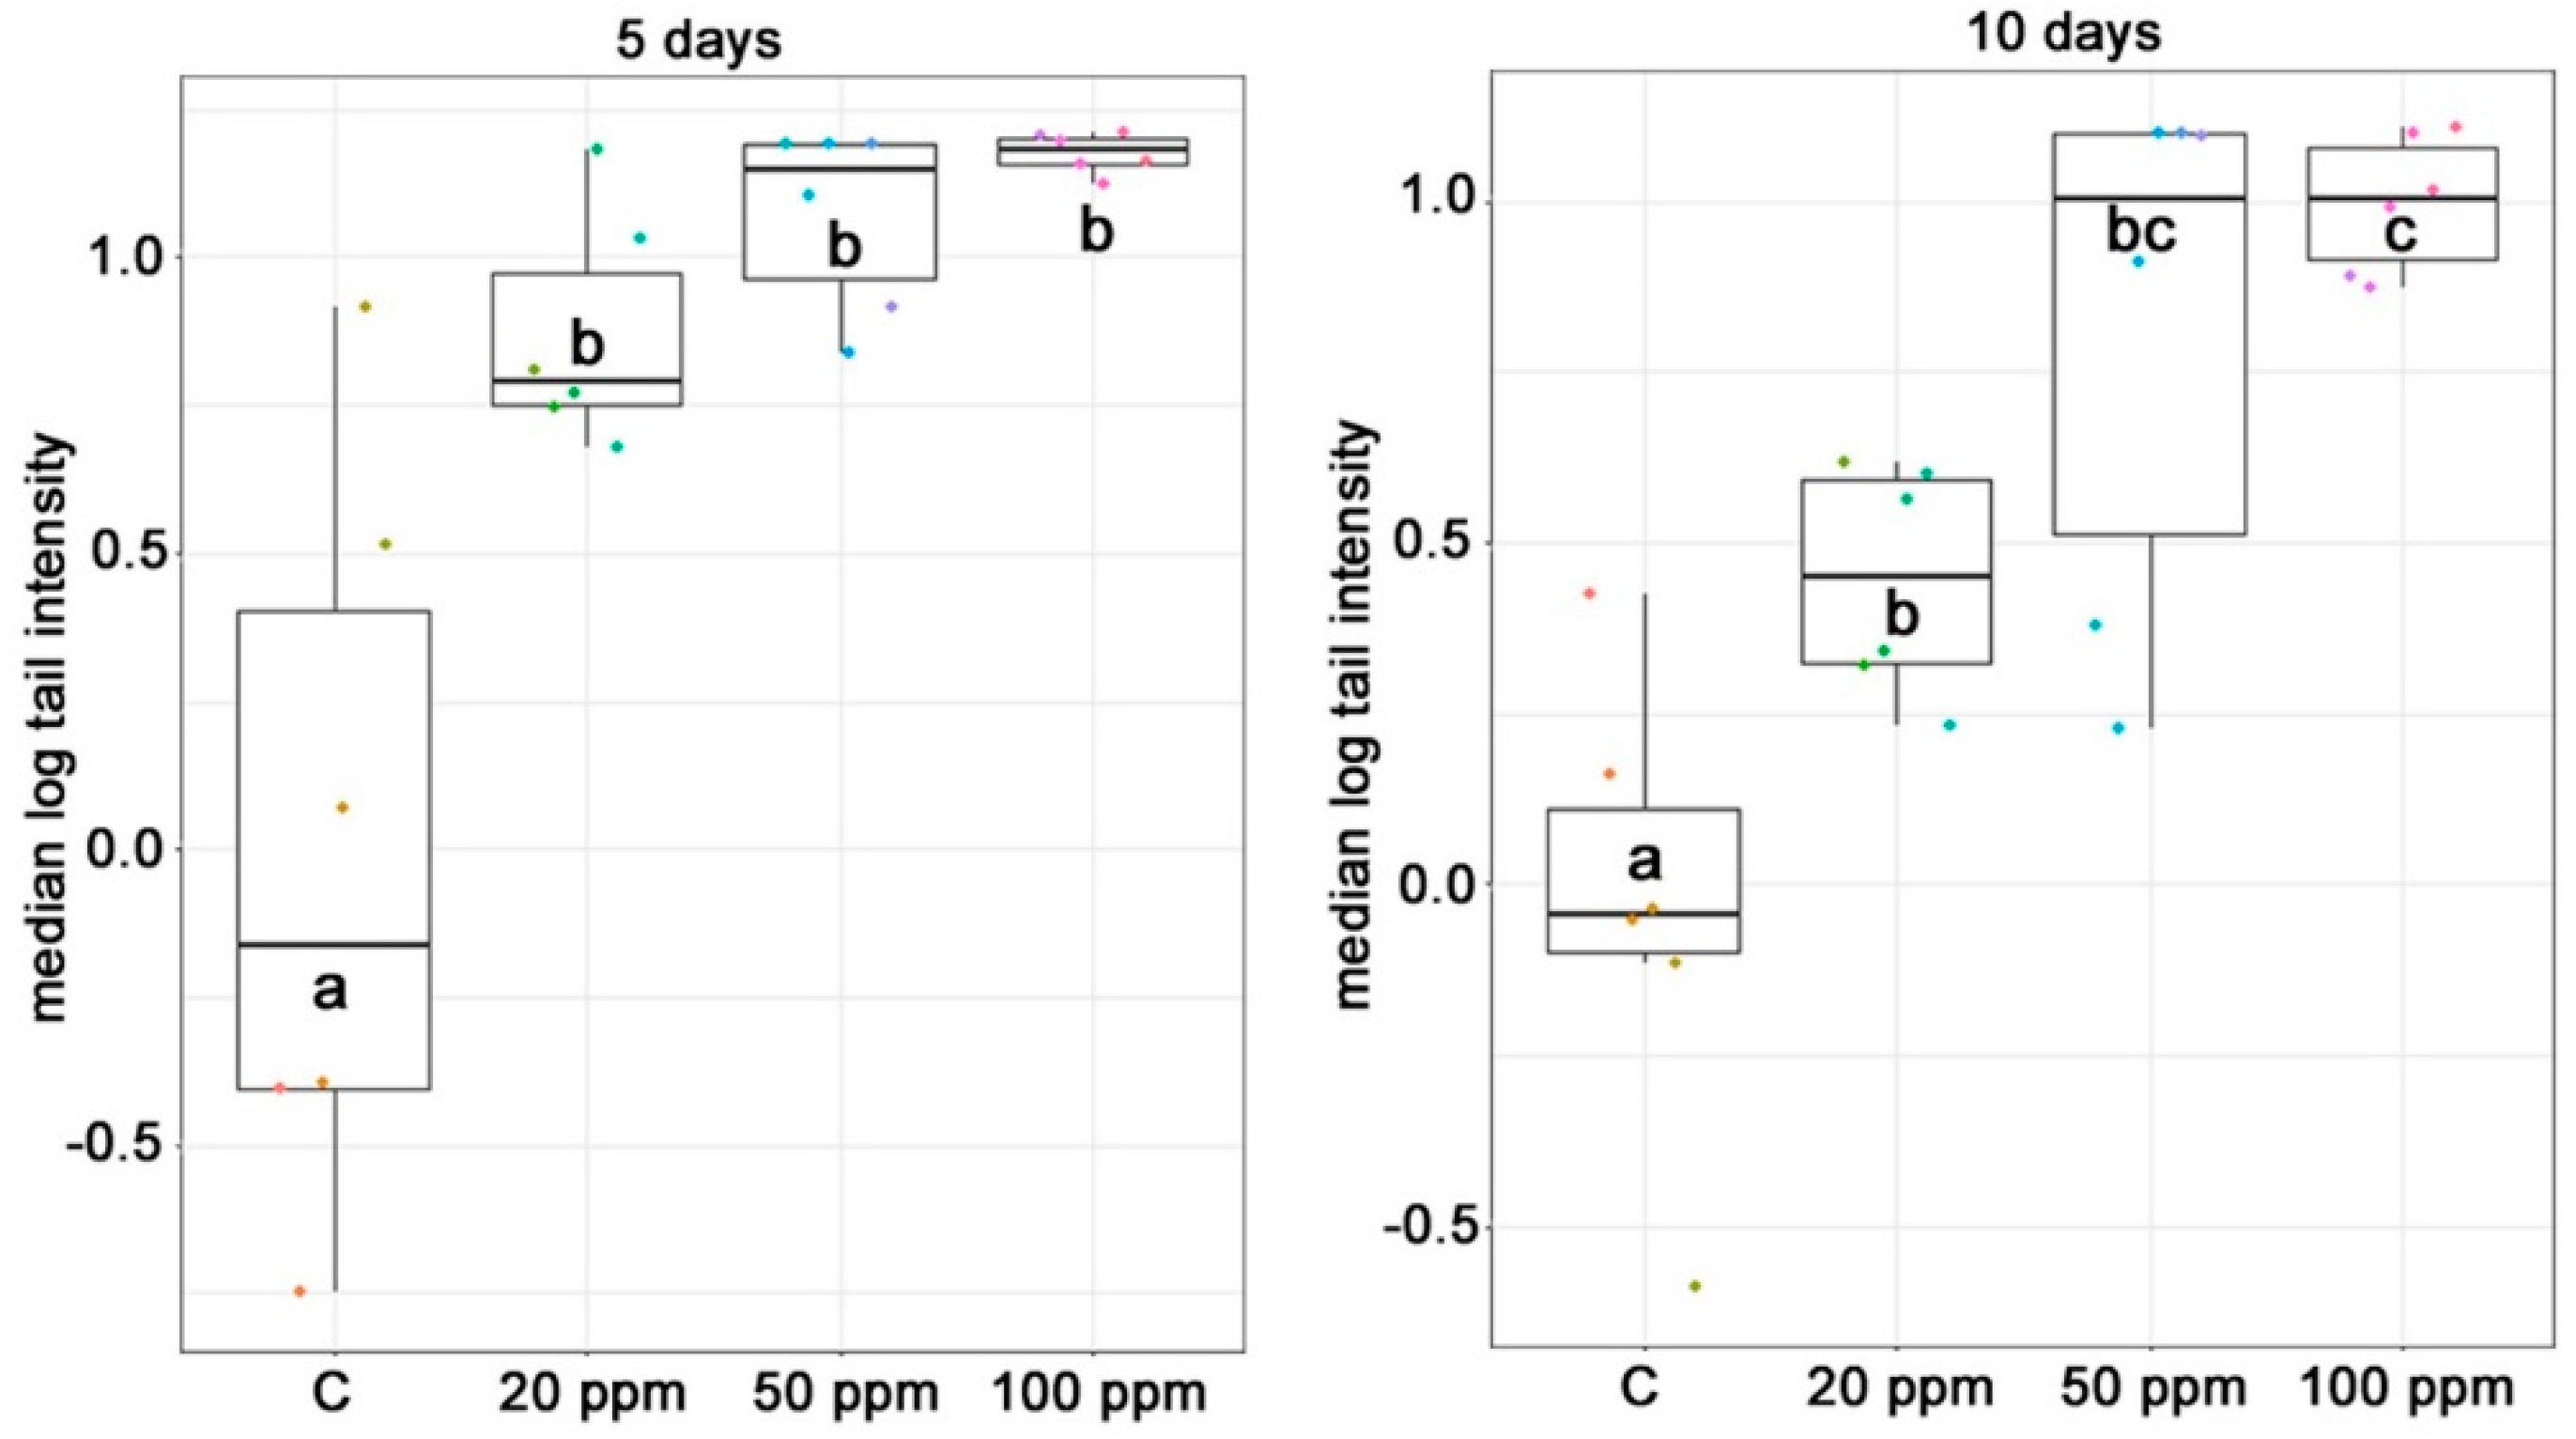
Increasing FB1 dose and exposure interval was used to challenge the blood clinical chemical parameters, kidney, liver and lung antioxidant defense and histopathological response in male Wistar rats. We found a linear dose response for AST, ALT, total cholesterol, urea and creatinine in the plasma, and exposure time-dependence for the alteration of the plasma creatinine level. The latter parameter was coupled with marked renal histopathological alterations, tubular degeneration and necrosis, and tubular epithelial cell detachment. The hepatic oxidative stress response was moderate, mostly referring to initial phase lipid peroxidation (CD, CT), and slight functional disturbance (plasma total cholesterol increase). The lung was non-responsive for the treatment, while lymphocyte DNA damage was detectable, but moderate, supporting mild genotoxic effect of FB1.
5. Materials and Methods
5.1. Animals and Feeding
Adult, male Wistar Crl:WI BR rats (8 weeks of age at the beginning) were enrolled in the study and were kept in metabolic cages (Tecniplast, Castronno, Italy) individually. The animals (n = 6/group, total n = 48) were fed Ssniff R/M-Z+H feed (Ssniff GmbH, Soest, Germany). The rats were kept in a 12 h light and 12 h dark daily rhythm, at 20 °C in a rodent room, with a relative air humidity of 50%. Feed was offered ad libitum, and feed intake was measured daily.
Increasing concentrations of FB1 (0, 20, 50 and 100 mg/kg diet, expressed as feed dose equivalent and referred to as ppm in the entire text and tables) were tested in a short- and thereafter a long-term experiment (5 and 10 days, respectively), to assess dose and time associated toxic effects. The pure mycotoxin was purchased from Sigma-Aldrich (Schnelldorf, Germany), and stock solutions were prepared with sterile physiological salt solution. The solutions contained the daily toxin dose in exactly 1 mL, and this solution was administered as a single intraperitoneal dose. For the control animals (C), 1 mL of sterile physiological salt solution was dosed.
Mycotoxin treatment was set as follows: 36 µg/animal/day (approx. 120 µg/kg BW/day), 90 µg/animal/day (approx. 300 µg/kg BW/day) and 180 µg/animal/day (approx. 600 µg/kg bw/day). Calculating with the average feed intake of 30 g/animal/day and the absorption ratio of the toxin [
54], the intraperitoneal (i.p.) administration represented the following dietary exposures: approx. 20, 50 and 100 mg/kg dietary equivalent for FB
1.
The two, basically similar treatments lasted for 5 (n = 24) and 10 days (n = 24), respectively, only the exposure time being different. On days 6 and 11, after taking blood from the retro-orbital plexus, the animals were sacrificed by cervical dislocation and were immediately dissected.
5.2. Ethical Permission
The experimental protocol was authorized by the Food Chain Safety and Animal Health Directorate of the Somogy County Agricultural Office (Hungary), under the permission number SOI/31/00308-10/2017 (date of approval: 27 March 2017).
5.3. Clinical Chemical Parameters
The plasma total protein, albumin, creatinine, glucose, urea and the total cholesterol concentrations and the activity of aspartate aminotransferase (AST), alanine aminotransferase (ALT) were determined in a veterinary laboratory (Vet-Med Laboratory, Budapest, Hungary), using Roche Hitachi 917 Chemistry Analyzer (Hitachi, Tokyo, Japan) with commercial diagnostic kits (Diagnosticum LTD., Budapest, Hungary).
5.4. Antioxidant Status and Lipid Peroxidation
For the determination of lipid peroxidation, the samples of blood plasma, liver, kidney and lung were stored at −70 °C until analysis. Lipid peroxidation was determined by the quantification of malondialdehyde (MDA) levels with 2-thiobarbituric acid method in blood plasma and organ homogenates [
55], and determination of conjugated dienes (CD) and trienes (CT) according to the AOAC [
56] method in the liver. The tissue concentration of reduced glutathione (GSH) was measured by the method of Sedlak and Lindsay [
57] and the activity of glutathione peroxidase (GSPHx) according to Lawrence and Burk [
58].
5.5. Comet Assay of Lymphocytes
50 µL heparinized blood was added to 1 mL 1% low melting agarose gel in Eppendorf tubes on 37 °C. The suspension was mixed gently and two drops (140 µL) were transferred to slides previously coated with 1% normal melting point agarose. The slides were covered with cover slips and allowed to set. The cover slips were then removed and cell membranes were lysed with lysis buffer solution (1% Triton X-100, 2.5M NaCl, 10 mM Tris, 0.1 M EDTA, pH10) for 1 h at 4 °C. Following the lysis the slides were placed in alkaline electrophoresis buffer (pH 13) in an electrophoresis tank (Cleaver Scientific Ltd., Warwickshire, UK) for 40 min at 4 °C, followed by electrophoresis at 25 V (300 mA) for 30 min at 4 °C. The slides were then placed in neutralizing buffer (pH 7.5) and washed three times for 5 min, followed by a final wash in double distilled water for a further 5 min. The slides were then left to dry overnight and stained with ethidium bromide (30 µL) and covered with cover slips.
Tail intensity (TI, % DNA in the tail) was determined with an epifluorescent microscope (B600 TiFL; optimum filter 4 and λ = 302 nm) and Comet IV (version 4.3.1.) software (Perceptive Instruments Ltd., Bury St. Edmunds, UK), examining 50 comets per gel, 2 gels per slide, 1 slide per animal. A TI of zero corresponds to a cell with no DNA damage; increasing positive values of TI correspond to greater DNA damage to the respective cells.
5.6. Histopathological Analysis
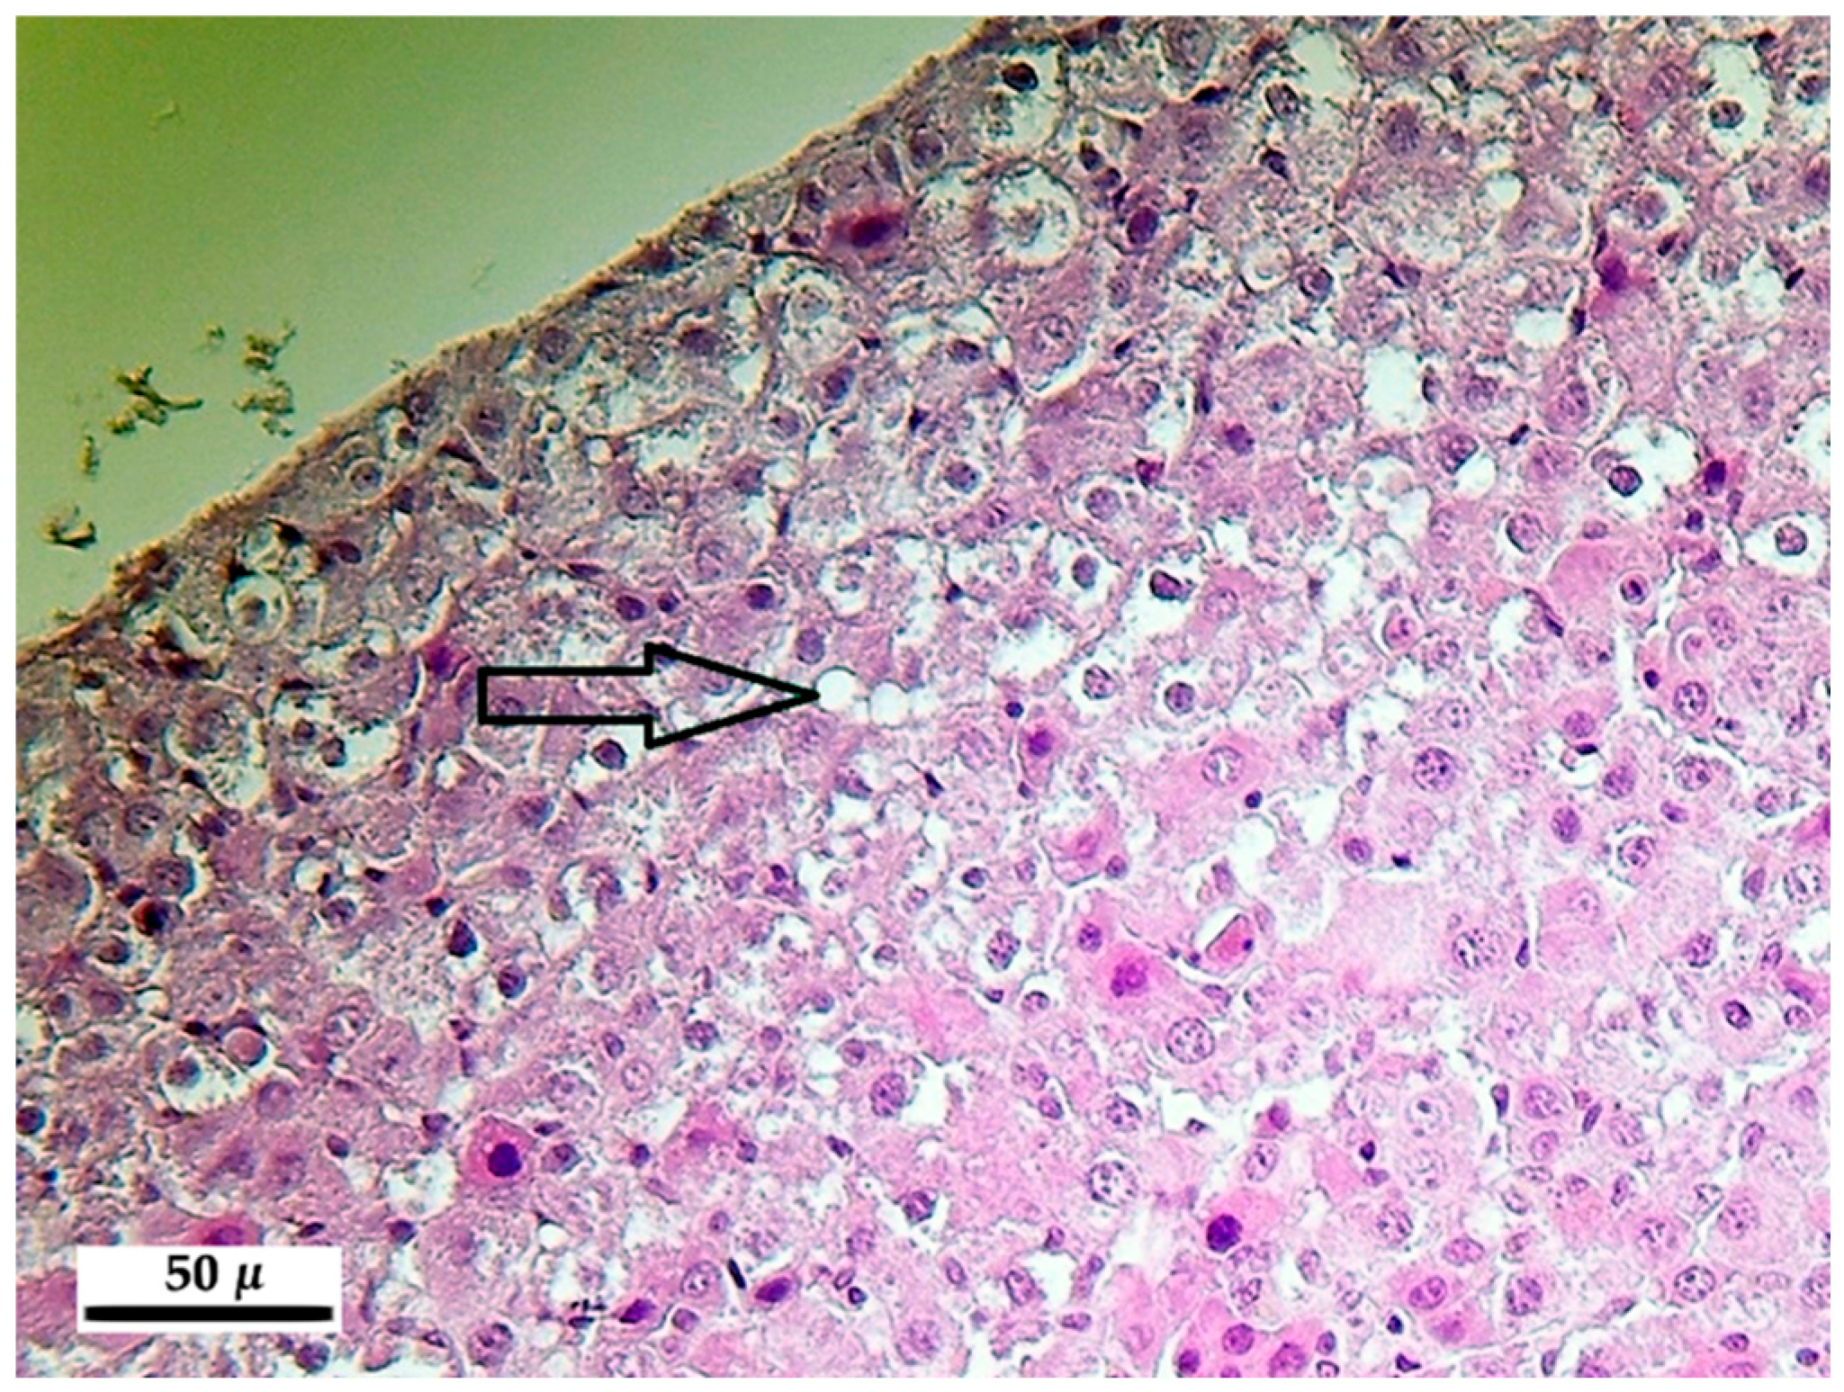
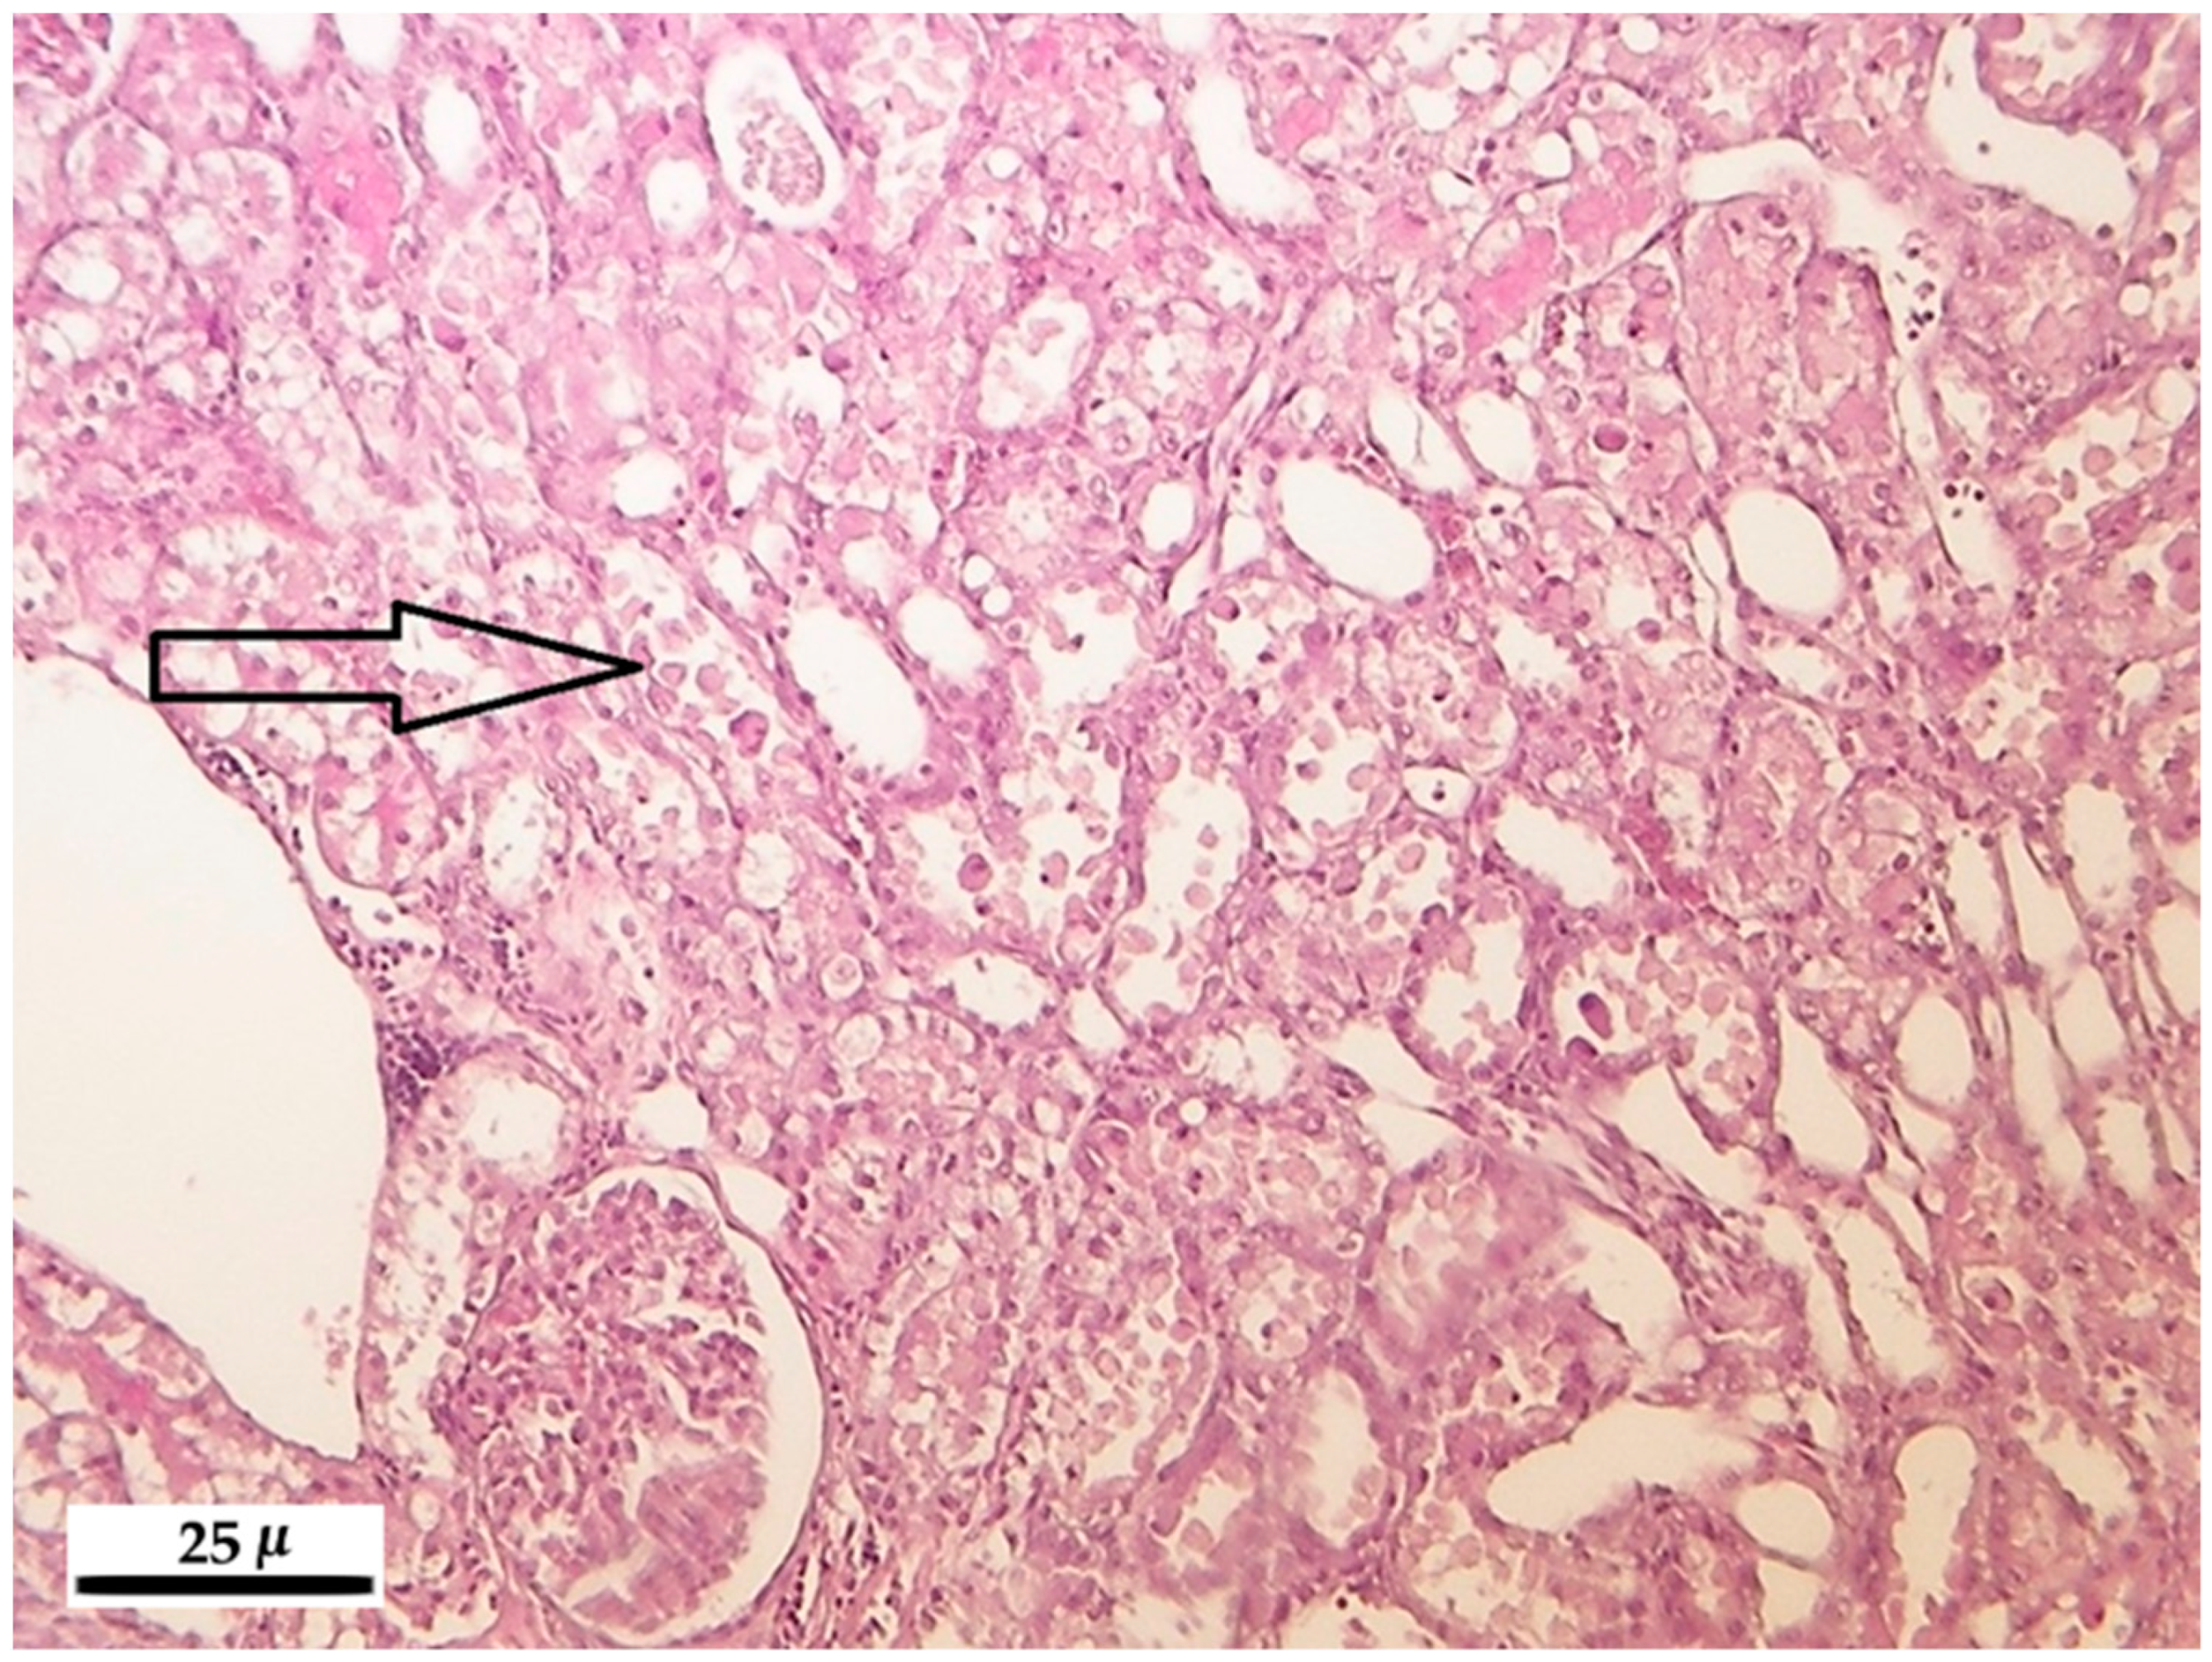
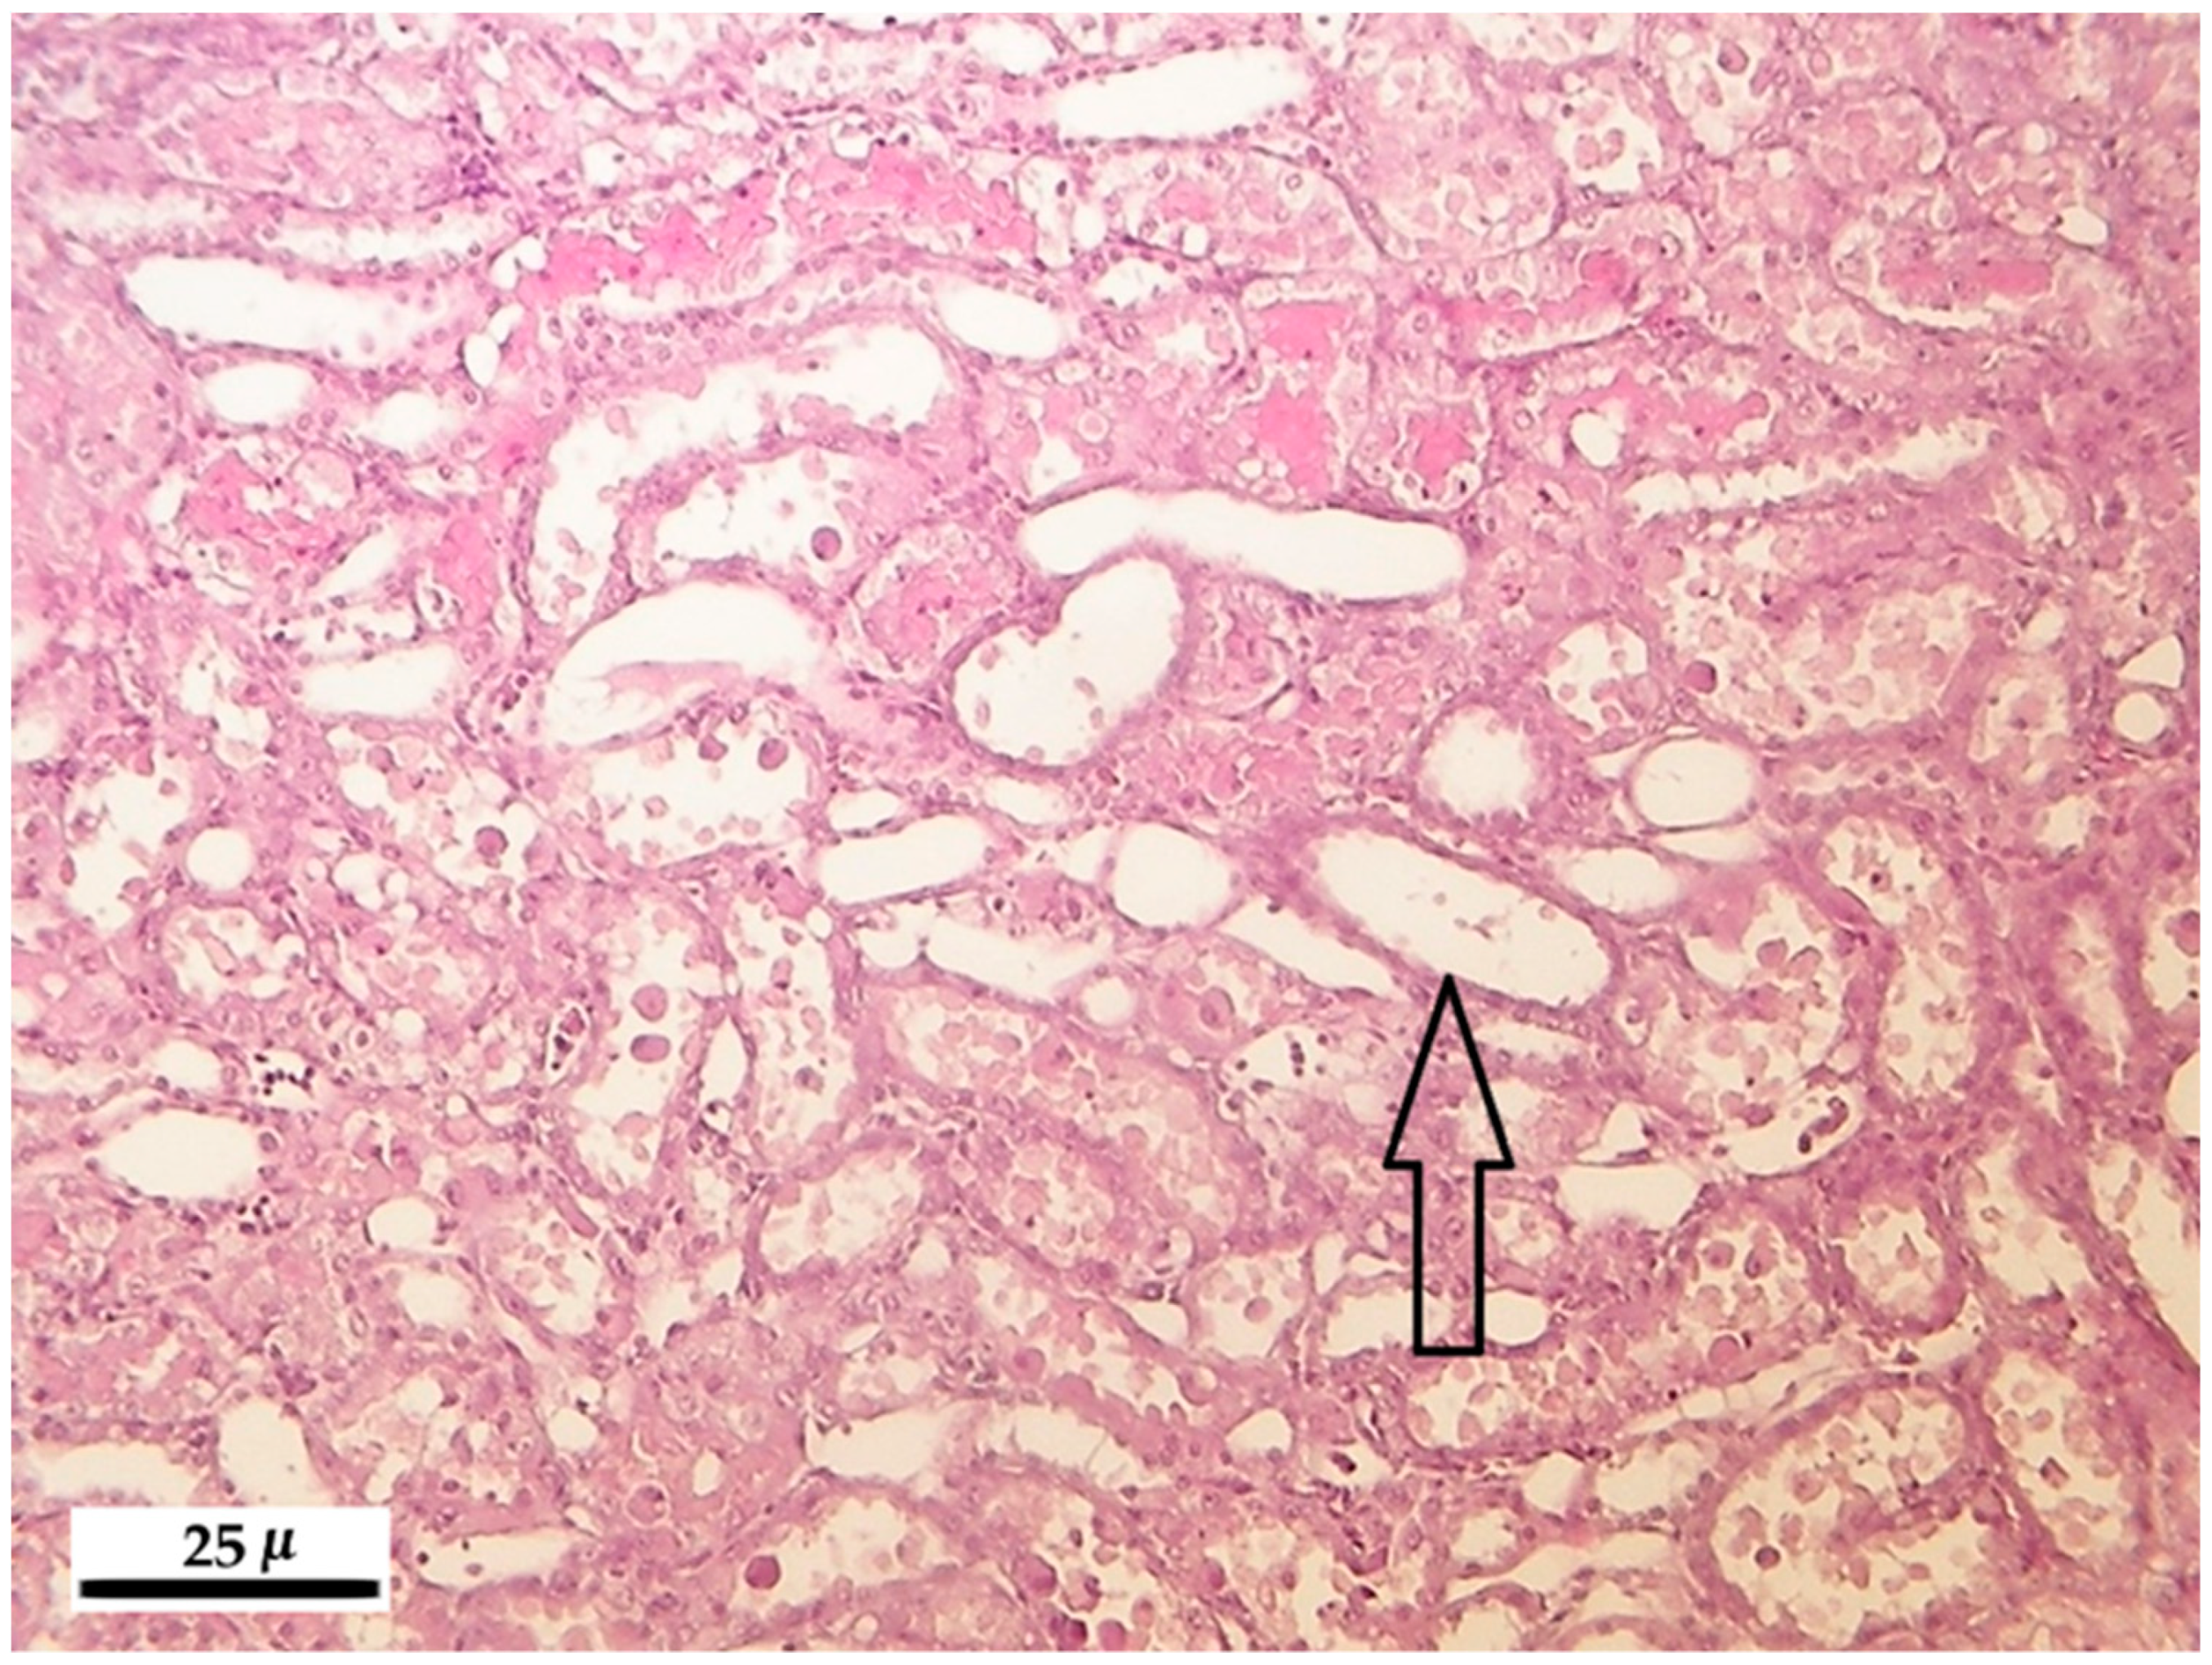
After registering the macroscopic pathological signs on the internal and external organs, the liver, kidneys, lung and spleen were stored in 10% neutrally buffered formalin and were embedded into paraffin. For light microscopic analysis, microtome slides of 5 micron (µ) were prepared and stained with hematoxylin-eosin.
The main pathological alterations have been described and scored according their extent and severity as follows: 0 = no alteration, 1 = slight/small scale/few, 2 = medium degree/medium scale/medium number, 3 = pronounced/extensive/numerous.
The histopathological analysis was performed according to the Act #2011 (03.30) of the Hungarian Ministry of Agriculture and Rural Development and was in accordance with the ethical guidelines of the Organization for Economic Cooperation and Development (OECD) Good Laboratory Practice for Chemicals [
59].
5.7. Statistical Analysis
Statistical analyses were performed using IBM SPSS 20.0 software (IBM Corp., Armonk, NY, USA) [
60]. Data processing and the mathematical-statistical calculations were performed using the Compare Means (Independent-Samples-
t-test) and Descriptive Statistics modules. Linear regression model was used to test dose dependent fitting in case of the blood biochemical parameters. Data were compared to reference range values for rats [
21].
In the case of the comet assay, the experimental unit of exposure was the animal and statistical analysis was based on the individual animal response data. The constant of 0.001 was added to each TI before taking logarithms. The median values of 50 cells were calculated, and the average of the two medians (representing one gel = one animal) was used in the general linear model of one-way analysis of variance (ANOVA) as suggested by Bright et al. [
61].
In the statistical analyses, differences between groups were considered significant when p values were <0.05.

 ,
, 


