Article

Covariation of Ergot Severity and Alkaloid Content Measured by HPLC and One ELISA Method in Inoculated Winter Rye across Three Isolates and Three European Countries

1
State Plant Breeding Institute, University of Hohenheim, 70599 Stuttgart, Germany
2
Austrian Agency for Health and Food Safety (AGES), Institute for Sustainable Plant Production, 1220 Vienna, Austria
3
Austrian Agency for Health and Food Safety (AGES), Institute for Food Safety Linz, 4020 Linz, Austria
4
Federal Research Centre for Cultivated Plants, Julius Kühn-Institute, Institute for Plant Protection in Field Crops and Grassland, 38104 Braunschweig, Germany
5
Institute of Plant Protection—National Research Institute, 60-318 Poznań, Poland
6
KWS LOCHOW GMBH, 29303 Bergen, Germany
7
HYBRO Saatzucht GmbH & Co. KG, 17291 Schenkenberg, Germany
8
LCTech GmbH, 84419 Obertaufkirchen, Germany
9
Saatzucht LFS Edelhof, 3910 Zwettl, Austria
10
DANKO Hodowla Roslin Sp. z o.o., 64-000 Kościan, Poland
*
Author to whom correspondence should be addressed.
Toxins 2020, 12(11), 676; https://doi.org/10.3390/toxins12110676
Submission received: 21 September 2020 / Revised: 14 October 2020 / Accepted: 15 October 2020 / Published: 26 October 2020
(This article belongs to the Section Mycotoxins)

Abstract

:
Ergot caused by Claviceps purpurea is a problem for food and feed security in rye due to the occurrence of toxic ergot alkaloids (EAs). For grain elevators and breeders, a quick, easy-to-handle, and cheap screening assay would have a high economic impact. The study was performed to reveal (1) the covariation of ergot severity (= percentage of sclerotia in harvested grain) and the content of 12 EAs determined by high performance liquid chromatography (HPLC) and (2) the covariation between these traits and results of one commercial enzyme linked immunosorbent assays (ELISA). In total, 372 winter rye samples consisting of a diverse set of genotypes, locations from Germany, Austria, and Poland over two years, and three isolates were analyzed. Ergocornine and α-ergocryptine were detected as major EAs. Ergocristinine occurred as a minor component. Claviceps isolates from different countries showed a similar EA spectrum, but different quantities of individual EAs. A moderate, positive covariation between ergot severity and EA content determined by HPLC was observed across two years (r = 0.53, p < 0.01), but large deviation from the regression was detected. ELISA values did neither correlate with the HPLC results nor with ergot severity. In conclusion, a reliable prediction of the EA content based on ergot severity is, at present, not possible.
Key Contribution: Ergot severity cannot be used to predict the EA content measured by HPLC because only a moderate correlation and a large deviation from the regression were detected. A commercial ELISA did neither correlate with ergot severity nor with HPLC data.

Graphical Abstract

1. Introduction

The plant pathogen Claviceps purpurea ((Fr.: Fr.) Tul.) is distributed worldwide and can infect more than 400 grass species including rye (Secale cereale L.) [1]. Germany, Poland, and Austria cover 73% of the European Union rye production of 4.6 million metric tons in 2018 [2]. Ergot is a severe fungal disease and the over-wintering bodies called sclerotia contain toxic ergot alkaloids (EAs). The EAs are a group of secondary metabolites [3] that are defined as derivatives of 4-(γ,γ-dimethylallyl)tryptophan (DMAT) [4]. EAs are known from several Ascomycetes species [5], including C. purpurea as a plant pathogen, and symbionts like Neotyphodium and Epichloë [6]. The ecological function is not fully clarified yet, but there are indications that EAs contribute to virulence [7] and play an important role for the resistance of the fungus against insects [6], mammals [8], or microbes [9]. More than 80 individual EAs are known in literature [5,10], which can be grouped into Clavine alkaloids, D-lysergic acid and its derivatives, and ergopeptines [4,11,12,13]. For Claviceps spp., the main EAs are ergometrine (Em), ergotamine (Et), ergosine (Es), ergocristine (Ecr), ergocryptin (Ekr), and ergocornine (Eco) along with their corresponding -inine epimers [14,15]. The pattern of the produced EAs strongly differs depending on fungal strain, host plant, and the geographic region [12,14,16,17]. Furthermore, a seasonal-dependent variation of the EA formation was observed for Festuca sinensis [18]. Additionally, for pathogenic variation, significant differences were observed among isolates according to their geographic origin [19]. Kodisch et al. [20] showed that isolates may also differ in their ergot severity on winter rye. For determination of EAs, numerous methods are reported in literature based on immunology, chromatography, or capillary electrophoresis [15,21,22,23]. For determination of individual EAs in food and feed at relevant levels, chromatographic methods such as high performance liquid chromatography with fluorescence detection (HPLC-FLD) and high performance liquid chromatography—tandem mass spectrometry (HPLC-MS/MS or LC-MS) are internationally validated [15,24] and were commonly used in several screening studies [1,17,25,26,27,28,29], especially when a high number of samples is needed to be screened in parallel [30]. Enzyme-linked Immunosorbent Assays (ELISA) are based on the antigen-antibody reaction and could be used to determine the content of a precursor in the ergot biosynthetic pathway to obtain information about the EA content. Additionally, ELISAs are easy-to-use, fast, and relatively cheap [31] and, therefore, the ideal solution for a quick and financially sustainable screening assay. Several commercial ELISA kits for evaluating EAs detecting lysergic acid and its derivatives as a common motif of one precursor group of the EAs are available [30,31,32]. Three commercially available ELISA kits have been shown for a small number of samples to screen EAs correctly in a qualitative manner in two cases, but not in a quantitative manner caused by false positive and false negative results when comparing to an HPLC approach [30]. The ELISAs show further cross reactivity against ergopeptines (e.g., ergovaline), which is not covered by the 12 EAs analyzed with the HPLC approach. This may lead to a higher total ergot alkaloid content by ELISA in comparison with the HPLC analysis [32].
Rye is especially prone to ergot contamination because it is a cross-pollinating crop opening the flowers wide and allowing the ergot spores to be brought directly into the pistils by aerosol deposition or insects [33]. Ergot infection is favored by cool, rainy weather when the flowers have a prolonged opening period, but also by a low amount of pollen shedding that is genetically inherited [20,34]. Ergot-contaminated rye grain was caused in the Middle Ages’ devastating epidemics in humans known as “St. Anthony’s fire” or ergotism with severe pathological syndromes such as gangrene, neurological diseases, and, finally, death [35,36]. In contrast, some EAs are used in medicine as therapeutic drugs to treat migraines, uterine hemorrhaging, or Parkinsonism [4] due to the pharmacological activities of these metabolites [12,36]. Since the second half of the 20th century, only single disease cases in humans are known and, currently, the risk of ergot as a fatal disease for humans and animals is low due to cleaning procedures, diversification of diets, and strict regulations of the ergot content within the European Union EU, [15,37]. Until now, the EU limits for ergot sclerotia and sclerotial fragments in unprocessed cereals are set to 0.05% by wt. for human consumption [38] and to 0.1% by wt. for animal feed [39]. However, reduction of the limit to 0.02% by wt. on unprocessed rye and maximum levels based on the EA alkaloid content as from 01.07.2022 onward to 250 µg/kg on rye milling products (until 30.06.2022: 500 µg/kg) and for infants and young children to 20 µg/kg are expected to be enacted for the 12 EAs ergometrine, ergometrinine, ergosine, ergosinine, ergotamine, ergotaminine, ergocornine, ergocorninine, α-ergocryptine, α-ergocryptinine, ergocrystine, and ergocrystinine (A. Raditschnig, pers. commun. 2020). However, not all milling companies are able to use photocell-based sorting machines because it enhances the costs and slows down the processing appreciably [33]. Furthermore, EAs could also be detected in ergot-cleaned grain samples likely caused by abrasion [40,41,42]. Gordon et al. [43] revealed that, in wheat and barley and, for a lesser extent, in rye, EAs also occurred in healthy grain that developed above and below the artificially infected individual florets. Therefore, it is not surprising that EAs occurred frequently in several studies in different countries and among all common cereals [44].
For rye and rye-based products, between 51% to 100% of all samples contained EAs with maximum levels ranging between 61 to 1231 µg/kg whereas, in one rye feeding lot, a maximum EA content of even 12,340 µg/kg was observed [1,17,25,26,27,28,29]. The maximum levels for other cereals such as wheat or triticale reached similar EA contents ranging between 123 and 1236 µg/kg [17,26,27,28,29,44], indicating the necessity of testing wheat and triticale for the presence of EAs. Furthermore, it is known that baking of wheat and rye flour reduces the EA content considerably [45,46] and also shifts the ratio between the epimeric forms toward the -inine forms [15]. However, this was not true for durum pasta production [47], so processing alone is not a guarantee to obtain alkaloid-free commodities. Although ergot often does not result in a large yield loss, ergot-contaminated grain can have a high economic impact on cereal production because of downgrading or rejecting grain lots contaminated with EAs [1,19,48]. The best measures for reducing ergot incidence and EA content is growing less susceptible cultivars, supporting the homogeneity of the rye stand, and controlling the weeds surrounding the fields [49]. However, up to now, it is not known whether physiological resistance exists in rye and breeding for lower susceptibility is difficult [33]. Only a few quantitative trait loci (QTL) were reported for assigning partial resistance to ergot, i.e., affecting the size and weight of sclerotia in bread wheat [50] or different components of the infection process like the hormonal pathway in durum wheat [51].
Regarding the recurring occurrence of EAs in rye and rye-based products, the future reduction of existing limits and expected maximum EU levels based on the EA content creates a need to clarify associated factors influencing EA content with the aim to develop and evaluate a quick screening method for farmers, small elevators, milling companies, and breeders. Otherwise, a high economic burden would arise for the industry, which likely would have an effect on the prize of the final products. Especially for selection for low EA content in breeding, cheap and quick tests are necessary because thousands of samples have to be screened in the short time frame between harvest and planting. The relationship of ergot severity and EA content is not fully clarified yet. Screening studies often consist of a low number of samples only and validation studies of HPLC and ELISA are rare in literature. Therefore, this correlation study was performed with a high number of samples to reveal (1) the covariation of ergot severity and EA content determined by HPLC in the light of different genotypes, environments (locations, years, countries), isolates, and infection levels and (2) the covariation between these traits and the commercial ErgoREAD ELISA test. For this, we analyzed 372 winter rye samples of several genotypes artificially infected by C. purpurea with three isolates at nine locations (Germany, Austria, Poland) in two years.

2. Results

2.1. Influence of Genotype, Environment, Isolate, and Interaction on Ergot Severity and EA Content

The environments showed wide ranges of ergot severity and EA content determined by HPLC and ELISA, varying from 0.06% to 6.46%, 0 to 97.85 mg/kg, and 0.52 to 3673.89 mg/kg, respectively. Huge differences between the locations and years were observed concerning ergot severity and EA content determined by HPLC (Figure 1). The Austrian locations EHO 2018 and HAG 2018 showed the highest ergot severity, whereas the Polish location ZYB revealed low levels for ergot severity and EA content in both years.
Small differences were observed for ergot severity among three rye genotypes with cultivar Elias showing significantly less ergot than H_Hyb5 (Table S2). Differences among the cultivars of the EA levels were not statistically significant as measured by both methods. ELISA resulted, on average, in a 43-fold higher EA content than HPLC. Similar large differences were obtained for the distribution of the EA content determined by HPLC and ELISA (Figure 2). For HPLC, most of the samples (40%) contained EA concentrations ≤0.25 mg/kg. In contrast, only 3% of the ELISA samples reached this low EA concentration level. Vice versa, the minority of the samples (2%) measured by HPLC contained higher EA levels than 100 mg/kg. For ELISA, however, 28% of the samples fell in this high EA class.
The environment was the most important component of variance for all three traits (Table S3). For ergot severity, genotype, isolate, and genotype × environment were also important sources of variance. There was no significant genotype × isolate interaction. For EA content measured by HPLC, isolate variance was also significant. No significant genotypic effect was determined for EA content, neither for HPLC nor for ELISA analyses. High entry-mean heritabilities were observed for ergot severity and EA content measured by HPLC (0.91 and 0.82, respectively). EA content measured by ELISA had a considerably lower heritability (0.57).

2.2. Covariation of Ergot Severity and Alkaloid Content Measured by HPLC

Ergot severity and EA content measured by HPLC showed good correlations of the respective two field plots (= replications) ranging from 0.70 to 0.91 (Figure S1) and illustrating that the genetic variation was high and the methods were reliable. A moderate positive covariation of ergot severity (%) and EA content determined by HPLC was obtained for subset I (r = 0.53, p < 0.01, Figure 3a) and subset II (r = 0.65, p < 0.01, data not shown). No grouping effects were observed when considering different factors such as isolate (Figure 3b), location (Figure 3c), and genotype (Figure 3d), i.e., the correlation did not improve. The correlations calculated within isolates (n = 96) and genotypes (n = 96) showed moderate to good correlations varying from r = 0.45 to r = 0.90. Splitting the samples in fractions of ergot severity <0.05% and ≥0.05% revealed low to medium covariations of r = 0.26 (n = 145) and r = 0.49 (n = 183), respectively.

2.3. Covariations with ErgoREAD ELISA Values

The ELISA showed a good correlation between the two field plots (= replications) for both ergot severity and EA content (Figure S1). No correlation, however, was detected between ergot severity (%) and EA content for subset I (r = −0.07) (Figure S2a) and subset II (r = −0.09) (data not shown). Comparing both analytical methods for determining EA content revealed no covariation between ELISA and HPLC for subset I (Figure S2b) and subset II (r = −0.04) (data not shown). No improvement of the correlation could be detected when splitting the dataset in the factors isolate, location, genotype, or infection level (ergot severity <0.05% and ≥0.05%).

2.4. Effect of the Isolates on Ergot Infection and EA Content

Across the years, significant differences between the isolates were observed for all traits except for ergot severity in 2018 and ergot severity across both years (Table 1). EA contents measured by ELISA were for all isolates substantially higher in 2019 than in 2018. This was, however, not the case for measurements by HPLC. The Austrian isolate always showed the highest EA contents measured by HPLC, which is significantly different from the Polish and German isolates. A table of ergot severity for the single rye genotypes separated by isolate and year could be found in the Supplementary Material (Table S4).

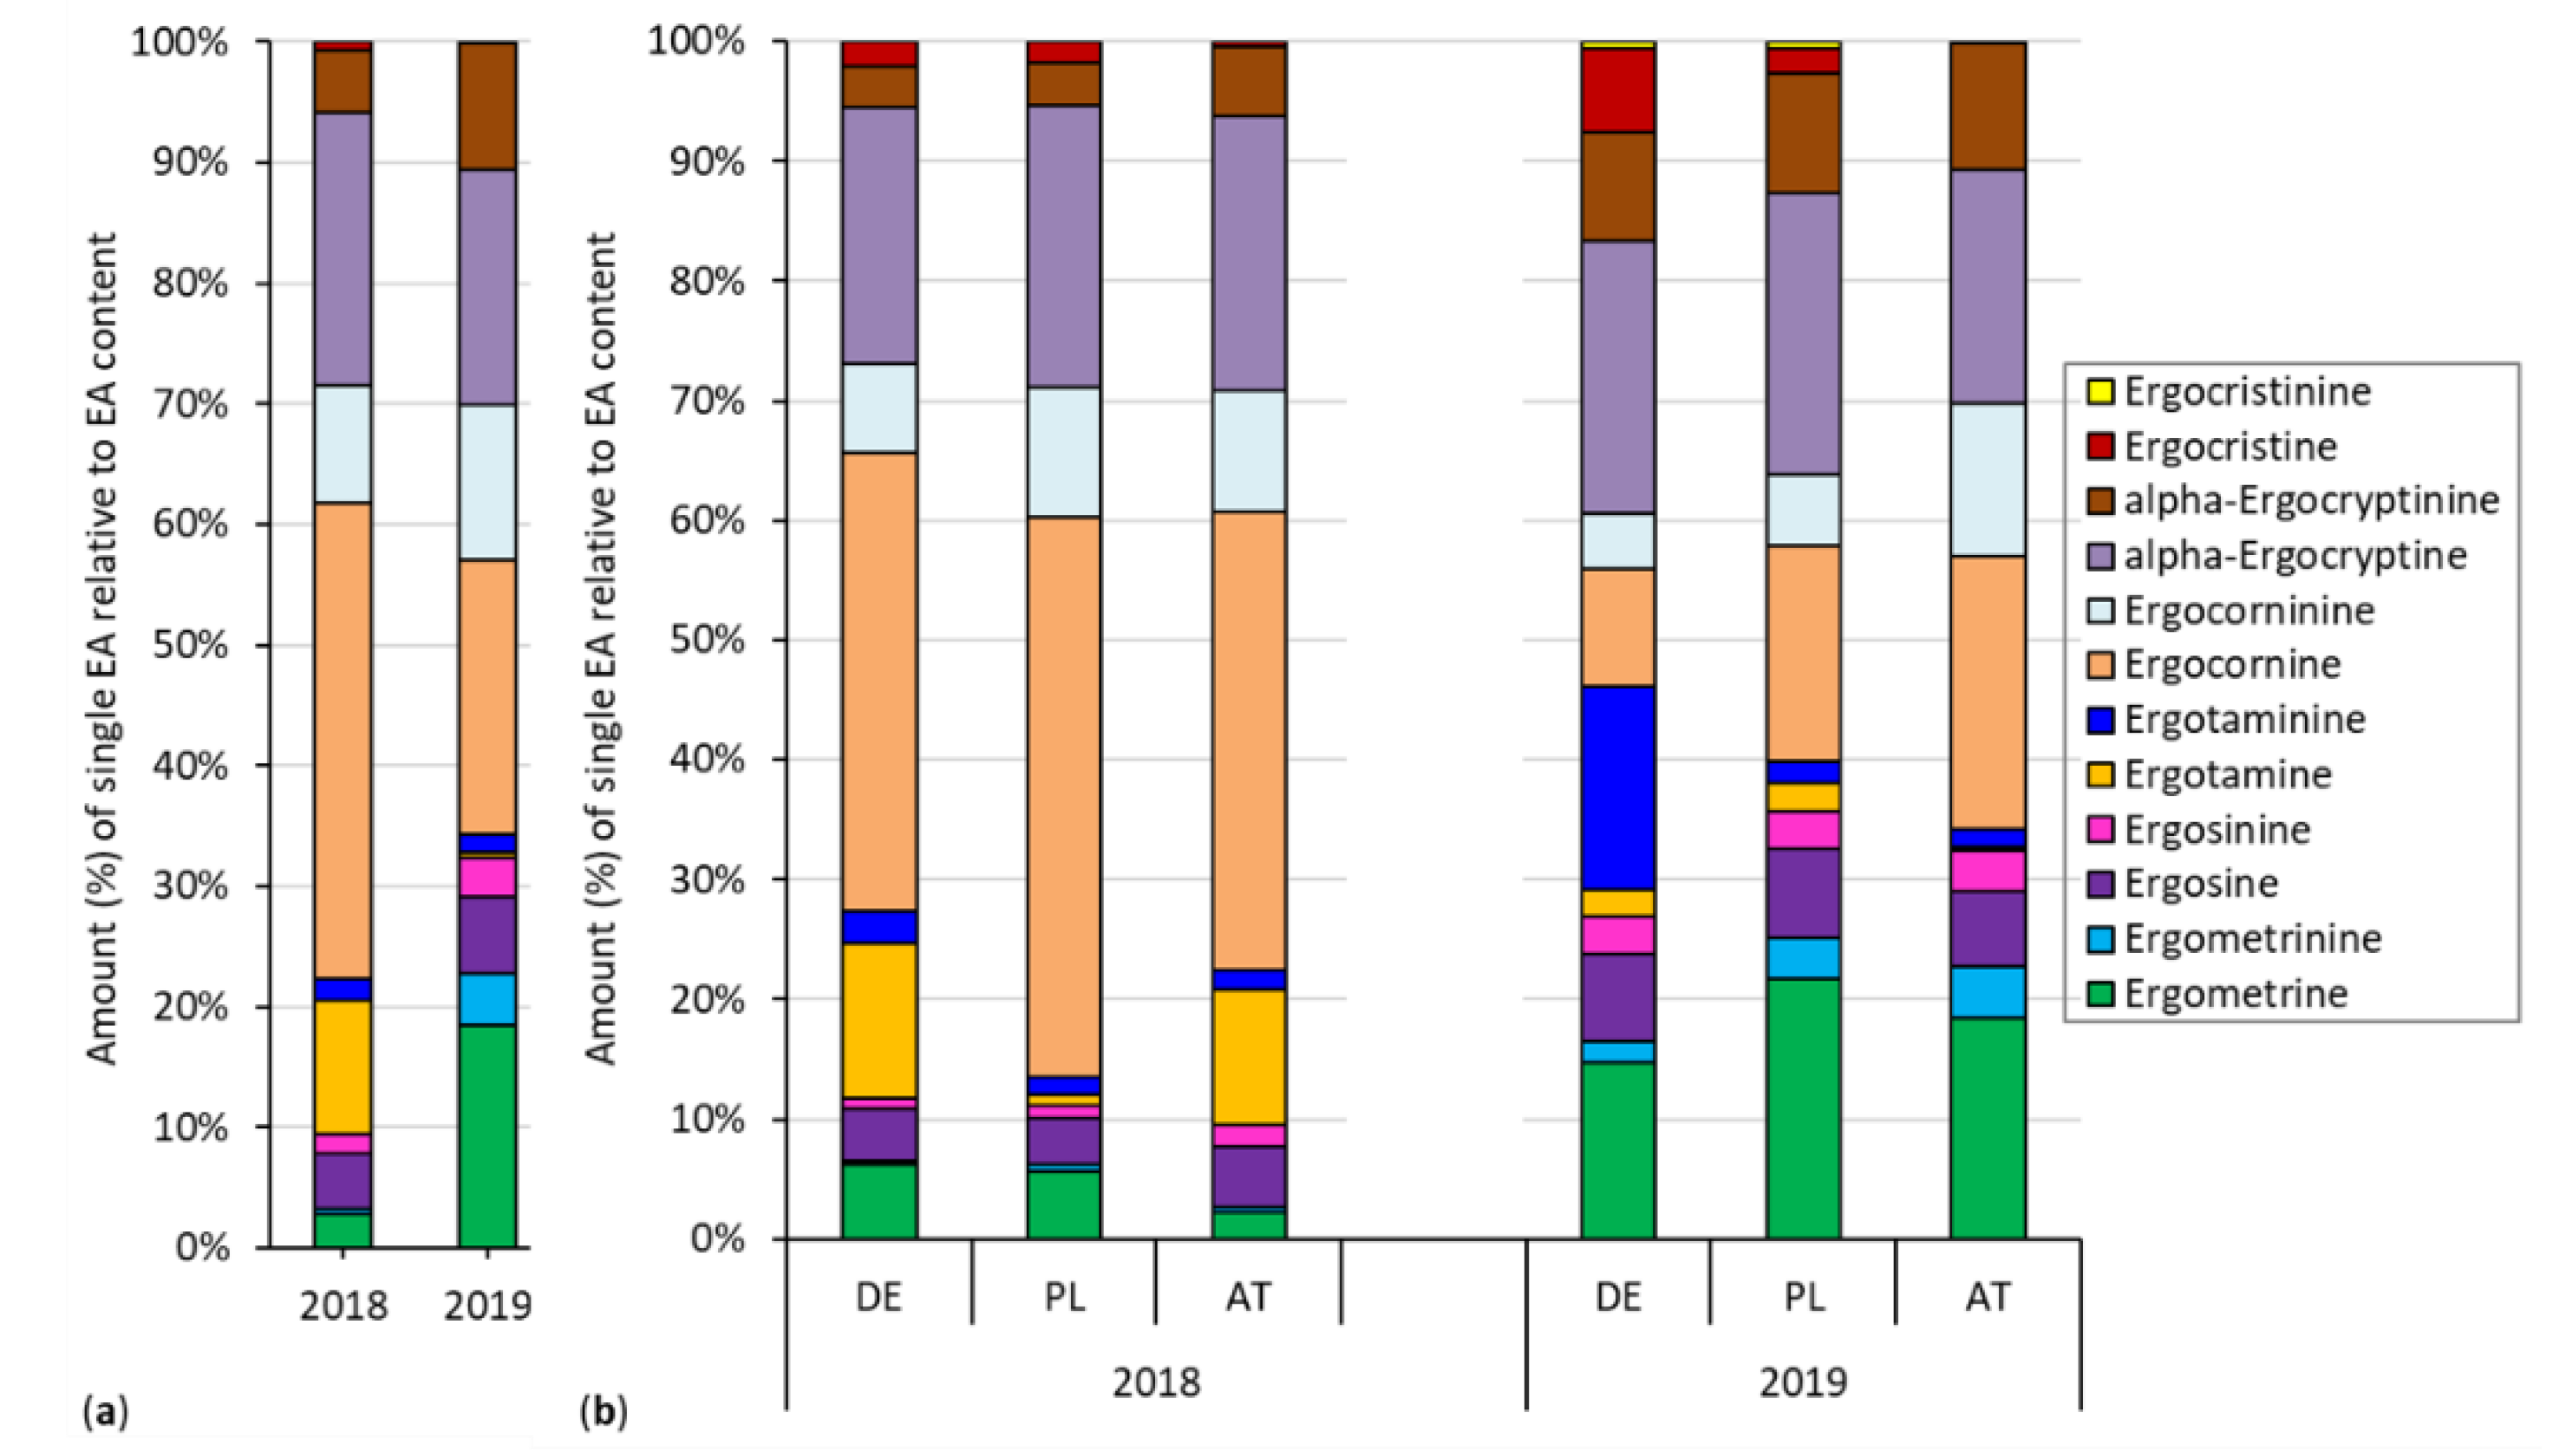
2.5. Composition of the EA Spectrum

The pattern and distribution of all single EAs relative to the EA content determined by HPLC across all locations was mostly similar for both years (Figure 4a, subset I). Larger differences were found only for ergometrine and ergotamine. The amount of ergometrine was 6.3-fold higher in 2019 (19%) when compared to 2018 (3%), which is in contrast to the 30.6-fold decrease of ergotamine from 2018 (11%) to 2019 (0.36%). In almost all cases, the amount of the -inine forms of the respective EA was considerably lower than the -ine epimer, except for ergocristine (0.02%) and ergocristinine (0.11%) (2019, subset I) and for ergotamine (2%) and ergotaminine (17%) of the German isolate in 2019 (subset II), where the proportion of the -inine form was observed 8.5 fold higher than for ergotamine. Subset II showed a similar spectrum and ranking regarding the proportion across the three isolates (DE, PL, AT) and both years (2018, 2019) (Figure 4b). The EAs with the highest proportions were ergocornine and α-ergocryptine for both subsets except for the German isolate of 2019 in subset II. For subset II, α-ergocryptine followed by ergotaminine and ergometrine were detected as the most abundant EAs. Ergocristinine could be found only in traces. Ergocristine showed a higher amount in subset II than in subset I, especially for the German isolate in 2019 with a proportion of 7% on the EA content. A table with the content of all single EAs determined by HPLC of subset I after inoculation with C. purpurea from 2018 and 2019 could be found in the Supplementary Material (Table S5).

3. Discussion

For evaluating the covariation between ergot severity and EA content, artificial infection by spray inoculation was used. This is necessary to ensure a sufficiently high ergot infection and an even distribution across the experiment at all locations and years. Dung et al. [52] showed that natural ergot infection does not occur randomly within fields of Kentucky bluegrass (Poa pratensis) and that many factors, such as flowering, environmental or cultivation conditions, and occurrence of insects, contribute to disease proliferation. Nevertheless, Kodisch et al. [20] showed that ergot severity of genotypes after inoculation is highly correlated to that of natural infection. For our experimental set-up, it was previously described [34] that high heritabilities for ergot severity can be achieved. To achieve maximum variance necessary for calibration studies, we analyzed a dataset comprising nine locations in three countries, over two years, different rye genotypes, and three ergot isolates. We repeated each combination in the field experiment on two plots (replications).

3.1. Environment (Location × Year Combination) Has a High Impact

Ergot occurs naturally only sporadically and becomes a problem during wet and rainy weather conditions throughout the flowering stage [53]. Moist weather conditions around the time of meiosis have a negative effect on the production, viability, and movement of the pollen. Furthermore, honeydew becomes thick under warm and sunny conditions, which reduces ergot infections considerably [33]. Previous studies reported on a high influence of the environment on the ergot infection for sorghum (Claviceps africana) [54,55,56] and rye (C. purpurea) [20,34,57,58]. In our study, mean ergot severity showed a very large variation between environments ranging from 0.06% to 6.46% that might be caused by differences in weather despite artificial infection. These differences due to environments are highly significant, but clearly not predictable. The same location might have a low ergot severity in one year and a high severity in another year like WUL in our study (Figure 1). Therefore, we had highly differing ergot severities and EA contents according to the specific location × year combination. This explains, to some extent, the wide variation shown in Figure 1 and accords with the analysis of variance where the environment was the most important factor. The high genotype-by-environment interaction for ergot severity illustrates, once again, the necessity of multi-locational field trials [20,34,57,58]. One part of the environmental variation could be explained by the fact that ergot severity also depends on pollen shedding. Pollen shedding is affected by weather conditions as well [33]. With regard to the EA concentration, the mean ergot severity of an environment did not show any covariation with the mean level of EA concentration (Figure 1). For example, KOS 2019 and WOH 2019 nearly had the same ergot severity but differed in EA contents. On the other hand, the high EA contents of KLE 2019 or even PET and WUL 2019 are not mirrored in their ergot severity.
Ergot severity and EA content determined by HPLC had appreciable high heritabilities illustrating a strong genetic effect of these traits. EA contents determined by ELISA showed a moderate heritability only, which was likely caused by error-sensitive, adverse effects such as cross-reactivity or matrix effects. In conclusion, a clear influence of the environment affecting the ergot reaction and EA content measured by HPLC was detected.

3.2. Isolates Affect Ergot Severity and EA Formation in a Host-Unspecific Way

The isolates affected ergot severity and EA content measured by HPLC significantly, confirming earlier results [20]. The country-specific isolates in the balanced subset II in 2018 and across both years showed a similar ergot severity, but large differences concerning their EA quantity. Notably, the Austrian isolate produced a considerably higher EA quantity than the other isolates from Germany and Poland. In addition, Tittlemier et al. [59] showed that the isolate was a significant factor affecting EA concentrations in wheat sclerotia. Cagaš and Macháč [60] demonstrated for Kentucky bluegrass that isolates from different continents vary in their aggressiveness. Furthermore, Menzies et al. [19] showed a high pathogenic variation and significant differences among ergot isolates, according to the geographic origin in wheat. In this study, no significant genotype-by-isolate interaction was detected for all traits, i.e., the genotypes reacted similarly to the three isolates. Thus, the origin of the isolate must not be considered with a high effort in future testing systems, but the aggressiveness of the inoculum is crucial for an optimal differentiation of the genotypes. Additionally, EAs do not seem to act as major virulence factors in the infection process because an increased EA content of an isolate does not reflect a higher disease severity. In this context, studies have to be done to investigate the virulence impact of EAs in the biology of the fungal infection process, e.g., with EA defective Claviceps strains. In the literature, it is discussed that EAs are important for resistance of the fungus against insects [6], mammals [8], or microbes [9]. However, the ecological function of the EAs is not entirely clarified yet. Therefore, further approaches are needed to reveal the general role of EAs for the lifestyle of the fungus. Remarkably, all three country-specific isolates showed a similar EA spectrum.

3.3. EA Spectrum Was Rather Stable across Years and Isolates

EA spectrum was rather similar for isolates and years. In the majority of cases, the amount of the -inine epimers of the respective EA was clearly lower compared to the -ine epimer, as already demonstrated by Franzmann et al. [61]. Despite the -inine forms being mentioned to be biologically inactive, EAs are able to epimerize under various conditions (alkaline, acidic) [15]. The -inine forms can also re-interconvert in the primary form during processing [15]. In contrast, Diana Di Mavungu et al. [62] demonstrated that epimerization was minimal during the analytical process. Additionally, some EAs seems to be more stable regarding epimerization than others [63]. In our study, ergocristinine and ergotaminine showed higher amounts than the respective -ine epimers in a few cases. The mechanisms of epimerization are not fully clarified yet [63], but this shift towards the - inine forms might be caused by specific conditions (heat, solvent solution, light) during the growing season, processing, or analysis. Nevertheless, it is known that the main EAs as well as their -inine forms are considered in future regulations to be caused by their ability for epimerization [15].
In the EA spectrum, a shift of ergometrine and ergotamine in subset I occurred across the years. Notably, higher amounts for ergometrine were detected in 2019 than in the previous year and, for ergotamine, the opposite occurred. An explanation could be different environmental, climate, or nutritional conditions during the growing season, which possibly affect the formation of individual EAs. The higher values of the ELISA analysis indicate a higher diversity for the EAs and metabolites when compared to the HPLC. Ergocornine and α-ergocryptine were detected as prime EAs in our HPLC study, whereas ergocristinine could be found only in traces. In literature, the abundance of individual EAs varies with the experiment. According to European Food Safety Authority (EFSA) [15], ergotamine, ergocristine, ergosine, and ergocornine were generally found to be more abundant than α-ergocryptine and ergometrine. Additionally, Mulder et al. [27] detected α-ergocryptine as major EA, followed by ergosine, ergocornine, and ergotamine. In commercially available rye flour and rye products, ergocristine and ergotamine were found to be the major EAs [28,61,64]. In diverse cereal samples, ergosine occurred most frequently, while the highest levels were observed for ergotamine, ergocristine, or ergosine, depending on the product type [62]. In contrast, Blaney et al. [65] determined ergotamine as the most prominent EA in Australian rye and ergocristine was only present in very small amounts. It is well known that different isolates can produce different types of alkaloids [33]. However, in our study, all three isolates had a similar pattern. In Epichloë, gains and losses of EA-influencing genes led to chemotypic variation [13]. Thus, changes and shifting of the EA spectrum seem to occur regularly.

3.4. Covariation of Ergot Severity and EA Content is Moderate

The covariation between ergot severity and EA content will get a great importance when the EU limits for ergot in cereals will be based on EA concentrations because their determination by HPLC is costly and time consuming. Therefore, there would be a high economic extra load, if all samples are determined by this approach. A reasonably narrow correlation would allow us to identify grain lots with low ergot incidence and to concentrate the HPLC analyses on those samples with an EA level just above the limit. If this correlation is not useful, a rapid determination of EA concentrations by ELISA would be a good alternative. This technique could also be used by practical plant breeding companies to screen genotypes during the selection process. Therefore, we measured the EA content of our samples by both methods, the standard HPLC method, and one commercially available ELISA. HPLC analysis is a good and reliable tool for determining 12 EAs in a quantitative way [66], but the method needs a well-equipped laboratory with well-educated people [29,40]. In literature, ELISA approaches were already applied for evaluating EAs [67,68], but often with a lower number of samples and especially in the context of fescue toxicosis in livestock [69,70,71].
In our study, the results of the ErgoREAD ELISA analyses showed considerably higher EA contents for almost all samples when compared to HPLC with a notably high deviation in 2019. Accordingly, the distribution of the EA contents was completely different, as nearly all ELISA samples (92%) contained more than 1 mg/kg. Clearly, both methods measure EA concentrations in a completely different way. HPLC analysis determines the concentration of 12 main EAs, consisting of ergometrine, ergotamine, ergosine, ergocristine, α-ergocryptine, ergocornine, and the corresponding -inine epimers in a quantitative way [40]. In contrast, this ELISA is a qualitative method and measures lysergic acid as a progenitor in the EA pathway [32]. However, in the literature, >80 EAs are reported [5,10], so that, the individual 12 EAs analyzed by HPLC are only a subset of all existing EAs. Consequently, it is reasonable that the ELISA results overestimate the HPLC results. In this context, a varying consensus between both methods is also imaginable because the relative amount of the 12 analyzed EAs on all EAs can differ according to environmental conditions. Roberts et al. [70] already demonstrated that ergovaline concentrations determined by HPLC do not always correspond to the EA concentrations determined by ELISA. In addition, it is conceivable that matrix effects or cross-reactivity of components, which are comparable in structure falsify the results. Furthermore, the amount of cross-reactivity might vary between different groups of EAs [66] and usually ELISA approaches are less specific and accurate than HPLC methods [30]. However, all these factors cannot explain the 43-fold difference, on average, in EA concentrations between both methods (Table 1).
A comparison of three commercially available ELISA kits [30] showed that two out of three ELISA tests considerably overestimated the EA contents in flour in most cases when following the original protocol. The highest amounts were often found with the ErgoREAD ELISA. In addition, only one kit was reliable in a narrow range from 100–500 µg/kg [30]. In our study, the ErgoREAD Elisa was performed according to the manufacturer recommendations. Furthermore, the extraction procedure and processing seem to have a high impact on the output and the working ranges of the commercially available ELISA kits that are often not large enough even for natural infections [30]. However, a high dilution factor as always necessary for samples from artificial inoculation adds an additional error.
The covariation between EA content measured either by HPLC or ErgoREAD ELISA was basically zero in our study (r = −0.04). Schnitzius et al. [71] also demonstrated that no consistent pattern between ELISA and HPLC existed for samples from Kentucky blue grass. This indicates a discrepancy in the analytical detection due to a higher cross reactivity in the ELISA in comparison to the limited detection of EAs in the HPLC. Splitting the dataset into the factors isolate, environment, genotype, or infection level (ergot severity <0.05% and ≥0.05%) revealed no better relationship between both methods. A cause could be the different spectrum of chemical compounds analyzed by both methods. The HPLC focuses on the 12 selected EAs and cannot detect lysergic acid based on precursors and metabolites, which are not covered by the HPLC, as it is the case for ergopetides like ergovaline or higher protein conjugates, which could occur in nature. However, previous studies showed in C. purpurea that ergovalines seem to occur only in very low quantities [15]. Using the ELISA for a rapid screening of the EAs might give a higher security not to underestimate the EA concentration in a sample.
The samples in this approach were assembled by considering relevant criteria such as genotypes, environments (locations, years, country), and isolates to receive a maximal variation regarding ergot severity and EA content. This is the usual procedure for calibration studies [66,72,73]. This study revealed only a moderate positive covariation between ergot severity and EA content determined by HPLC for both subsets, as previously demonstrated [27,69,74,75,76]. In our study, a large deviation from the regression reduced the coefficient of correlation to r = 0.53 (Figure S2a). A cause could be that, even in sclerotia of similar weight, the total amount of ergot alkaloids varied significantly [75]. The deviation is especially large for low ergot severities. For example, an ergot severity of 0.16% showed EA contents from 0.006 to 12.33 mg/kg. Conversely, with an EA content of 0.5 mg/kg, ergot severities varied from 0.01% to 9%. That implies that, for low EA concentrations, the prediction of the EA content based on the amount of ergot in grain is even more precarious, likely because the coefficient of (error) variation increases with declining EA concentrations [75]. Low EA concentrations, however, correspond even more to a practical situation than our study because screening studies of naturally infected rye and rye-derived products normally contain lower EA concentrations than those with artificial infection [1,17,26,27,28,29,36,77]. However, the grouping of samples after infection level (ergot severity <0.05% and ≥0.05%) did not improve the covariation in our study. The same is true for differentiating the samples according to genotype, environment, or isolate. Some locations showed high correlations, but this was often not stable across the years and is, therefore, not predictable for a single location. Although the Austrian isolate showed a high correlation for both years, this was not consistent for all other isolates. Therefore, a prognosis of the EA content based on the ergot amount is not possible because, in nature, there are always several isolates appearing.
In consequence, this study indicates that the EA content cannot be predicted in a reliable way based on ergot severity. Mulder et al. [27] and Schummer et al. [78] came to the same conclusion when analyzing a lower number of ergot samples from various cereals.

4. Conclusions

The isolates showed rather stable EA profiles even though they were obtained from three countries. There were slight differences among years. We got visible ergot infections in all environments. The ergot severity, however, cannot predict the EA concentrations in a given sample as measured by HPLC. This was even more clear for low ergot severities that are usually occurring in natural infections. Clearly, the EA contents have no relationship to disease severity and their absolute levels are not an important factor of the ergot infection in winter rye. Moreover, contents of individual EAs are most likely governed by different weather or physiological conditions than by ergot infection since only a moderate covariation could be found despite both traits having a similar high heritability when EA contents were measured by HPLC. To fulfill the future EU limits of 250 µg/kg for human consumption (except for baby food), HPLC analyses are necessary at least for those rye lots that visibly show some sclerotia. Many with a high sclerotia incidence will be rejected right away. However, even without visible infection in a sample, EAs might be present and may be caused by relocation within the ear or dust and abrasion from a few sclerotia during harvesting. The used ELISA did neither show a correlation to ergot severity nor to the EA concentrations measured by HPLC confirming previous findings. Further research is needed (1) to understand the factors influencing ergot infection more precisely as well as EA formation and their relationship and (2) to obtain a quick, cheap, and easy-to-use screening assay for the practical and commercial use. At the moment, the only recommendation could be for human consumption to concentrate on samples with minimal percentages of ergot sclerotia by visual means and to analyze them for their EA content by HPLC methods to meet the EU regulations.

5. Materials and Methods

5.1. Samples, Field Trials, and Inoculation Procedure

In total, 372 winter rye samples were used for this correlation study. The examined samples consisted of a diverse set of genotypes, locations, years, and isolates (Table 2). The following declaration is implemented in the study. Subset I consisted of all 372 winter rye samples and subset II consisted of 288 winter rye samples orthogonally distributed across genotypes, isolates, and environments (location-year combinations). The experiment was performed in 2018 and 2019 at the following 10 locations: Oberer Lindenhof (OLI), Braunschweig (BRS), Wohlde (WOH), Petkus (PET), Wulfsode (WUL), and Kleptow (KLE) in Germany, Zwettl-Edelhof (EHO), and Hagenberg (HAG) in Austria, Kościelna Wieś (KOS), and Zybiszów (ZYB) in Poland. BRS could not be analyzed in 2018 due to missing infections, and HAG in 2019 due to severe hail destroying the crop shortly before harvest. A detailed list of locations and their characteristics can be found in the Supplementary Material (Table S1). The experiment was completely randomized with two replicates in a chessboard-like design. Therefore, each entry plot was surrounded by four plots of triticale (×Triticosecale Wittm.) as “border plots” [34]. Depending on the location, the size of the large-drilled plots ranged from 5.0 to 7.04 m2. The varieties were supplied by the respective breeding companies (Table 2). Local triticale cultivars were grown as border plots.
Genotypes were inoculated with each of three inocula collected from sclerotia of infected rye in Germany (DE), Poland (PL), and Austria (AT) at nine locations in 2018 and 2019, comprising subset II. They were planted as split-plot design (main plot = isolate, subplot = genotype). Additionally, six other genotypes were inoculated at OLI in both years with the German isolate only and 15 factorial crosses (FC(15)) largely differing for their amount of pollen shedding with a mix of all three isolates (Table 2).
Seed density amounted to about 200 kernels/m2 and sowing was done from mid-September to early October. Mineral fertilizers, herbicides, growth regulators, and fungicides were applied at each location in a conventional way. For inoculum production for both years of field testing, each country sent ergot samples in 2017 to the lab of B. Rodemann to ensure that the same inoculum was used for both years. The ergot samples were collected from rye stands from the main growing areas. As previously described in detail by Miedaner et al. [79], all inocula were produced for all location sites and years by Julius Kühn-Institute, Institute for Plant Protection in Field Crops and Grassland (Braunschweig, Germany) (JKI) by isolating Claviceps purpurea, according to Kirchhoff [80] and producing conidia suspension for inoculation on wheat-grain medium, according to Mielke [81] and Engelke [82]. Inoculation was started when the earliest 30% of the plots were fully flowering (BBCH 65, [83]) via spraying with a machine-driven field sprayer in the evening (5:30–9 p.m.) or in the morning (8–10:30 a.m.), repeated up to five times within a one-day to four-day interval, according to the temperature. The aim was that all plots were inoculated at least once at their respective flowering time. Harvesting was done by cutting a 1-m2 subplot from the middle of the large plot by hand at the dough ripening stage (BBCH 85–89) using only primary tillers. Afterward, all heads of one plot were air dried (30 °C) and threshed by a large single-head thresher (Pelz K 35, Saatzuchtbedarf Baumann, Waldenburg, Germany).

5.2. Sample Preparation

All sclerotia fragments were sorted out by hand or by an optical sorting machine (SATAKE Pikasen FMS 2000 F (2017/18)/ ANYSORT G64 #G64A-G112 (2018/19), Ruttmann, Hamburg, Germany) depending on the cooperation partner and the components (grain, ergot) were weighed to calculate ergot severity as a percentage of sclerotia relative to the total grain sample by weight. Afterward, a sub-sample of 200 g of grain and sclerotia were merged regarding the original ergot severity. This procedure was necessary because the samples from field plots were too large to handle. The 200-g sub-samples were milled (Ultra Centrifugal Mill ZM 200, 1 mm sieve, Retsch, Haan, Germany) and the flour was divided for HPLC and ELISA analyses.

5.3. High Performance Liquid Chromatography (HPLC) Analysis of EAs

HPLC analysis was conducted by the Austrian Agency for Health and Food Safety, Institute for Food Safety Linz, (AGES, Linz, Austria). Wet-chemical extraction, purification, and HPLC analysis were done according to BVL L 15.01/02-5:2012-01 [84] with some modifications. Briefly, EAs of 20 g flour were extracted with 100 mL of extraction solvent consisting of ethyl acetate (C4H8O2)/methanol (CH3OH)/ammonia (NH3, 25%)/isopropyl alcohol (C3H8O) (75/5/7/7 (v/v/v/v)). Purifying of the extract with a solid-phase column (Alumina B) is followed by concentrating. EAs were separated using a Zorbax Eclipse XDB-C18-HPLC-column (Agilent, Santa Clara, CA, USA) (Flow: 1 mL/min, Eluent: acetonitrile (C2H3N)/ ammonium carbamate (CH6N2O2) solution 0.2 g/L, 50/50 (v/v)) and detected via Fluorescence detection (excitation λEx: 330 nm, emission λEm 415 nm). Calculating EA content was done by 3-point calibration and including multipliers according to the processing steps in the lab. The examined 12 EAs were: ergometrine, ergometrinine, ergosine, ergosinine, ergotamine, ergotaminine, ergocornine, ergocorninine, α-ergocryptine, α-ergocryptinine, ergocrystine, and ergocrystinine. For calculating the EA content, all individual EAs were summed up. In the following, the terms “ergot alkaloid content (determined) by HPLC” refer to the sum of these 12 EAs. All individual EA values below the limit of quantitation (LOQ < 0.02 mg/kg) were considered as zero. EHO 2018 showed no detectable level of EAs even though all samples were independently analyzed two times and was, therefore, not included in the respective analyses.

5.4. Enzyme-Linked Immunosorbent Assay (ELISA) of EAs

ErgoREAD ELISA, known as a competitive ELISA for detection of EAs in wheat, rye, and triticale samples, was purchased from LCTech GmbH (Daimlerstraße 4, Obertaufkirchen, Germany) and the analysis was performed at UHOH. A wet-chemical extraction of the EAs was carried out by mixing 20 g of the flour with 50 mL methanol (CH3OH)/ phosphoric acid (H3PO4, 0.25%) (40/60 (v/v)) and shaking for 20 min (165 rpm, Orbital Shaker 3017, GFL Gesellschaft für Labortechnik GmbH, Burgwedel, Germany). The extract was filtered by rinsing through glass funnels with filter papers (Qualitative circles, 150 mm Ø, Cat No 1001 150, Whatman, Maidstone, United Kingdom). After dilution, the samples were filtered again with a syringe filter (pore size: 0.45 µmm, ø 15 mm, unster., PTFE, Rotilabo®, Roth, Karlsruhe, Germany) to remove all suspended solids. This was followed by proceeding the protocol of the ELISA Kit, measuring the extinction values by a microplate reader (Sunrise, Tecan Group Ltd., Männedorf, Switzerland) using the integrated Magellan software (Tecan Group Ltd., Männedorf, Switzerland) relative to the standard samples (0 ppb, 0.025 ppb, 0.1 ppb, 0.25 ppb, 0.5 ppb, 0.75 ppb, 1 ppb), covering the range from 0 to 5 ppm after taking the sample dilution factor into account. Higher concentrations of EAs could be analyzed by further sample dilution. Calculating the EA content was based on the company-owned software of LCTech GmbH (Obertaufkirchen, Germany). All samples were analyzed in duplicate.

5.5. Statistical Analyses

Single-plot data were used as a basis for all analyses. According to Bernal-Vasquez et al. [85], outlier tests were performed and detected outliers were considered as missing values. For conducting analyses of variance (ANOVA), a square-root transformation was done for all traits because the residuals were not normally distributed in any environment for biological reasons. ANOVA was first done for each location separately and, second, combined across locations for each trait using standard procedures [86]. For all ANOVAs, the effect of the factors ‘genotype’ and ‘isolate’ were considered as fixed and the factors ‘replication’ and ‘environment’ as random. A significance level of 0.05 or 0.01 was applied to all statistical calculations. The estimates of the ANOVA of the ratio of genotypic to phenotypic variance considering the number of replicates were used to calculate repeatability for each environment and entry-mean heritability (H2) across all environments considering the number of replicates and environments, respectively [87]. The software packages R [88] and R-Studio (Version 3.5.1) [89] were used to perform the outlier test and ANOVAs for calculating the means and graphic visualization. The overall means reported in the tables were back-transformed. In the figures, the original means are reported. Multiple testing was conducted by a Tukey test as implemented in the R-studio.

Supplementary Materials

The following are available online at https://www.mdpi.com/2072-6651/12/11/676/s1. Figure S1: Correlation of the replications (repeatability) of subset I of (a) ergot severity (%), and EAs measured with (b) HPLC, and (c) ELISA. Figure S2: Correlation of subset I after inoculation with C. purpurea across 18 environments between (a) ergot severity (%) and EA content determined by ELISA (mg/kg) and (b) EA content determined by HPLC and ELISA (mg/kg) (r = coefficient of correlation). Table S1: Location site, country, abbreviation, and characteristics of all field trials. Table S2: Means, ranges (in brackets), and least significant difference (LSD5%) for ergot severity (%), EAs (mg/kg) determined by HPLC, and ELISA for each genotype after inoculation with C. purpurea across 15 environments in subset II. Table S3: Estimates of variance components and entry-mean heritabilities for ergot severity (sq transf. = square root transformed) and EA contents determined by HPLC and ELISA after inoculation with C. purpurea across 15 environments in subset II. Table S4: Mean for ergot severity (%) and EAs (mg/kg) determined by HPLC and ELISA of subset II for each genotype and country-specific isolate (DE = German isolate, PL = Polish isolate, AT = Austrian isolate) across eight locations in 2018 and 2019. Table S5: Content (mg/kg, average) of single EAs determined with HPLC of subset I after inoculation with C. purpurea for 2018 and 2019.

Author Contributions

Conceptualization, T.M. Methodology, T.M. Software, A.K. Validation, A.K. and T.M. Formal Analysis, A.K. Lab analysis: A.K. and A.R. Inoculum production: B.R. Investigation, A.K., M.O., B.R., A.T., J.D., M.K., B.S., J.E., A.G., D.S., F.J.F., F.W., E.Z., M.N., and T.M. Resources, A.K., M.O., B.R., A.T., J.D., M.K., B.S., J.E., A.G., D.S., F.J.F., F.W., E.Z., M.N., and T.M. Data Curation, A.K. and T.M. External and professional contact for ELISA analysis: F.N.W. Writing—Original Draft Preparation, A.K. and T.M. Writing—Review & Editing, T.M. Visualization, A.K. Supervision, T.M. Project Administration, T.M. Funding Acquisition, T.M. All authors have read and agree to the published version of the manuscript.

Funding

Funding was provided in Germany by the Federal Ministry for Economic Affairs and Energy on the basis of a decision by the German Bundestag via the German Federation of Industrial Research Associations (AiF) in the frame of Industrial Collective Research (IGF- No. 188EN/1) and by the Gemeinschaft zur Förderung von Pflanzeninnovation e. V. In Poland, funding was provided by Narodowe Centrum Badan i Rozwoju (NCBIR) in cooperation with the Polish Seed Association (PIN, CORNET/21/2/2016). In Austria, the funders were the Austrian Research Promotion Agency (FFG) and Saatzucht Edelhof in cooperation with Saatgut Austria.

Acknowledgments

The authors thank the teams at the respective locations for their excellent technical work.

Conflicts of Interest

The authors declare no conflict of interest. F.N.W is the representative of the ErgoREAD ELISA manufacturer.

References

  1. Wegulo, S.N.; Carlson, M.P. Ergot of Small Grain Cereals and Grasses and its Health Effects on Humans and Livestock. 2011. University of Nebraska, Extension, EC1880. Available online: http://ianrpubs.unl.edu/live/ec1880/build/ec1880.pdf (accessed on 9 March 2020).
  2. Food and Agriculture Organization of the United Nations (FAO). FAOSTAT. 2020. Available online: http://www.fao.org/faostat/en/#data/QC (accessed on 12 March 2020).
  3. Money, N.P. Fungi and biotechnology. In The Fungi, 3rd ed.; Watkinson, S.C., Boddy, L., Money, N.P., Eds.; Academic Press: Cambridge, MA, USA, 2016; ISBN 9780123820341. [Google Scholar] [CrossRef]
  4. Florea, S.; Panaccione, D.G.; Schardl, C.L. Ergot alkaloids of the family Clavicipitaceae. Phytopathology 2017, 107, 504–518. [Google Scholar] [CrossRef] [Green Version]
  5. Schiff, P.L. Ergot and its alkaloids. Am. J. Pharm. Educ. 2006, 70, 98. [Google Scholar] [CrossRef] [PubMed]
  6. Potter, D.A.; Stokes, J.T.; Redmond, C.T.; Schardl, C.L.; Panaccione, D.G. Contribution of ergot alkaloids to suppression of a grass-feeding caterpillar assessed with gene knockout endophytes in perennial ryegrass. Entomol. Exp. Appl. 2008, 126, 138–147. [Google Scholar] [CrossRef]
  7. Panaccione, D.G.; Arnold, S.L. Ergot alkaloids contribute to virulence in an insect model of invasive aspergillosis. Sci. Rep. 2017, 7, 8930. [Google Scholar] [CrossRef] [PubMed]
  8. Panaccione, D.G.; Cipoletti, J.R.; Sedlock, A.B.; Blemings, K.P.; Schardl, C.L.; Machado, C.; Seidel, G.E. Effects of ergot alkaloids on food preference and satiety in Rabbits, as assessed with gene-knockout endophytes in perennial ryegrass (Lolium perenne). J. Agric. Food Chem. 2006, 54, 4582–4587. [Google Scholar] [CrossRef] [PubMed]
  9. Venkatesh, N.; Keller, N.P. Mycotoxins in conversation with bacteria and fungi. Front. Microbiol. 2019, 10, 403. [Google Scholar] [CrossRef]
  10. Křen, V.; Cvak, L. Ergot: The Genus Claviceps; Harwood Academic Publishers: Amsterdam, The Netherlands, 1999; pp. 173–200. [Google Scholar] [CrossRef]
  11. Jakubczyk, D.; Cheng, J.Z.; O’Connor, S.E. Biosynthesis of the ergot alkaloids. Nat. Prod. Rep. 2014, 31, 1328. [Google Scholar] [CrossRef]
  12. Schardl, C.L.; Panaccione, D.G.; Tudzynski, P. Ergot alkaloids—Biology and molecular biology. Alkaloids. Chem. Biol. 2006, 63, 45–86. [Google Scholar] [CrossRef]
  13. Young, C.A.; Schardl, C.L.; Panaccione, D.G.; Florea, S.; Takach, J.E.; Charlton, N.D.; Moore, N.; Webb, J.S.; Jaromczyk, J. Genetics, genomics and evolution of ergot alkaloid diversity. Toxins 2015, 7, 1273–1302. [Google Scholar] [CrossRef] [Green Version]
  14. Battilani, P.; Costa, L.G.; Dossena, A.; Gullino, M.L.; Marchelli, R.; Galaverna, G.; Pietri, A.; Dall’Asta, C.; Giorni, P.; Spadaro, D.; et al. Scientific Information on Mycotoxins and Natural Plant Toxicants. 2009. Scientific/Technical Report Submitted to EFSA. Available online: http://onlinelibrary.wiley.com/doi/10.2903/sp.efsa.2009.EN-24/pdf (accessed on 12 March 2020).
  15. European Food Safety Authority (EFSA). Scientific Opinion on Ergot Alkaloids in Food and Feed. EFSA Panel on Contaminants in the Food Chain (CONTAM). 2012. EFSA 10: 2798. Available online: http://onlinelibrary.wiley.com/doi/10.2903/j.efsa.2012.2798/pdf (accessed on 12 March 2020).
  16. Krska, R.; Crews, C. Significance, chemistry and determination of ergot alkaloids: A review. J. Food Contam. 2008, 25, 722–731. [Google Scholar] [CrossRef]
  17. Malysheva, S.V.; Larionova, D.A.; Di Mavungu, J.D.; De Saeger, S. Pattern and distribution of ergot alkaloids in cereals and cereal products from European countries. World Mycotoxin J. 2014, 7, 217–230. [Google Scholar] [CrossRef]
  18. Lin, W.; Kuang, Y.; Wang, J.; Duan, D.; Xu, W.; Tian, P.; Nzabanita, C.; Wang, M.; Li, M.; Ma, B. Effects of seasonal variation on the alkaloids of different ecotypes of Epichloë endophyte-Festuca sinensis associations. Front. Microbiol. 2019, 10, 1695. [Google Scholar] [CrossRef] [Green Version]
  19. Menzies, J.G.; Klein-Gebbinck, H.W.; Gordon, A.; O’Sullivan, D. Evaluation of Claviceps purpurea isolates on wheat reveals complex virulence and host susceptibility relationships. Can. J. Plant Pathol. 2017, 39, 307–317. [Google Scholar] [CrossRef]
  20. Kodisch, A.; Wilde, P.; Schmiedchen, B.; Fromme, F.J.; Rodemann, B.; Tratwal, A.; Oberforster, M.; Wieser, F.; Schiemann, A.; Jørgensen, L.N.; et al. Ergot infection in winter rye hybrids shows differential contribution of male and female genotypes and environment. Eupyhtica 2020, 216, 65. [Google Scholar] [CrossRef] [Green Version]
  21. Crews, C. Analysis of ergot alkaloids. Toxins 2015, 7, 2024–2050. [Google Scholar] [CrossRef] [PubMed] [Green Version]
  22. Flieger, M.; Wurst, M.; Shelby, R. Ergot alkaloids—Sources, structures and analytical methods. Folia Microbiol. 1997, 42, 3–30. [Google Scholar] [CrossRef] [PubMed]
  23. Scott, P.M. Analysis of ergot alkaloids—A review. Mycotoxin Res. 2007, 23, 113–121. [Google Scholar] [CrossRef]
  24. Schardl, C.L. Introduction to the toxins special issue on ergot alkaloids. Toxins 2015, 7, 4232–4237. [Google Scholar] [CrossRef] [Green Version]
  25. Debegnach, F.; Patriarca, S.; Brera, C.; Gregori, E.; Sonego, E.; Moracci, G.; De Santis, B. Ergot alkaloids in wheat and rye derived products in Italy. Foods 2019, 8, 150. [Google Scholar] [CrossRef] [Green Version]
  26. Meister, U.; Batt, N. Fusarium Toxins and Ergot Alkaloids in Rye of the Federal State Brandenburg Harvested 2013. In Proceedings of the 36th Mycotoxin Workshop, Göttingen, Germany, 16 June 2014; p. 131. Available online: http://www.mycotoxin-workshop.de/36th_Mycotoxin_Workshop_2014_-Proceedings.pdf (accessed on 12 March 2020).
  27. Mulder, P.P.J.; van Raamsdonk, L.W.D.; van Egmond, H.J.; Voogt, J.; van Brakel, M.W.; van der Horst, G.M.; de Jong, J. Dutch Survey Ergot Alkaloids and Sclerotia in Animal Feeds. Report 2012.005. RIKILT. 2012. Available online: http://edepot.wur.nl/234699 (accessed on 12 March 2020).
  28. Müller, C.; Kemmlein, S.; Klaffke, H.; Krauthaus, W.; Preiß-Weigert, A.; Wittkowski, R. A basic tool for risk assessment: A new method for the analysis of ergot alkaloids in rye and selected rye products. Mol. Nutr. Food Res. 2009, 53, 500–550. [Google Scholar] [CrossRef]
  29. Ruhland, M.; Tischler, J. Determination of ergot alkaloids in feed by HPLC. Mycotoxin Res. 2008, 24, 73–79. [Google Scholar] [CrossRef] [PubMed]
  30. Veršilovskis, A.; Pereboom-de Fauw, D.P.K.H.; Smits, N.; Mulder, P.P.J.; Mol, H.; de Nijs, M. EURL-MP-report_001. Screening of Ergot Alkaloids by ELISA Test Kits Available on the Market. 2019. EURL Mycotoxins and Plant Toxins, Wageningen Food Safety Research, Part of Wageningen University & Research. Available online: https://www.wur.nl/en/show/EURL-MP-report_001-Screening-of-ergot-alkaloids-using-ELISA-kits.htm (accessed on 12 October 2020).
  31. Cell Signaling Technology (CST). Overview of Enzyme-Linked Immunosorbent Assay (ELISA). 2020. Available online: https://en.cellsignal.de/contents/_/overview-of-enzyme-linked-immunosorbent-assay-(elisa)/elisa-educational (accessed on 12 March 2020).
  32. LCTech. ELISA Rapid Test ErgoREAD. 2020. Available online: https://www.lctech.de/en/products/elisa-rapid-test-ergoread.html (accessed on 11 March 2020).
  33. Miedaner, T.; Geiger, H.H. Biology, genetics, and management of ergot (Claviceps spp.) in rye, sorghum, and pearl millet. Toxins 2015, 7, 659–678. [Google Scholar] [CrossRef] [PubMed] [Green Version]
  34. Miedaner, T.; Mirdita, V.; Rodemann, B.; Drobeck, T.; Rentel, D. Genetic variation of winter rye cultivars for their ergot (Claviceps purpurea) reaction tested in a field design with minimized interplot interference. Plant Breed. 2010, 129, 58–62. [Google Scholar] [CrossRef]
  35. Hulvová, H.; Galuszka, P.; Frébortová, J.; Frébort, I. Parasitic fungus Claviceps as a source for biotechnological production of ergot alkaloids. Biotechnol. Adv. 2013, 31, 79–89. [Google Scholar] [CrossRef]
  36. Van Dongen, P.W.; de Groot, A.N. History of ergot alkaloids from ergotism to ergometrine. Eur. J. Obs. Gynecol. Reprod. Biol. 1995, 60, 109–116. [Google Scholar] [CrossRef]
  37. Coufal-Majewski, S.; Stanford, K.; McAllister, T.; Blakley, B.; McKinnon, J.; Chaves, A.V.; Wang, Y. Impacts of cereal ergot in food animal production. Front. Vet. Sci. 2016, 3, 15. [Google Scholar] [CrossRef] [Green Version]
  38. European Communities. Directive 2002/32/EC of the European parliament and of the council of 7 May 2002 on undesirable substances in animal feed. Off. J. Eur. Communities 2002, L140, 10–22. [Google Scholar]
  39. European Union. Commission Regulation (EU) 2015/1940 of 28 October 2015 Amending Regulation (EC) No 1881/2006 as Regards Maximum Levels of Ergot Sclerotia in Certain Unprocessed Cereals and the Provisions on Monitoring and Reporting. Off. J. Eur. Union 2015, L283, 3. [Google Scholar]
  40. Beuerle, T.; Benford, D.; Brimer, L.; Cottrill, B.; Doerge, D.; Dusemund, B.; Farmer, P.; Fürst, P.; Humpf, H.; Mulder, P.P.J. Scientific opinion on ergot alkaloids in food and feed. EFSA J. 2012, 10, 2798–2956. [Google Scholar] [CrossRef]
  41. Byrd, N.; Slaiding, I.R. Final Project Report: Monitoring of Mycotoxins and Other Contaminants in UK Cereals Used in Malting, Milling and Animal Feed. AHDB PR578. 2017. Available online: https://ahdb.org.uk/final-project-report-contaminants-monitoring-150517 (accessed on 12 March 2020).
  42. MacDonald, S.J.; Anderson, W.A.C. Final Project Report: A Desk Study to Review Current Knowledge on Ergot Alkaloids and Their Potential for Contamination to Cereal Grains. AHDB PR575. 2017. Available online: https://ahdb.org.uk/a-desk-study-to-review-current-knowledge-on-ergot-alkaloids-and-their-potential-for-contamination-to-cereal-grains (accessed on 12 March 2020).
  43. Gordon, A.; Delamare, G.; Tente, E.; Boyd, L. Final Project Report: Determining the Routes of Transmission of Ergot Alkaloids in Cereal Grains. AHDB PR603. 2019. Available online: https://ahdb.org.uk/determining-the-routes-of-transmission-of-ergot-alkaloids-in-cereal-grains (accessed on 12 March 2020).
  44. Topi, D.; Jakovac-Strajn, B.; Pavšič-Vrtač, K.; Tavčar-Kalcher, G. Occurrence of ergot alkaloids in wheat from Albania. Food Addit. Contam. Part A 2017, 34, 1333–1343. [Google Scholar] [CrossRef]
  45. Bryła, M.; Ksieniewicz-Woźniak, E.; Waśkiewicz, A.; Podolska, G.; Szymczyk, K. Stability of ergot alkaloids during the process of baking rye bread. LWT 2019, 110, 269–274. [Google Scholar] [CrossRef]
  46. Meleard, B. Degradation and Epimerization of Wheat Ergot Alkaloids during French Baking Test. 2016. Available online: https://www.english.arvalisinstitutduvegetal.fr/file/galleryelement/pj/84/76/8a/c1/meleardalkaloids_and_bread_mytox739905815900991417.pdf (accessed on 12 March 2020).
  47. Tittlemier, S.A.; Drul, D.; Roscoe, M.; Turnock, D.; Taylor, D.; Fu, B.X. Fate of ergot alkaloids during laboratory scale durum processing and pasta production. Toxins 2019, 11, 195. [Google Scholar] [CrossRef] [Green Version]
  48. Canadian Grain Commission. Harvest Survey of Canadian Grain Quality. 2013. Available online: http://www.grainscanada.gc.ca/quality-qualite/hsp-per/hs-er-eng.html (accessed on 12 March 2020).
  49. Alderman, S. Ergot: Biology and Control. 2006. Available online: http://www.ars.usda.gov/SP2UserFiles/person/81/ErgotDVDtranscript.pdf (accessed on 4 September 2020).
  50. Gordon, A.; Basler, R.; Bansept-Basler, P.; Fanstone, V.; Harinarayan, L.; Grant, P.K.; Birchmore, R.; Bayles, R.A.; Boys, L.A.; O’Sullivan, D.O. The identification of QTL controlling ergot sclerotia size in hexaploid wheat implicates a role for the Rht dwarfing alleles. Theor. Appl. Genet. 2015, 128, 2447–2460. [Google Scholar] [CrossRef] [PubMed]
  51. Gordon, A.; McCartney, C.; Knox, R.E.; Ereful, N.; Hiebert, C.W.; Konkin, D.J.; Hsueh, Y.C.; Bhadauria, V.; Sgroi, M.; O’Sullivan, D.M.; et al. Genetic and transcriptional dissection of resistance to Claviceps purpurea in the durum wheat cultivar Greenshank. Theor. Appl. Genet. 2020, 133, 1873–1886. [Google Scholar] [CrossRef] [Green Version]
  52. Dung, J.K.S.; Cheng, Q.; Kaur, N.; Walenta, D.L.; Cating, R.A.; Rondon, S.I.; Frost, K.E.; Alderman, S.C.; Hamm, P.B. Population biology and epidemiology of Claviceps purpurea in cool-season grass seed crops. In Proceedings of the 10th International Seed Conference, Corvallis, OR, USA, 12–19 May 2019; p. 78. [Google Scholar]
  53. Menzies, J.G.; Turkington, T.K. An overview of the ergot (Claviceps purpurea) issue in western Canada: Challenges and solutions. Can. J. Plant Pathol. 2015, 37, 40–51. [Google Scholar] [CrossRef]
  54. Wang, E.; Meinke, H.; Ryley, M.; Herde, D.; Henzell, B. On the relation between weather variables and sorghum ergot infection. Aust. J. Agric. Res. 2000, 51, 313–324. [Google Scholar] [CrossRef]
  55. Workneh, F.; Rush, C.M. Evaluation of relationships between weather patterns and prevalence of sorghum ergot in the Texas panhandle. Phytopathology 2002, 92, 659–666. [Google Scholar] [CrossRef] [Green Version]
  56. Workneh, F.; Rush, C.M. Weather factors associated with development of sorghum ergot in the Texas panhandle. Plant Dis. 2006, 90, 717–722. [Google Scholar] [CrossRef] [Green Version]
  57. Dhillon, B.S.; Mirdita, V.; Miedaner, T. Preliminary evaluation of locations for conducting selection for resistance to ergot (Claviceps purpurea) in rye. Indian J. Genet. Pl. Br. 2010, 23, 265–268. [Google Scholar]
  58. Mirdita, V.; Miedaner, T. Resistance to ergot in self-incompatible germplasm resources of winter rye. J. Phytopathol. 2009, 157, 350–355. [Google Scholar] [CrossRef]
  59. Tittlemier, S.A.; Drul, D.; Roscoe, M.; Menzies, J.G. The effect of selected factors on measured ergot alkaloid content in Claviceps purpurea-infected hexaploid and durum wheat. World Mycotoxin J. 2016, 9, 555–564. [Google Scholar] [CrossRef]
  60. Cagaš, B.; Macháč, R. Different pathogenicity of ergot isolates (Claviceps purpurea [Fr.] Tul.) on Kentucky bluegrass (Poa pratensis L.). Plant Prot. Sci. 2002, 38, 18–22. [Google Scholar] [CrossRef] [Green Version]
  61. Franzmann, C.; Wächter, J.; Dittmer, N.; Humpf, H.S. Ricinoleic acid as a marker for ergot impurities in rye and rye products. J. Agric. Food Chem. 2010, 58, 4223–4229. [Google Scholar] [CrossRef] [PubMed]
  62. Di Mavungu, D.J.; Malysheva, S.V.; Sanders, M.; Larionova, D.; Robbens, J.; Dubruel, P.; Peteghem, C.V.; De Saeger, S. Development and validation of a new LC–MS/MS method for the simultaneous determination of six major ergot alkaloids and their corresponding epimers. Application to some food and feed commodities. Food Chem. 2012, 135, 292–303. [Google Scholar] [CrossRef]
  63. Schummer, C.; Zandonella, I.; van Nieuwenhuyse, A.; Moris, G. Epimerization of ergot alkaloids in feed. Helyion 2020, 6. [Google Scholar] [CrossRef]
  64. Kniel, B.; Meißner, M.; Koehler, P.; Schwake-Anduschus, C. Studies on the applicability of HPLC-FLD and HPLC–MS/MS for the determination of ergot alkaloids in rye-containing breads. J. Consum. Prot. Food S. 2018, 13, 69–78. [Google Scholar] [CrossRef]
  65. Blaney, B.J.; Molloy, J.B.; Brock, I.J. Alkaloids in Australian rye ergot (Claviceps purpurea) sclerotia: Implications for food and stockfeed regulations. Anim. Prod. Sci. 2009, 49, 975–982. [Google Scholar] [CrossRef]
  66. Shi, H.; Yu, P. Exploring the potential of applying infrared vibrational (micro)spectroscopy in ergot alkaloids determination: Techniques, current status, and challenges. Appl. Spectrosc. Rev. 2018, 53, 395–419. [Google Scholar] [CrossRef]
  67. Shelby, R.A.; Kelley, V.C. Detection of ergot alkaloids from Claviceps species in agricultural products by competitive ELISA using a monoclonal antibody. J. Agric. Food Chem. 1992, 40, 1090–1092. [Google Scholar] [CrossRef]
  68. Tunali, B.; Shelby, R.A.; Morgan-Jones, G.; Kodan, M. Endophytic fungi and ergot alkaloids in native Turkish grasses. Phytoparasitica 2000, 28, 375–377. [Google Scholar] [CrossRef]
  69. Kenyon, S.A.; Roberts, C.A.; Kallenbach, R.L.; Lory, J.O.; Kerley, M.S.; Rottinghaus, G.E.; Hill, N.S.; Ellersieck, M.R. Vertical distribution of ergot alkaloids in the vegetative canopy of tall fescue. Crop Sci. 2018, 58, 925–931. [Google Scholar] [CrossRef]
  70. Roberts, C.A.; Davis, D.K.; Looper, M.L.; Kallenbach, R.L.; Rottinghaus, G.E.; Hill, N.S. Ergot alkaloid concentrations in high- and low-moisture tall fescue silage. Crop Sci. 2014, 54, 1887–1892. [Google Scholar] [CrossRef]
  71. Schnitzius, J.M.; Hill, N.S.; Thompson, C.S.; Craig, A.M. Semiquantitative determination of ergot alkaloids in seed, straw, and digesta samples using a competitive enzyme-linked immunosorbent assay. J. Vet. Diagn. Invest. 2001, 13, 230–237. [Google Scholar] [CrossRef] [PubMed] [Green Version]
  72. Hu, Z.; Ao, D.; Mahadevan, S. Calibration experimental design considering field response and model uncertainty. Comput. Methods Appl. 2017, 318, 92–119. [Google Scholar] [CrossRef] [Green Version]
  73. Raposo, F. Evaluation of analytical calibration based on least-squares linear regression for instrumental techniques: A tutorial review. Trends Anal. Chem. 2006, 77, 167–185. [Google Scholar] [CrossRef]
  74. Bryła, M.; Ksieniewicz-Woźniak, E.; Podolska, G.; Waśkiewicz, A.; Szymczyk, K.; Jędrzejczak, R. Occurrence of ergot and its alkaloids in winter rye harvested in Poland. World Mycotoxin J. 2018, 11, 635–646. [Google Scholar] [CrossRef]
  75. Grusie, T.; Cowan, V.; Singh, J.; McKinnon, J.; Blakley, B. Correlation and variability between weighing, counting and analytical methods to determine ergot (Claviceps purpurea) contamination of grain. World Mycotoxin J. 2017, 10, 209–218. [Google Scholar] [CrossRef]
  76. Orlando, B.; Maumené, C.; Piraux, F. Ergot and ergot alkaloids in French cereals: Occurrence, pattern and agronomic practices for managing the risk. World Mycotoxin J. 2017, 10, 327–338. [Google Scholar] [CrossRef]
  77. Byrd, N.; De Alwis, J.; Booth, M.; Jewell, K. Final Project Report: Monitoring the Presence of Ergot Alkaloids in Cereals and a Study of a Possible Relationship between Occurrence of Sclerotia Content and Levels of Ergot Alkaloids. Project Number FS516009.2014. Available online: https://www.food.gov.uk/sites/default/files/media/document/FS516009%20Final%20Ergot%20Alkaloid%20report%20(3).pdf (accessed on 18 June 2020).
  78. Schummer, C.; Brune, L.; Moris, G. Development of a UHPLC-FLD method for the analysis of ergot alkaloids and application to different types of cereals from Luxembourg. Mycotoxin Res. 2018, 34, 279–287. [Google Scholar] [CrossRef] [PubMed]
  79. Miedaner, T.; Dänicke, S.; Schmiedchen, B.; Wilde, P.; Wortmann, H.; Dhillon, B.S.; Mirdita, V. Genetic variation for ergot (Claviceps purpurea) resistance and alkaloid concentrations in cytoplasmic-male sterile winter rye under pollen isolation. Euphytica 2010, 173, 299–306. [Google Scholar] [CrossRef]
  80. Kirchhoff, H. Beiträge zur Biologie und Physiologie des Mutterkornpilzes. Centralbl. Bakteriol. Parasitenk. Abt. II 1929, 77, 310–369. [Google Scholar]
  81. Mielke, H. Untersuchungen zur Bekämpfung des Mutterkorns. Nachr. Deut. Pflanzenschutzd. 1993, 45, 97–102. [Google Scholar]
  82. Engelke, T. Ansätze für eine integrierte Bekämpfung des Mutterkorns (Claviceps purpurea [Fr.] Tul.) im Roggen. Ph.D. Thesis, University of Göttingen, Göttingen, Germany, 2002. [Google Scholar]
  83. Meier, U. Growth Stages of Mono- and Dicotyledonous Plants. BBCH Monograph. 2001. Available online: https://www.julius-kuehn.de/media/Veroeffentlichungen/bbch%20epaper%20en/page.pdf (accessed on 4 April 2020).
  84. BVL L 15.01/02–5:2012–01. Untersuchung von Lebensmitteln—Bestimmung von Ergotalkaloiden in Roggen und Weizen—HPLC-Verfahren mit Reinigung an einer basischen Aluminiumoxid-Festphase. 2012. Available online: https://www.beuth.de/de/technische-regel/bvl-l-15–01–02–5/150736503 (accessed on 4 April 2020).
  85. Bernal-Vasquez, A.M.; Utz, H.F.; Piepho, H.P. Outlier detection methods for generalized lattices: A case study on the transition from ANOVA to REML. Theor. Appl. Genet. 2016, 129, 787–804. [Google Scholar] [CrossRef] [PubMed]
  86. Cochran, W.G.; Cox, G.M. Experimental Designs; Wiley: New York, NY, USA, 1957; ISBN 978-0-471-54567-5. [Google Scholar]
  87. Fehr, W.R. Principles of Cultivar Development, Theory and Technique; Macmillan: New York, NY, USA, 1987; Volume 1, ISBN 0029499208. [Google Scholar]
  88. R Core Team. R: A Language and Environment for Statistical Computing; R Foundation for Statistical Computing: Vienna, Austria, 2018; ISBN 3–900051–07–0. [Google Scholar]
  89. RStudio Team. RStudio: Integrated Development for R. RStudio, Inc., Boston. 2016. Available online: https://www.rstudio.com/ (accessed on 4 March 2020).
Figure 1. Boxplots of ergot alkaloids (EA) content determined by HPLC and mean ergot severity (% value above the respective column) of 15 environments for three winter rye genotypes (D.Amber, Elias, H_Hyb5) after inoculation with three isolates of C. purpurea of subset II (black line representing the median, error bars representing the standard error of means, WUL2019, PET2019, and HAG2018 are presented on a secondary y-axis due to their very high EA contents). For the abbreviations of the locations, please refer to Materials & Methods or Table S1.
Toxins 12 00676 g001
Figure 2. Distribution of ergot alkaloids (EA) content of subset I after inoculation with C. purpurea across 18 environments determined by HPLC (blue) and ErgoREAD ELISA (green, see Materials & Methods).
Toxins 12 00676 g002
Figure 3. Correlation between ergot severity (%) and EA content determined by HPLC (mg/kg) of subset I after inoculation with C. purpurea (a) across all environments and isolates and colored by (b) origin of isolate (DE = German isolate, PL = Polish isolate, AT = Austrian isolate, Mix = Mix of all isolates [DE, PL, AT]), (c) location and (d) genotype (FC(15) = comprising 15 factorial crosses) (r = coefficient of correlation, **: significant at p < 0.01).
Toxins 12 00676 g003
Figure 4. Amount (%) of single EAs relative to the EA content determined by HPLC after inoculation with C. purpurea of winter rye for 2018 and 2019 for (a): subset I and (b) subset II separated by three country-specific isolates (DE = German isolate, PL = Polish isolate, AT = Austrian isolate).
Toxins 12 00676 g004
Table 1. Means and significance level of ergot severity and EA content determined by HPLC or ELISA across up to eight locations in two years and across years after inoculation with C. purpurea with three country-specific isolates (DE = German isolate, PL = Polish isolate, AT = Austrian isolate) for subset II.
Trait201820192018 + 2019
IsolateDEPLATDEPLATDEPLAT
Ergot Severity (%)2.04a 12.07a1.53a0.67a1.13b1.72c1.36a1.60a1.62a
EAs, HPLC (mg/kg)1.10a6.21a37.64b8.41b0.80a16.75c5.00a3.32a26.50b
EAs, ELISA (mg/kg)7.5a26.8b23.5b862.9ab1700.7a254.8b387.7a824.8b120.7a
1 Treatments with the same letter within one row are not significantly different (Tukey test, p < 0.05).
Table 2. Genotype, breeding company, test environments (= location × year combinations), and inoculated isolate(s) of all 372 winter rye samples (= subset I) and the orthogonal samples (= subset II); FC(15) = 15 factorial crosses, DE = German isolate, PL = Polish isolate, AT = Austrian isolate, Mix = Mix of all isolates (DE, PL, AT).
GenotypeBreeding CompanyTest EnvironmentsIsolate(s)No. of Samples
NumberName
D.Amber 1“DANKO” Hodowla Roslin Sp. z o.o.16All 2DE, PL, AT96
Elias 1Saatzucht LFS Edelhof16All 2DE, PL, AT96
H_Hyb5 1HYBRO Saatzucht GmbH & Co. KG16All 2DE, PL, AT96
D.Amber“DANKO” Hodowla Roslin Sp. z o.o.2OLIDE4
EliasSaatzucht LFS Edelhof2OLIDE4
H_Hyb5HYBRO Saatzucht GmbH & Co. KG2OLIDE4
ConductKWS LOCHOW GmbH2OLIDE4
K_Hyb2KWS LOCHOW GmbH2OLIDE4
H_PopHYBRO Saatzucht GmbH & Co. KG2OLIDE4
FC(15)KWS LOCHOW GmbH2OLIMix60
1 comprising subset II. 2 except BRS 2018, HAG 2019, OLI 2018, 2019.
Publisher’s Note: MDPI stays neutral with regard to jurisdictional claims in published maps and institutional affiliations.

