Abstract
The development of incurred reference materials containing citrinin (CIT) and their successful application in a method validation study (MVS) in order to harmonize CIT determination in food and food supplements are demonstrated. CIT-contaminated materials made of red yeast rice (RYR), wheat flour, and Ginkgo biloba leaves (GBL), as well as food supplements made of red yeast rice (FS-RYR) and Ginkgo biloba leaves (FS-GBL), were manufactured in-house via fungal cultivation on collected raw materials. The homogeneity and stability from randomly selected containers were verified according to the ISO 13528. CIT was found to be homogenously distributed and stable in all contaminated materials, with no significant degradation during the timescale of the MVS when storage was performed up to +4 °C. Next, an MVS was organized with eighteen international laboratories using the provided standard operating procedure and 12 test materials, including three RYRs (blank, <50 µg/kg, <2000 µg/kg), two wheat flours (blank, <50 µg/kg), two GBL powders (blank, <50 µg/kg), three FS-RYRs (blank, <50 µg/kg, <2000 µg/kg), and two FS-GBLs (blank, <50 µg/kg). The results of seven CIT-incurred materials showed acceptable within-laboratory precision (RSDr) varying from 6.4% to 14.6% and between-laboratory precision (RSDR) varying from 10.2% to 37.3%. Evidenced by HorRat values < 2.0, the results of the collaborative trial demonstrated that the applied analytical method could be standardized. Furthermore, the appropriateness of producing CIT reference materials is an important step towards food and feed quality control systems and the organization of proficiency tests.
Keywords:
citrinin; reference materials; food; food supplements; red yeast rice; Ginkgo biloba; LC-MS/MS; method validation study Key Contribution:
The development and preparation of the citrinin reference materials as well as their successful use in an international method validation study demonstrated that the proposed analytical method is suitable and can be standardized for citrinin determination in red yeast rice, wheat flour, Gingko biloba leaves and food supplements based on either red yeast rice or Gingko biloba leaves at levels that could be considered by European Commission in the case of maximum limits setting.
1. Introduction
Mainly produced by Aspergillus, Penicillium, and Monascus fungi, citrinin (CIT) is a mycotoxin that occurs often in stored grains, fruits, vegetable juices, herbs, and spices [1,2]. CIT is nephrotoxic, genotoxic, and carcinogenic [3,4]. In 2012, the EFSA assessed the health risk related to the presence of CIT in food, and concluded that more data regarding the occurrence of CIT in food are needed in order to enable refinement of the risk assessment [1]. In addition, the use of red yeast rice (RYR) in dietary food supplements has gained popularity in Europe due to its ability to achieve and maintain healthy cholesterol levels [5]. RYR is prepared upon fermentation of rice grains polluted by Monascus purpureus that produce monacolins (i.e., inhibitors of cholesterol production). As a result, RYR could have a significant potential to reduce healthcare costs and contribute to public health by reducing heart disease risk in individuals with moderate elevations of circulating cholesterol levels [6,7]. Even though many patients use worldwide RYR as an alternative therapy for hyperlipidemia, the discovery of a toxic fermentation byproduct, CIT, causes much controversy about the safety of RYR [8]. Based on the risk assessment carried out by the EFSA, the European Regulation (EC) No 212/2014 [9] laid down a maximum limit (ML) of 2000 μg/kg for CIT in FS-RYR. Taking into account more recent data, this ML has been lowered to 100 µg/kg [10]. Nowadays, medicinal and aromatic herb consumption is also increasing due to its therapeutic or natural properties, which may concomitantly lead to an increase of mycotoxin intake. For example, Ginkgo biloba leaves (GBL) from Spain contained up to 355 µg of CIT/kg, together with 23.3 µg of aflatoxins/kg and 1.1 µg of ochratoxin A/kg [11]. In order to gather reliable occurrence information to support food safety policy, it is necessary to have adequate analytical techniques for the detection of CIT in food. Moreover, detection of mycotoxins can be achieved by various analytical methods, such as gas chromatography–mass spectrometry (GC-MS) and high-performance liquid chromatography (HPLC) in combination with fluorescence and/or UV detection or immunodiagnostic tools [12,13]. However, during the last 10 years, liquid chromatography–tandem mass spectrometry (LC-MS/MS) has become the universal technique for mycotoxin analysis, and it has been widely applied for various matrices [14,15]. Recently, occurrence data of CIT and its biomarkers were obtained in a handful of monitoring studies performed hitherto in Europe [16,17]. So far, CIT was not targeted among the 72 official methods published by the Association of Official Agricultural Chemists (AOAC), the European Committee for Standardization (CEN), and the International Organization for Standardization (ISO) for mycotoxin analysis in food [18]. Furthermore, Solfrizzo et al. [14] stated that there is a need for the harmonization of mycotoxin determination to ensure the verification of compliance with feed and food law and animal health and animal welfare rules. In this context and within the framework of the European Regulation (EC) 882/2004 on official controls [19], the EC issued the mandate M/520 pertaining to 11 standardization priorities of analytical methods for mycotoxin determination in food [20]. Of the 11 priorities of the mandate, the secretary of CEN/TC275 assigned via the working group 5 (WG5) one on the “determination of CIT in food by LC-MS/MS” to the Belgian National Reference Laboratory. The process for the standardization was undertaken via a method validation study (MVS) using the in-house prepared CIT matrix reference materials. Indeed, matrix reference materials play a key role for internal and external validation processes [21]. They are important tools for laboratories for method development and validation, quality control evaluation, and inter-laboratory comparisons [22]. The present paper describes the preparation of the incurred CIT reference materials and their use in the MVS in order to assess the inter-laboratory repeatability and reproducibility for CIT determination in food and food supplements, as requested in the standardization procedure.
2. Results and Discussion
2.1. Samples, Homogeneity, and Stability Assessment in Contaminated Materials
Five blank matrices (CIT < LOQ) and seven CIT contaminated samples were provided to each participant of the present method validation study. These 12 samples were coded from A to L (Table 1).

Table 1.
Sample codes and provided amounts (g) of test materials.
Homogeneity and stability were evaluated using a previously published LC-MS/MS method [15]. This method was successfully validated to meet the criteria laid down in EC decision 2002/657/EC [23] and EU 519/2014 [24] in FS-RYR and wheat, achieving a validated LOQ of 2.5 µg/kg. Note that the average between-day recoveries varied between 70–120% [24], while the expanded measurement uncertainties MU(k=2) were 30% for FS-RYR and 40% for wheat. To verify the accuracy and reliability of this method, the laboratory participated in a proficiency test organized by FAPAS for maize flour, resulting in a Z-score of 1.0 for an assigned value of 87.9 µg/kg. Based on the accepted |Z-score| ≤ 2.0 criterion, it can be concluded that satisfactory results are achieved with this analytical method [25].
The tests for adequate and sufficient homogeneity were conducted according to the criteria of ISO-13528 [26] and IUPAC [27]. More details are given in Tangni et al. [28]. All of the materials proved to be adequately homogeneous (Table 2), and an acceptable degree of variability in the distributed units of each test material was guaranteed.
Table 2.
Homogeneity of CIT-contaminated test materials.
Next, the stability of the samples was evaluated at different temperatures (−20 °C, +4 °C, and 24 °C) for the period starting at the day that the samples were dispatched until the date for data submission (Table 3).
for each contaminated material stored at +4 °C and +24 °C compared to the samples stored at −20 °C. Ratio of changes in CIT contents (Equation 1) was significant if ratio > 1.
Table 3.
Relative changes in CIT contents in samples stored at +4 °C and +24 °C compared to the samples stored at −20 °C during the study.
Most of the provided materials proved to be adequately stable at +4 °C for at least three months, despite some deviations observed for GBL and FS-RYRlow level upon three months of conservation (Table 3). Consequently, it was recommended that the materials of FS-GBL and FS-RYR be analyzed until three months after reception. The stability study indicated that storage of the materials at +24 °C should be avoided.
For the present study, it is noticeable that most of the participating laboratories (13) have stored the samples at −20°/−18 °C before performing the analyses, while five laboratories stored the test materials at +4 °C storage.
The analytical method was drafted as the standard operating procedure (SOP) in CEN format and distributed for validation to the participants with instructions.
2.2. Participants’ Locations and Experiences in Mycotoxin Analyses
Most participants originated from Europe (Figure 1) and had up to 10 years of experience in analyzing regulated and non-regulated mycotoxins in food and feed using LC-MS/MS. Not all laboratories were accredited. Fourteen out of 18 laboratories were accredited for mycotoxin analyses, but the accreditation covered CIT in only five laboratories.
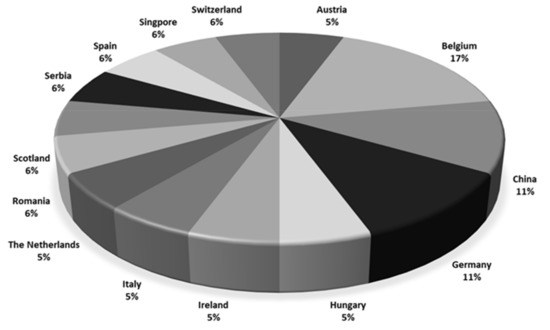
Figure 1.
Countries of the participating laboratories (n = 18).
2.3. Participants’ Instrumental Setup
Taking into account the diversity of instrumentation available in the laboratories, participants were free to adapt their own instrumental setup, meaning a choice of LC columns, mobile phases, and MS parameters. Conditions and MS settings of the method as achieved by participants are summarized in Figure 2. Five generations of LC instruments equipped with nine models of MS instruments and 12 different LC columns were engaged. The application of high resolution MS was accepted, but none of the participants used this technique in the method validation study. One could argue that the diversity of the instrumentation used by participants was additional proof of the applicability of the method.
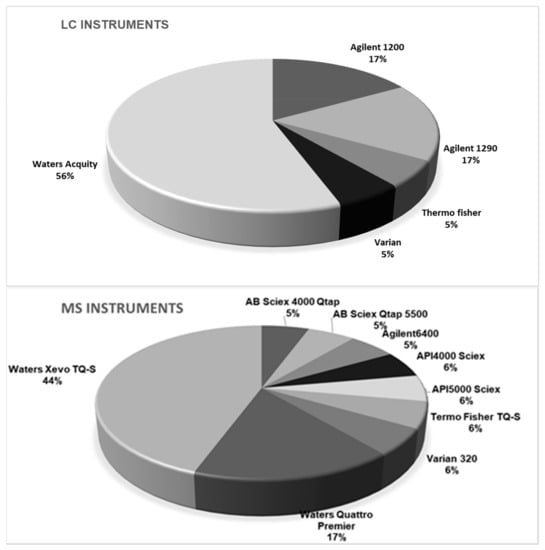
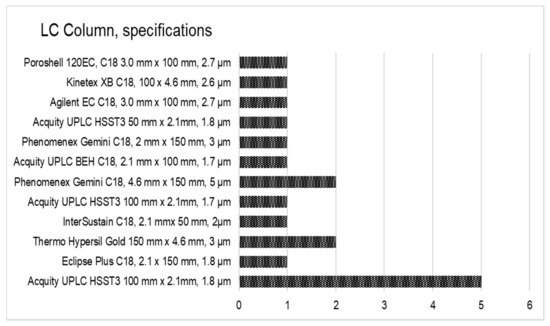
Figure 2.
Instrumental setup used by the participating laboratories (n = 18).
While most of the participating laboratories strictly implemented the SOP under investigation, a few minor experimental modifications were reported to the organizers. The suggested mobile phases were used according to the instructions by 16 laboratories out of 18, whereas two participants modified the mobile phase by adding methanol. In contrast, the suggested gradient was used in only six laboratories, whereas 12 laboratories applied a modified gradient. Column temperature was mostly maintained at 40 °C (14 laboratories). Other column temperatures that were used by the participants were either 25 °C (one laboratory), 30 °C (two laboratories), or 50 °C (one laboratory). Injection volumes of 1 µL or 5 µL were set up by eight and seven laboratories, respectively. Other participants set up their instruments to inject either 2, 3, or 10 µL of the extracts. All instruments operated in electrospray ionization (ESI) in negative ionization mode. All participants followed the precursor and products ions as suggested in the instruction document.
2.4. CIT Concentrations in the Test Materials
The number of laboratories delivering results according to the instructions and the statistical evaluations of the quantitative results for CIT analysis by LC-MS/MS in the 12 materials are summarized in Table 4. Wheat flour contained a low level of CIT (< LOQ), whereas no detected level was found in RYR, GBL, FS-RYR, or FS-GBL. CIT values in contaminated samples were assigned as the consensus of the participants’ results (HorRat < 1.2) [27]. The mean CIT values assigned were 38.0 ± 3.1 µg/kg (RYRlow level), 1913 ± 122 µg/kg (RYRhigh level), 31.1 ± 2.4 µg/kg (wheat flour), 22.1 ± 2.8 µg/kg (FS-RYRlow level), and 30.2 ± 2.8 µg/kg (GBL). Accepted HorRat values of 1.4 and 1.7 indicated that the applied method would be able to identify the presence of CIT and estimate the degree of contamination in FS-RYRhigh level (1867 ± 94 µg/kg) and FS-GBL (21.7 ± 3.2 µg/kg). These concentrations were in accordance with the specifications laid down in the tender (between 5–50 μg/kg for low contaminated materials and around 2000 µg/kg for the highly contaminated RYR and FS-RYR).
Table 4.
Statistical results of the interlaboratory trial for CIT analysis in the 12 test materials.
2.5. Interlaboratory Repeatability and Reproducibility Results
For the contaminated materials, the precision of the method was characterized by the repeatability (RSDr) and the reproducibility (RSDR) after the removal of outliers, as recommended in ISO 5725-2 [30]. The repeatability RSDr ranged from 6.4% to 14.6% and the RSDR from 10.2 to 37.3% (Table 4). All of the repeatability results fulfilled the EC regulation 519/2014, being below the maximum acceptable RSDr (%) = 0.66 × RSDR. HorRat values were below 2.0 (Table 4, Figure 3), indicating that good reproducibility was also achieved for the validated method. Note that the empirical acceptable ranges of HorRat 0.5–2.0 requested by Horwitz and Albert [31] have met and confirmed the validity of the analytical method of the present study.
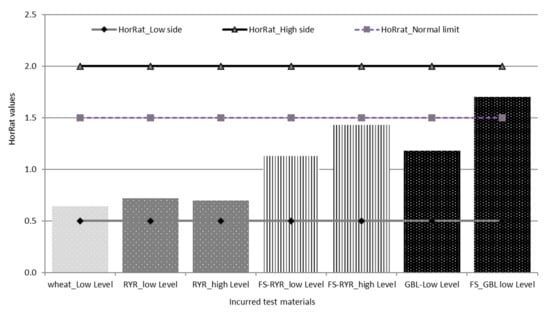
Figure 3.
HorRat values for the tested materials.
The repeatability and reproducibility limits derived for the present method validation study (Table 4) may be applicable to matrices and CIT concentration ranges as given.
However, three laboratories were not able to successfully detect CIT in the ginkgo-based materials (Samples G and L), since the ion ratios were only correct for RYR, wheat flour, and FS-RYR. One laboratory concluded that the ginkgo matrix had an effect on the signal of the 13C-labelled CIT internal standard and on the analyte, which consequently affected the measured ion ratios. Note that gingko products appeared to be challenging matrices to work with. The measurement and chromatography conditions were chosen in such a way that the 13C CIT did not produce an interfering signal quantification for the suitable mass spectrometric detection. If an adduct ion is used as the precursor ion and the loss of adduct serves as the transition for the quantifier ion, then at least two qualifier ions are monitored. Maximization of sensitivity can be achieved through optimal selection of the ionization mode, the precursor ions, and product ions, and optimization of cone voltages and collision energy.
It is worth mentioning that some organizations used HorRat as a criterion to accept the method for official purposes, as this is currently the case in the EU for aflatoxin methods for food analysis, where the only methods officially allowed are those with HorRat ≤ 2 [32].
2.6. Output: Future Perspective
- Within- and between-laboratory repeatability and reproducibility were acceptable, as evidenced by HorRat < 2.0. The present collaborative study demonstrated that the applied analytical method could be standardized.
- The method proved to be suitable for CIT determination in RYR, wheat flour, and FS based on either RYR or GBL at levels that could be considered by EC in the case of ML setting. Nevertheless, attention should be paid to CIT determination in Ginkgo biloba matrices.
- Method development and validation can be reliably improved for generating data on the occurrence of CIT in food and feed, so that exposure assessment can be improved.
- Based on the stability testing, material storage at 4 °C was recommended up to three months. Further long-term stability should be studied. Storage at higher temperatures (+24 °C) may jeopardize the stability.
- Provide information on the CIT production potential for the involved Monascus, Aspergillus, and Penicillium strains.
- Production and procurement of the reference materials can facilitate the toxicity studies (cell and animal experiments), so that accurate information can be generated that can be used to refine the risk assessment.
3. Materials and Methods
CIT-contaminated rice, wheat, and GBL were produced in-house via fungal cultivation in grains and ginkgo leaves. First, the ability to produce CIT of different strains was evaluated.
3.1. Fungal Screening for CIT Biosynthesis
Strains of Monascus purpureus, Monascus ruber, Aspergillus niger, Aspergillus alutaceus, and Penicillium citrinum from the Mycothèque de l’Université catholique de Louvain, MUCL were screened at the lab scale (three replicates of 20 g of grains per fungus) in wheat, RYR, or GBL. Next, the selected strain was inoculated and cultivated on sterilized aliquots of grains (500 g) either of wheat or RYR or on an aliquot of 1000 g of GBL, as described by Han et al. [33]. Incubation was stopped by autoclaving at 121 °C for 20 min, and samples were thereafter dried at 40–50 °C for 18 h, ground and sieved (<300 µm), homogenized, and stored at −20 °C until LC-MS/MS analyses. The results are presented in Table 5.
Table 5.
Fungal screening for production of CIT and OTA in wheat, rice grains, and GB leaves.
Based on the results, Penicillium citrinum (MUCL 29781) was selected to produce CIT in wheat, RYR, and GBL, as the highest concentrations of CIT were found after inoculation of these strains.
3.2. Collected Raw Materials
Different materials were used for the method validation study:
- Rice and wheat grains were obtained from local markets in Belgium.
- Leaves from Ginkgo biloba trees were collected from the Botanic Garden (Meise, Belgium).
- Capsules or tablets of food supplements (powdered RYR and GBL in bulky agents) were purchased from local drugstores in Belgium. Collected leaves were cleaned, dried, milled (as fine powder of GBL), and homogenized.
- A contaminated batch of RYR provided by the Belgian Federal Agency for Safety of Food Chain was included in the preparation of the FS-RYR materials.
The LC-MS/MS method [15] was applied for checking the CIT contents in the collected samples of wheat, RYR, GBL, FS-RYR, and FS-GBL. Briefly, a test portion (4.00 ± 0.02 g) was humidified with 10 mL of hydrochloric acid aqueous solution (water:glacial acetic acid, 99:1, v:v) and extracted with 20 mL of ethyl acetate/acetonitrile/glacial acetic acid (75:24:1, v:v:v) mixture for 60 min by shaking. Magnesium sulfate (6.0 g) and sodium chloride (1.5 g) were added to the extract and agitated and centrifuged in order to expel water and allow phase separation from the mixture. An aliquot of supernatant (1 mL) was collected and filtered through a PTFE syringe filter. The filtered extract (45 µL) was transferred into a glass insert, followed by the addition of the internal standard solution, 13C-CIT (5 µL). The mixture was homogenized and analyzed by reversed phase LC-MS/MS. Quantification was based on matching 12CIT/13C-CIT ratios and 12CIT concentrations.
3.3. Incurred Material Production
Fermented and blank (CIT < LOQ) samples of wheat and RYR were milled in a Retsch mill (ZM100 with 3.0 sieves, Haan, Germany) and homogenized to obtain particle sizes < 300 µm.
Adequate amounts of the contaminated materials were then mixed in different proportions with the corresponding blank wheat flour, RYR, or GBL powder. The test materials were carefully homogenized with EasyMIX 150 (Bellegroup, Sheen, UK) for 96 h in several steps via the cross-riffling procedure [34].
- RYR: The fermented batches of RYR with no detectable CIT level were used as RYR (blank, sample A) or mixed with the various proportion of highly CIT-contaminated RYR to produce either RYRlow level (sample B) or RYRhigh level (sample C). These materials were conjointly prepared at JRC/IRMM (Geel, Belgium) for the 2015 proficiency test (PT). A surplus of these PT materials were used in this study.
- Wheat: The wheat flour with a low detectable CIT level (< LOQ) was used as sample D or mixed with highly CIT-contaminated wheat flour to prepare Wheatlow level, sample E.
- GBL: The GBL powder with no detectable CIT level was used as blank (sample F) or mixed with the highly CIT-contaminated batch to obtain GBLlow level (sample G).
- FS: The tablets of FS-RYR (< LOQ) were milled and used either as blank test material (sample H) or as filling material for the preparation of sample I. This material was mixed with the highly contaminated FS-RYR to obtain FS-RYRlow level (sample I). Capsules of highly CIT-contaminated FS-RYR were encapsulated, homogenized, and used as FS-RYRhigh level, sample J.
- FS-GBs purchased on the market were encapsulated and used either as blank test material (sample K) or as filling material, mixed with the contaminated GBL to prepare FS-GBLlow level (sample L).
All of the final test materials were divided into equal portions (either 10 g or 20 g, Table 1) and in wide-neck lightproof container series 310 PVC (brown and transparent for light-sensitive media). Next, their homogeneity and stability were evaluated.
3.4. Homogeneity Checking
For sample B and sample C, the analyses and homogeneity testing were performed on 10 randomly selected units per material at JRC/IRMM (Geel, Belgium) [35]. For samples E, G, I, J, and L, the homogeneity was evaluated in our laboratory using 12 randomly selected units per material. Two independent CIT determinations per container were performed using the in-house validated LC-MS/MS method under repeatability conditions (same analysts, equipment and supplies, and laboratory conditions). Homogeneity was evaluated according to the criteria of ISO-13528 [26] and IUPAC [27].
3.5. Stability Testing
The short-term stability of the CIT in contaminated samples under storage was assessed as described by Tangni et al. [28] for ensuring whether the transport duration (three to seven days, worldwide) or the duration for laboratories to perform might not affect the CIT contents in the materials. Storage at +4 °C and +24 °C was chosen and checked against the reference temperature of −20 °C. For each storage duration (i.e., 0.25, one, and three months), two samples of each contaminated material were submitted to aging experiments under storage at −20 °C, +4 °C, and +24 °C. Two independent determinations per bottle were analyzed at random using the validated method under repeatability conditions. The mean CIT contents in samples were thus calculated for each bottle and for the two containers for each storage condition. For each temperature (e.g., +4 °C or +24 °C), the difference between the means of CIT contents in the samples stored at +4 °C (or +24 °C) against the CIT levels in reference samples stored at −20 °C was computed (|Level(+4 °C or +24 °C) − Level( −20 °C)|). In addition, the extended measurement uncertainty on the average of the two bottles was calculated under repeatability as MU(k = 2) = 2 x SD(2 averages)/√2. The difference with the −20 °C result was considered statistically significant when it exceeded the combined MU (MUcombined), computed using the following formula:
The change in CIT content expressed by ratios = |Level(+4 °C or +24 °C)– Level(−20 °C)|/MUcombined) was considered significant when the ratio > 1.
3.6. Collaborative Study Management
3.6.1. Recruitment of Participants
Six participating laboratories were recruited via the 2015-PT organized by IRMM at JRC, while the rest of the participants were recruited via the multi-mycotoxins PT organized by Sciensano and through specific invitation and registration of interested CEN/TC275 WG5 laboratories.
Blank samples were provided to participants to allow the laboratory to tune their LC-MS instruments for sufficient signal yield for the measurement as well as the recovery of the analyte in each material. Note that no formal pre-trial as a preliminary exercise for identifying potential bottlenecks with the method and suitable candidate laboratories for this kind of analysis was performed.
3.6.2. Test Materials, Instructions, and Time Frame
Each participant received the SOP, the test materials listed in Table 1, and the standard solutions made of 12C-CIT (for spiking and calibration), certified 12C-CIT (for checking the suitability of the solution), and 13C-CIT (as the internal standard), separately. The amounts provided and the numbers of analyses to be performed per sample were indicated. In addition, the following documents were provided to the participants:
- an accompanying letter with instructions;
- sample receipt form;
- sample handling instructions;
- the reporting form as a protected Excel file.
The participants were also asked to fill in a questionnaire with regard to the local application of the analytical protocol and their expertise in mycotoxin analyses.
The test materials were sent to the participating laboratories at the end of January 2016, and the deadline for reporting was 31 March 2016. Five participants who encountered technical issues requested additional time for performing the analyses, therefore, the deadline for reporting was postponed until the end of April 2016.
3.6.3. Data Processing and Statistical Analyses
Each participant was given a laboratory number, assigned according to the registration order. Twenty laboratories were registered. Two laboratories declared having technical problems and consequently did not submit their data. The results submitted by the 18 remaining laboratories (90%) were checked for compliance with the requested analytical procedures. Three labs did not perform the two independent CIT determinations per bottle as requested. In this group, one laboratory ran a single analysis per sample; another laboratory ran a single analysis per sample and did not analyze the blank samples, and yet another one performed a duplicate injection from the same vial. In addition, one laboratory did not submit their data for the highly contaminated RYR and FS-RYR. These four non-compliant data were excluded from the datasets because the prescribed protocol was not strictly followed.
Statistical and visual overviews of the accepted results were displayed by non-parametric box plots analysis [36] to detect graphical outliers of the analytical results. Results without outlier values were used as the reference dataset. The calculations performed and the acceptance criteria were based on the IUPAC [27].
Statistical analyses for determining the precision parameters of the CIT analyses in the different matrices were performed using the relative standard deviation for the repeatability (RSDr) as the intra-laboratory value and the relative standard deviation for reproducibility (RSDR) as the inter-laboratory value. The predicted relative reproducibility of the standard deviation PRSDR or fitness-for-purpose based standard deviations (σ) were calculated by applying the Horwitz–Thompson equation [27,29].
Note that the repeatability is the absolute difference between two single test results found on identical test material by one operator using the same apparatus within the shortest feasible time interval, and will exceed the repeatability limit r in less than 5% of the cases.
Reproducibility is mentioned to be the absolute difference between two single test results found on identical test material reported by two laboratories, exceeding the reproducibility limit R in less than 5% of the cases.
The evaluation of the collaborative study was performed using HorRat values calculated by dividing the RSDR by PRSDR (σ) [37], using the following criteria [32].
- HorRat ≤ 0.5: method reproducibility may be questionable due to the lack of study independence, unreported averaging, or consultations.
- 0.5 < HorRat ≤ 1.5: method reproducibility is as normally would be expected.
- HorRat > 1.5: method reproducibility is higher than normally expected; the study director should critically look into possible reasons for a high HorRat (e.g., were test samples sufficiently homogeneous, indefinite analyte, or property) and discuss this in the collaborative study report.
- HorRat > 2.0: method reproducibility is problematic. A high HorRat may result in rejection of a method because it may indicate unacceptable weaknesses in the method under the study.
Author Contributions
Conceptualization, E.K.T., F.V.H. and B.H.; methodology, E.K.T., F.V.H. and B.H.; investigation, E.K.T., F.V.H. and B.H.; supervision, E.K.T.; data analyses, E.K.T., B.H. and K.V.; project administration, E.K.T.; writing original draft preparation, E.K.T., B.H., F.V.H. and K.V.; writing-reviewing manuscript E.K.T., B.H., K.V., J.M., E.V.H. All authors have read and agreed to the published version of the manuscript.
Funding
This Research was funded by the European Commission through the contract item SA/CEN/ENTR/520/2013-17.11.
Informed Consent Statement
Not applicable.
Acknowledgments
The authors wish to thank Martien C. Spanjer (Dutch Food Safety Authority, NVWA, the Netherlands) and the Netherlands Standardization Institute (NEN) for leading, facilitating and encouraging the work. The provided samples of contaminated batch of RYR by the Belgian Federal Agency for Safety of Food Chain is kindly acknowledged. The preparation of RYR test materials and the providing of the list of candidate participants by the Institute for Reference Materials and Measurements at the Joint Research Centre (JRC) are here acknowledged. We gratefully acknowledge the response and good collaboration of the participating laboratories.
Conflicts of Interest
The authors declare no conflict of interest.
References
- European Food safety Authority EFSA. Scientific Opinion on the risks for public and animal health related to the presence of citrinin in food and feed. EFSA J. 2012, 10, 2605. [Google Scholar]
- Meerpoel, C.; Arnau, V.; Di Mavungu, J.D.; Huybrechts, B.; Tangni, E.K.; Devreese, M.; Croubels, S.; De Saeger, S. Development and validation of an LC-MS/MS method for the simultaneous determination of citrinin and ochratoxin A in a variety of feed and foodstuffs. J. Chromatogr. A 2018, 1580, 100–109. [Google Scholar] [CrossRef]
- Kumar, M.; Dwivedi, P.; Sharma, A.K.; Sankar, M.; Patil, R.D.; Singh, N.D. Apoptosis and lipid peroxidation in ochratoxin A- and citrinin-induced nephrotoxicity in rabbits. Toxicol. Ind. Health 2014, 30, 90–98. [Google Scholar] [CrossRef] [PubMed]
- Ostry, V.; Malir, F.; Toman, J.; Grosse, Y. Mycotoxins as human carcinogens-the IARC Monographs classification. Mycotoxin Res. 2017, 33, 65–73. [Google Scholar] [CrossRef] [PubMed]
- Gerards, M.C.; Terlou, R.J.; Yu, H.; Koks, C.H.W.; Gerdes, V.E.A. Traditional Chinese lipid-lowering agent red yeast rice results in significant LDL reduction but safety is uncertain. A systematic review and meta-analysis. Atherosclerosis 2015, 240, 415–423. [Google Scholar] [CrossRef] [PubMed]
- Lee, C.L.; Tsai, T.Y.; Wang, J.J.; Pan, T.M. In vivo hypolipidemic effects and safety of low dosage Monascus powder in a hamster model of hyperlipidemia. Appl. Microbiol. Biotechnol. 2006, 70, 533–540. [Google Scholar] [CrossRef]
- Patel, S. Functional food red yeast rice (RYR) for metabolic syndrome amelioration: A review on pros and cons. World J. Microbiol. Biotechnol. 2016, 32, 87. [Google Scholar] [CrossRef]
- Mornar, A.; Sertić, M.; Nigović, B. Development of a Rapid LC/DAD/FLD/MSn Method for the Simultaneous Determination of Monacolins and Citrinin in Red Fermented Rice Products. J. Agric. Food Chem. 2013, 61, 1072–1080. [Google Scholar] [CrossRef]
- European Commission. Commission regulation No. 212/2014 amending regulation (EC) No 1881/2006 as regards maximum levels of the contaminant citrinin in food supplements based rice fermented with red yeast Monascus purpureus. Off. J. Eur. Union 2014, L67, 3–4. [Google Scholar]
- European Commission. Commission Regulation (EU) 2019/1901 of 7 November 2019 amending Regulation (EC) No 1881/2006 as regards maximum levels of citrinin in food supplements based on rice fermented with red yeast Monascus purpureus. Off. J. Eur. Union 2019, L293, 2–4. [Google Scholar]
- Santos, L.; Marin, S.; Sanchis, V.; Ramos, A.J. Screening of mycotoxin multi contamination in medicinal and aromatic herbs sampled in Spain. J. Sci. Food Agric. 2009, 89, 1802–1807. [Google Scholar] [CrossRef]
- Atapattu, S.N.; Poole, C.F. Recent advances in analytical methods for the determination of citrinin in food matrices. J. Chromatogr. A 2020, 1627, 461399. [Google Scholar] [CrossRef]
- Silva, L.; Pereira, A.M.P.T.; Pena, A.; Lino, C.M. Citrinin in Foods and Supplements: A Review of Occurrence and Analytical Methodologies. Foods 2020, 10, 14. [Google Scholar] [CrossRef] [PubMed]
- Solfrizzo, M.; Alldrick, A.J.; Van Egmond, H.P. The use of mycotoxin methodology in practice: A need for harmonization. Qual. Assur. Saf. Crops Foods 2009, 1, 121–132. [Google Scholar] [CrossRef]
- Kiebooms, J.A.L.; Huybrechts, B.; Thiry, C.; Tangni, E.K.; Callebaut, A. A quantitative ultra-high performance liquid chromatography-tandem mass spectrometry method for citrinin and ochratoxin A detection in food, feed and red yeast rice food supplements. World J. Mycotoxin 2016, 9, 343–352. [Google Scholar] [CrossRef]
- Huybrechts, B.; Martins, J.C.; Debongnie, P.; Uhlig, S.; Callebaut, A. Fast and sensitive LC–MS/MS method measuring human mycotoxin exposure using biomarkers in urine. Arch. Toxicol. 2015, 89, 1993–2005. [Google Scholar] [CrossRef]
- Ali, N.; Degen, G.N. Citrinin biomarkers: A review of recent data and application to human exposure assessment. Arch. Toxicol. 2019, 93, 3057–3066. [Google Scholar] [CrossRef]
- Bessaire, T.; Mujahid, C.; Mottier, P.; Desmarchelier, A. Multiple Mycotoxins Determination in Food by LC-MS/MS: An International Collaborative Study. Toxins 2019, 11, 658. [Google Scholar] [CrossRef] [PubMed]
- European Commission. Commission Regulation (EC) No 882/2004 of the European Parliament and of the council of 29 April 2004: On official controls performed to ensure the verification of compliance with feed and food law, animal health and animal welfare rules. Off. J. Eur. Union 2004, L165, 1–138. [Google Scholar]
- European Union. Mandate for Standardisation Addressed to CEN for Methods of Analysis for Mycotoxins in Food. 2013. Available online: https://law.resource.org/pub/eu/man-dates/m520.pdf (accessed on 14 December 2020).
- Köppen, R.; Bremser, W.; Rasenko, T.; Koch, M. Development and certification of a reference material for Fusarium mycotoxins in wheat flour. Anal. Bioanal. Chem. 2013, 405, 4755–4763. [Google Scholar] [CrossRef]
- Krska, R.; Welzig, E.; Boudra, H. Analysis of Fusarium toxins in feed. Anim. Feed Sci. Tech. 2007, 137, 241–264. [Google Scholar] [CrossRef]
- European Commission. Commission Decision 2002/657/EC implementing Council Directive 96/23/EC concerning the performance of analytical methods and the interpretation of results. Off. J. Eur. Commun. 2002, L221, 8–36. [Google Scholar]
- European Commission. Commission regulation (EU) No. 519/2014 amending regulation (EC) No 401/2006 as regards methods of sampling of large lots, spices and food supplements, performance criteria for T-2, HT-2 toxin and citrinin and screening methods of analysis. Off. J. Eur. Union 2014, L147, 29–43. [Google Scholar]
- FAPAS. FAPAS Report 17160 Mycotoxin in Flour; FAPAS: York, UK, 2016; 18p. [Google Scholar]
- International Organization for Standardization. ISO 13528 Statistical Methods for Use in Proficiency Testing for Interlaboratory Comparisons; International Organization for Standardization: Geneva, Switzerland, 2005. [Google Scholar]
- Thompson, M.; Ellison, S.L.R.; Wood, R. The International Harmonized Protocol for the proficiency testing of analytical chemistry laboratories. IUPAC Technical Report. Pure Appl. Chem. 2006, 78, 145–196. [Google Scholar] [CrossRef]
- Tangni, E.K.; Debongnie, P.; Huybrechts, B.; Van Hove, F.; Callebaut, A. Towards the development of innovative multi-mycotoxin reference materials as promising metrological tool for emerging and regulated mycotoxin analyses. Mycotoxin Res. 2017, 33, 15–24. [Google Scholar] [CrossRef] [PubMed]
- Thompson, M. Recent trends in inter-laboratory precision at ppb and sub-ppb concentrations in relation to fitness for purpose criteria in proficiency testing. Analyst 2000, 125, 385–386. [Google Scholar] [CrossRef]
- International Organization for Standardization. ISO 5725-2: Accuracy (Trueness and Precision) of Measurement Methods and Results-Part 2: Basic Method for the Determination of Repeatability and Reproducibility of a Standard Measurement Method; International Organization for Standardization: Geneva, Switzerland, 1994. [Google Scholar]
- Horwitz, W.; Albert, R.; Deutsch, M.J. Precision parameters of methods of analysis required for nutrition labelling. Part II. Macro elements. J. AOAC Int. 1992, 75, 227–239. [Google Scholar] [CrossRef]
- Association of Official Agricultural Chemists AOAC International. Appendix D: Guidelines for Collaborative Study Procedures to Validate Characteristics of a Method of Analysis; AOAC Official Methods of Analysis: Rockville, MD, USA, 2002; pp. 1–12. [Google Scholar]
- Han, Z.; Tangni, E.K.; Huybrechts, B.; Munaut, F.; Scauflaire, J.; Wu, A.; Callebaut, A. Screening survey of co-production of fusaric acid, fusarin C, and fumonisins B1, B2 and B3 by Fusarium strains grown in maize grains. Mycotoxin Res. 2014, 30, 231–240. [Google Scholar] [CrossRef]
- Van der Veen, A.M.H.; Nater, D.A.G. sample preparation from bulk samples—An overview. Fuel Process. Technol. 1993, 36, 1–7. [Google Scholar] [CrossRef]
- IRMM/JRC. Report on the 2015 Proficiency Test of the European Union Reference Laboratory for Mycotoxins for the Network of National Reference Laboratories: Determination of Citrinin in Red Yeast Rice; Tölgyesi, A., Stroka, J., Eds.; JRC Technical Report EUR 27753; JRC: Tokyo, Japan, 2016; 22p. [Google Scholar]
- McGrill, R.; Tukey, J.W.; Larsen, W.A. Variations of bow plots. Am. Stat. 1978, 32, 12–16. [Google Scholar]
- McClure, F.D.; Lee, J.K. Computation of HorRat values. J. AOAC Int. 2003, 86, 1056–1058. [Google Scholar] [CrossRef] [PubMed]


Publisher’s Note: MDPI stays neutral with regard to jurisdictional claims in published maps and institutional affiliations. |
© 2021 by the authors. Licensee MDPI, Basel, Switzerland. This article is an open access article distributed under the terms and conditions of the Creative Commons Attribution (CC BY) license (https://creativecommons.org/licenses/by/4.0/).