Multiplex Detection of 24 Staphylococcal Enterotoxins in Culture Supernatant Using Liquid Chromatography Coupled to High-Resolution Mass Spectrometry

 , , and
Abstract
:1. Introduction
2. Results and Discussion
2.1. Se Gene Characterization
2.2. Establishment of a Signature Peptides Database for Each Enterotoxin Type
2.3. Assessment of Qualitative Performance
2.3.1. LC-MS Specificity
2.3.2. LC-MS Sensitivity
2.3.3. LC-MS Accuracy
2.4. SEs Quantification in BHI Culture Supernatant
- -
- At very low concentrations (10 and 20 fMol): over the 10 calculated biases, 6 values were >30%.
- -
- Between 40 and 20,000 fMol: SEA showed bias between 3.6 and 22.6%, except at 40 fMol with bias at 37.9%. For SEB, bias varied between 0.5 and 28.6%. For SED, bias varied between −7.5 and −37.8%. For SEE, bias varied between 12.2 and 35.9%. Finally, SEC showed a higher bias compared to SEA, SEB, SED and SEE, with values between 28.1 and 36.5%, except at a concentration of 40 fMol, −1.5%. Finally, among the 45 bias values calculated in this range of the standard curve, 10 values varied between 30% and 40%. However, among these 10 bias values, six were obtained only for SEC.
2.5. Application of the LC-MS Method for Multiplex Analysis of 24 Enterotoxins Produced by CPS Strains in Culture Supernatant
- -
- Very low level: SEG, SEI, SEN, SEM, SEO and SElU, expressed by the genomic cluster egc, were detected at very low levels compared to other SEs. Their concentrations were below 1 ng/g except for SEM (median 2.4 ng/g, n = 24). Also, SElJ was produced at very low concentrations.
- -
- Low level: the six enterotoxins SEL, SEP, SES, SElX, SEY and SElZ were weakly produced with a median between 5.0 ng/g (SEY, n = 10) and 11.6 ng/g (SElX, n = 42). It should be noted that type SES was analyzed only twice, at 6 and 18 ng/g. In this group, the concentration measured also depended on the strain.
- -
- Medium level: SEA, SED, SEE, SEH, SEK, SEQ, SER, SET, and TSST1 were produced at relatively similar concentrations, with a median between 29.6 ng/g (SER, n = 9) and 60.5 ng/g (SEA, n = 14). SET was very rarely detected and was analyzed in only one sample at 65.6 ng/g. For these nine enterotoxins, concentrations could vary depending on the strain. For example, for 14 strains, SEA concentration varied between 13.7 ng/g and 124.1 ng/g, with median 60.5 ng/g.
- -
- High level: very high concentrations were obtained only for SEB and SEC, with a median of 1731.3 (n = 17) and 3285.9 ng/g (n = 7), respectively. For SEB, concentrations varied between 710.8 and 21,943.1 ng/g, except for strain 337E (20.2 ng/g). For SEC, concentrations varied between 65.2 and 8364.9 ng/g, except for strain 15SBCL1438 (2.2 ng/g).
3. Conclusions
4. Materials and Methods
4.1. Chemicals and Reagents
4.2. CPS Strains and Enterotoxin Sequences
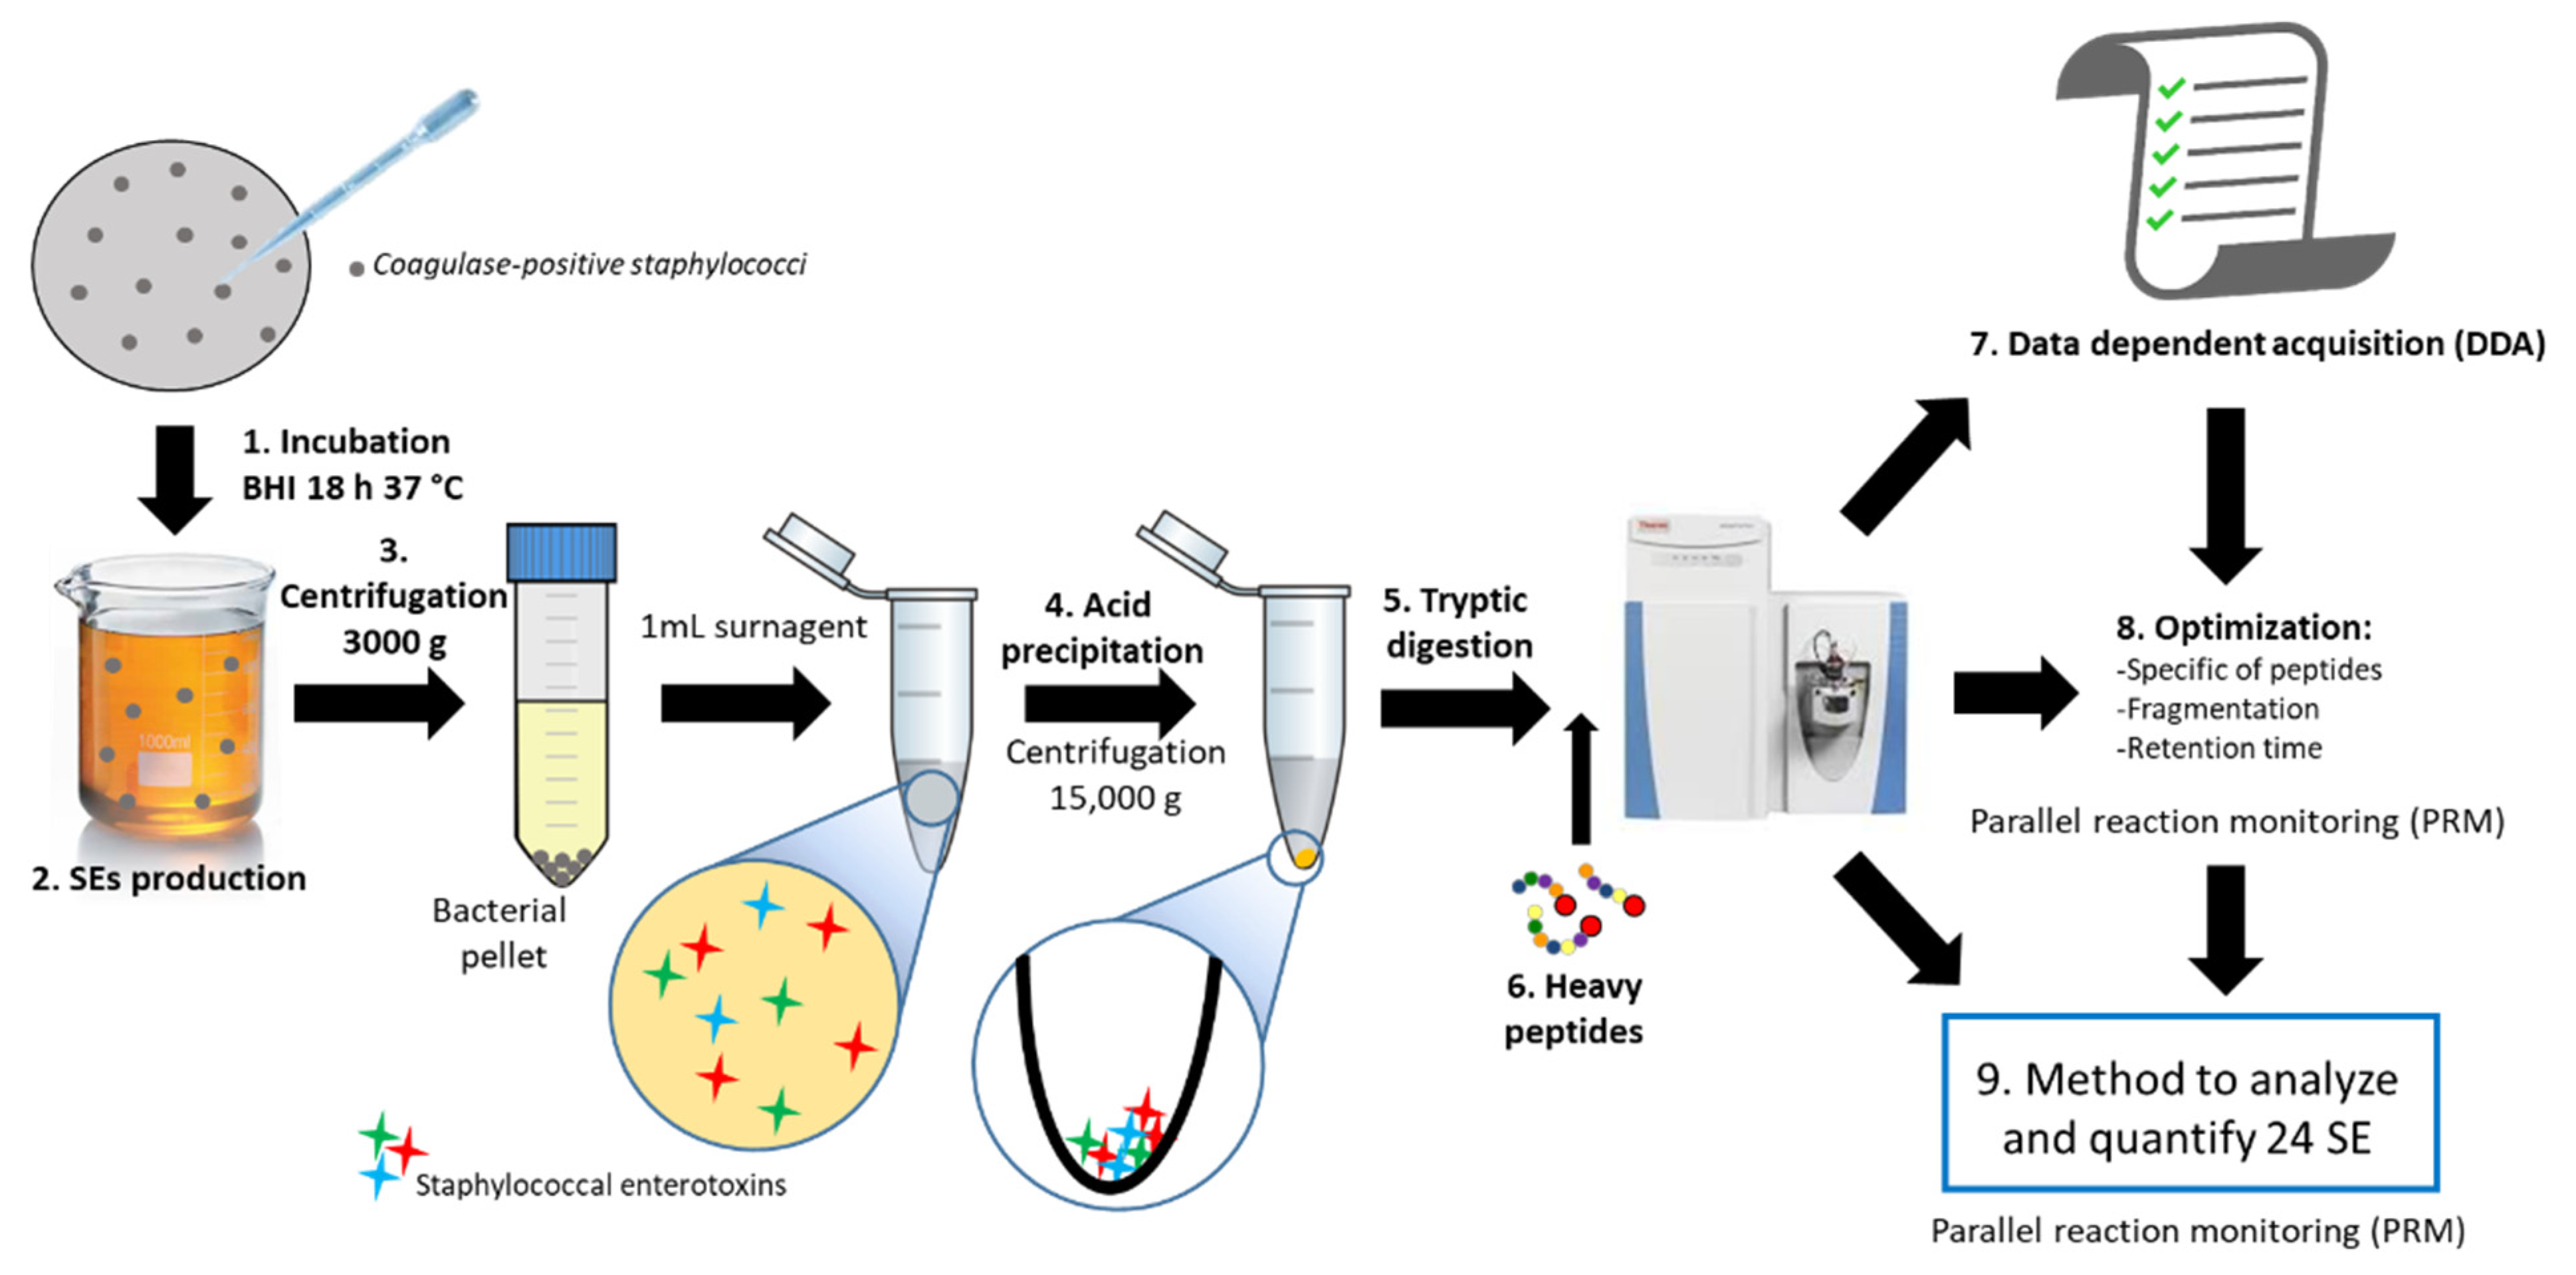
4.3. SE Expression in Culture Supernatant and Sample Preparation
4.4. Liquid Chromatography−Mass Spectrometry Analysis
Supplementary Materials
Author Contributions
Funding
Institutional Review Board Statement
Informed Consent Statement
Data Availability Statement
Acknowledgments
Conflicts of Interest
References
- Tatini, S.R. Thermal Stability of Enterotoxins in Food. J. Milk Food Technol. 1976, 39, 432–438. [Google Scholar] [CrossRef]
- Guillier, L.; Bergis, H.; Guillier, F.; Noel, V.; Auvray, F.; Hennekinne, J.-A. Dose-response Modelling of Staphylococcal Enterotoxins Using Outbreak Data. Procedia Food Sci. 2016, 7, 129–132. [Google Scholar] [CrossRef] [Green Version]
- The European Union One Health 2019 Zoonoses Report. EFSA J. 2021, 19, e06406.
- Munson, S.H.; Tremaine, M.T.; Betley, M.J.; Welch, R.A. Identification and Characterization of Staphylococcal Enterotoxin Types G and I from Staphylococcus aureus. Infect. Immun. 1998, 66, 3337–3348. [Google Scholar] [CrossRef] [Green Version]
- Hu, D.-L.; Omoe, K.; Shimoda, Y.; Nakane, A.; Shinagawa, K. Induction of Emetic Response to Staphylococcal Enterotoxins in the House Musk Shrew (Suncus murinus). Infect. Immun. 2003, 71, 567–570. [Google Scholar] [CrossRef] [PubMed] [Green Version]
- Ono, H.K.; Omoe, K.; Imanishi, K.; Iwakabe, Y.; Hu, D.-L.; Kato, H.; Saito, N.; Nakane, A.; Uchiyama, T.; Shinagawa, K. Identification and Characterization of Two Novel Staphylococcal Enterotoxins, Types S and T. Infect. Immun. 2008, 76, 4999–5005. [Google Scholar] [CrossRef] [Green Version]
- Omoe, K.; Hu, D.-L.; Ono, H.K.; Shimizu, S.; Takahashi-Omoe, H.; Nakane, A.; Uchiyama, T.; Shinagawa, K.; Imanishi, K. Emetic Potentials of Newly Identified Staphylococcal Enterotoxin-Like Toxins. Infect. Immun. 2013, 81, 3627–3631. [Google Scholar] [CrossRef] [Green Version]
- Ono, H.K.; Hirose, S.; Naito, I.; Sato’o, Y.; Asano, K.; Hu, D.-L.; Omoe, K.; Nakane, A. The emetic activity of staphylococcal enterotoxins, SEK, SEL, SEM, SEN and SEO in a small emetic animal model, the house musk shrew. Microbiol. Immunol. 2017, 61, 12–16. [Google Scholar] [CrossRef] [Green Version]
- Wilson, G.J.; Seo, K.S.; Cartwright, R.A.; Connelley, T.; Chuang-Smith, O.N.; Merriman, J.A.; Guinane, C.M.; Park, J.Y.; Bohach, G.A.; Schlievert, P.M.; et al. A Novel Core Genome-Encoded Superantigen Contributes to Lethality of Community-Associated MRSA Necrotizing Pneumonia. PLoS Pathog. 2011, 7, e1002271. [Google Scholar] [CrossRef] [Green Version]
- Ono, H.K.; Sato’o, Y.; Narita, K.; Naito, I.; Hirose, S.; Hisatsune, J.; Asano, K.; Hu, D.-L.; Omoe, K.; Sugai, M.; et al. Identification and Characterization of a Novel Staphylococcal Emetic Toxin. Appl. Environ. Microbiol. 2015, 81, 7034–7040. [Google Scholar] [CrossRef] [Green Version]
- Spoor, L.E.; Richardson, E.; Richards, A.C.; Wilson, G.J.; Mendonca, C.; Gupta, R.K.; McAdam, P.R.; Nutbeam-Tuffs, S.; Black, N.S.; O’Gara, J.P.; et al. Recombination-mediated remodelling of host–pathogen interactions during Staphylococcus aureus niche adaptation. Microb. Genom. 2015, 1, e000036. [Google Scholar] [CrossRef] [PubMed]
- Zhang, D.-F.; Yang, X.-Y.; Zhang, J.; Qin, X.; Huang, X.; Cui, Y.; Zhou, M.; Shi, C.; French, N.P.; Shi, X. Identification and characterization of two novel superantigens among Staphylococcus aureus complex. Int. J. Med. Microbiol. 2018, 308, 438–446. [Google Scholar] [CrossRef] [PubMed]
- Guidi, F.; Duranti, A.; Gallina, S.; Nia, Y.; Petruzzelli, A.; Romano, A.; Travaglini, V.; Olivastri, A.; Calvaresi, V.; Decastelli, L.; et al. Characterization of a Staphylococcal Food Poisoning Outbreak in a Workplace Canteen during the Post-Earthquake Reconstruction of Central Italy. Toxins 2018, 10, 523. [Google Scholar] [CrossRef] [PubMed] [Green Version]
- Denayer, S.; Delbrassinne, L.; Nia, Y.; Botteldoorn, N. Food-Borne Outbreak Investigation and Molecular Typing: High Diversity of Staphylococcus aureus Strains and Importance of Toxin Detection. Toxins 2017, 9, 407. [Google Scholar] [CrossRef] [PubMed] [Green Version]
- Ercoli, L.; Gallina, S.; Nia, Y.; Auvray, F.; Primavilla, S.; Guidi, F.; Pierucci, B.; Graziotti, C.; Decastelli, L.; Scuota, S. Investigation of a Staphylococcal Food Poisoning Outbreak from a Chantilly Cream Dessert, in Umbria (Italy). Foodborne Pathog. Dis. 2017, 14, 407–413. [Google Scholar] [CrossRef]
- Merda, D.; Felten, A.; Vingadassalon, N.; Denayer, S.; Titouche, Y.; Decastelli, L.; Hickey, B.; Kourtis, C.; Daskalov, H.; Mistou, M.-Y.; et al. NAuRA: Genomic Tool to Identify Staphylococcal Enterotoxins in Staphylococcus aureus Strains Responsible for FoodBorne Outbreaks. Front. Microbiol. 2020, 11, 1483. [Google Scholar] [CrossRef]
- Nia, Y.; Rodriguez, M.; Zeleny, R.; Herbin, S.; Auvray, F.; Fiebig, U.; Avondet, M.-A.; Munoz, A.; Hennekinne, J.-A. Organization and ELISA-Based Results of the First Proficiency Testing to Evaluate the Ability of European Union Laboratories to Detect Staphylococcal Enterotoxin Type B (SEB) in Buffer and Milk. Toxins 2016, 8, 268. [Google Scholar] [CrossRef]
- Nia, Y.; Lombard, B.; Gentil, S.; Neveux, L.; Mutel, I.; Guillier, F.; Messio, S.; Pairaud, S.; Herbin, S.; Guillier, L.; et al. Development and validation of the Standard method EN ISO 19020—Microbiology of the food chain—Horizontal method for the immunoenzymatic detection of staphylococcal enterotoxins in foodstuffs. Int. J. Food Microbiol. 2021, 354, 109319. [Google Scholar] [CrossRef]
- Ostyn, A.; Buyser, M.L.D.; Guillier, F.; Groult, J.; Félix, B.; Salah, S.; Delmas, G.; Hennekinne, J.A. First evidence of a food poisoning outbreak due to staphylococcal enterotoxin type E, France, 2009. Eurosurveillance 2010, 15, 19528. [Google Scholar] [CrossRef]
- Hennekinne, J.-A.; De Buyser, M.-L.; Dragacci, S. Staphylococcus aureus and its food poisoning toxins: Characterization and outbreak investigation. FEMS Microbiol. Rev. 2012, 36, 815–836. [Google Scholar] [CrossRef] [Green Version]
- Aguilar, J.L.; Varshney, A.K.; Pechuan, X.; Dutta, K.; Nosanchuk, J.D.; Fries, B.C. Monoclonal antibodies protect from Staphylococcal Enterotoxin K (SEK) induced toxic shock and sepsis by USA300 Staphylococcus aureus. Virulence 2017, 8, 741–750. [Google Scholar] [CrossRef] [PubMed] [Green Version]
- Ono, H.K.; Hachiya, N.; Suzuki, Y.; Naito, I.; Hirose, S.; Asano, K.; Omoe, K.; Nakane, A.; Hu, D.-L. Development of an Immunoassay for Detection of Staphylococcal Enterotoxin-Like J, A Non-Characterized Toxin. Toxins 2018, 10, 458. [Google Scholar] [CrossRef] [PubMed] [Green Version]
- Hu, D.-L.; Ono, H.K.; Isayama, S.; Okada, R.; Okamura, M.; Lei, L.C.; Liu, Z.S.; Zhang, X.-C.; Liu, M.Y.; Cui, J.C.; et al. Biological characteristics of staphylococcal enterotoxin Q and its potential risk for food poisoning. J. Appl. Microbiol. 2017, 122, 1672–1679. [Google Scholar] [CrossRef] [PubMed]
- Schubert, J.; Podkowik, M.; Bystroń, J.; Bania, J. Production of Staphylococcal Enterotoxins D and R in Milk and Meat Juice by Staphylococcus aureus Strains. Foodborne Pathog. Dis. 2017, 14, 223–230. [Google Scholar] [CrossRef]
- Aziz, F.; Hisatsune, J.; Yu, L.; Kajimura, J.; Sato’o, Y.; Ono, H.K.; Masuda, K.; Yamaoka, M.; Salasia, S.I.O.; Nakane, A.; et al. Staphylococcus aureus Isolated from Skin from Atopic-Dermatitis Patients Produces Staphylococcal Enterotoxin Y, Which Predominantly Induces T-Cell Receptor Vα-Specific Expansion of T Cells. Infect. Immun. 2020, 88, e00360-19. [Google Scholar] [CrossRef] [Green Version]
- Hait, J.M.; Nguyen, A.T.; Tallent, S.M. Analysis of the VIDAS® Staph Enterotoxin III (SET3) for Detection of Staphylococcal Enterotoxins, G, H, and I in Foods. J. AOAC Int. 2018, 101, 1482–1489. [Google Scholar] [CrossRef]
- Féraudet Tarisse, C.; Goulard-Huet, C.; Nia, Y.; Devilliers, K.; Marcé, D.; Dambrune, C.; Lefebvre, D.; Hennekinne, J.-A.; Simon, S. Highly Sensitive and Specific Detection of Staphylococcal Enterotoxins SEA, SEG, SEH, and SEI by Immunoassay. Toxins 2021, 13, 130. [Google Scholar] [CrossRef]
- Dupré, M.; Gilquin, B.; Fenaille, F.; Feraudet-Tarisse, C.; Dano, J.; Ferro, M.; Simon, S.; Junot, C.; Brun, V.; Becher, F. Multiplex Quantification of Protein Toxins in Human Biofluids and Food Matrices Using Immunoextraction and High-Resolution Targeted Mass Spectrometry. Anal. Chem. 2015, 87, 8473–8480. [Google Scholar] [CrossRef]
- Lefebvre, D.; Blanco-Valle, K.; Feraudet-Tarisse, C.; Merda, D.; Simon, S.; Fenaille, F.; Hennekinne, J.-A.; Nia, Y.; Becher, F. Quantitative Determination of Staphylococcus aureus Enterotoxins Types A to I and Variants in Dairy Food Products by Multiplex Immuno-LC-MS/MS. J. Agric. Food Chem. 2021, 69, 2603–2610. [Google Scholar] [CrossRef]
- Bernardo, K.; Fleer, S.; Pakulat, N.; Krut, O.; Hünger, F.; Krönke, M. Identification of Staphylococcus aureus exotoxins by combined sodium dodecyl sulfate gel electrophoresis and matrix-assisted laser desorption/ionization-time of flight mass spectrometry. Proteomics 2002, 2, 740–746. [Google Scholar] [CrossRef]
- Nakano, M.; Kawano, Y.; Kawagishi, M.; Hasegawa, T.; Iinuma, Y.; Ohta, M. Two-Dimensional Analysis of Exoproteins of Methicillin-Resistant Staphylococcus aureus (MRSA) for Possible Epidemiological Applications. Microbiol. Immunol. 2002, 46, 11–22. [Google Scholar] [CrossRef] [PubMed]
- Burlak, C.; Hammer, C.H.; Robinson, M.-A.; Whitney, A.R.; McGavin, M.J.; Kreiswirth, B.N.; DeLeo, F.R. Global analysis of community-associated methicillin-resistant Staphylococcus aureus exoproteins reveals molecules produced in vitro and during infection. Cell. Microbiol. 2007, 9, 1172–1190. [Google Scholar] [CrossRef] [PubMed] [Green Version]
- Pocsfalvi, G.; Cacace, G.; Cuccurullo, M.; Serluca, G.; Sorrentino, A.; Schlosser, G.; Blaiotta, G.; Malorni, A. Proteomic analysis of exoproteins expressed by enterotoxigenic Staphylococcus aureus strains. Proteomics 2008, 8, 2462–2476. [Google Scholar] [CrossRef] [PubMed]
- Ravipaty, S.; Reilly, J.P. Comprehensive Characterization of Methicillin-resistant Staphylococcus aureus subsp. aureus COL Secretome by Two-dimensional Liquid Chromatography and Mass Spectrometry. Mol. Cell. Proteom. 2010, 9, 1898–1919. [Google Scholar] [CrossRef] [Green Version]
- Wolf, C.; Kusch, H.; Monecke, S.; Albrecht, D.; Holtfreter, S.; von Eiff, C.; Petzl, W.; Rainard, P.; Bröker, B.M.; Engelmann, S. Genomic and proteomic characterization of Staphylococcus aureus mastitis isolates of bovine origin. Proteomics 2011, 11, 2491–2502. [Google Scholar] [CrossRef]
- Enany, S.; Yoshida, Y.; Magdeldin, S.; Zhang, Y.; Bo, X.; Yamamoto, T. Extensive proteomic profiling of the secretome of European community acquired methicillin resistant Staphylococcus aureus clone. Peptides 2012, 37, 128–137. [Google Scholar] [CrossRef]
- Enany, S.; Yoshida, Y.; Magdeldin, S.; Bo, X.; Zhang, Y.; Enany, M.; Yamamoto, T. Two dimensional electrophoresis of the exo-proteome produced from community acquired methicillin resistant Staphylococcus aureus belonging to clonal complex 80. Microbiol. Res. 2013, 168, 504–511. [Google Scholar] [CrossRef]
- Busche, T.; Hillion, M.; Loi, V.V.; Berg, D.; Walther, B.; Semmler, T.; Strommenger, B.; Witte, W.; Cuny, C.; Mellmann, A.; et al. Comparative Secretome Analyses of Human and Zoonotic Staphylococcus aureus Isolates CC8, CC22, and CC398. Mol. Cell. Proteom. 2018, 17, 2412–2433. [Google Scholar] [CrossRef] [Green Version]
- Silva, J.C.; Gorenstein, M.V.; Li, G.-Z.; Vissers, J.P.C.; Geromanos, S.J. Absolute Quantification of Proteins by LCMSE: A Virtue of Parallel ms Acquisition. Mol. Cell. Proteom. 2006, 5, 144–156. [Google Scholar] [CrossRef] [Green Version]
- Kriegeskorte, A.; König, S.; Sander, G.; Pirkl, A.; Mahabir, E.; Proctor, R.A.; von Eiff, C.; Peters, G.; Becker, K. Small colony variants of Staphylococcus aureus reveal distinct protein profiles. Proteomics 2011, 11, 2476–2490. [Google Scholar] [CrossRef]
- Muntel, J.; Fromion, V.; Goelzer, A.; Maaβ, S.; Mäder, U.; Büttner, K.; Hecker, M.; Becher, D. Comprehensive Absolute Quantification of the Cytosolic Proteome of Bacillus subtilis by Data Independent, Parallel Fragmentation in Liquid Chromatography/Mass Spectrometry (LC/MSE). Mol. Cell. Proteom. 2014, 13, 1008–1019. [Google Scholar] [CrossRef] [PubMed] [Green Version]
- Langella, O.; Valot, B.; Balliau, T.; Blein-Nicolas, M.; Bonhomme, L.; Zivy, M. X!TandemPipeline: A Tool to Manage Sequence Redundancy for Protein Inference and Phosphosite Identification. J. Proteome Res. 2017, 16, 494–503. [Google Scholar] [CrossRef] [PubMed]
- Muratovic, A.Z.; Hagström, T.; Rosén, J.; Granelli, K.; Hellenäs, K.-E. Quantitative Analysis of Staphylococcal Enterotoxins A and B in Food Matrices Using Ultra High-Performance Liquid Chromatography Tandem Mass Spectrometry (UPLC-MS/MS). Toxins 2015, 7, 3637–3656. [Google Scholar] [CrossRef] [PubMed] [Green Version]
- Andjelkovic, M.; Tsilia, V.; Rajkovic, A.; De Cremer, K.; Van Loco, J. Application of LC-MS/MS MRM to Determine Staphylococcal Enterotoxins (SEB and SEA) in Milk. Toxins 2016, 8, 118. [Google Scholar] [CrossRef] [PubMed] [Green Version]
- Gilquin, B.; Jaquinod, M.; Louwagie, M.; Kieffer-Jaquinod, S.; Kraut, A.; Ferro, M.; Becher, F.; Brun, V. A proteomics assay to detect eight CBRN-relevant toxins in food. Proteomics 2017, 17, 1600357. [Google Scholar] [CrossRef]
- Brun, V.; Dupuis, A.; Adrait, A.; Marcellin, M.; Thomas, D.; Court, M.; Vandenesch, F.; Garin, J. Isotope-labeled Protein Standards: Toward Absolute Quantitative Proteomics. Mol. Cell. Proteom. 2007, 6, 2139–2149. [Google Scholar] [CrossRef] [Green Version]
- Gallien, S.; Bourmaud, A.; Kim, S.Y.; Domon, B. Technical considerations for large-scale parallel reaction monitoring analysis. J. Proteom. 2014, 100, 147–159. [Google Scholar] [CrossRef]
- Peterson, A.C.; Russell, J.D.; Bailey, D.J.; Westphall, M.S.; Coon, J.J. Parallel reaction monitoring for high resolution and high mass accuracy quantitative, targeted proteomics. Mol. Cell. Proteom. 2012, 11, 1475–1488. [Google Scholar] [CrossRef] [Green Version]
- Schwendimann, L.; Merda, D.; Berger, T.; Denayer, S.; Feraudet-Tarisse, C.; Kläui, A.J.; Messio, S.; Mistou, M.Y.; Nia, Y.; Hennekinne, J.A.; et al. Staphylococcal Enterotoxin Gene Cluster: Prediction of Enterotoxin (SEG and SEI) Production and of the Source of Food Poisoning on the Basis of vSaβ Typing. Appl. Env. Microbiol. 2021, 87, e0266220. [Google Scholar] [CrossRef]
- Omoe, K.; Ishikawa, M.; Shimoda, Y.; Hu, D.-L.; Ueda, S.; Shinagawa, K. Detection of seg, seh, and sei genes in Staphylococcus aureus Isolates and Determination of the Enterotoxin Productivities of S. aureus Isolates Harboring seg, seh, or sei Genes. J. Clin. Microbiol. 2002, 40, 857–862. [Google Scholar] [CrossRef] [Green Version]
- Nagaraj, S.; Ramlal, S.; Kingston, J.; Batra, H.V. Development of IgY based sandwich ELISA for the detection of staphylococcal enterotoxin G (SEG), an egc toxin. Int. J. Food Microbiol. 2016, 237, 136–141. [Google Scholar] [CrossRef] [PubMed]
- Jørgensen, H.J.; Mathisen, T.; Løvseth, A.; Omoe, K.; Qvale, K.S.; Loncarevic, S. An outbreak of staphylococcal food poisoning caused by enterotoxin H in mashed potato made with raw milk. FEMS Microbiol. Lett. 2005, 252, 267–272. [Google Scholar] [CrossRef] [PubMed] [Green Version]
- Lefebvre, D.; Fenaille, F.; Merda, D.; Blanco-Valle, K.; Feraudet-Tarisse, C.; Simon, S.; Hennekinne, J.-A.; Nia, Y.; Becher, F. Top-Down Mass Spectrometry for Trace Level Quantification of Staphylococcal Enterotoxin A Variants. J. Proteome Res. 2021, 21, 547–556. [Google Scholar] [CrossRef] [PubMed]


| Strain | sea | seb | sec | sed | see | seg | seh | sei | selj | sek | sel | sem | sen | seo | sep | seq | ser | ses | set | seu | selx | sey | selz | tsst1 |
|---|---|---|---|---|---|---|---|---|---|---|---|---|---|---|---|---|---|---|---|---|---|---|---|---|
| 05CEB51 | 1 | 1 | 1 | 1 | 1 | 1 | 1 | 19 | 17 | 17 | ||||||||||||||
| 05CEB52 | 2 | 2 | 2 | 2 | 2 | 2 | 2 | 4 | 2 | 2 | ||||||||||||||
| 05CEB53 | 3 | 3 | 3 | 5 | 3 | 3 | 3 | 5 | ||||||||||||||||
| 06CEB196 | 3 | 5 | 1 | 5 | 4 | 1 | 45 | |||||||||||||||||
| 06CEB83 | 8 | 6 | 4 | 2 | ||||||||||||||||||||
| 08CEB393 | 3 | 4 | 3 | 15 | 3 | 3 | 2 | 1 | 3 | 9 | ||||||||||||||
| 08CEB402 | 36 | 7 | ||||||||||||||||||||||
| 09CEB231 | 3 | 1 | 1 | 5 | 5 | |||||||||||||||||||
| 09CEB303 | 2 | 2 | 1 | 1 | 5 | |||||||||||||||||||
| 09CEB314 | 2 | 12 | ||||||||||||||||||||||
| 10CEB282 | 3 | 4 | 6 | 3 | 3 | 9 | ||||||||||||||||||
| 10CEB401 | 3 | 4 | 2 | 4 | 2 | 5 | ||||||||||||||||||
| 11CEB110 | 7 | 4 | 4 | 7 | 6 | 5 | 34 | 6 | ||||||||||||||||
| 12CEB137 | 2 | 2 | 14 | 4 | ||||||||||||||||||||
| 12CEB368 | 1 | 3 | 1 | 15 | 3 | |||||||||||||||||||
| 12CEB496 | 3 | 3 | 3 | 16 | ||||||||||||||||||||
| 12CEB512 | 5 | 6 | 4 | 5 | 3 | 4 | 10 | 1 | ||||||||||||||||
| 13CEB193 | 2 | 2 | 2 | 7 | 2 | |||||||||||||||||||
| 13CEB437 | 3 | 3 | 3 | 10 | 3 | 3 | 3 | 6 | ||||||||||||||||
| 14A/FRI361 | 3 | 1 | 3 | 3 | 1 | 5 | 8 | 3 | 3 | 1 | 5 | |||||||||||||
| 14SBCL1004 | 3 | 10 | 4 | 5 | ||||||||||||||||||||
| 14SBCL770 | 1 | 4 | 10 | 5 | 4 | 4 | 1 | 3 | ||||||||||||||||
| 15SBCL1151 | 1 | 3 | 4 | 7 | 4 | 3 | 3 | 5 | 9 | |||||||||||||||
| 15SBCL1428 | 3 | 4 | 4 | 3 | 3 | 4 | 10 | 1 | ||||||||||||||||
| 15SBCL1438 | 7 | 11 | 1 | 6 | 5 | 9 | 22 | 4 | 1 | 5 | ||||||||||||||
| 15SBCL452 | 3 | 3 | 4 | 1 | 4 | 3 | 3 | 4 | 9 | |||||||||||||||
| 16SBCL1028 | 3 | 1 | ||||||||||||||||||||||
| 16SBCL1204 | 2 | 12 | 2 | 8 | 7 | 10 | 4 | 2 | 2 | |||||||||||||||
| 16SBCL1368 | 4 | 1 | 8 | 5 | 1 | |||||||||||||||||||
| 16SBCL246 | 3 | 1 | 4 | 8 | 4 | 24 | ||||||||||||||||||
| 16SBCL259 | 3 | 25 | ||||||||||||||||||||||
| 16SBCL899 | 4 | 4 | 5 | 5 | 4 | 4 | 1 | 3 | ||||||||||||||||
| 17SBCL25 | 3 | 13 | 9 | 9 | 9 | 11 | 28 | |||||||||||||||||
| 17SBCL330 | 5 | 3 | 3 | 12 | 8 | 3 | 3 | 5 | 6 | |||||||||||||||
| 17SBCL693 | 3 | 11 | 2 | 2 | 9 | 2 | 3 | |||||||||||||||||
| 18SBCL601 | 4 | 3 | ||||||||||||||||||||||
| 18SBCL855 | 2 | 3 | 15 | 1 | 4 | 3 | 14 | 2 | 1 | 9 | ||||||||||||||
| 19SBCL1059 | 3 | 4 | 18 | 3 | 3 | 2 | 9 | |||||||||||||||||
| 19SBCL591 | 3 | 2 | 9 | 2 | 3 | |||||||||||||||||||
| 20SBCL08 | 1 | 7 | 4 | 7 | 4 | 7 | 6 | 5 | 3 | |||||||||||||||
| 337E | 4 | 3 | 4 | 4 | 7 | 21 | 5 | 41 | ||||||||||||||||
| 349E | 3 | 5 | 4 | 1 | 5 | |||||||||||||||||||
| 352E | 13 | 8 | 1 | 6 | 5 | 9 | 22 | 4 | 1 | 5 | ||||||||||||||
| 356E | 3 | 4 | 4 | 3 | 22 | 4 | 10 | 1 | ||||||||||||||||
| 42A/FRIS6 | 1 | 1 | 1 | 1 | 5 | |||||||||||||||||||
| 43A/FRI137 | 1 | 1 | 1 | 1 | 1 | 1 | 1 | 1 | 7 | 17 | ||||||||||||||
| 44A/FRI1230 | 3 | 4 | 4 | 1 | 5 | 3 | ||||||||||||||||||
| 45A/FRI1151M | 3 | 1 | 1 | 5 | ||||||||||||||||||||
| 46A/FRI326 | 1 | 3 | 5 | |||||||||||||||||||||
| Number of variants | 4 | 4 | 10 | 4 | 3 | 6 | 4 | 12 | 4 | 8 | 11 | 9 | 9 | 13 | 3 | 5 | 4 | 2 | 1 | 10 | 20 | 6 | 4 | 6 |
| SEA Peptide | m/z | z | RT (min) | NCE% | Fragments (1) | Detected (2) | Not Detected (3) | Shared Peptides (4) | Peptide Ratio | Specific Peptide (5) |
|---|---|---|---|---|---|---|---|---|---|---|
| GLIVFHTSTEPSVNYDLFGAQGQYSNTLLR | 1109.8930 | 3+ | 14.9 | 18 | y9+, y10+, y12+ | 2, 3 | 1, 4 | 0.67 | Yes | |
| NVTVQELDLQAR | 693.3728 | 2+ | 9.5 | 21 | y9+, y8+, y10+ | 1, 3, 4 | 2 | 1.27 | Yes | |
| QNTVPLETVK | 564.8166 | 2+ | 7.3 | 18 | y6+, y6++, y8+ | 1, 2, 3, 4 | 1.00 | Yes | ||
| SELQGTALGNLK | 615.8381 | 2+ | 8.5 | 21 | y8+, y9+, y10+ | 3, 4 | 1, 2 | 0.18 | ||
| YNLYNSDVFDGK | 717.8304 | 2+ | 10 | 18 | y8+, y9+, y10+ | 1, 3, 4 | 2 | 0.77 | Yes | |
| GFFTDHSWYNDLLVDFDSK | 769.3515 | 3+ | 15.9 | 18 | y5+, y6+, y7+ | 3 | 1, 2, 4 | 0.18 | ||
| QIYYYNEK | 560.7691 | 2+ | 6.0 | 18 | y4+, y5+, y6+ | 1, 3, 4 | 2 | SEE1, 2, 3 | 0.48 | |
| SELQGAALGNLK | 600.8328 | 2+ | 8.5 | 18 | y6+, y8+, y9+ | 1 | 2, 3, 4 | 0.25 | ||
| GLIVFHTSTEPSVNYDLFGAQGQNSNTLLR | 1093.5529 | 3+ | 14.4 | 18 | y9+, y10+, y12+ | 1, 4 | 2, 3 | 0.76 | ||
| GFFTNHSWYNDLLVDFDSK | 769.0235 | 3+ | 15.4 | 18 | y5+, y6+, y7+ | 1, 4 | 2, 3 | 0.04 | ||
| EVTVQELDLQAR | 700.8726 | 2+ | 9.8 | 18 | y6+, y7+, y8+ | 2 | 1, 3, 4 | SEE1, 2, 3 | 0.61 | Yes |
| SELQGVALDNLR | 657.8542 | 2+ | 10.1 | 18 | y5+, y6+, y8+ | 2 | 1, 3, 4 | 0.86 |
| SEA | SEB | SEC | SED | SEE | SEG | SEH | SEI | SElJ | SEK | SEL | SEM | SEN | SEO | SEP | SEQ | SER | SES | SET | SElU | SElX | SEY | SElZ | TSST1 | Total | |
|---|---|---|---|---|---|---|---|---|---|---|---|---|---|---|---|---|---|---|---|---|---|---|---|---|---|
| Strains containing the se gene | 14 | 7 | 17 | 6 | 3 | 23 | 6 | 26 | 9 | 8 | 16 | 24 | 25 | 26 | 5 | 9 | 9 | 2 | 1 | 20 | 42 | 10 | 6 | 9 | 323 |
| Strains negative for targeted se gene | 35 | 42 | 32 | 43 | 46 | 26 | 43 | 23 | 40 | 41 | 33 | 25 | 24 | 23 | 44 | 40 | 40 | 47 | 48 | 29 | 7 | 39 | 43 | 40 | 853 |
| Corresponding enterotoxin detected | 14 | 7 | 17 | 6 | 3 | 23 | 6 | 26 | 9 | 8 | 15 | 24 | 19 | 23 | 5 | 9 | 9 | 2 | 1 | 18 | 42 | 10 | 6 | 9 | 311 |
| Positive deviation | 0 | 0 | 0 | 0 | 0 | 0 | 0 | 0 | 0 | 0 | 0 | 0 | 0 | 0 | 0 | 0 | 0 | 0 | 0 | 0 | 0 | 0 | 0 | 0 | 12 |
| Negative deviation | 0 | 0 | 0 | 0 | 0 | 0 | 0 | 0 | 0 | 0 | 1 | 0 | 6 | 3 | 0 | 0 | 0 | 0 | 0 | 2 | 0 | 0 | 0 | 0 | 0 |
| Specificity (%) | 100 | 100 | 100 | 100 | 100 | 100 | 100 | 100 | 100 | 100 | 100 | 100 | 100 | 100 | 100 | 100 | 100 | 100 | 100 | 100 | 100 | 100 | 100 | 100 | 100 |
| Sensitivity (%) | 100 | 100 | 100 | 100 | 100 | 100 | 100 | 100 | 100 | 100 | 93.8 | 100 | 76.0 | 88.5 | 100 | 100 | 100 | 100 | 100 | 90.0 | 100 | 100 | 100 | 100 | 96.3 |
| Accuracy (%) | 100 | 100 | 100 | 100 | 100 | 100 | 100 | 100 | 100 | 100 | 98.0 | 100 | 87.7 | 93.9 | 100 | 100 | 100 | 100 | 100 | 95.9 | 100 | 100 | 100 | 100 | 99.0 |
| fMol | 10 | 20 | 40 | 100 | 200 | 400 | 1000 | 2000 | 4000 | 10,000 | 20,000 |
|---|---|---|---|---|---|---|---|---|---|---|---|
| SEA | −79.7 | −49.4 | −37.9 | −22.6 | −13.0 | −9.0 | −12.6 | −10.5 | −9.0 | −12.6 | −3.6 |
| SEB | −53.6 | −26.5 | −28.6 | −18.6 | −11.8 | −3.7 | −8.3 | −8.5 | −6.4 | −10.0 | 0.5 |
| SEC | −43.3 | 24.6 | −1.5 | 28.1 | 29.4 | 34.9 | 33.9 | 31.9 | 32.6 | 32.0 | 36.5 |
| SED | −90.5 | −47.6 | −37.8 | −35.2 | −26.7 | −20.1 | −23.0 | −21.5 | −20.1 | −18.7 | −7.5 |
| SEE | −26.7 | −4.4 | 17.8 | 26.1 | 27.3 | 35.9 | 32.5 | 27.8 | 24.5 | 15.7 | 12.2 |
| Concentration of Staphylococcal Enterotoxins Type | Total [SE] in the Sample | ||||||||||||||||||||||||
|---|---|---|---|---|---|---|---|---|---|---|---|---|---|---|---|---|---|---|---|---|---|---|---|---|---|
| SEA | SEB | SEC | SED | SEE | SEG | SEH | SEI | SElJ | SEK | SEL | SEM | SEN | SEO | SEP | SEQ | SER | SES | SET | SElU | SElX | SEY | SElZ | TSST1 | ||
| 16SBCL1204 | (1) | <1 (2) | <1 | <1 | ND (3) | <1 | <1 | 1.4 | 2.0 | <1 | 3.4 | ||||||||||||||
| 10CEB282 | <1 | <1 | 2.3 | <1 | <1 | 1.5 | 3.9 | ||||||||||||||||||
| 15SBCL1428 | <1 | <1 | 1.2 | <1 | <1 | <1 | <1 | 6.1 | 7.3 | ||||||||||||||||
| 08CEB402 | 5.1 | 2.8 | 7.9 | ||||||||||||||||||||||
| 08CEB393 | <1 | <1 | <1 | <1 | <1 | <1 | <1 | 4.6 | 6.0 | 1.9 | 12.5 | ||||||||||||||
| 11CEB110 | 1.3 | <1 | 3.8 | <1 | <1 | 1.6 | <1 | 6.5 | 13.2 | ||||||||||||||||
| 19SBCL1059 | <1 | <1 | 3.8 | <1 | <1 | 5.4 | 8.9 | 18.0 | |||||||||||||||||
| 356E | 1.1 | <1 | 5.2 | <1 | <1 | 2.9 | 9.1 | 5.0 | 23.2 | ||||||||||||||||
| 16SBCL1028 | 8.0 | 17.1 | 25.1 | ||||||||||||||||||||||
| 16SBCL246 | 1.1 | <1 | 5.7 | <1 | 2.7 | 17.0 | 26.6 | ||||||||||||||||||
| 337E | 20.2 | <1 | <1 | 2.5 | <1 | <1 | <1 | 7.2 | 29.9 | ||||||||||||||||
| 15SBCL1438 | 2.2 | <1 | 10.0 | ND | ND | <1 | <1 | 4.4 | 11.2 | 2.9 | 30.7 | ||||||||||||||
| 14SBCL770 | 13.7 | <1 | <1 | <1 | ND | <1 | <1 | 28.7 | 42.4 | ||||||||||||||||
| 12CEB512 | <1 | <1 | 4.2 | <1 | <1 | 1.5 | 32.0 | 5.0 | 42.8 | ||||||||||||||||
| 18SBCL601 | 60.0 | 13.5 | 73.5 | ||||||||||||||||||||||
| 09CEB231 | 26.8 | 28.4 | <1 | 17.1 | 4.5 | 76.8 | |||||||||||||||||||
| 16SBCL899 | 18.6 | <1 | <1 | <1 | ND | ND | <1 | 59.6 | 78.2 | ||||||||||||||||
| 16SBCL259 | 44.5 | 46.8 | 91.3 | ||||||||||||||||||||||
| 09CEB314 | 23.0 | 70.1 | 93.1 | ||||||||||||||||||||||
| 45A | 80.1 | <1 | 15.2 | 2.1 | 97.4 | ||||||||||||||||||||
| 12CEB137 | 65.2 | 10.1 | 1.7 | 38.2 | 115.1 | ||||||||||||||||||||
| 18SBCL855 | 57.7 | 1.2 | <1 | <1 | 4.7 | <1 | <1 | 11.9 | 29.6 | 15.1 | 120.2 | ||||||||||||||
| 09CEB303 | 7.0 | 21.2 | 18.0 | 65.6 | 18.1 | 129.9 | |||||||||||||||||||
| 46A | 106.1 | 27.7 | 36.9 | 170.7 | |||||||||||||||||||||
| 15SBCL452 | 98.1 | <1 | <1 | <1 | 4.3 | <1 | <1 | 30.5 | 38.4 | 171.3 | |||||||||||||||
| 349E | 82.4 | 62.2 | <1 | 31.4 | 4.6 | 180.7 | |||||||||||||||||||
| 352E | 116.1 | <1 | 6.4 | ND | ND | ND | <1 | 3.7 | 5.6 | 73.0 | 204.8 | ||||||||||||||
| 06CEB196 | 39.9 | 67.4 | <1 | 27.0 | 40.0 | 33.2 | 12.2 | 219.7 | |||||||||||||||||
| 19SBCL591 | 56.5 | 62.6 | 32.4 | 69.7 | 25.9 | 247.1 | |||||||||||||||||||
| 43A | 218.4 | <1 | 121.9 | <1 | 30.2 | <1 | <1 | <1 | ND | 11.0 | 381.5 | ||||||||||||||
| 20SBCL08 | 393.7 | 1.9 | 4.6 | 18.9 | 7.2 | 1.3 | <1 | 4.2 | 32.6 | 464.4 | |||||||||||||||
| 17SBCL693 | 76.5 | 157.4 | 32.4 | 49.2 | 10.3 | 112.4 | 31.1 | 469.3 | |||||||||||||||||
| 16SBCL1368 | 28.2 | 167.2 | 11.1 | 45.7 | 386.9 | 639.2 | |||||||||||||||||||
| 44A | 550.5 | 37.8 | <1 | 61.4 | 9.7 | 5.9 | 665.4 | ||||||||||||||||||
| 05CEB52 | 710.8 | 2.6 | 1.3 | 2.3 | <1 | 2.0 | 3.1 | 52.5 | 35.4 | 3.6 | 813.7 | ||||||||||||||
| 05CEB53 | 1731.3 | <1 | <1 | 3.4 | 1.8 | <1 | <1 | 1.0 | 1737.5 | ||||||||||||||||
| 15SBCL1151 | 2434.4 | 3.6 | 6.9 | 41.3 | 12.6 | 1.4 | 2.7 | 95.8 | 62.1 | 2660.7 | |||||||||||||||
| 13CEB193 | 66.0 | 2592.1 | 6.9 | <1 | 460.5 | 3125.5 | |||||||||||||||||||
| 12CEB368 | 3285.9 | 32.1 | 41.0 | 1.5 | 7.4 | 3367.9 | |||||||||||||||||||
| 17SBCL330 | 3371.7 | <1 | <1 | 7.2 | 2.7 | <1 | <1 | 1.4 | 25.1 | 3408.2 | |||||||||||||||
| 06CEB83 | 3323.9 | 79.5 | 6.5 | 129.0 | 3538.9 | ||||||||||||||||||||
| 05CEB51 | 4341.8 | <1 | 52.1 | <1 | 12.5 | <1 | ND | <1 | <1 | 33.8 | 4440.3 | ||||||||||||||
| 17SBCL25 | 5154.5 | <1 | 1.0 | <1 | <1 | <1 | 46.2 | 5201.7 | |||||||||||||||||
| 13CEB437 | 5524.9 | <1 | <1 | ND | 2.6 | <1 | <1 | 1.5 | 5529.0 | ||||||||||||||||
| 12CEB496 | 124.1 | 5651.8 | 45.9 | 29.5 | 5851.2 | ||||||||||||||||||||
| 10CEB401 | 64.4 | 6238.2 | 20.5 | 13.5 | 44.5 | 9.5 | 6390.7 | ||||||||||||||||||
| 14A | 7798.6 | 30.1 | <1 | <1 | <1 | 7.9 | 2.0 | <1 | <1 | 47.1 | <1 | 7885.7 | |||||||||||||
| 14SBCL1004 | 94.1 | 8364.9 | 17.7 | 16.3 | 8493.0 | ||||||||||||||||||||
| 42A | 43.7 | 21,943.4 | 35.4 | 59.8 | 20.9 | 22,103.2 | |||||||||||||||||||
| Median | 60.5 | 3285.9 | 1731.3 | 60.0 | 44.5 | <1 | 56.0 | <1 | <1 | 33.9 | 10.3 | 2.4 | <1 | <1 | 5.4 | 59.8 | 29.6 | 12.0 | 65.6 | <1 | 11.6 | 5.0 | 5.8 | 59.6 | |
| max | 124.1 | 21,943.4 | 8364.9 | 80.1 | 106.1 | 3.6 | 121.9 | 6.9 | 7.0 | 49.2 | 79.5 | 12.6 | 1.4 | 2.7 | 11.9 | 112.4 | 47.1 | 18.0 | 65.6 | 4.2 | 70.1 | 35.4 | 36.9 | 460.5 | |
| min | 13.7 | 20.2 | 2.2 | 28.4 | 23.0 | <1 | 32.4 | <1 | <1 | 20.5 | 3.4 | <1 | <1 | <1 | <1 | 27.7 | 4.6 | 6.0 | 65.6 | <1 | <1 | 2.0 | <1 | 2.9 | |
| SE number | 14 | 7 | 17 | 6 | 3 | 23 | 6 | 26 | 9 | 8 | 16 | 24 | 25 | 26 | 5 | 9 | 9 | 2 | 1 | 20 | 42 | 10 | 6 | 9 | |
Publisher’s Note: MDPI stays neutral with regard to jurisdictional claims in published maps and institutional affiliations. |
© 2022 by the authors. Licensee MDPI, Basel, Switzerland. This article is an open access article distributed under the terms and conditions of the Creative Commons Attribution (CC BY) license (https://creativecommons.org/licenses/by/4.0/).
Share and Cite
Lefebvre, D.; Blanco-Valle, K.; Hennekinne, J.-A.; Simon, S.; Fenaille, F.; Becher, F.; Nia, Y. Multiplex Detection of 24 Staphylococcal Enterotoxins in Culture Supernatant Using Liquid Chromatography Coupled to High-Resolution Mass Spectrometry. Toxins 2022, 14, 249. https://doi.org/10.3390/toxins14040249
Lefebvre D, Blanco-Valle K, Hennekinne J-A, Simon S, Fenaille F, Becher F, Nia Y. Multiplex Detection of 24 Staphylococcal Enterotoxins in Culture Supernatant Using Liquid Chromatography Coupled to High-Resolution Mass Spectrometry. Toxins. 2022; 14(4):249. https://doi.org/10.3390/toxins14040249
Chicago/Turabian StyleLefebvre, Donatien, Kevin Blanco-Valle, Jacques-Antoine Hennekinne, Stéphanie Simon, François Fenaille, François Becher, and Yacine Nia. 2022. "Multiplex Detection of 24 Staphylococcal Enterotoxins in Culture Supernatant Using Liquid Chromatography Coupled to High-Resolution Mass Spectrometry" Toxins 14, no. 4: 249. https://doi.org/10.3390/toxins14040249