Article

Insight into the Molecular Mechanism for the Discrepant Inhibition of Microcystins (MCLR, LA, LF, LW, LY) on Protein Phosphatase 2A

College of Geography and Environment, Shandong Normal University, Jinan 250061, China
*
Author to whom correspondence should be addressed.
Toxins 2022, 14(6), 390; https://doi.org/10.3390/toxins14060390
Submission received: 11 May 2022 / Revised: 29 May 2022 / Accepted: 1 June 2022 / Published: 3 June 2022
(This article belongs to the Section Marine and Freshwater Toxins)

Abstract

:
Microcystins (MCs) exhibit diversified inhibition effects on protein phosphatases (PPs) due to their structural differences. To fully evaluate the potential mechanism for the discrepant inhibition effects, the five most frequent MCs with varying residues at position Z4 were selected as the tested toxins. Their inhibition sequence on PP2A was detected as follows: MCLR > MCLW > MCLA > MCLF > MCLY. Combined with homology modeling and molecular docking technology, the major interaction parameters between the MCs and PP2A were obtained. The correlation analysis for the major interaction parameters and inhibition effects showed that the hydrophobicity of Z4 had an important influence on the interaction of the MCs to PP2A. The introduction of hydrophobic Z4 directly weakened hydrogen bonds Z4→Pro213 and Z4←Arg214, indirectly weakened hydrogen bonds Adda5←Asn117, Glu6←Arg89, and MeAsp3←Arg89, but indirectly enhanced ionic bonds Glu6←Arg89, Glu6-Mn12+, and Glu6-Mn22+. In this way, the combination of the MCs with PP2A was blocked, and thus, the interactions between PP2A and the Mn2+ ions (in the catalytic center) were further affected; metal bonds Asp85-Mn12+ and Asp85-Mn22+ were weakened, while metal bond His241-Mn12+ was enhanced. As a result, the interactions in the catalytic center were inhibited to varying degrees, resulting in the reduced toxicity of MCs.
Key Contribution: This manuscript established a feasible approach to evaluate the mechanism for the discrepant inhibition of MCs on PP2A.

Graphical Abstract

1. Introduction

Toxic microcystins (MCs), produced by blue-green cyanobacterial, pose a worldwide threat to humans and wildlife [1,2]. When orally ingested, MCs can be transported to the liver by organic anion transport proteins [3,4]. Within the hepatic cells, MCs are inclined to inhibit the activity of serine/threonine protein phosphatase 1 and 2A (PP1 and PP2A) [5,6]. In this way, the balance between protein phosphorylation and dephosphorylation is destroyed, and thus, the cytoskeleton of hepatic cells is disrupted [7,8].
MCs are a class of monocyclic heptapeptides that share a common structure of cyclo-(d-Ala1-L-X2-d-isoAsp3-l-Z4-Adda5-d-isoGlu6-Mdha7) [9]. Due to the variable amino acids at positions 2 and 4, multiple variants have been identified [1,10]. Among MC variants, the most widespread and toxic congener MCLR was widely studied [11]. In consideration of its environmental risk, the World Health Organization recommended a provisional guideline value for MCLR (1 μg/L) in drinking water [12]. Based on the crystal structure analysis for the complexes of MCLR-PP1 and MCLR-PP2A, a two-step inhibition process was certified: for the reversible step, the hydrophobic side chain of Adda5 is rapidly wrapped in the hydrophobic cage structures of PP1/PP2A; for the irreversible step, the C=C double bond of Mdha7 undergoes an electrophilic addition reaction with the nucleophilic sites (Cys residue) in PP1/PP2A [13,14,15]. Both two steps together lead to decreased catalytic activity and cell necrosis.
Compared with MCLR, other MC variants also have cyclic peptide structures and identical Adda5/Mdha7 residues (Figure 1) [8,16]. The inhibition processes for other variants to PP1/PP2A also should include the reversible and irreversible steps. Due to the structural differences of MC variants, their inhibition effects on PP1/PP2A exhibit diversification [17,18]. As information about the crystal structures of MCs-PP1/PP2A is limited, it is difficult to elucidate the molecular mechanism for the discrepant inhibition of MCs on PP1/PP2A. Homology modeling could evaluate the interactions between structural analogues and macromolecules, and it has been successively used to evaluate the interactions between drugs/contaminants and proteins [19,20,21].
Based on the homology modeling strategy, the interactions between MCs and PP1/PP2A can be simulated, and the molecular mechanism for the discrepant inhibition effects of MCs can be evaluated more in-depth. The five most frequent MCs with the changed Z4 residues (MCLR, LF, LA, LY, and LW) were selected as the typical variants, and their inhibition effects on PP2A were explored by a colorimetric protein phosphatase inhibition assay [22,23]. With the assistance of the molecular simulation, the models for MC-PP2A were constructed based on the crystal structure of the MCLR-PP2A complex. The major interaction parameters (such as combination energy changes, combination areas, related surface areas, and related chemical bonds) between typical MCs and PP2A were obtained by molecular docking. By analyzing the correlation between the inhibition data and the major interaction parameters, the key interactions and related sites were filtrated. Thus, the molecular mechanism for the discrepant inhibition of typical MCs on PP2A was clarified.

2. Results and Discussion

2.1. Evaluation of the Inhibition Effect of Typical MCs Targeted to PP2A

A traditional colorimetric PP inhibition assay was carried out to evaluate the inhibition effect of MCs on PP2A. As shown in Figure 2, all the MCs exhibited inhibition effects on PP2A and showed dose-effect relationships at 1 nM, 10 nM, and 100 nM. The inhibition sequence was MCLR > MCLW > MCLA > MCLF > MCLY. Among the variants, MCLR had a much higher inhibition effect than other MCs. By comparing the amino acid residues at position Z4, it was found that the electropositive Arginine (R) is more hydrophilic than the other four amino acids. When Arg4 was replaced by Trp4/Tyr4/Ala4/Phe4 (with increased hydrophobicity), the corresponding inhibition effect generally decreased. The lower inhibition of MCLY might be attributed to the electronegative OH in the side-chain of Tyr4. Unfortunately, the crystal structures for most MC-PP2A complexes (except for MCLR-PP2A) have not been prepared and solved. It would be difficult to elucidate the relationship between structural differences (changed Z4) and the discrepant inhibition of MCs on PP2A.

2.2. Filtration of the Major Interaction Parameters between MCs and PP2A Based on Homology Modeling

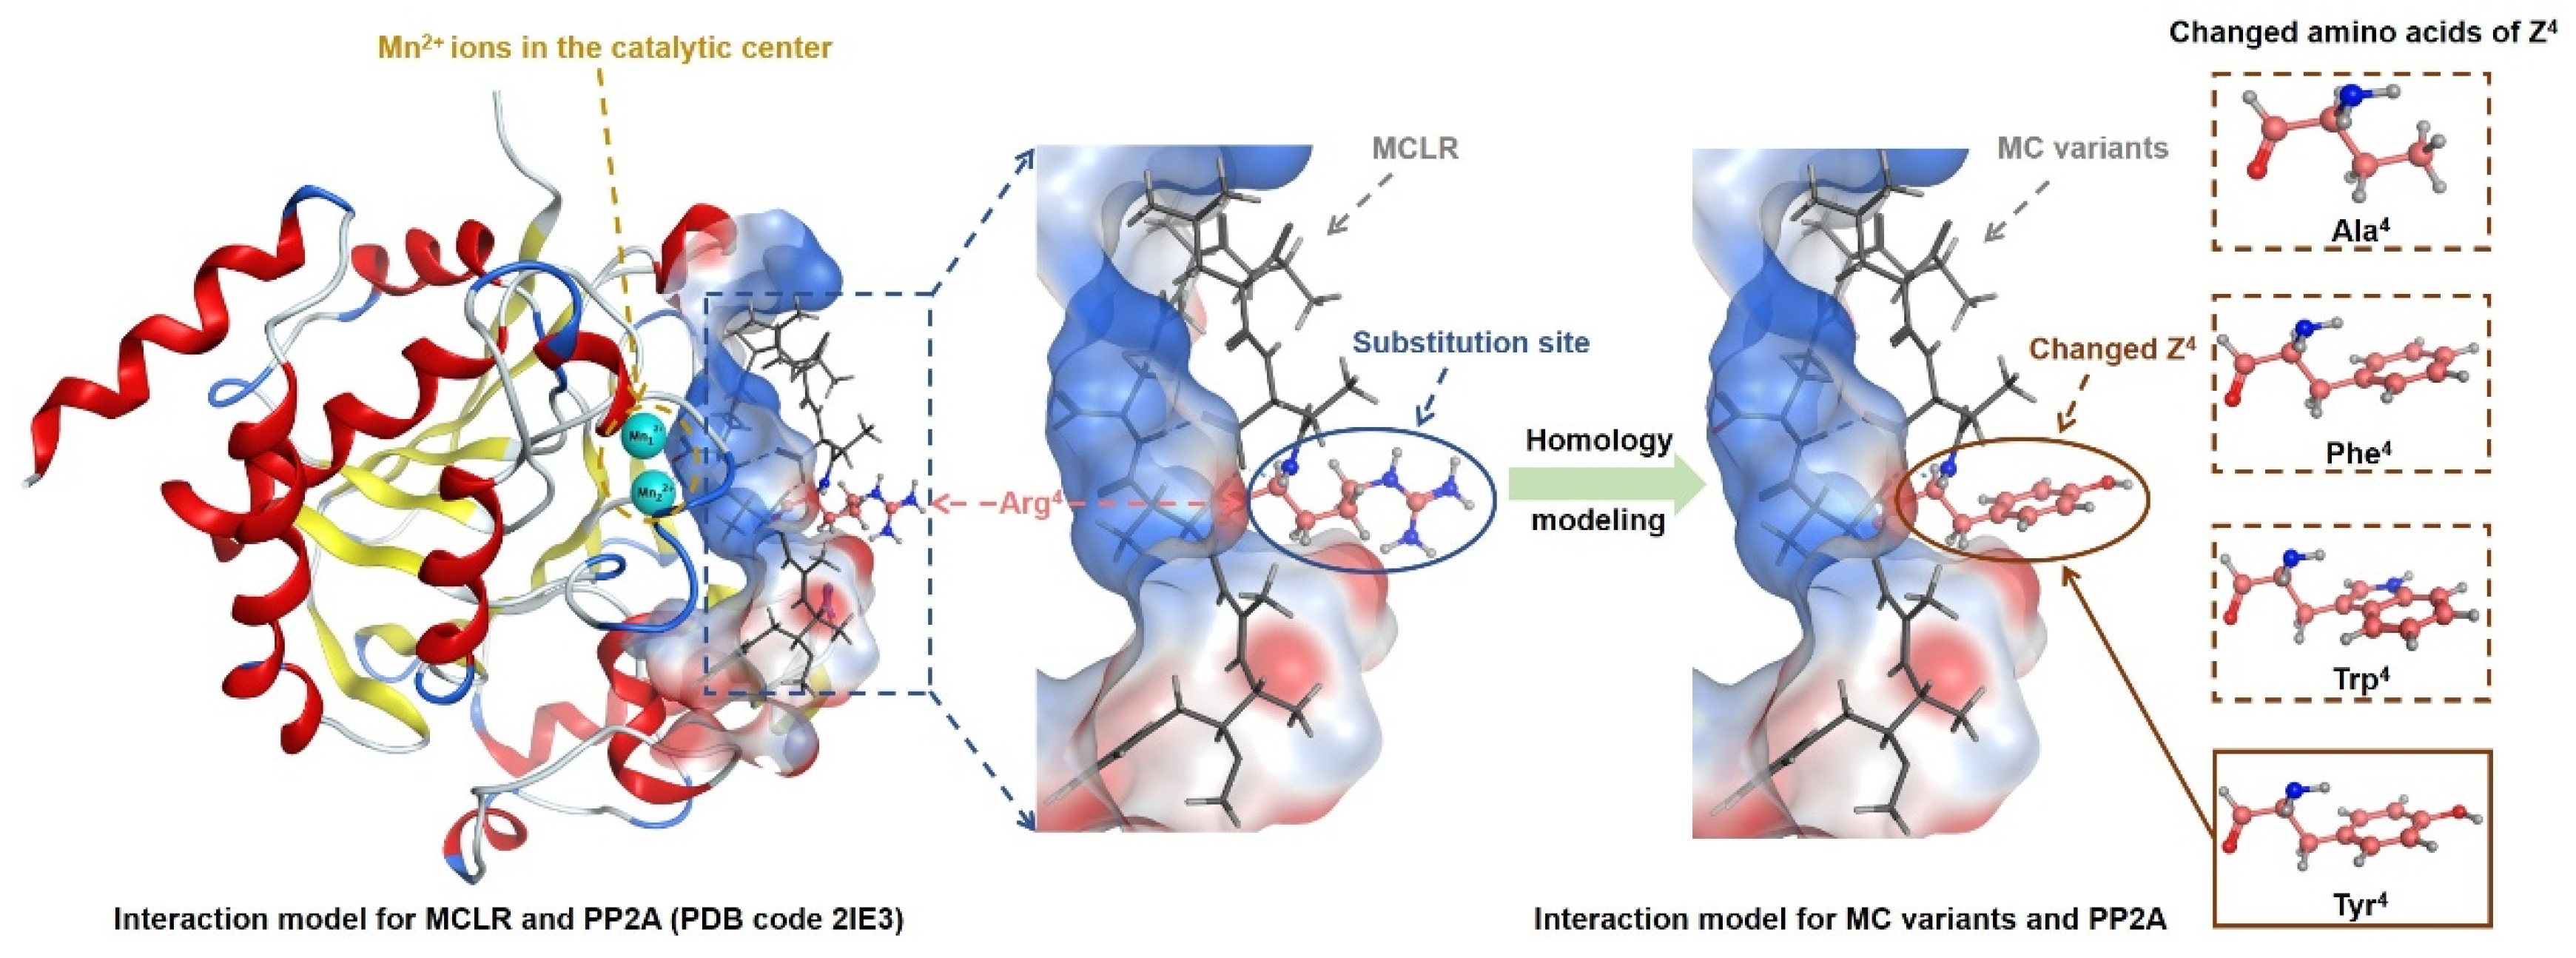
The homology modeling strategy has been widely used to evaluate the interactions between structural analogues and proteins [24,25]. Based on this strategy, the interaction models for typical MCs and PP2A could be obtained by molecular simulation (Figure 3). The model for the MCLR-PP2A complex was revised from a crystal model in Protein Data Bank (PDB code 2IE3). The models for other MC-PP2A complexes were obtained by substituting the Arg4 residue in MCLR with Ala4, Phe4, Trp4, and Tyr4. With the help of molecular docking, the major interaction parameters for MC-PP2A complexes were obtained and are listed in Table S1. The major interaction parameters include the changed energies, combination areas, related surface areas, catalytic center exposure areas, the related hydrogen bonds, ionic bonds, and metal bonds. As PP2A was a type of metalloenzyme and regulated by two Mn2+ ions, the interaction parameters related to the Mn2+ ions were obtained simultaneously. Besides, the basic parameters (logP and logS) for typical MCs were also calculated.

2.3. Pearson Correlation Analysis for Inhibition Data and the Major Interaction Parameters

To evaluate the discrepant inhibition mechanism of MCs on PP2A, the correlation between inhibition data and the major interaction parameters was further evaluated by the Pearson correlation analysis. Regression analysis was not used to avoid deleting valid parameters associated with a few finite amino acid residues.
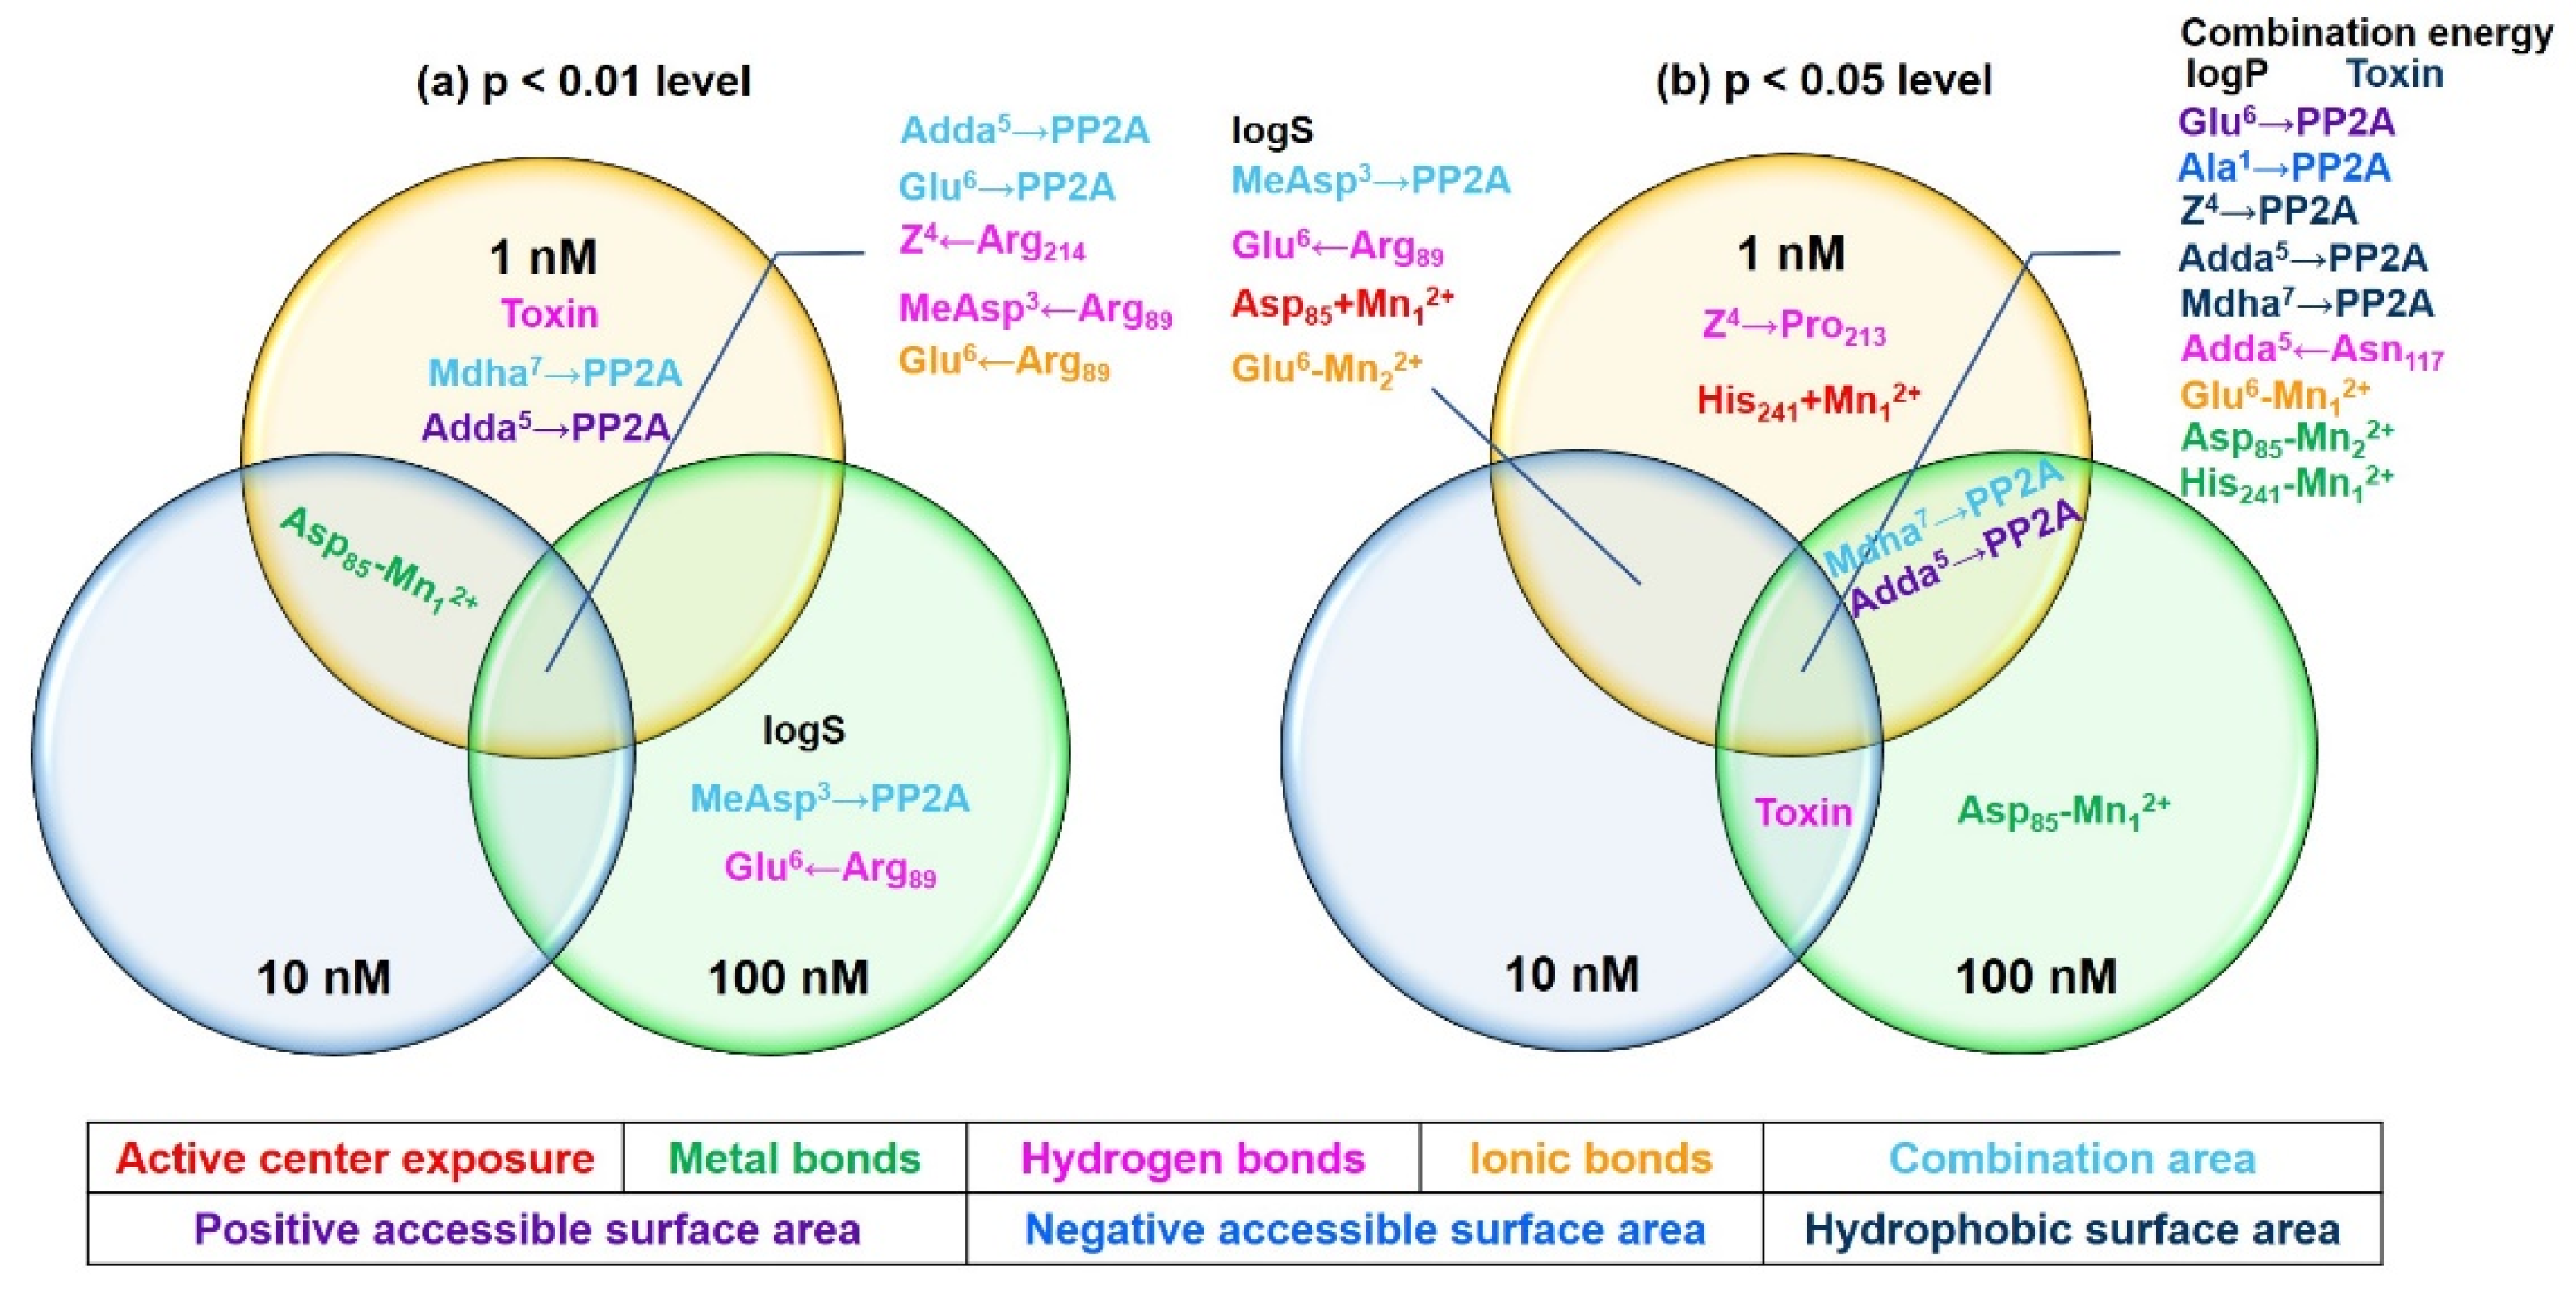
Table 1 shows the major interaction parameters that exhibited diversified correlations with the inhibition effect of the MCs. To filtrate the important interaction parameters, Venn diagrams were drawn (Figure 4). At the p < 0.01 level, the combination areas for Adda5→PP2A and Glu6→PP2A, the hydrogen bonds for Z4←Arg214 and MeAsp3←Arg89, as well as the ionic bond for Glu6←Arg89 were significantly correlated with the inhibition effect at the three test concentrations. The metal bond for Asp85-Mn12+ was significantly correlated with the inhibition effect at 1 nM and 10 nM. Total hydrogen bonds, the combination area for Mdha7→PP2A, and the positive accessible surface area for Adda5→PP2A were significantly correlated with the inhibition effect at 1 nM. LogS, the combination area for MeAsp3→PP2A, and the hydrogen bond for Glu6←Arg89 were significantly correlated with the inhibition effect at 100 nM. At the p < 0.05 level, combination energy change, logP, the hydrophobic surface area for toxin→PP2A, the positive accessible surface area for Glu6→PP2A, the negative accessible surface area for Ala1→PP2A, the hydrophobic surface areas for Adda5→PP2A/Mdha7→PP2A, the hydrogen bond for Adda5←Asn117, the ionic bond for Glu6-Mn12+, the metal bonds for Asp85-Mn22+, His241-Mn12+, and combination energy change were significantly correlated with the inhibition effect at three test concentrations. LogS, the combination area for MeAsp3→PP2A, the negative accessible surface area for MeAsp3→PP2A, the hydrogen bond for Glu6←Arg89, the catalytic center exposure area for Asp85 + Mn12+, and the ionic bond for Glu6-Mn22+ were significantly correlated with the inhibition effect at 1 nM and 10 nM. The combination area for Mdha7→PP2A and the positive accessible surface area for Adda5→PP2A were significantly correlated with the inhibition effect at 1 nM and 100 nM. Total hydrogen bonds were significantly correlated with the inhibition effect at 10 nM and 100 nM. The hydrogen bond for Z4→Pro213 and the catalytic center exposure area for His241 + Mn12+ were significantly correlated with the inhibition effect at 1 nM. The metal bond for Asp85-Mn12+ was significantly correlated with the inhibition effect at 100 nM. Obviously, the above interaction parameters (especially the parameters significantly correlated with the inhibition effect at two or three test concentrations) were important for the combination of the MCs to PP2A.

2.4. Molecular Mechanism Analysis of the Discrepant Inhibition of MCs on PP2A

According to the Pearson correlation analysis, the integral parameters such as total hydrogen bonds (| R | = 0.945), logS (| R | = 0.925), logP (| R | = 0.918), ASA-H for toxin→PP2A (| R | = 0.913), and combination energy change (| R | = 0.890) were highly correlated with the inhibition effect of the MCs. Obviously, logP, logS, and hydrophobic surface area (ASA-H) were associated with the hydrophobicity of MCs. When the hydrophilic Arg4 was substituted with Trp4/Ala4/Phe4/Tyr4, logP and hydrophobic surface areas (ASA-H) for MCs gradually increased, while logS showed a downward trend. In view of this, the hydrophobicity should have an important influence on the combination of MCs to PP2A; the increased hydrophobicity of Z4 would hinder the combination of MCs to PP2A by weakening the total hydrogen bonds (negative correlated with inhibition effect) and by acting on specific important interactions. Statistical frequency analysis of the key sites associated with the important interaction parameters (Figure 5A) showed that Glu6, Mn12+, Adda5, Z4, Ala1, Mn12+, MeAsp3, and Mdha7 participated in the interactions between MCs and PP2A in varying degrees. Combined with the statistical analysis for the total | R | values related to the above sites (Figure 5B), it could be found that the influence of Glu6, Mn12+, and Adda5 was more significant than that of Z4 and other sites. Obviously, the hydrophobicity of Z4 mainly influenced the combination of MCs to PP2A in an indirect way.
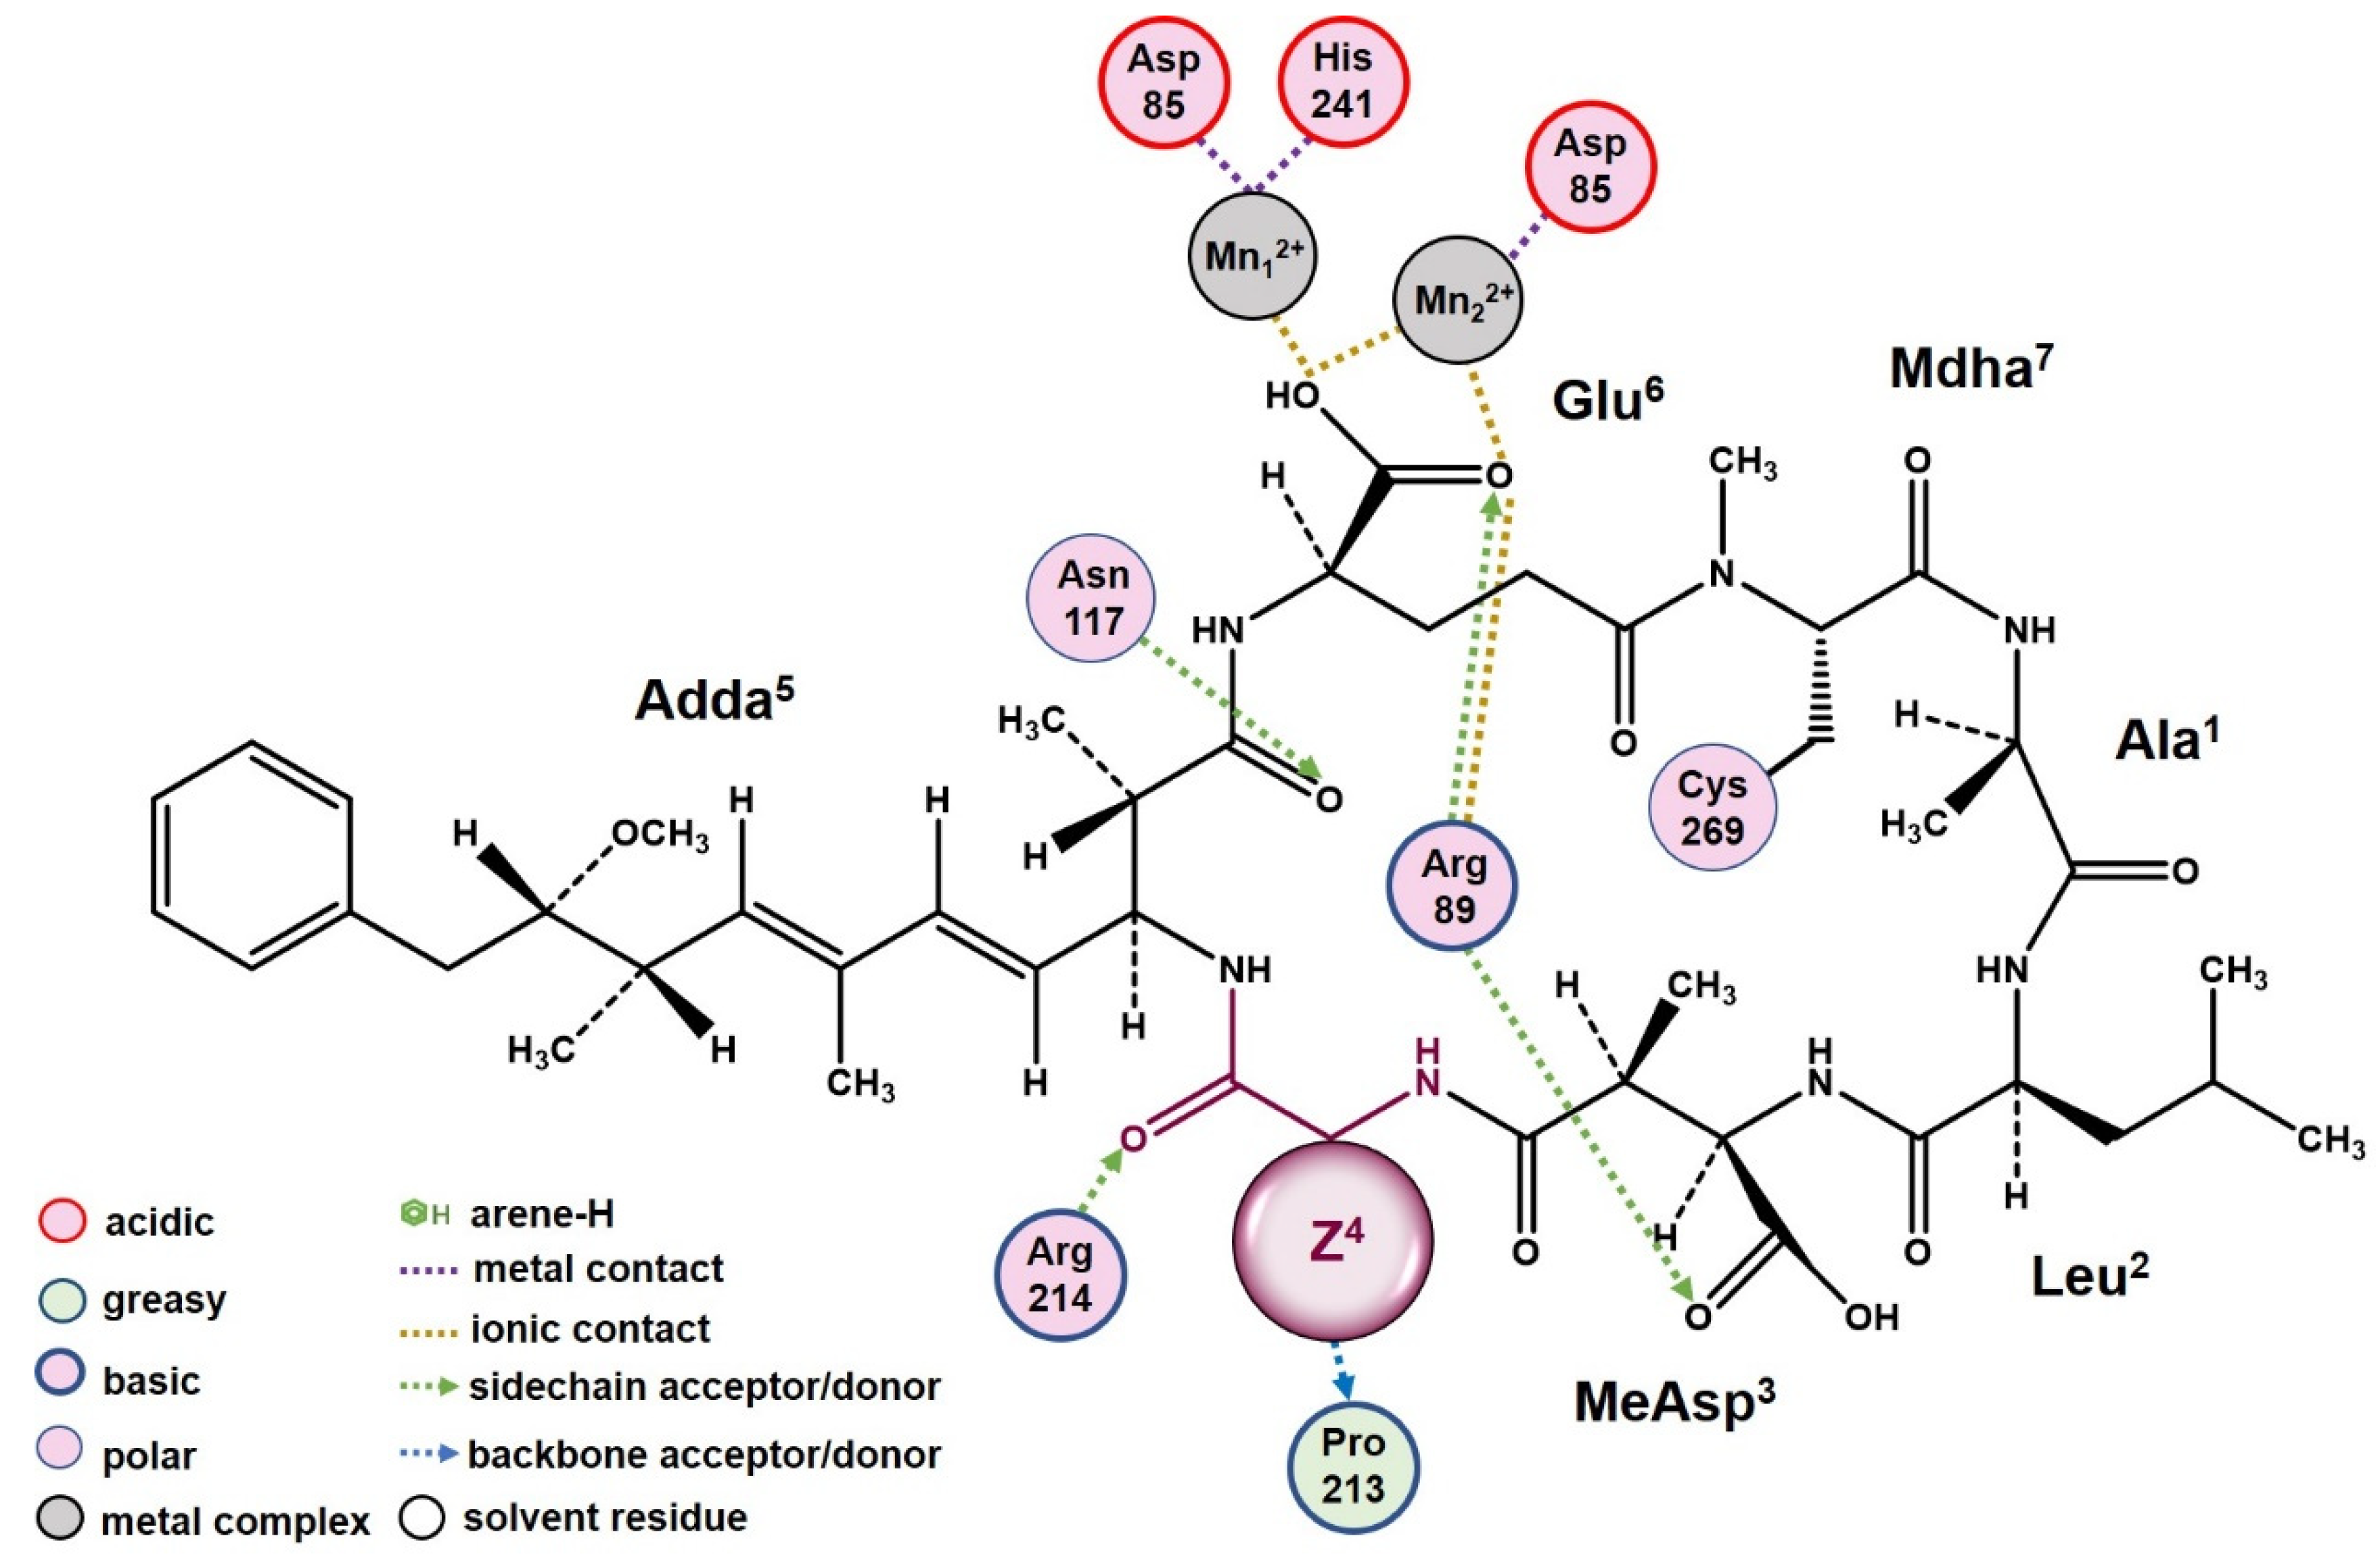
A two-dimensional ligand-receptor interaction diagram for the combination of MCs with PP2A illustrated the key interactions, including hydrogen bonds MeAsp3←Arg89, Z4←Arg214, Z4→Pro213, Adda5←Asn117, and Glu6←Arg89, ionic bonds Glu6←Arg89, Glu6-Mn12+, and Glu6-Mn22+, and metal bonds Asp85-Mn12+, Asp85-Mn22+, and His241-Mn12+ (Figure 6). The Pearson correlation analysis showed the hydrophobicity of Z4 had the most important influence on the interactions of the MCs to PP2A. According to the hydrophobic surface area analysis, with the increased hydrophobicity of Z4, the hydrophobic surface area between Z4 and PP2A increased. The hydrophobic combination of Z4 with PP2A directly weakened hydrogen bonds Z4←Arg214 and Z4→Pro213 to varying degrees. The hydrophobic combination of Z4 with PP2A could intervene the interactions between other residues of MCs and PP2A by weakening the hydrogen bonds Adda5←Asn117 (hydrophobic competition), Glu6←Arg89, MeAsp3←Arg89, and enhancing ionic bonds Glu6←Arg89, Glu6-Mn12+, and Glu6-Mn22+. Correspondingly, the combination areas of MeAsp3, Adda5, and Glu6 with PP2A all decreased. As a result, the combination of the MCs with PP2A was blocked to certain degrees. Subsequently, the interactions between PP2A and the Mn2+ ions in the catalytic center were further affected; the metal bonds Asp85-Mn12+ and Asp85-Mn22+ were weakened, while the metal bond His241-Mn12+ was enhanced. As a result, there was an increase in the exposure area of the catalytic center (especially for Mn12+ ion), resulting in lower inhibition effects of the MCs.

3. Conclusions

To obtain a better understanding of the discrepant inhibition effect of the MCs on PP2A, the five most frequent MCs with the changed Z4 residues (MCLR, LF, LA, LY, and LW) were selected as the typical variants. A protein phosphatase inhibition assay showed that their inhibition effects on PP2A were in the sequence of MCLR > MCLW > MCLA > MCLF > MCLY. With the assistance of molecular modeling, the interaction models for MC-PP2A were constructed by homology modeling, and the major interaction parameters between MCs and PP2A were obtained by molecular docking. The Pearson correlation analysis for the major interaction parameters and inhibition data verified the important influence of the hydrophobicity of Z4 on MC toxicity. The increased hydrophobicity of Z4 directly promoted the hydrophobic combination of Z4 to PP2A and weakened the hydrogen bonds Z4←Arg214 and Z4→Pro213. The hydrophobic combination of Z4 with PP2A could intervene with the interactions between other residues of the MCs and PP2A by weakening the hydrogen bonds MeAsp3←Arg89, Adda5←Asn117, and Glu6←Arg89 and by enhancing the ionic bonds Glu6←Arg89, Glu6-Mn12+ and Glu6-Mn22+. The above key interactions between the MCs and PP2A further influenced the interactions between PP2A and the Mn2+ ions (the metal bonds Asp85-Mn12+ and Asp85-Mn22+ were weakened but the metal bond His241-Mn12+ was enhanced). The eventual result was the increased exposure area of the catalytic center (especially for the Mn12+ ion) and the lower inhibition effect on PP2A.

4. Materials and Methods

4.1. Materials

MCLR, MCLF, MCLA, MCLY, and MCLW were purchased from Sigma (Saint-Quentin Fallavier, France). PP2A was purchased from New England Biolabs Inc (Beverly, MA, USA). Bovine serum albumin, dithiothreitol, MnCl2, P-nitrobenzene disodium orthophosphate, sodium thiosulfate, tris(hydroxymethyl) aminomethane, and other reagents were purchased from Sinopharm (Shanghai, China).

4.2. PP2A Inhibition Assay

The biological toxicity of the typical MCs was evaluated by a colorimetric protein phosphatase inhibition assay modified by Zong et al. [22,23]. First, PP2A was diluted to 5 U/mL with a buffer solution (50 mM Tris-HCl pH 7.4, 2.0 mM dithiothreitol, 1 mM MnCl2) and 1.0 g/L bovine serum albumin. Then, 10 μL of PP2A and 100 μL of test samples were mixed in a 96-well polystyrene microplate. With gentle shaking, the microtiter plates were kept at 25.0 °C for 15 min, and 90 μL p-nitrophenyl disodium orthophosphate (5 mM) was added. After 1 h, the absorbances at 405 nm were measured in a microplate reader. The inhibition of the test samples on PP2A was calculated by the formula of IPP2A (%) = (Acontrol − Asample)/Acontrol × 100%. Acontrol and Asample were the absorbance of the reference sample (without PP2A) and the test sample at 405 nm, respectively.

4.3. Molecular Docking for the Interactions between MCs and PP2A

The molecular docking simulation was performed with MOE software (version 20.09, Cloud Scientific, Shanghai, China). The original model for the MCLR-PP2A complex was obtained from the Protein Data Bank (PDB code 2IE3). Hydrogen atoms and charges were supplemented to PP2A to obtain the revised model. Based on the homology modeling strategy, models for MCLA-PP2A, MCLF-PP2A, MCLY-PP2A, and MCLW-PP2A complexes were obtained by substituting Arg4 (in the revised model of MCLR-PP2A) with Ala4, Phe4, Trp4, and Tyr4, respectively [24,26]. All the models for MC-PP2A complexes were minimized for energy optimization. To ensure the comparability between MCs, “Template dock” mode was used (the options for “Placement” and “Refinement” were set to no change). The specific docking parameters were set as follows: amber 10 EHT, solvation r-field, temperature 25.0°C, pH 7.4, salinity 0.05 M. The major interaction parameters (combination energies, combination areas, related surface areas, catalytic center exposure areas, the hydrogen bonds/ionic bonds/metal bonds for major interaction sites) and basic property parameters (logP/logS) for the MCs were obtained to evaluate the interactions between the MCs and PP2A.

4.4. Statistical Analysis

The Pearson correlation analysis was used to analyze the correlation between the inhibition data and the major interaction parameters by IBM SPSS statistics (version 26.0, Chicago, IL, USA).

Supplementary Materials

The following supporting information can be downloaded at: https://www.mdpi.com/article/10.3390/toxins14060390/s1. All data generated or analyzed during this study are included in this published article and its supplementary information files, Table S1: Main interaction parameters for the complexes of MCs and PP2A.

Author Contributions

Conceptualization, Y.X. and W.Z.; methodology, Y.X. and W.Z.; supervision, H.Y.; writing—original draft, Y.X. and J.C.; writing—review and editing, Y.X. and W.Z. All authors have read and agreed to the published version of the manuscript.

Funding

This work is supported by national natural science foundation of China (21876103).

Institutional Review Board Statement

Not applicable.

Informed Consent Statement

Not applicable.

Data Availability Statement

Not applicable.

Conflicts of Interest

The authors declare no conflict of interest.

References

  1. Pestana, C.J.; Moura, D.S.; Capelo-Neto, J.; Edwards, C.; Dreisbach, D.; Spengler, B.; Lawton, L.A. Potentially Poisonous Plastic Particles: Microplastics as a Vector for Cyanobacterial Toxins Microcystin-LR and Microcystin-LF. Environ. Sci. Technol. 2021, 55, 15940–15949. [Google Scholar] [CrossRef] [PubMed]
  2. Schreidah, C.M.; Ratnayake, K.; Senarath, K.; Karunarathne, A. Microcystins: Biogenesis, Toxicity, Analysis, and Control. Chem. Res. Toxicol. 2020, 33, 2225–2246. [Google Scholar] [CrossRef] [PubMed]
  3. Puerto, M.; Pichardo, S.; Jos, A.; Camean, A.M. Comparison of the toxicity induced by microcystin-RR and microcystin-YR in differentiated and undifferentiated Caco-2 cells. Toxicon 2009, 54, 161–169. [Google Scholar] [CrossRef] [PubMed]
  4. Sedan, D.; Andrinolo, D.; Telese, L.; Giannuzzi, L.; de Alaniz, M.J.; Marra, C.A. Alteration and recovery of the antioxidant system induced by sub-chronic exposure to microcystin-LR in mice: Its relation to liver lipid composition. Toxicon 2010, 55, 333–342. [Google Scholar] [CrossRef] [PubMed]
  5. Takai, A.; Eto, M.; Hirano, K.; Takeya, K.; Wakimoto, T.; Watanabe, M. Protein phosphatases 1 and 2A and their naturally occurring inhibitors: Current topics in smooth muscle physiology and chemical biology. J. Physiol. Sci. 2018, 68, 1–17. [Google Scholar] [CrossRef] [PubMed] [Green Version]
  6. Nasa, I.; Rusin, S.F.; Kettenbach, A.N.; Moorhead, G.B. Aurora B opposes PP1 function in mitosis by phosphorylating the conserved PP1-binding RVxF motif in PP1 regulatory proteins. Sci. Signal. 2018, 11. [Google Scholar] [CrossRef] [Green Version]
  7. Campos, A.; Vasconcelos, V. Molecular mechanisms of microcystin toxicity in animal cells. Int. J. Mol. Sci. 2010, 11, 268–287. [Google Scholar] [CrossRef] [Green Version]
  8. Zaidi, H.; Amrani, A.; Sedrati, F.; Maaref, H.; Leghrib, F.; Benamara, M.; Amara, H.; Wang, Z.; Nasri, H. Histological and chemical damage induced by microcystin-LR and microcystin-RR on land snail Helix aspersa tissues after acute exposure. Comp. Biochem. Physiol. C Toxicol. Pharmacol. 2021, 245, 109031. [Google Scholar] [CrossRef]
  9. Jayaraj, R.; Deb, U.; Bhaskar, A.S.; Prasad, G.B.; Rao, P.V. Hepatoprotective efficacy of certain flavonoids against microcystin induced toxicity in mice. Environ. Toxicol. 2007, 22, 472–479. [Google Scholar] [CrossRef]
  10. Chen, G.; Zheng, Z.; Bai, M.; Li, Q. Chronic effects of microcystin-LR at environmental relevant concentrations on photosynthesis of Typha angustifolia Linn. Ecotoxicology 2020, 29, 514–523. [Google Scholar] [CrossRef]
  11. Torres, M.A.; Micheletto, J.; de Liz, M.V.; Pagioro, T.A.; Rocha Martins, L.R.; Martins de Freitas, A. Microcystis aeruginosa inactivation and microcystin-LR degradation by the photo-Fenton process at the initial near-neutral pH. Photochem. Photobiol. Sci. 2020, 19, 1470–1477. [Google Scholar] [CrossRef] [PubMed]
  12. Gadgil, A. Drinking water in developing countries. Annu. Rev. Energy Environ. 1998, 23, 253–286. [Google Scholar] [CrossRef] [Green Version]
  13. de Figueiredo, D.R.; Azeiteiro, U.M.; Esteves, S.M.; Goncalves, F.J.; Pereira, M.J. Microcystin-producing blooms--a serious global public health issue. Ecotoxicol. Environ. Saf. 2004, 59, 151–163. [Google Scholar] [CrossRef] [PubMed]
  14. Maynes, J.T.; Perreault, K.R.; Cherney, M.M.; Luu, H.A.; James, M.N.; Holmes, C.F. Crystal structure and mutagenesis of a protein phosphatase-1:calcineurin hybrid elucidate the role of the beta12-beta13 loop in inhibitor binding. J. Biol. Chem. 2004, 279, 43198–43206. [Google Scholar] [CrossRef] [Green Version]
  15. Liu, J.; Sun, Y. The role of PP2A-associated proteins and signal pathways in microcystin-LR toxicity. Toxicol. Lett. 2015, 236, 1–7. [Google Scholar] [CrossRef]
  16. Parker, C.H.; Stutts, W.L.; DeGrasse, S.L. Development and Validation of a Liquid Chromatography-Tandem Mass Spectrometry Method for the Quantitation of Microcystins in Blue-Green Algal Dietary Supplements. J. Agric. Food Chem. 2015, 63, 10303–10312. [Google Scholar] [CrossRef]
  17. Pichardo, S.; Jos, A.; Zurita, J.L.; Salguero, M.; Camean, A.M.; Repetto, G. Acute and subacute toxic effects produced by microcystin-YR on the fish cell lines RTG-2 and PLHC-1. Toxicol. In Vitro 2007, 21, 1460–1467. [Google Scholar] [CrossRef]
  18. Wang, Q.; Wang, X.; Zhang, S.; Zong, W. Molecular mechanism for the discrepant inhibition of microcystins on protein phosphatase 1. Environ. Sci. Pollut. Res. 2019, 26, 21774–21783. [Google Scholar] [CrossRef]
  19. Zhang, Z.; Yang, M.; Yi, J.; Zhu, Q.; Huang, C.; Chen, Y.; Li, J.; Yang, B.; Zhao, X. Comprehensive Insights into the Interactions of Two Emerging Bromophenolic DBPs with Human Serum Albumin by Multispectroscopy and Molecular Docking. ACS Omega 2019, 4, 563–572. [Google Scholar] [CrossRef]
  20. Khan, S.N.; Islam, B.; Yennamalli, R.; Sultan, A.; Subbarao, N.; Khan, A.U. Interaction of mitoxantrone with human serum albumin: Spectroscopic and molecular modeling studies. Eur. J. Pharm. Sci. 2008, 35, 371–382. [Google Scholar] [CrossRef]
  21. Das, S.; Bora, N.; Rohman, M.A.; Sharma, R.; Jha, A.N.; Singha Roy, A. Molecular recognition of bio-active flavonoids quercetin and rutin by bovine hemoglobin: An overview of the binding mechanism, thermodynamics and structural aspects through multi-spectroscopic and molecular dynamics simulation studies. Phys. Chem. Chem. Phys. 2018, 20, 21668–21684. [Google Scholar] [CrossRef] [PubMed]
  22. Zong, W.; Sun, F.; Pei, H.; Hu, W.; Pei, R. Microcystin-associated disinfection by-products: The real and non-negligible risk to drinking water subject to chlorination. Chem. Eng. J. 2015, 279, 498–506. [Google Scholar] [CrossRef]
  23. Zong, W.; Wang, Q.; Zhang, S.; Teng, Y.; Du, Y. Regulation on the toxicity of microcystin-LR target to protein phosphatase 1 by biotransformation pathway: Effectiveness and mechanism. Environ. Sci. Pollut. Res. Int. 2018, 25, 26020–26029. [Google Scholar] [CrossRef] [PubMed]
  24. Chen, H.; Fu, W.; Wang, Z.; Wang, X.; Lei, T.; Zhu, F.; Li, D.; Chang, S.; Xu, L.; Hou, T. Reliability of Docking-Based Virtual Screening for GPCR Ligands with Homology Modeled Structures: A Case Study of the Angiotensin II Type I Receptor. ACS Chem. Neurosci. 2019, 10, 677–689. [Google Scholar] [CrossRef] [PubMed]
  25. Wiltgen, M.; Tilz, G.P. Homology modelling: A review about the method on hand of the diabetic antigen GAD 65 structure prediction. Wien. Med. Wochenschr. 2009, 159, 112–125. [Google Scholar] [CrossRef]
  26. Loo, J.S.E.; Emtage, A.L.; Ng, K.W.; Yong, A.S.J.; Doughty, S.W. Assessing GPCR homology models constructed from templates of various transmembrane sequence identities: Binding mode prediction and docking enrichment. J. Mol. Graph. Model. 2018, 80, 38–47. [Google Scholar] [CrossRef]
Figure 1. Chemical structures of MCs with varying amino acids at position Z4. Conditions: The blue and brown lines are connected to MeAsp3 and Adda5, respectively.
Toxins 14 00390 g001
Figure 2. The inhibition effect of routinely detected MCs on PP2A at 1 nM, 10 nM, and 100 nM with its standard deviation (n = 3).
Toxins 14 00390 g002
Figure 3. Illustration for the model construction of MC-PP2A complexes (with no PDB models) based on the homology modeling strategy.
Toxins 14 00390 g003
Figure 4. Venn diagrams of the important interaction parameters at the p < 0.01 level (a) and the p < 0.05 level (b). Different colors represent different kinds of interaction parameters. Condition: Toxin is different kinds of integral parameters.
Toxins 14 00390 g004
Figure 5. Pie charts for the statistical frequency (A) and the total | R | values (B) related to the key interaction sites. Conditions: R is the average of Pearson correlations at three toxin concentrations.
Toxins 14 00390 g005
Figure 6. The 2D ligand-receptor interaction diagram for the combination of the MCs with PP2A.
Toxins 14 00390 g006
Table 1. Pearson correlation analysis of the inhibition data and the major interaction parameters.
Correlation Analysis Data aCombination Energy (KJ/Mol)Combination Area (Å2)
TotalAla1→PP2ALeu2→PP2AMeAsp3→PP2AZ4→PP2AAdda5→PP2AGlu6→PP2AMdha7→PP2A
1 nM bR (p)−0.892 * (0.042)0.346 (0.569)−0.392 (0.514)−0.341 (0.574)0.902 * (0.037)0.282 (0.646)0.978 ** (0.004)0.979 ** (0.004)0.978 ** (0.004)
10 nM bR (p)−0.890 * (0.043)0.464 (0. 431)−0.438 (0. 461)−0.254 (0.680)0.951 * (0.013)0.413 (0.490)0.994 ** (0.001)0.996 ** (0.000)0.956 * (0.011)
100 nM bR (p)−0.888 * (0.044)0.523 (0.365)−0.538 (0.350)−0.172 (0.782)0.982 ** (0.003)0.492 (0.400)0.980 ** (0.003)0.979 ** (0.004)0.910 * (0.032)
Correlation Analysis Data alogP (o/w)Positive accessible surface area (Å2)
TotalAla1→PP2ALeu2→PP2AMeAsp3→PP2AZ4→PP2AAdda5→PP2AGlu6→PP2AMdha7→PP2A
1 nMR (p)−0.929 * (0.023)0.456 (0.440)−0.765 (0.132)−0.652 (0.233)0.125 (0.841)0.177 (0.775)0.888 ** (0.044)0.910 * (0.032)−0.386 (0.521)
10 nMR (p)−0.936 * (0.019)0.581 (0.305)−0.712 (0.177)−0.560 (0.326)0.245 (0.691)0.321 (0.598)0.905 * (0.034)0.922 * (0.026)−0.410 (0.494)
100 nMR (p)−0.888 * (0.044)0.660 (0.226)−0.593 (0.292)−0.419 (0.483)0.345 (0.570)0.424 (0.477)0.900 * (0.037)0.886 * (0.046)−0.345 (0.569)
Correlation Analysis Data alogSNegative accessible surface area (Å2)
TotalAla1→PP2ALeu2→PP2AMeAsp3→PP2AZ4→PP2AAdda5→PP2AGlu6→PP2AMdha7→PP2A
1 nMR (p)0.884 * (0.046)0.388 (0.519)0.882 * (0.048)−0.548 (0.339)0.394 (0.512)0.466 (0.429)0.378 (0.530)0.474 (0.419)−0.140 (0.822)
10 nMR (p)0.925 * (0.025)0.512 (0. 378)0.892 * (0.042)−0.607 (0.278)0.324 (0.595)0.560 (0.326)0.390 (0.516)0.378 (0.531)−0.225 (0.716)
100 nMR (p)0.966 ** (0.008)0.585 (0.300)0.915 * (0.029)−0.707 (0.182)0.179 (0.773)0.583 (0.302)0.429 (0.471)0.303 (0.620)−0.365 (0.546)
Correlation Analysis Data aHydrophobic surface area (Å2)
TotalAla1→PP2ALeu2→PP2AMeAsp3→PP2AZ4→PP2AAdda5→PP2AGlu6→PP2AMdha7→PP2A
1 nMR (p)−0.929 * (0.022)−0.087 (0.889)0.590 (0.295)−0.763 (0.134)−0.900 * (0.038)0.924 * (0.025)0.564 (0.322)0.934 * (0.020)
10 nMR (p)−0.920 * (0.027)−0.033 (0.958)0.607 (0.277)−0.734 (0.158)−0.938 * (0.018)0.953 * (0.012)0.645 (0.240)0.923 * (0.026)
100 nMR (p)−0.889 * (0.044)0.063 (0.920)0.546 (0.341)−0.730 (0.161)−0.932 * (0.021)0.953 * (0.012)0.757 (0.138)0.891 * (0.042)
Correlation Analysis Data aHydrogen bonds (KJ/Mol)
TotalZ4→Pro213Ala1←Arg268Leu2←Arg89MeAsp3←Arg89Z4←Arg214Adda5←His118Glu6←Arg89Mdha7←Arg268
1 nMR (p)−0.980 ** (0.003)−0.893 * (0.041)−0.244 (0.693)−0.780 (0.119)−0.977 ** (0.004)−0.995 ** (0.000)0.216 (0.727)−0.880 * (0.049)−0.020 (0.975)
10 nMR (p)−0.953 * (0.012)−0.841 (0.074)−0.372 (0.537)−0.798 (0.106)−0.993 ** (0.001)−0.995 ** (0.000)0.284 (0.643)−0.938 * (0.018)0.128 (0.837)
100 nMR (p)−0.901 * (0.037)−0.764 (0.133)−0.521 (0.368)−0.777 (0.122)−0.991 ** (0.001)−0.971 ** (0.006)0.319 (0.600)−0.984 ** (0.002)0.296 (0.628)
Correlation Analysis Data aHydrogen bondMetal bonds (KJ/Mol)
Adda5←Asn117TotalGlu6-Mn12+Glu6-Mn22+Asp57-Mn12+Asp57-Mn22+Asp85-Mn12+Asp85-Mn22+His241-Mn12+
1 nMR (p)−0.904 * (0.035)−0.519 (0.371)0.517 (0.372)0.731 (0.161)0.742 (0.151)−0.850 (0.068)−0.985 ** (0.002)−0.935 * (0.020)0.926 * (0.024)
10 nMR (p)−0.946 * (0.015)−0.571 (0.314)0.400 (0.505)0.621 (0.264)0.792 (0.110)−0.796 (0.107)−0.964 ** (0.008)−0.937 * (0.019)0.956 * (0.011)
100 nMR (p)−0.959 * (0.001)−0.669 (0.217)0.287 (0.640)−0.480 (0.414)0.773 (0.126)−0.688 (0.199)−0.904 * (0.035)−0.894 * (0.041)0.936 * (0.019)
Correlation Analysis Data aIonic bonds (KJ/Mol)
TotalLeu2←Arg89MeAsp3←Arg89Glu6←Arg89Glu6-Mn12+Glu6-Mn22+ (c)Asp57-Mn12+Asp57-Mn22+Asp85-Mn12+
1 nMR (p)0.794 (0.108)0.301 (0.623)−0.171 (0.784)0.989 ** (0.001)0.914 * (0.030)0.955 * (0.012)0.665 (0.221)0.622 (0.262)0.445 (0.452)
10 nMR (p)0.735 (0.157)0.293 (0.633)−0.017 (0.978)0.994 ** (0.001)0.928 * (0.023)0.904 * (0.035)0.773 (0.125)0.549 (0.338)0.325 (0.593)
100 nMR (p)0.660 (0.225)0.246 (0.690)0.146 (0.815)0.964 ** (0.008)0.886 * (0.046)0.817 (0.091)0.858 (0.063)0.470 (0.424)0.177 (0.776)
Correlation Analysis Data aIonic bondActive center exposure (Å2)
Asp85-Mn22+Asn117 + Mn12+Asp85 + Mn12+Asp57 + Mn12+His241 + Mn12+Asp85 + Mn22+Asp57 + Mn22+
1 nMR (p)−0.171 (0.784)0.874 (0.053)−0.955 * (0.011)−0.787 (0.114)−0.885 * (0.046)−0.735 (0.157)−0.628 (0.257)
10 nMR (p)−0.017 (0.978)0.819 (0.090)−0.957 * (0.010)−0.786 (0.115)−0.878 (0.050)−0.759 (0.137)−0.658 (0.228)
100 nMR (p)0.146 (0.815)−0.739 (0.154)−0.809 (0.097)−0.724 (0.166)−0.629 (0.255)−0.724 (0.166)−0.629 (0.255)
a: Sample size n=15; b: The inhibition effect of MCs at three test concentrations; c: Glu6-Mn22+ is the interactions between carbonyl O/hydroxyl O of Glu6 and Mn22+, respectively; logP (o/w) is the Log octanol/water partition coefficient; logS is the water solubility parameter; R is the Pearson correlation between inhibition data and the major interaction parameters; p is the 2-tailed significance of the related data; ** means significant at the 0.01 level; * means significant at the 0.05 level.
Publisher’s Note: MDPI stays neutral with regard to jurisdictional claims in published maps and institutional affiliations.